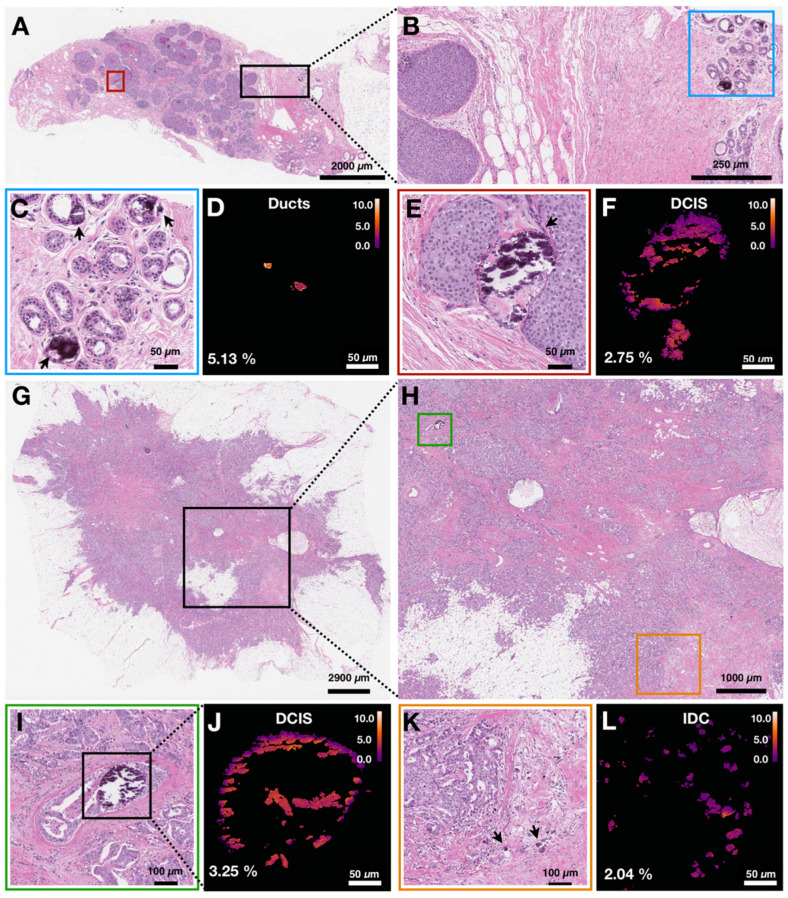
Figure 5.
Carbonate content in calcifications varies within individual patient samples. Arrows are used to identify calcifications. A) H&E of breast biopsy core with red box highlighting DCIS ducts and black box highlighting normal ducts in close proximity to DCIS lesion edge. B) H&E close up of area highlighted in black box in A. Blue box highlights normal ducts. C, D) H&E close up and carbonate content map, respectively, of normal ducts highlighted in B. Arrows point to calcifications. E, F) H&E close up and carbonate content map, respectively, of ducts containing DCIS with associated calcifications highlighted in A. G) H&E of breast tissue resection with black box highlighting an area of DCIS admixed with IDC. H) H&E close up of area highlighted in black box (see G). Green box highlights a duct containing DCIS with associated calcifications. Orange box highlights IDC with associated calcifications. I, J) H&E close up and carbonate content map, respectively, of ducts containing DCIS with associated calcifications highlighted in H. K, L) H&E close up and carbonate content map, respectively, of IDC with associated calcifications highlighted in H.

