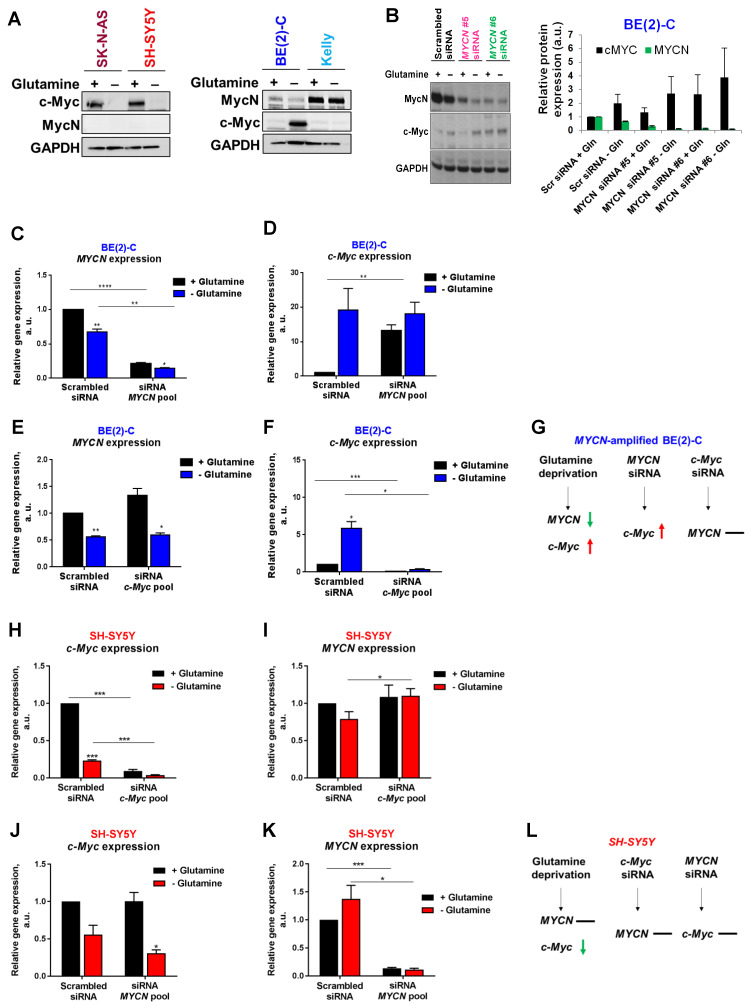
Figure 2.
Interplay between Myc member expression in neuroblastoma cells upon glutamine deprivation. (A) Western blot analysis of Myc member expression in neuroblastoma cells cultured 24 h with or without glutamine. GAPDH was used as a loading control. (B) Analysis of MycN and c-Myc levels by western blotting in BE(2)-C cells following MYCN downregulation upon glutamine deprivation. GAPDH was used as a loading control. Graph showing the quantitative analysis of relative MycN and c-Myc protein expression after normalizing to GAPDH. (n = 4; ± S.E.M). (C, D) Relative mRNA expression of (C) MYCN and (D) c-MYC following MYCN downregulation upon glutamine deprivation in BE(2)-C cells. (E, F) Relative mRNA expression of (E) MYCN and (F) c-MYC following c-MYC downregulation upon glutamine deprivation in BE(2)-C cells. (G) Schematic representation of the effect of glutamine deprivation, MYCN or c-MYC siRNA on mRNA MYC member expression level in BE(2)-C cells. (H, I) Relative mRNA expression of (H) c-MYC and (I) MYCN following c-MYC downregulation upon glutamine deprivation in SH-SY5Y cells. (J, K) Relative mRNA expression of (J) c-MYC and (K) MYCN following MYCN downregulation upon glutamine deprivation in SH-SY5Y cells. (L) Schematic representation of the effect of glutamine deprivation, MYCN or c-MYC siRNA on mRNA MYC member expression level in SH-SY5Y cells. (n ≥ 3; ± S.E.M; *p < 0.05; **p < 0.01; ***p < 0.001).

