Abstract
Diacylglycerol O-acyltransferase-1 (DGAT1) synthesizes triacylglycerides and is required for dietary fat absorption and fat storage in humans1. DGAT1 belongs to the superfamily of membrane-bound O-acyltransferases (MBOAT) that are found in all kingdoms of life and involved in acylation of lipids and proteins2,3. It remains unclear how human DGAT1 (hDGAT1) or other mammalian members of the MBOAT family recognize their substrates and catalyze their reactions. The absence of three-dimensional structures also hampers rational targeting of hDGAT1 for therapeutic purposes. Here we present the structure of hDGAT1 in complex with a substrate oleoyl Coenzyme A solved by cryo-electron microscopy. Each hDGAT1 protomer has nine transmembrane helices and eight of which form a conserved structural fold that we define as the MBOAT fold. The MBOAT fold in hDGAT1 carves out a hollow chamber in the membrane that encloses highly conserved catalytic residues. The chamber has separate entrances for the two substrates fatty acyl Coenzyme A and diacylglycerol. hDGAT1 can exist as either a homodimer or homotetramer and the two forms have similar enzymatic activity. The N-terminus of hDGAT1 interacts with the neighboring protomer and these interactions are required for the enzymatic activity.
Introduction
Diacylglycerol O-acyltransferase-1 (DGAT1, EC 2.3.1.20) is an integral membrane protein that synthesizes triacylglycerides (TG) from two substrates, diacylglycerol (DAG) and fatty acyl Coenzyme A (acyl-CoA) (Extended Data Fig. 1)1. In humans, hDGAT1 is highly expressed in epithelial cells of the small intestine and its activity is essential for dietary fat absorption4. hDGAT1 is also found in the liver where it synthesizes fat for storage5,6 and in female mammary glands where it produces fat in the milk7. Dgat1−/− mice are viable and show significantly reduced TG in all tissues and resistance to obesity when kept on a high-fat diet8,9. These results have generated considerable interest in targeting hDGAT1 for treating hypertriglyceridemia and fatty liver disease10.
DGAT1 belongs to a large superfamily of membrane-bound O-acyl transferases (MBOAT, http://pfam.xfam.org/family/MBOAT) that are found in all kingdoms of life. In mammals, MBOAT family includes enzymes that modify lipids or proteins such as acyl-CoA:cholesterol acyltransferase (ACAT)2 and protein-serine O-palmitoleoyltransferase (PORCUPINE)3. Members of the MBOAT family have a highly conserved histidine residue required for the transferase activity and are predicted to have eight to eleven transmembrane segments2,11,12. Crystal structure of a bacterial member of MBOAT, DltB, was reported recently (Extended Data Fig. 1)13. However, the structure of DltB may not be a suitable model for hDGAT1 because of their low sequence identity (~20%).
In vitro activity of purified hDGAT1
Full-length hDGAT1 was over-expressed and purified. hDGAT1 purified in the detergent lauryl maltose neopentyl glycol (LMNG) forms a stable dimer that is partially resistant to denaturing conditions of an SDS-PAGE (Extended Data Fig. 2a, and Methods). When hDGAT1 was purified with a milder detergent glyco-diosgenin (GDN), substantially higher fraction of hDGAT1 was in the tetrameric form. Both the dimeric and tetrameric forms of hDGAT1 seem stable in terms of their oligomeric state (Extended Data Fig. 2b). DGAT1 from plants and mammals were previously shown to form either a dimer or tetramer11,14,15, however, it remains unclear whether the oligomeric state has an impact on enzymatic functions.
We established an in vitro functional assay to measure hDGAT1 activity (Extended Data Fig. 2d–f and Methods). The initial rate of the enzymatic reaction in different concentrations of oleoyl-CoA can be fit with a Michaelis Menten equation for both the dimeric and tetrameric hDGAT1 (Extended Data Fig. 2g and Extended Data Table 2). The two forms of hDGAT1 have similar Vmax and KM and the Vmax values are equivalent to a turnover rate of ~1 molecule/second for each hDGAT1 protomer. We also measured the activity of hDGAT1 in cell membranes and found that the Vmax is modestly higher than that of hDGAT1s in detergent while the KM is similar (Extended Data Fig 2h and Extended Data Table 2). Both the Vmax and KM values reported here are comparable to those previously reported of hDGAT1 in microsomes16. Enzymatic activity was also measured in different concentrations of DAG for both the dimeric and tetrameric hDGAT1 and the two forms show similar activity (Extended Data Fig. 2i and Extended Data Table 2). Interestingly both data sets were better fit with an allosteric sigmoidal equation (Methods), suggesting a potential regulatory role of DAG on hDGAT1.
Overall structure of hDGAT1
hDGAT1 structure was solved by single-particle cryo-electron microscopy (cryo-EM) (Extended Data Fig. 3a–e, Methods). A density map was reconstructed to an overall resolution of 3.1 Å with an imposed C2 symmetry. Resolution for helices close to the core of the dimer reaches 2.7 Å while regions close to the peripheral of the dimer have lower resolution likely due to their relatively higher mobility (Extended Data Fig. 3f).
The density map is of sufficient quality to allow de novo building of residues 64 to 224 and 239 to 481, which include all the transmembrane helices, one oleoyl-CoA, and 5 partially resolved lipid/detergent molecules, and the structure was refined to proper geometry (Extended Data Fig. 4a–c and Extended Data Table 1). The first 63 and the last 5 residues, and residues 225–238 which is part of a cytosolic loop, were not resolved. Residues 112 to 120, which is part of a luminal loop, were partially resolved and built as poly-alanines.
hDGAT1 dimer has a dimension of ~105 by 55 by 48 Å and is shaped like a canoe (Fig. 1a–d). Based on the positive-inside rule17, the N-terminus of hDGAT1 resides at the cytosolic side (Extended Data Fig. 4d). This assignment is also consistent with the previous consensus based on biochemical studies11,18 and allows for unambiguous placement of the C-terminus to the lumen side of the ER (Fig. 1e, f). Each hDGAT1 protomer has nine transmembrane helices, TM1–9, and three long loops, i.e., an ER luminal (extracellular) loop EL1 between TM1 and 2, an intracellular loop IL1 between TM4 and 5, and a second intracellular loop IL2 between TM6 and 7. In each protomer, TM2–9 and the two intracellular loops IL1 and 2 form a distinctive structural fold that we define as the MBOAT fold (Fig. 1e, f and 2a–d). TM1, which is not part of the MBOAT fold, is isolated and linked to the MBOAT fold by the long ER luminal loop EL1 (residues 110 to 125). EL1 is partially structured and extends ~35 Å along the luminal side of the protein (Fig. 1e, f).
Figure 1. Structure of hDGAT1.
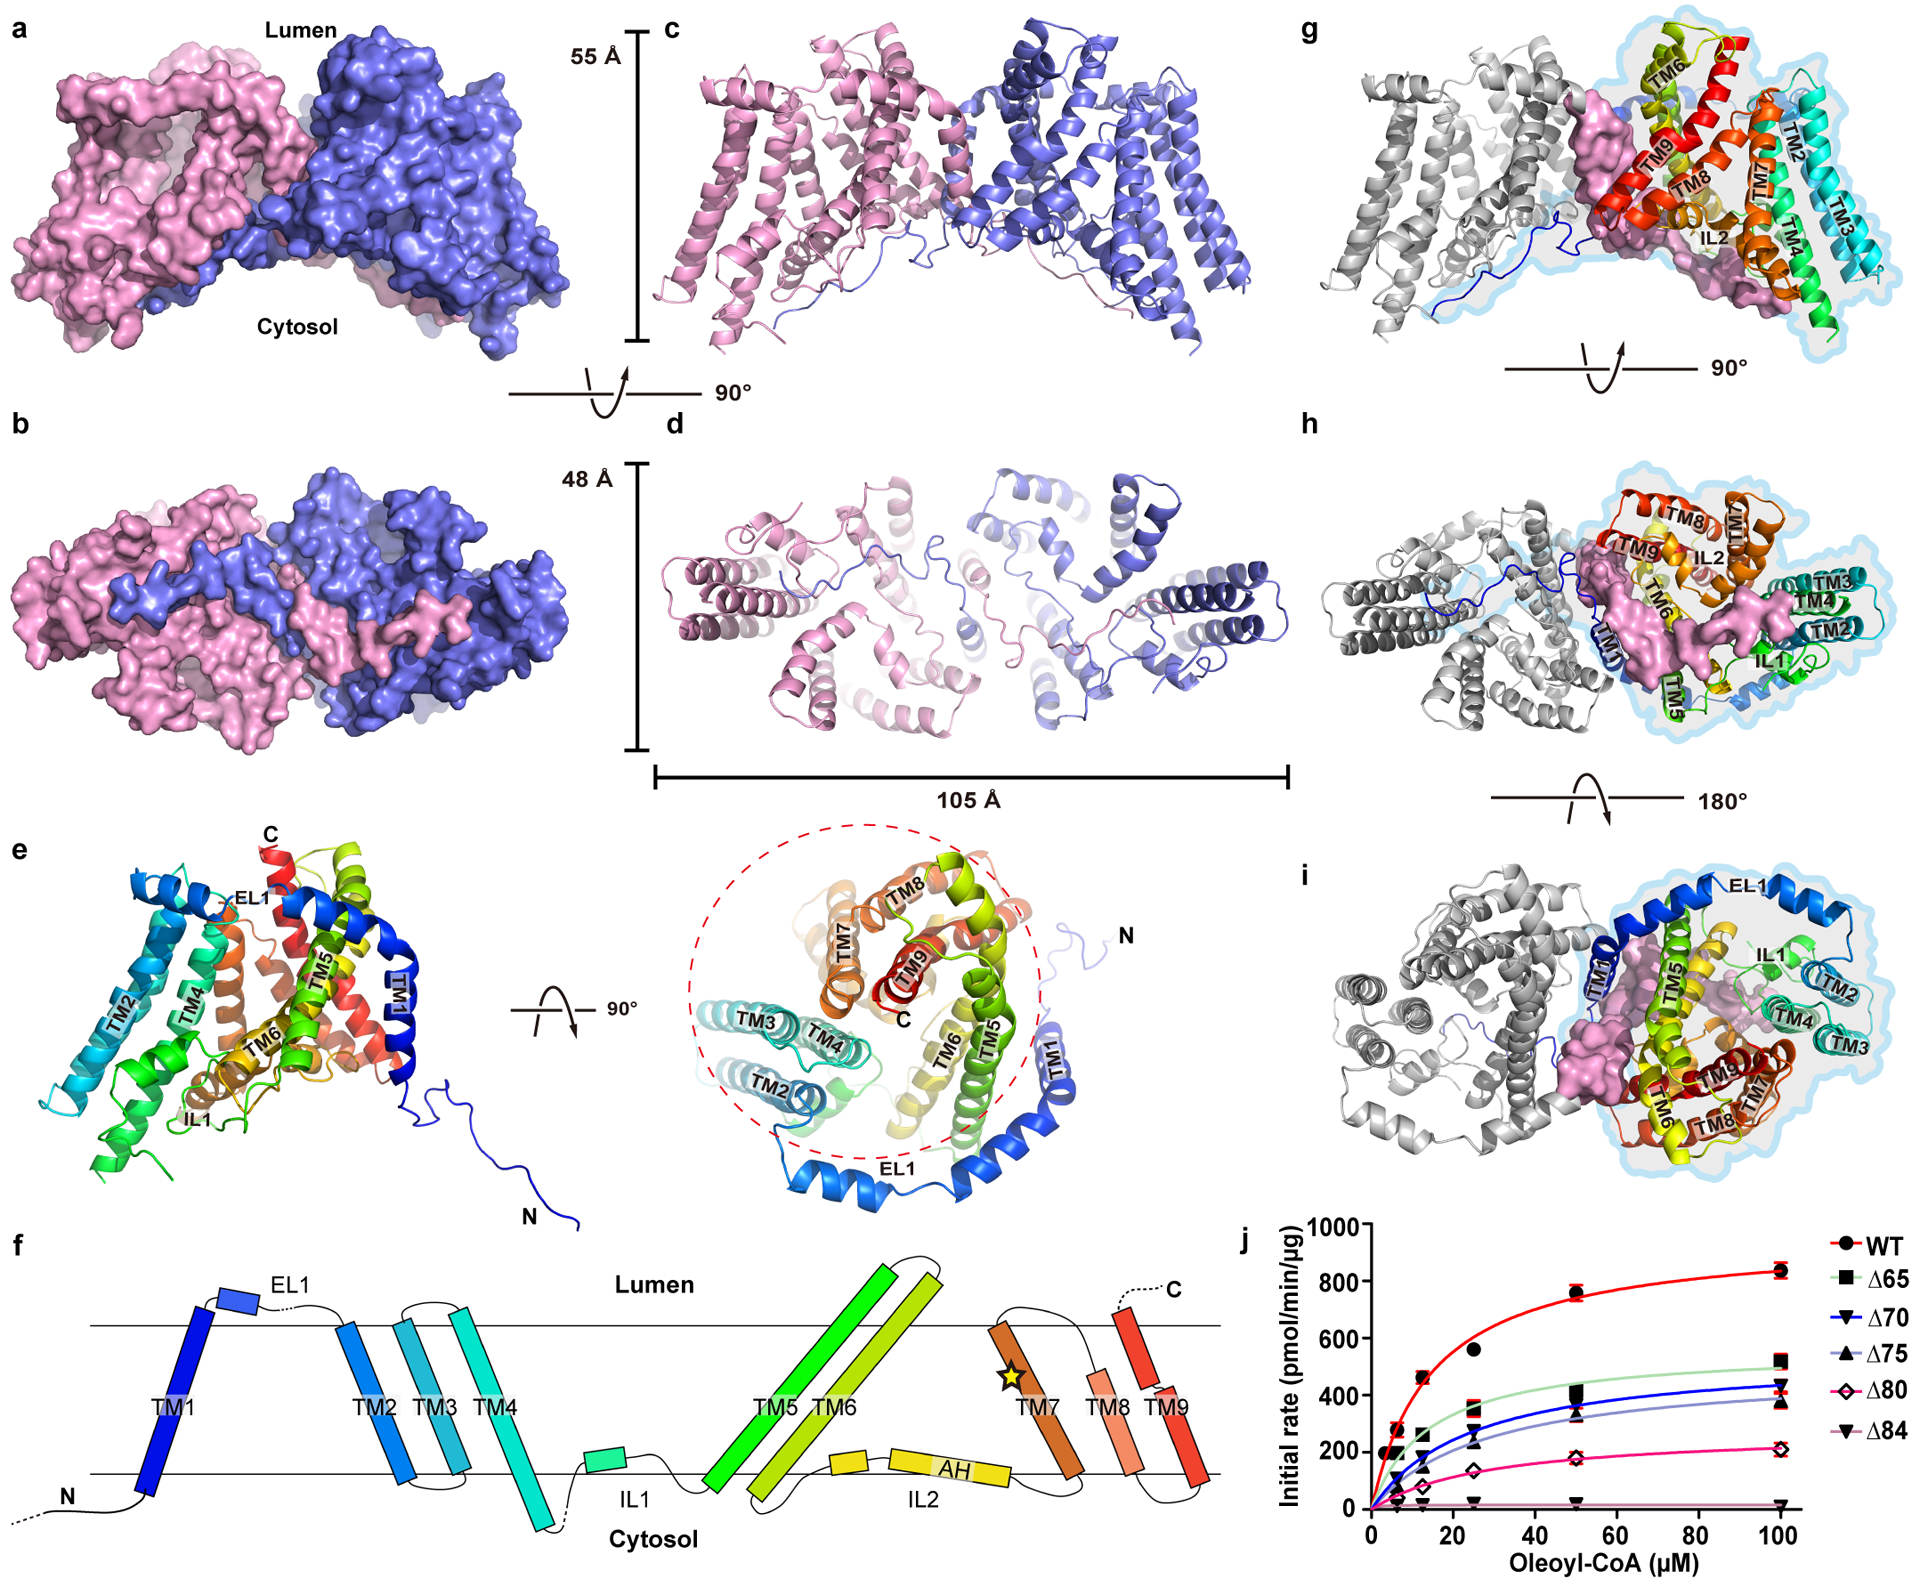
a–d Structure of hDGAT1 dimer is shown in cartoon and surface representations as viewed from within the plane of the membrane (a, c), or the intracellular side of the membrane (b, d). Approximate position of the ER membrane is marked as grey shade. e. Cartoon representation of an hDGAT1 protomer in two orientations. The MBOAT fold is marked in a dashed circle. f. Topology of hDGAT1. Unresolved regions in the structure are marked with dashed lines. The position of His415 is marked as a yellow star. g-i, Dimerization interface of hDGAT1 viewed in three orientations. One protomer is shown as grey cartoon but with its TM1 and the N-terminus as surface. The other protomer is shown as rainbow-colored cartoon and marked with an outline. j. Enzymatic activity of N-terminal truncations of hDGAT1. Error bars are s.e.m. derived from three independent repeats.
Figure 2. The reaction chamber and oleoyl-CoA binding site.
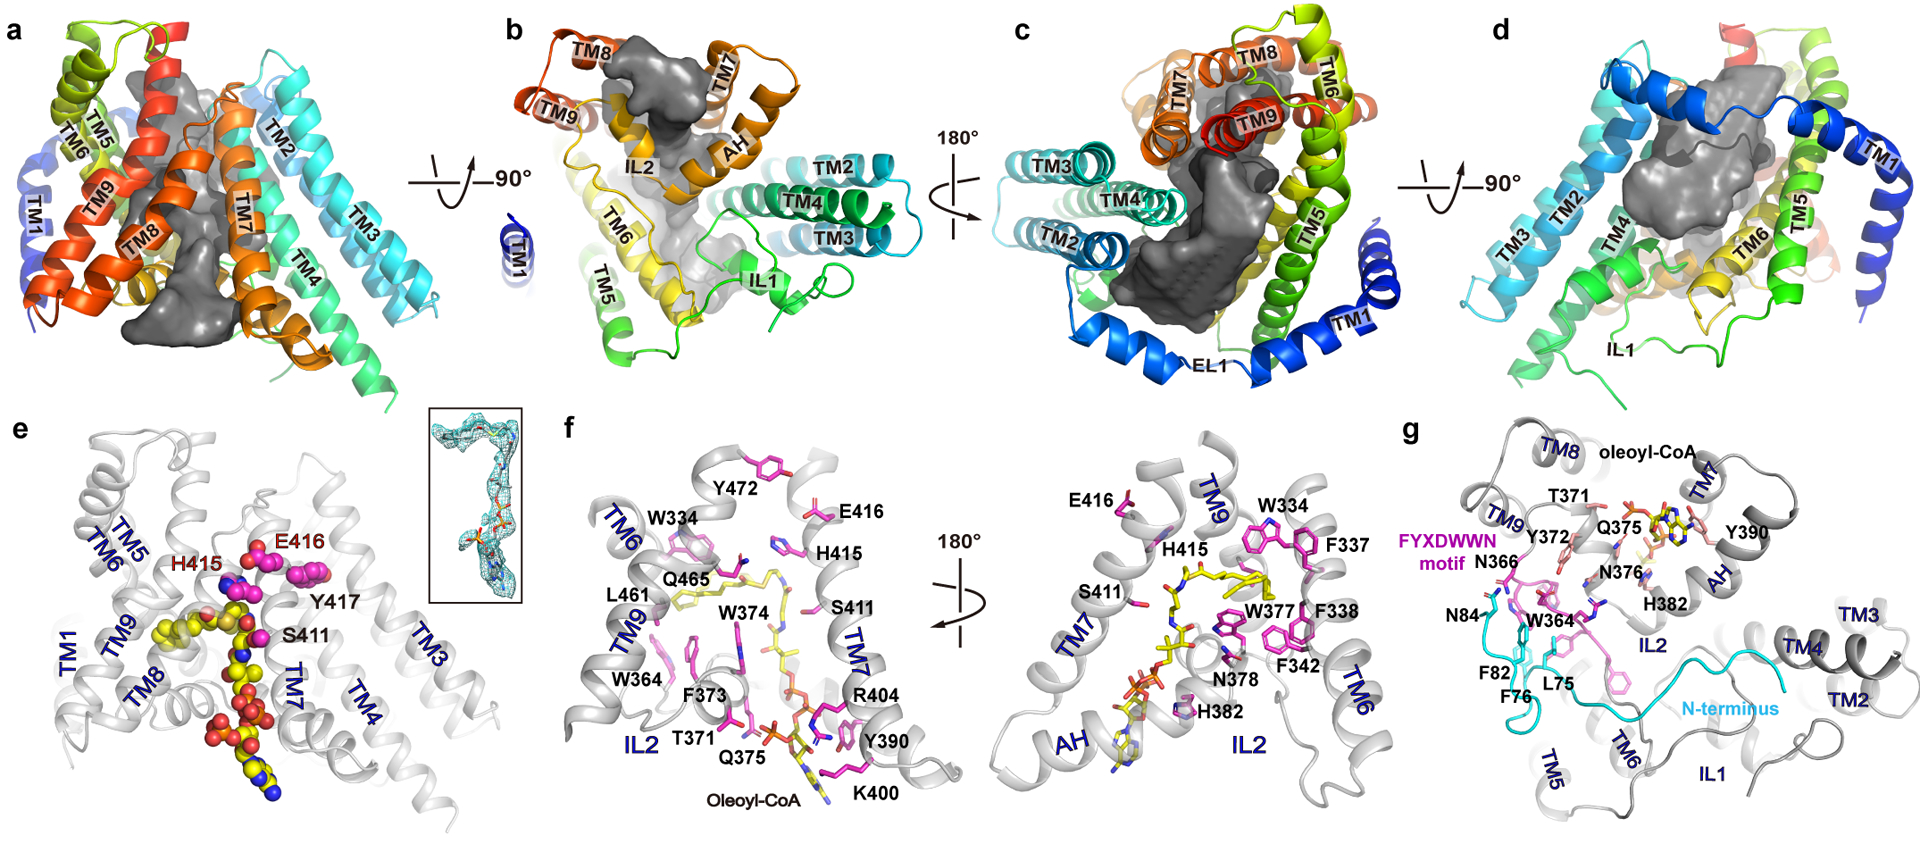
a-d. The reaction chamber (grey surface) is shown in four orientations with the surrounding helices as cartoon. e. an oleoyl-CoA is shown as spheres with carbon atoms colored in yellow. The side chains of the conserved active site residues (SXXHEY) are shown as magenta spheres. inset: oleoyl-CoA in stick and its density as green mesh. f. Residues at the oleoyl-CoA binding site are shown as sticks with carbon atoms colored in magenta. g. Interaction between the FYXDWWN motif (magenta) and the N-terminus of the neighboring protomer (cyan).
The dimer interface
Although TM1 seems suspended in the membrane when a protomer is viewed in isolation, the space between the TM1 and the rest of the protomer (the MBOAT fold) is partially filled by the TM1 from the neighboring protomer so that the two form a domain-swapped homodimer (Fig. 1b & 1g–i). Crossover of the TM1 helix allows the N-terminal residues 64–80 of one protomer to interact with both the IL1 and IL2 of the neighboring protomer. TM1 interacts with TM6 and TM9 of the neighboring subunit, and the two TM1s make contact at residues Ser83 and Asn84 located close to the intracellular side of the membrane. The rest of the space between the two protomers is filled with 2 detergent molecules and 4 partially resolved lipid molecules (Extended Data Figs. 4c and 5a–e). Because these bound detergent and lipid molecules have extensive interactions with hDGAT1, they may play important roles in both the structure and function of hDGAT1.
We next examined the functional implications of the domain-swapped N-terminus of hDGAT1. We progressively shortened the N-terminus by making deletion of residues 2–65 (ΔN65), 2–70 (ΔN70), 2–75 (ΔN75), 2–80 (ΔN80), and 2–84 (ΔN84), and all of them can be purified as stable dimers (Extended data Fig. 5f). We found that the enzymatic activity is progressively lower as more N-terminal residues are deleted, and the longest deletion ΔN84 has no activity (Fig. 1j and Extended Data Table 2). These results highlight the importance of the N-terminus in enzymatic function. Previous studies on a plant DGAT1 have identified part of the N-terminus as intrinsically disordered protein, and showed that deletion of the entire N-terminus before TM1 led to loss of the enzymatic activity18–20.
The reaction chamber
The MBOAT fold of hDGAT1 (TM2–9 and IL1 & 2) carves out a large hollow chamber in the hydrophobic core of the membrane (Fig. 2a–d). His415, which is almost universally conserved in the MBOAT family of enzymes, is found inside of the reaction chamber and on TM7. TM2–9 segregates into three groups that form three sidewalls of the chamber. TM2, 3 and 4 pack into a bundle that forms the first sidewall; TM5 and 6 are both very long with almost 40 amino acids each, and the two helices coil into a unit that tilts roughly 56 degree to the membrane norm to form the second sidewall; TM7, 8 and 9 form a panel and the third sidewall (Fig. 2a–d). The cytosolic ends of TM7 and 8 is ~19 Å apart, creating a cytosolic entrance to the reaction chamber (Fig. 2a–b). IL1 and IL2 form the floor of the chamber at the cytosolic side. IL1 (residues 222 to 261) is composed of a helix flanked by two long strands, while IL2 (residues 352 to 396) has a long amphipathic helix (AH, residues 380 to 394) preceded by a short helix and a loop.
Acyl-CoA binding site
The structure of hDGAT1 was solved in the presence of 2 mM oleoyl-CoA. A large non-protein density is found at the cytosolic side of the reaction chamber close to IL2 and it extends deep into the reaction chamber (Extended Data Fig. 4b). An oleoyl-CoA is modeled into this density, with the adenosine 3’,5’-diphosphate of the CoA moiety at the cytosolic entrance, the 4-phosphate panthothenic acid, β-alanine and β-mercapto-ethylamine extending progressively into the reaction chamber, and the acyl chain residing in a hydrophobic pocket inside of the reaction chamber (Fig. 2e–f and Extended Data Fig. 6a–h.). The activated thioester is located to the vicinity of His415, poised for an attack from the hydroxyl of DAG. The position of the thioester could be stabilized by interactions between the carbonyl oxygen of the fatty acid and the side chain of Gln465 on TM9 (Fig. 2f and Extended Data Fig. 6h).
IL2 has a crucial role in acyl-CoA binding. Its V-shaped helix-turn-helix motif forms the binding site for the adenosine 3’,5’-diphosphate moiety of acyl-CoA (Fig. 2g). The loop preceding the helix-turn-helix motif contains a highly conserved FYXDWWN sequence found in both DGAT1 and the related ACAT and mutational studies suggest that these residues may coordinate acyl-CoA2,21 (Extended Data Fig. 7a and c). However, only Trp364, the first tryptophan in the FYXDWWN sequence, forms part of the hydrophobic pocket for the acyl chain and the rest of the sequence does not have direct contact with the acyl-CoA. FYXDWWN packs tightly against the helix-turn-helix motif of IL2 and also interacts extensively with the N-terminus from the neighboring protomer (Fig. 2g). We speculate that mutations to this sequence and deletion of the N-terminus could affect the enzymatic activity by perturbing these interactions.
To assess the functional impact of residues at the active site and ones that line the acyl-CoA binding site, point mutations were made and their enzymatic activities were measured. Point mutations to residues that line the entrance of the acyl-CoA binding site, Thr371, Tyr390, Lys400, and Arg404, reduce the enzymatic activity by 30–70%, while point mutations to the rest of the binding pocket, Trp377, Asn378, His382, and Ser411, have a larger impact with a loss of more than 80% activity. Mutations to active site residues, His415 and Glu416, abolish the enzymatic activities (Extended Data Fig. 6i–j and Extended Data Table 2).
Gateway for DAG and TG
The reaction chamber has a large lateral opening to the hydrophobic core of the membrane, and the opening is framed by TM4 on one side and TM6 on the other side, and by part of the IL1 (residues 234–245) on the cytosolic side (Fig. 2c–d and Extended Data Fig. 8a–c). Residues that line the two sides of the entrance are mostly hydrophobic (Extended Data Fig. 8d). A tubular density is found near the entrance and extends deep into the reaction chamber (Extended Data Figs. 4b and 8a). Residues surrounding the tubular density are mostly hydrophobic indicating that it likely is a long aliphatic acyl chain although the density is not large enough to accommodate an extended DAG. We speculate that the lateral opening would allow entrance of DAG and exit of TG, both of which can be accommodated by the hydrophobic core of the membrane. Consistent with this hypothesis, mutating Leu346 to a bulkier side chain Trp produces an enzyme that has no activity (Extended Data Fig. 6i–j and Extended Data Table 2).
Discussion
hDGAT1 structure defines a conserved MBOAT structural fold, which forms a reaction chamber in the ER membrane to shield the acyl transfer reaction from the hydrophobic core of the membrane. The structure shows that the reaction chamber has a tunnel-shaped entrance from the cytosolic side that recognizes the hydrophilic Coenzyme A motif of an acyl-CoA. A slit between TM7 and 8 likely allows entry of the acyl chain of an acyl-CoA into the chamber and be accommodated by a hydrophobic pocket inside of the chamber (Fig. 3a and b). The reaction chamber also has a large opening to the hydrophobic core the membrane that could allow entry of a DAG. We propose that when the glycerol backbone of a DAG approaches the catalytic center His415, the two hydrophobic aliphatic acyl chains of DAG could remain partially outside of the protein and accommodated in the hydrophobic core of the membrane (Fig. 3b). The conserved His415 would facilitate the acyl transfer reaction by activating the free hydroxyl on DAG, and Glu416 could enhance the activation. The activated hydroxyl oxygen then attacks the thioester on the fatty acyl-CoA to form a new ester bond (Fig. 3c). The product, TG, could retrace into the hydrophobic core the membrane while CoASH dissociates into the cytosol (Fig. 3d).
Figure 3. Proposed catalytic mechanism of hDGAT1.
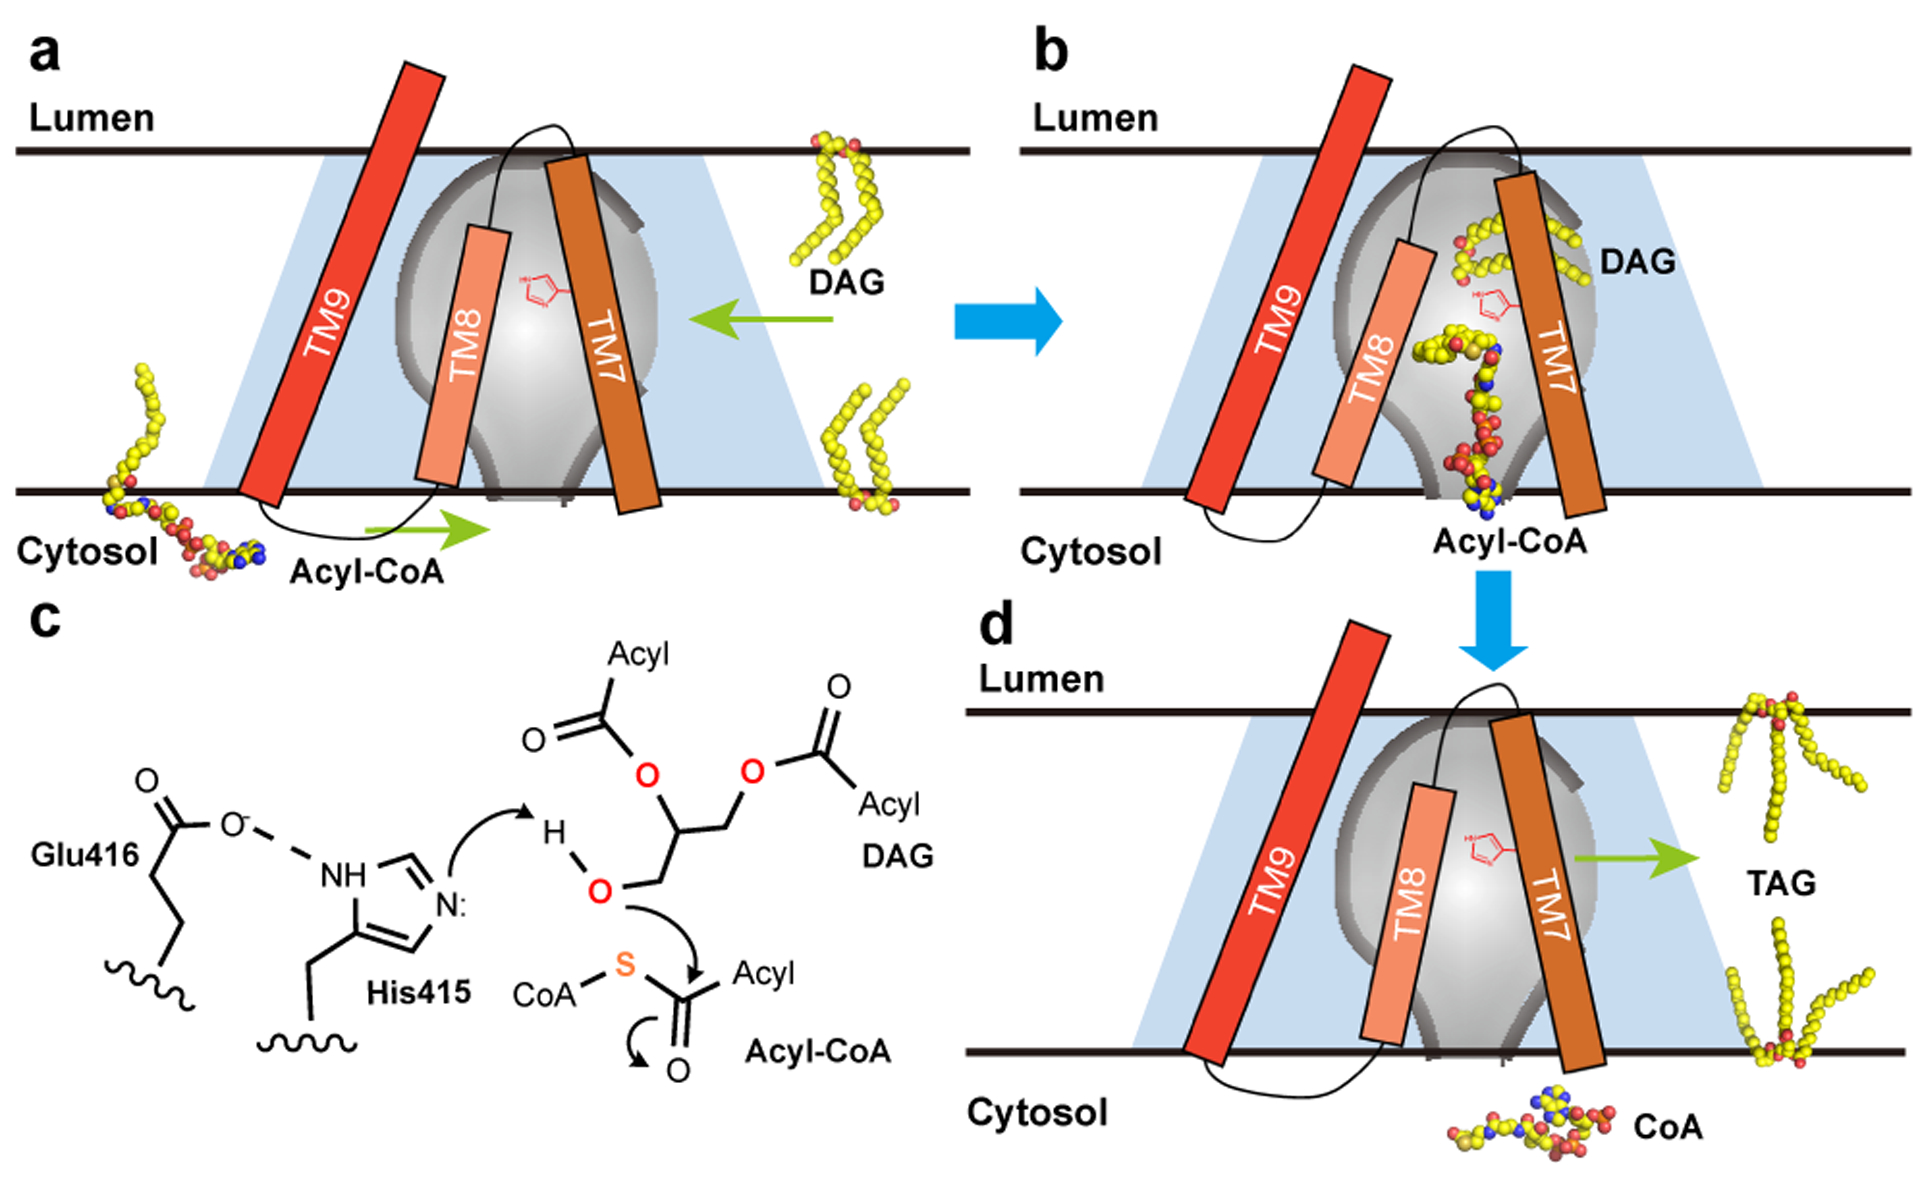
a. and b. An hDGAT1 monomer is shown as a trapezoid in light blue and the reaction chamber in the shape of an inverted flask colored in grey. TM7–9, acyl-CoA and DAG are shown schematically. The catalytic His415 is marked in red on TM7. The CoA moiety of an acyl-CoA binds to hDGAT1 at the cytosolic entrance of the tunnel and the hydrophobic acyl chain slides into the reaction chamber through a slit between TM7 and TM8. The glycerol backbone of DAG enters the chamber from the large side entrance with the two acyl-chains partially hosted in the hydrophobic core of the membrane. c. Proposed catalytic mechanism. E416 and H415 activate the 3-hydroxyl on DAG for a nucleophilic attack on the thioester of the Acyl-CoA. d. After the reaction, the product TG could diffuse into either leaflet of the membrane.
Methods
Cloning, expression, and purification of human DGAT1
Human DGAT1 gene (accession number NP_036211) was codon-optimized and cloned into a modified pFastBac Dual vector22 for production of baculovirus by the Bac-to-Bac method (Thermo Fisher). High Five Cells (Thermo Fisher) at a density of ~3×10⁶ cells/ml were infected with baculovirus and grown at 27 °C for 48–60 hours before harvesting. Cell membranes were isolated following a previous protocol22 and flash frozen in liquid nitrogen.
Isolated cell membranes were thawed and homogenized in 20 mM HEPES, pH 7.5, 150 mM NaCl and 2mM β-mercaptoethanol, and then solubilized with 1% (w/v) lauryl maltose neopentyl glycol (LMNG, Anatrace) at 4 °C for 2 hours. After centrifugation (55,000g, 45min, 4 °C), hDGAT1 was purified from the supernatant using a cobalt-based affinity resin (Talon, Clontech) and the His6-tag was cleaved by incubation with TEV protease for 1 hour at room temperature. Oleoyl-CoA (20 μM) was added to reduce aggregation, and hDGAT1 was then concentrated to ~5 mg/ml (Amicon 100 kDa cutoff, Millipore) and loaded onto a size-exclusion column (SRT-3C SEC-300, Sepax Technologies, Inc.) equilibrated with 20 mM HEPES, pH7.5, 150 mM NaCl, 0.02% glyco-diosgenin (GDN, Anatrace). Purified hDGAT1 was mixed with 2 mM of oleoyl CoA and concentrated to ~20 mg/ml for cryo-EM grid preparation.
When LMNG was used in the extraction step, most of the hDGAT1 is homodimer and only a small fraction is homotetramer. To obtain tetrameric hDGAT1, 1% GDN was used for extraction and 0.02% GDN for purification. The dimeric hDGAT1 produces significantly better cryo-EM grids and was given priority for structure determination.
hDGAT1 mutants were generated using the QuikChange method and the entire cDNA was sequenced to verify the mutation. Mutants were expressed and purified following the same protocol as wild type.
Cryo-EM sample preparation and data collection
Cryo grids were prepared using the Thermo Fisher Vitrobot Mark IV. Quantifoil R1.2/1.3 Cu grids were glow-discharged in air for 40 sec at medium level using the Plasma Cleaner (Harrick Plasma, PDC-32G-2). 3.5 μl of concentrated hDGAT1 were applied to each glow-discharged grid. After blotting with filter paper (Ted Pella, Inc. Prod.# 47000–100) for 3.5 sec, the grids were plunged into liquid ethane cooled with liquid nitrogen. Movie stacks were collected using SerialEM23 on a Titan Krios at 300 kV with a Quantum energy filter (Gatan) and a Cs corrector (Thermo Fisher), and at a nominal magnification of 105,000 × and defocus values of −2.0 μm to −1.2 μm. A K2 Summit direct electron detector (Gatan) was paired with the microscope. Each stack was collected in the super-resolution mode with an exposing time of 0.175 sec per frame for a total of 32 frames. The dose was about 50 e−/Å2 for each stack. The stacks were motion corrected with MotionCor224 and binned (2×2) so that the pixel size is 1.114 Å. Dose weighting25 was performed during motion correction, and the defocus values were estimated with Gctf26.
Cryo-EM data processing
A total of 2,749,110 particles were automatically picked (RELION 2.127–29) from 3510 images and imported into Cryosparc30. 101 2D classes (out of 200) that contain 1,000,063 particles were selected for ab-initio 3D reconstruction, which produced one good class with recognizable structural features and three bad classes that do not have structural features. Although hDGAT1 can form both dimer and tetramer, only the dimer fraction was used in grid preparation and we found no tetramer during 2D classification. Both the good and bad classes were used as references in the heterogeneous refinement (cryoSPARC) and yielded a good class at 4.1 Å from 408,945 particles. After handedness correction, non-uniform refinement (cryoSPARC) was performed with a C2 symmetry and an adaptive solvent mask, which yielded a map with an overall resolution of 3.1 Å. Further heterogeneous refinement yielded a class with 275,945 particles and after non-uniform refinement, yielded a map of similar resolution but improved density of TM2, TM3, TM8 and lipids. Resolutions were estimated using the gold-standard Fourier shell correlation with a 0.143 cutoff31 and high-resolution noise substitution32. Local resolution was estimated using ResMap33.
Model building and refinement
Structure models were built de novo into the density map starting with ploy-alanine, and sidechains were then added onto the model based on the map. Model building was conducted in COOT34. Structure refinements were carried out in PHENIX in real space with secondary structure and geometry restraints35. The EMRinger Score was calculated as described36.
hDGAT1 Activity assay
hDGAT1 activity was measured using a fluorescence-based coupled-enzyme assay37 in a quartz cuvette at 37 °C (Extended Data Fig. 2d). The reaction was monitored in a FluoroMax-4 spectrofluorometer (HORIBA) with 340 nm excitation and 465 nm emission at 15 sec internals. All assays were done in a buffer with 20 mM HEPES, pH 7.5, 150 mM NaCl, 2 mM β-mercaptoethanol, 0.5 mM DDM, and 1% TritonX-100. Final concentrations of NAD+, thiamine pyrophosphate and α-ketoglutarate were 0.25 mM, 0.2 mM and 2 mM, respectively. α-ketoglutarate dehydrogenase (αKDH) was prepared from bovine heart purchased from a meat market following a published protocol38. Appropriate amount of αKDH was used to ensure that the hDGAT1 reaction is the rate limiting step. When oleoyl CoA concentrations are varied, DAG concentration is fixed at 200 μM. When DAG concentrations are varied, oleoyl CoA concentration was fixed at 100 μM. All reactions were initiated with the addition of oleoyl-CoA. The initial rate versus different concentrations of oleoyl-CoA can be fit with a Michaelis Menten equation. The initial rates in various DAG concentrations were not well fit with the traditional Michaelis Menten equation, but could be fit with an allosteric sigmoidal equation: Y=Vmax*Xh/(Km+Xh), in which X is DAG concentrations, and h is the Hill coefficient.
When assaying activity of hDGAT1 dimer or tetramer, protein concentration was kept at 2.4 μg/ml (~40 nM). When measuring hDGAT1 in cell membrane, crude membrane containing hDGAT1 was used and the amount of hDGAT1 in the membrane was estimated based on the yield of hDGAT1 from the same batch of cells. We did not observe substrate inhibition up to 200 μM of oleoyl-CoA.
TG detection by thin layer chromatography (TLC)
To validate the functional assay described in the previous section, we confirmed TG production directly. Similar enzymatic reaction was set up and 100 μl of the sample was taken at each indicated time point and extracted with 400 μl chloroform. The organic phase containing TG was dried under argon and then resuspended in 40 μl chloroform out of which 4 μl was spotted onto a KC18 reversed phase thin layer chromatography plate (Whatman Chemical Separation Inc.). The mobile phase is 100:1 (chloroform: acetic acid, v/v) and TG was visualized in an I2 chamber.
Extended Data
Extended Data Figure 1. Side-by-side comparison of hDGAT1 and DltB.
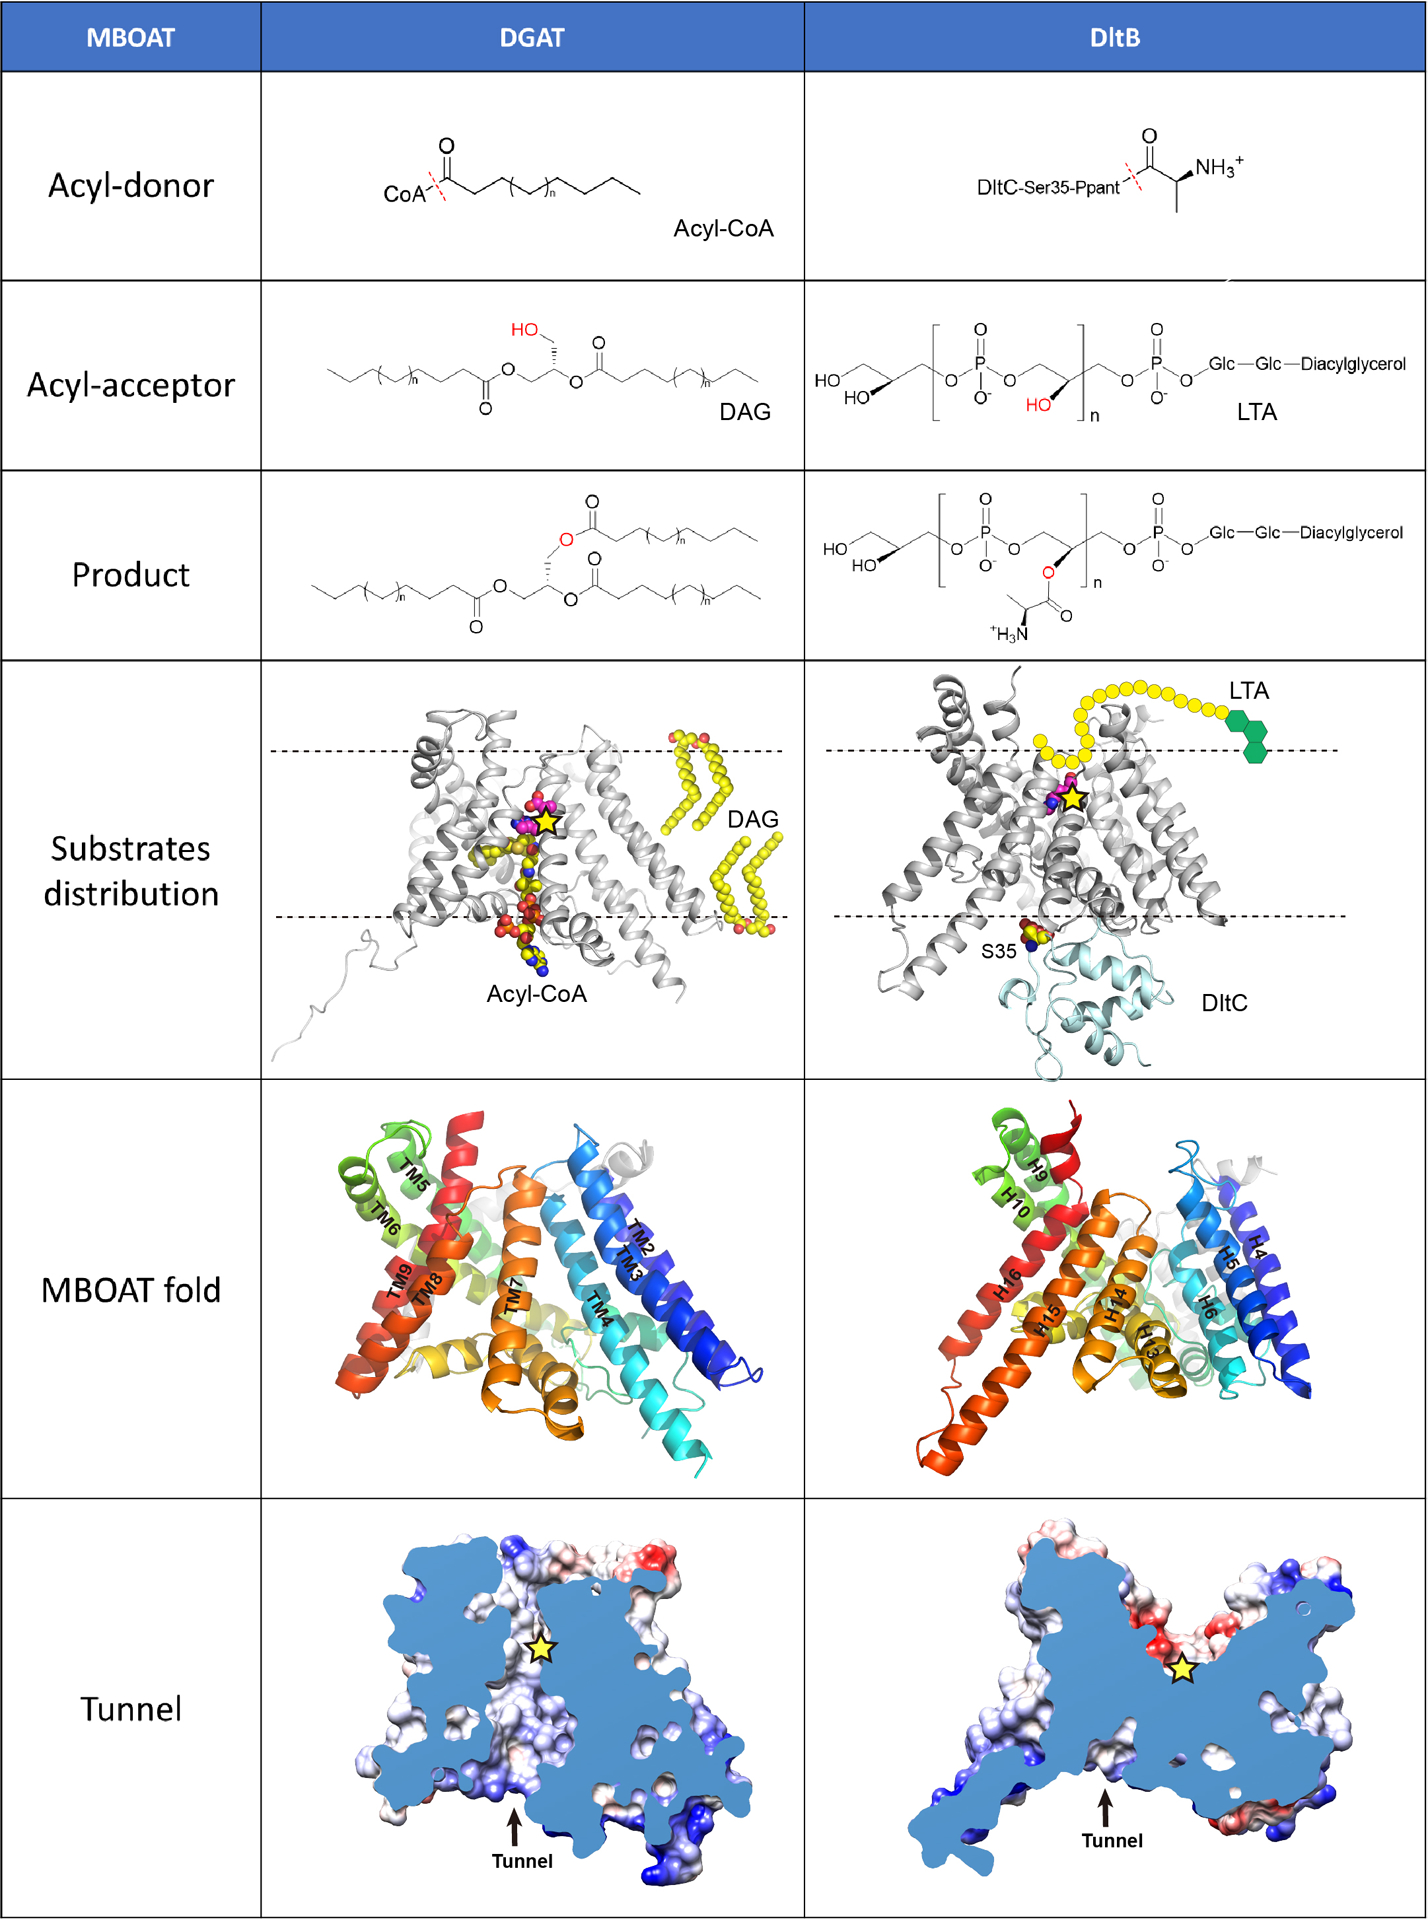
Both hDGAT1 and DltB have an acyl-donor and an acyl-acceptor. In the “acyl-donor” row, the red dashed lines indicate the bonds that are broken during acyl-transfer reactions. In the “acyl-acceptor” row, the hydroxyl groups are highlighted in red. In the “substrate distribution” row, hDGAT1 and DltB-DltC complex are shown as cartoon and the membrane as dashed lines. The position of the catalytic histidine in each protein is marked as a yellow star. In hDGAT1, acyl-CoA comes from the intracellular side while DAG comes from the hydrophobic core of membrane. In DltB, the Ppant-DltC is intracellular while the lipoteichoic acid (LTA) is extracellular. In the “MBOAT fold” row, the MBOAT folds of hDGAT1 and DltB are shown in cartoon representations and viewed from the same orientation. Equivalent helices have the same color. The “tunnel” row shows the cut-away surface illustrations of hDGAT1 and DltB featuring their cytosolic tunnels. The position of the conserved histidine residue is marked as a yellow star. In DltB, the intracellular loops are placed more towards the center of the membrane and as a result, the MBOAT fold in DltB does not carve out a reaction chamber in the membrane. Overall, DltB is shaped like an hourglass that allows the two substrates to approach the reaction center from either sides of the membrane, and the transfer of an acyl group across the membrane. These observations highlight the versatility of the MBOAT fold.
Extended Data Figure 2. Purification and functional characterization of hDGAT1.
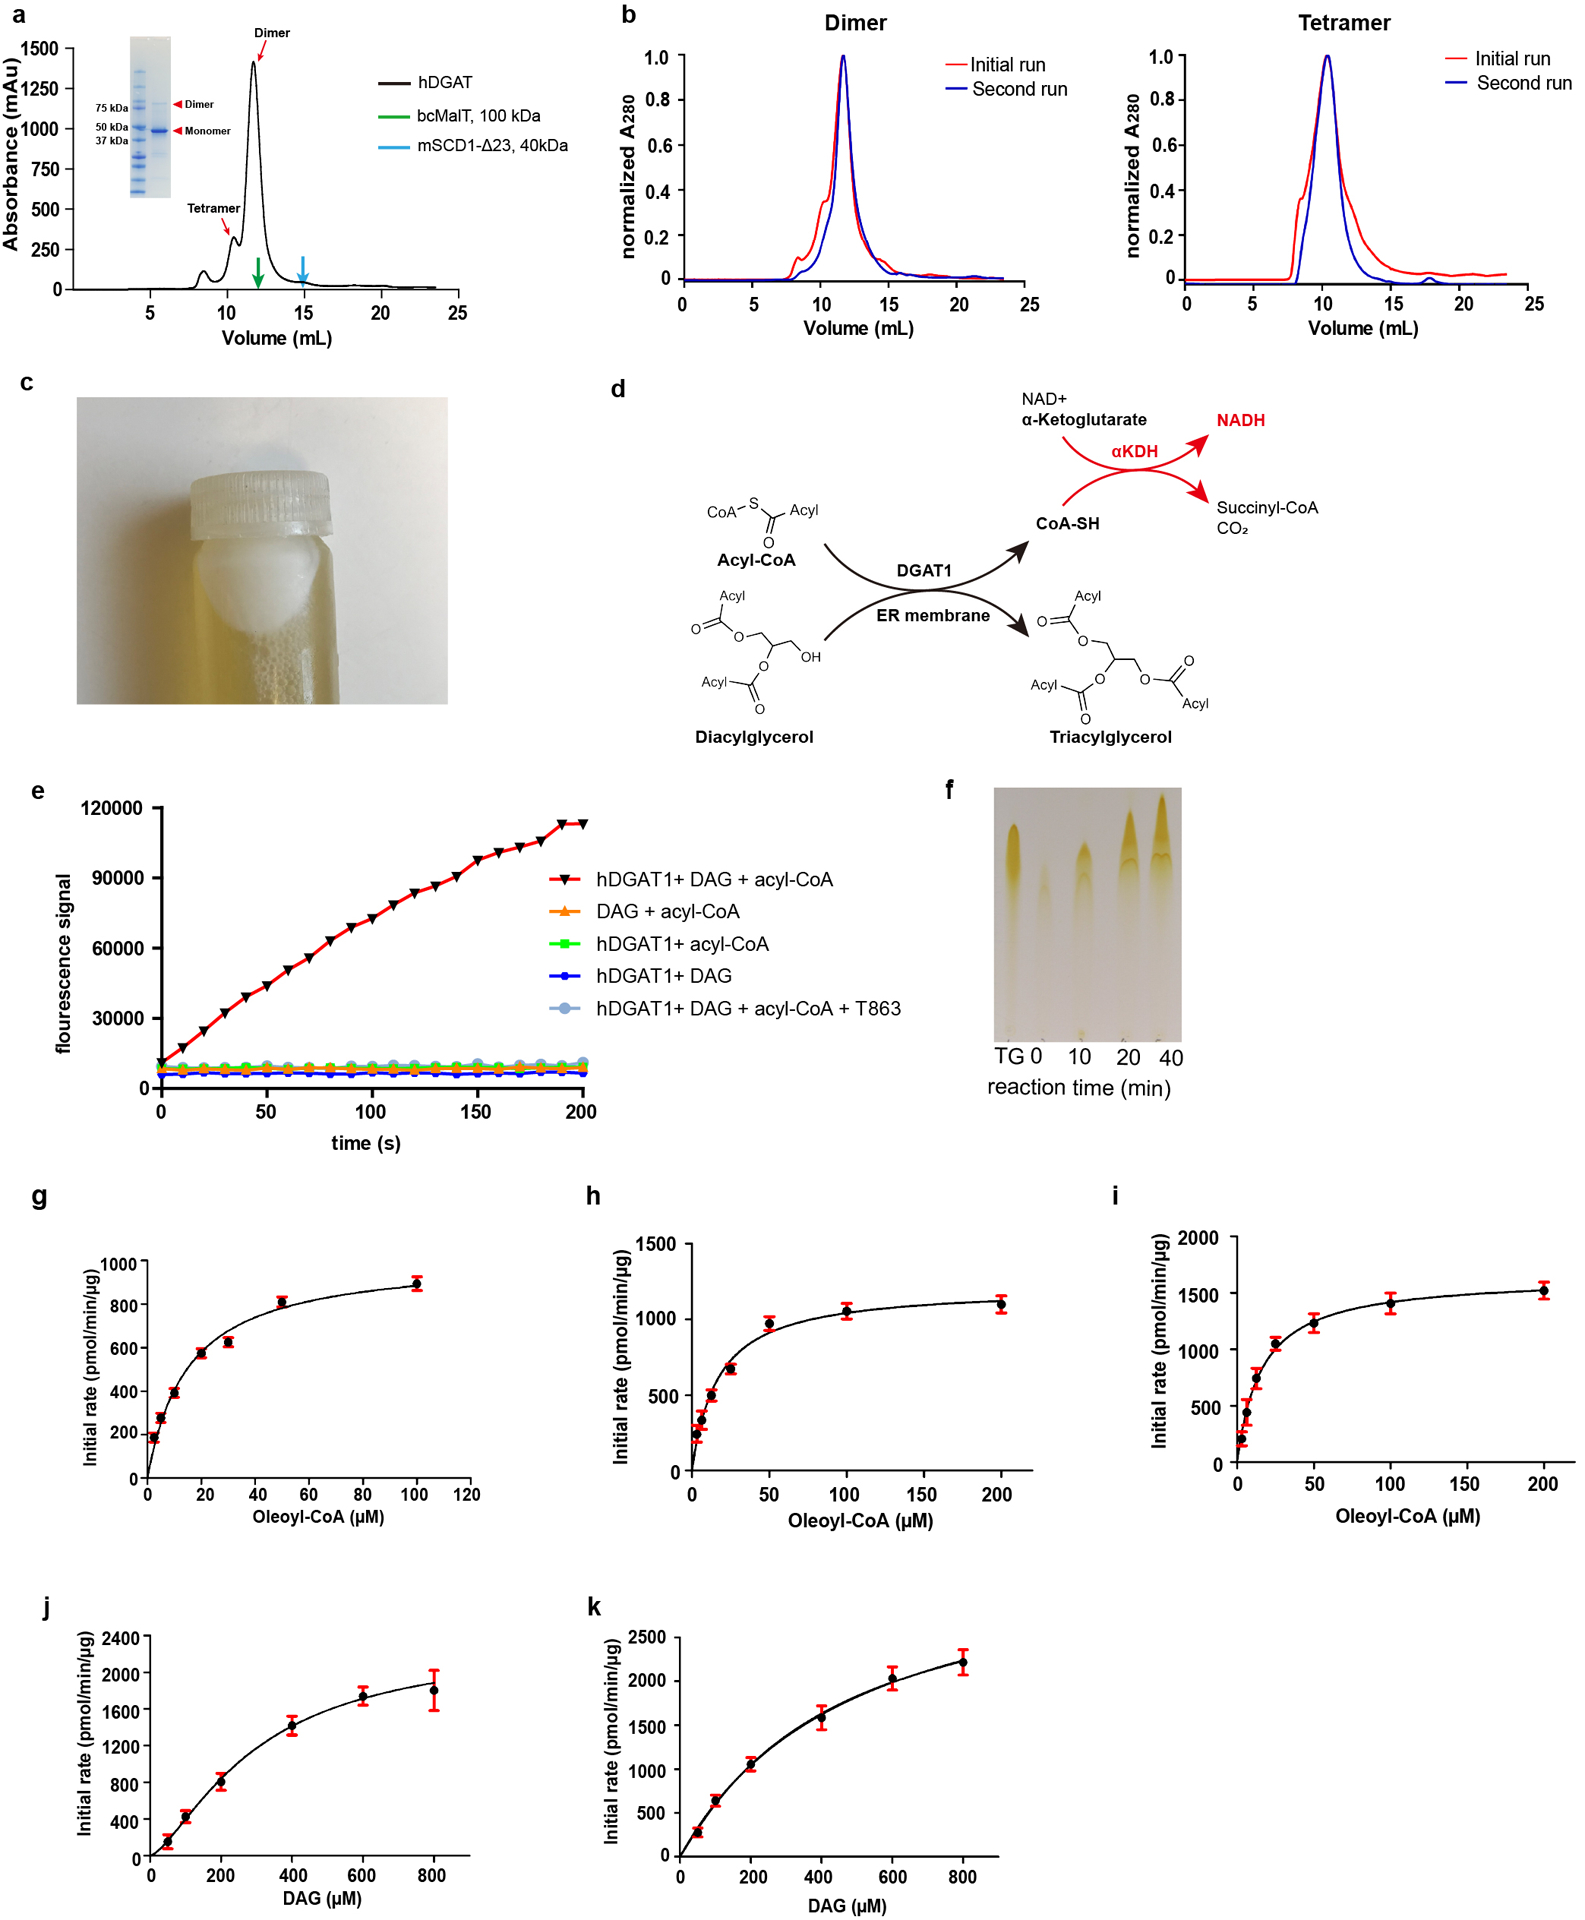
a. Size exclusion profile of hDGAT1 extracted with LMNG. Elution volumes of membrane proteins of known molecular weight, bcMalT (100 kDa, green)39 and mouse SCD1 (41 kDa, blue)22 are marked by arrows. Inset: SDS-PAGE of the purified hDGAT1. hDGAT1 has a main peak with an elution volume of ~11.7 ml which corresponds to a dimer and a minor peak at ~10.4 ml which corresponds to a tetramer. b. Size-exclusion profiles of hDGAT1 extracted with LMNG (left) or GDN (right). In both a and b, the detergent in the mobile phase is GDN. c. A white layer of fat appeared after membrane solubilization and centrifugation, indicating that the heterologously expressed hDGAT1 is active in cells. d. hDGAT1 reaction is coupled to that of α-ketoglutarate dehydrogenase (αKDH) to monitor production of Coenzyme A in real time. e. Fluorescence of NADH plotted versus time. Rapid production of Coenzyme A occurs in the presence of oleoyl-CoA, 1,2-dioleoyl-sn-glycerol (1,2-DAG) and the purified dimeric hDGAT1. In contrast, Coenzyme A production was not observed when either 1,2-DAG or hDGAT1 was omitted from the reaction mixtures indicating that hydrolysis of oleoyl CoA is tightly coupled to the enzymatic reaction. In addition, coenzyme A production was almost completely suppressed in the presence of 5 μM T863, a known hDGAT1 inhibitor40. f. Production of TG over time detected by thin layer chromatography. The first lane from the left is a TG standard. g-i. Initial rate of reaction versus oleoyl-CoA concentrations measured using the purified dimeric hDGAT1 (g), tetrameric hDGAT1 (h) or hDGAT1 in cell membrane (i). j-k. Initial rate of reaction versus DAG concentrations measured using the dimeric (j) or tetrameric (k) hDGAT1. Error bars are s.e.m. derived from three independent repeats. Experiments in a and c were repeated independently 10 times with similar results. Experiments in b, e and f were repeated independently 3 times with similar results.
Extended Data Figure 3. Cryo-EM data and processing.
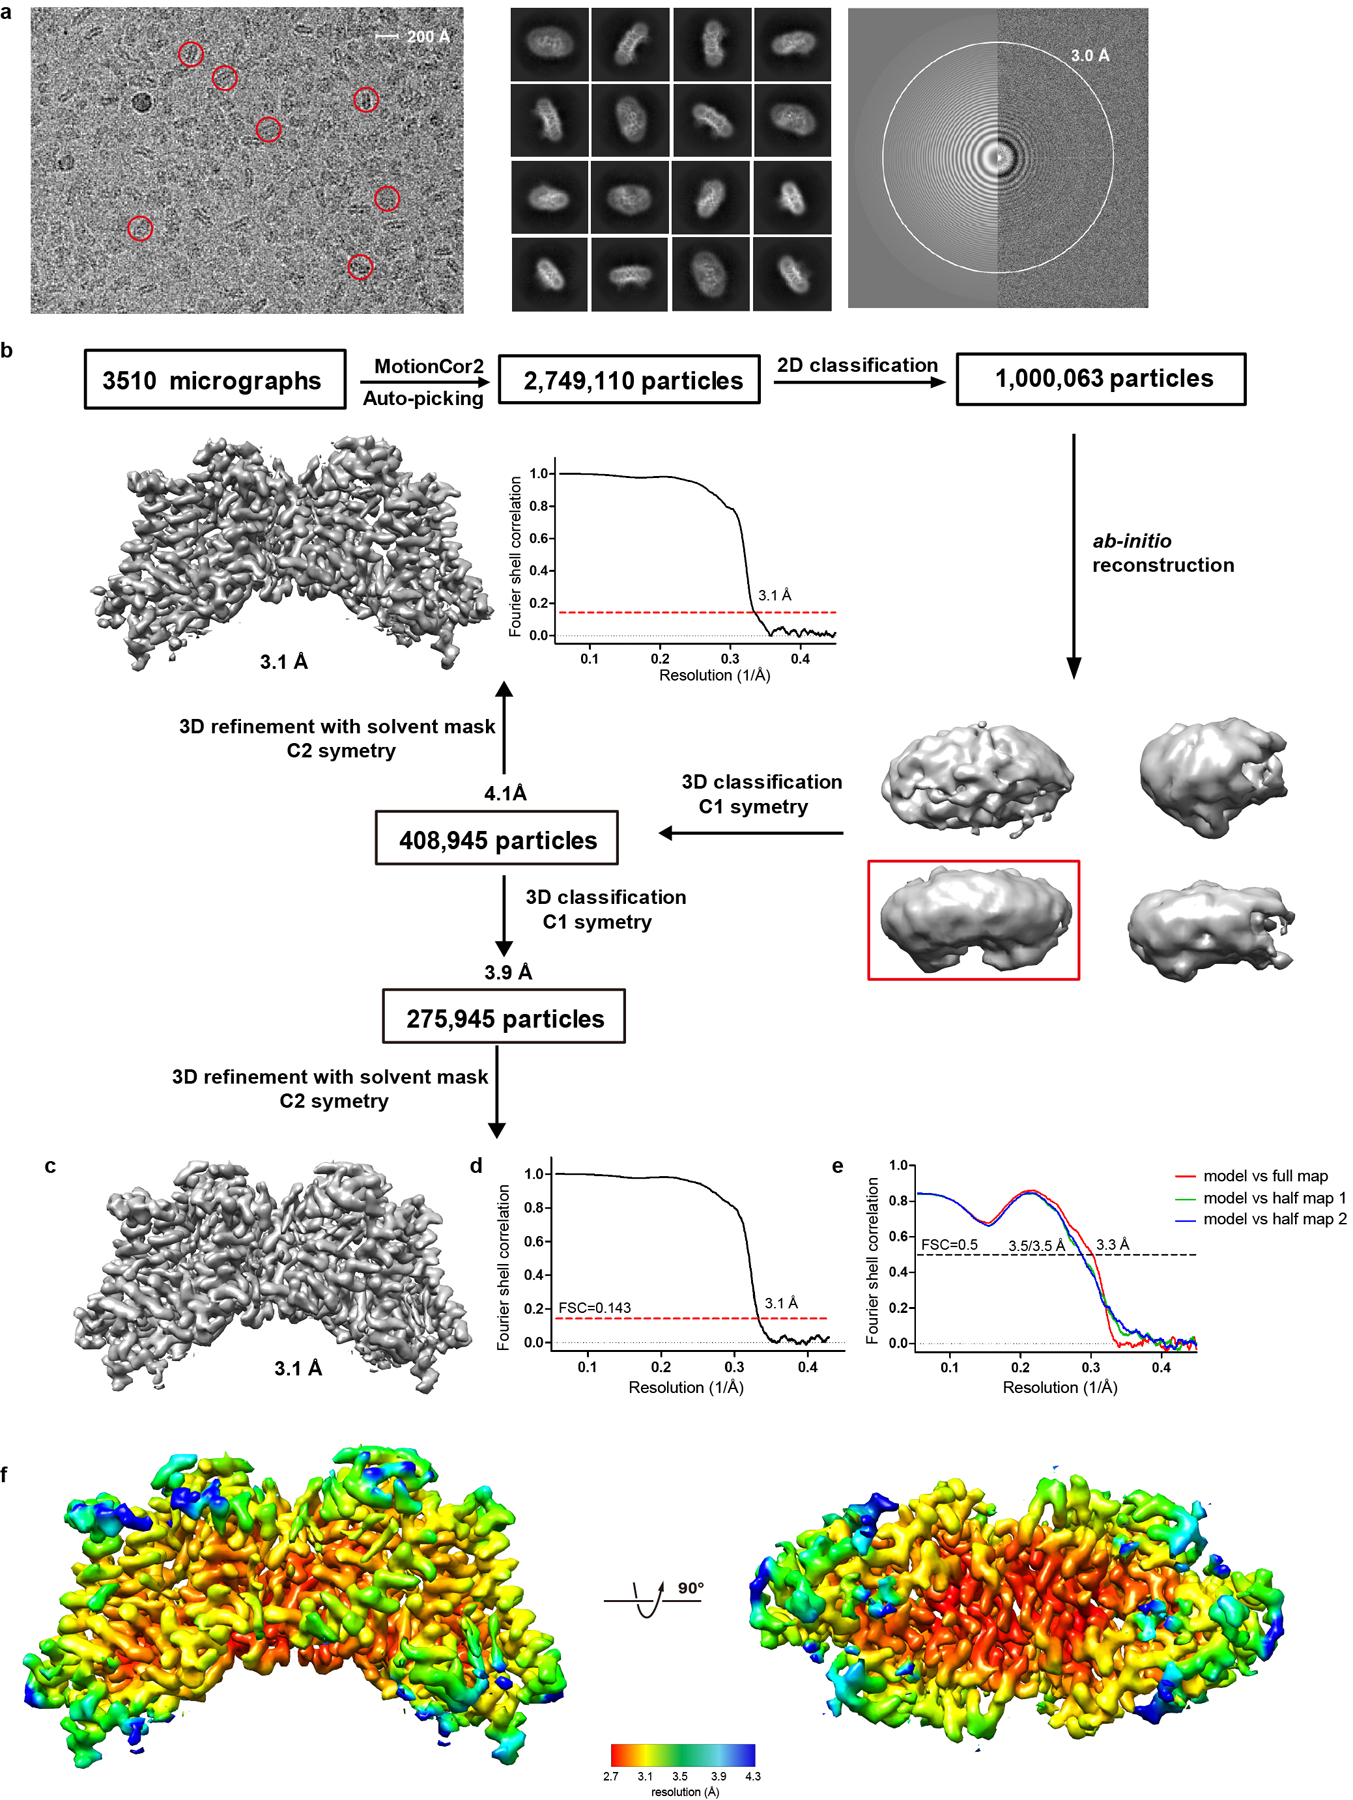
a. A representative micrograph of hDGAT1 (left), its Fourier transform (right) and representative 2D class averages (middle). Representative particles are highlighted in red circles. b-c. A flowchart for data processing and the final map of hDGAT1. d. The gold-standard Fourier shell correlation curve for the final map shown in c. e. Fourier shell correlation curves of the atomic model of hDGAT1 versus the full map and individual half maps. f. Local resolution map of hDGAT1 shown in two orientations.
Extended Data Figure 4. Density maps and structural model of hDGAT1.
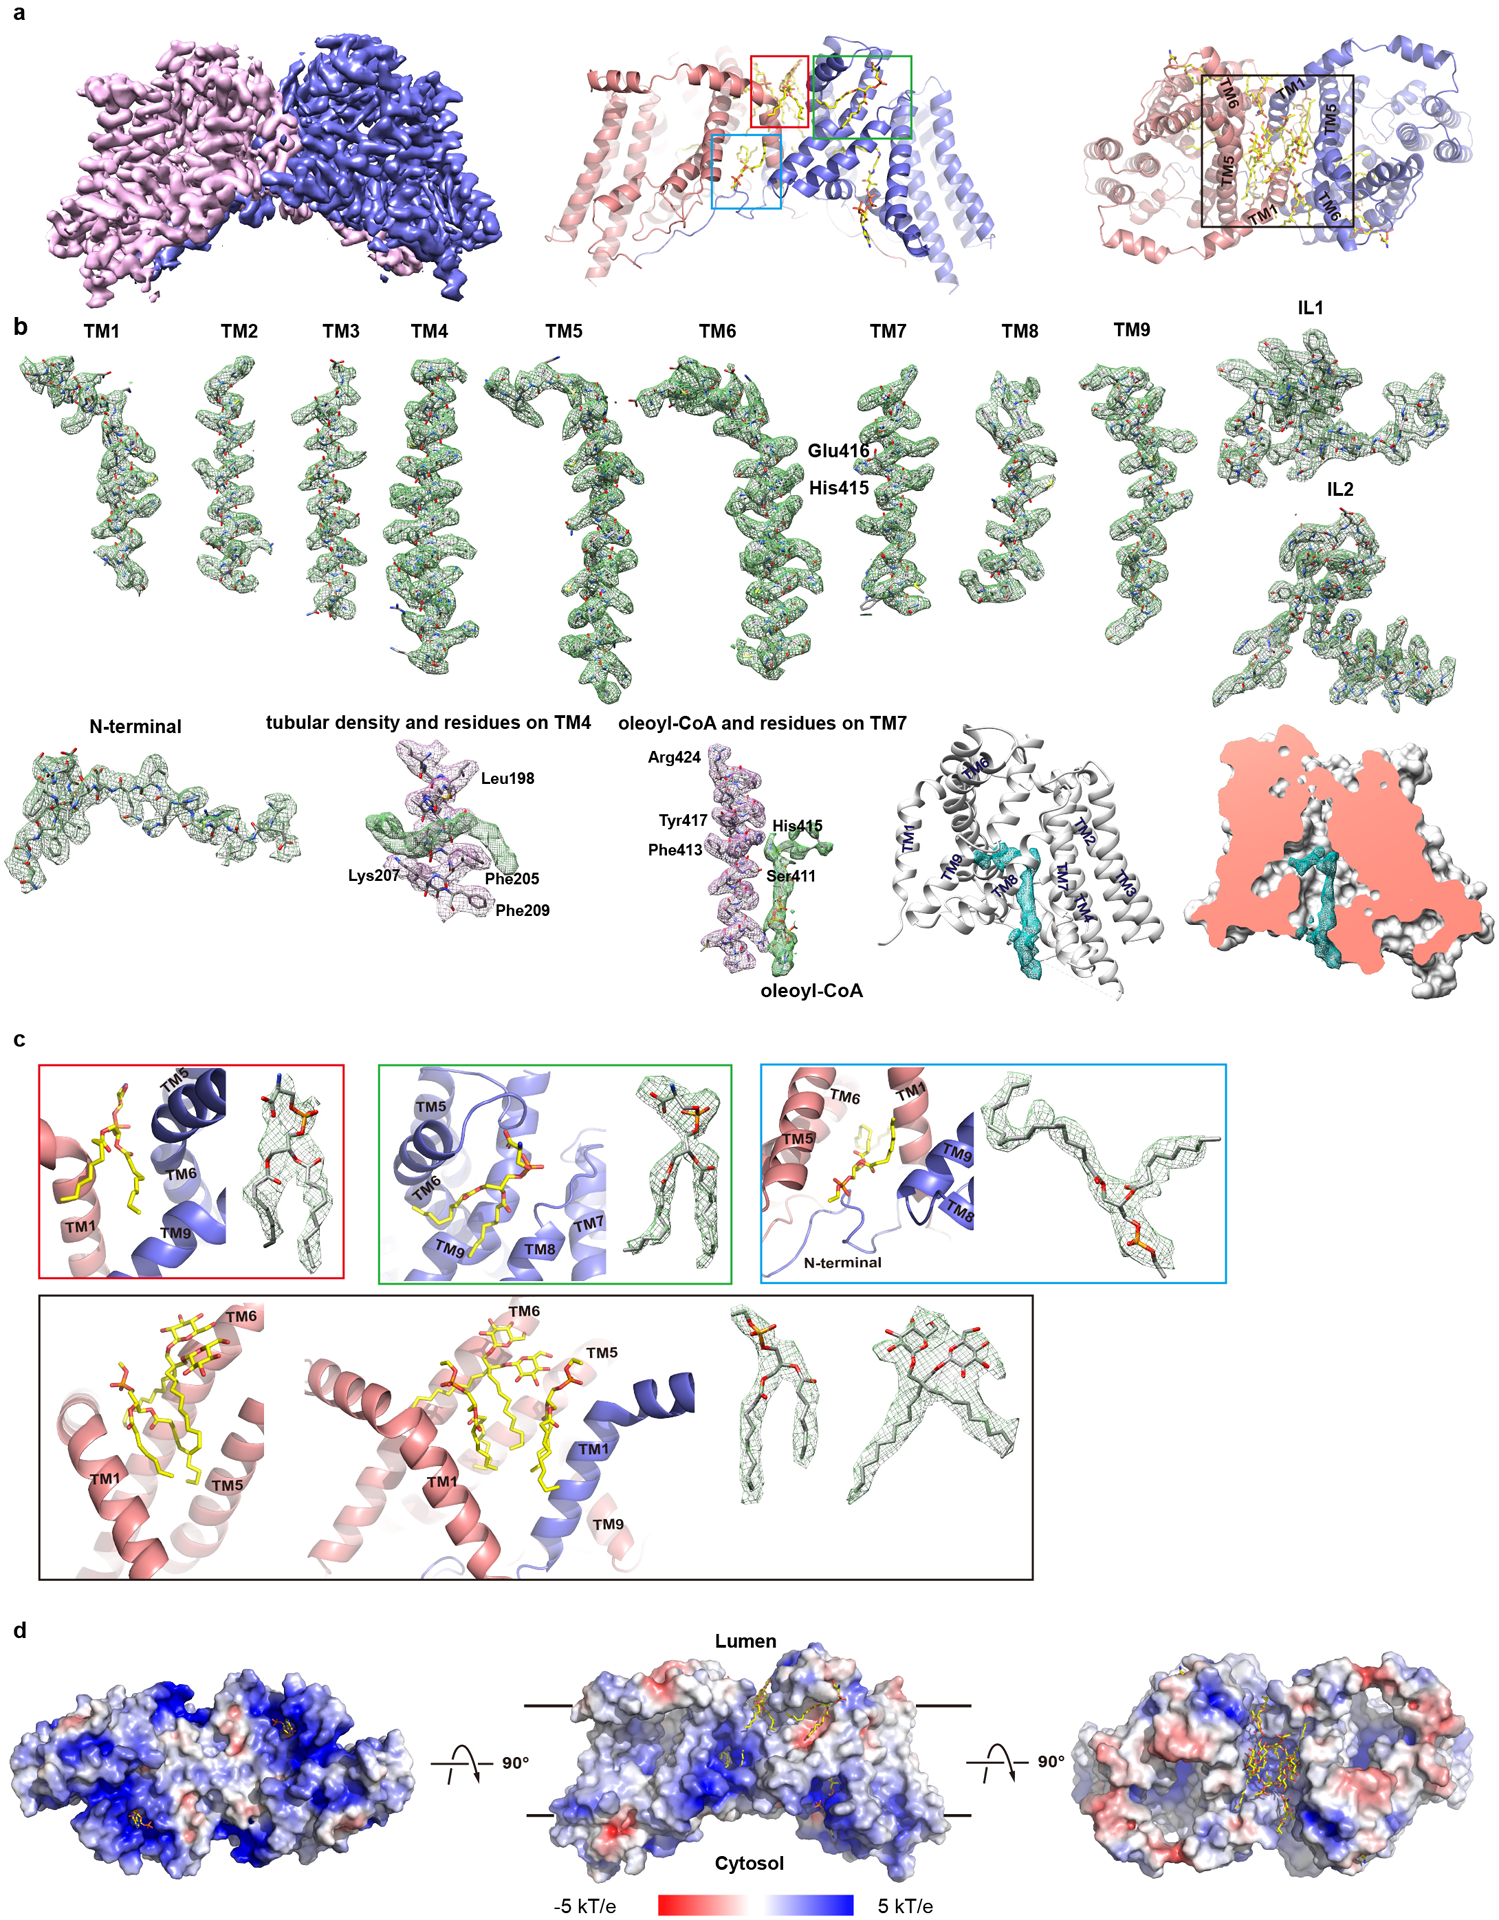
a. The overall map (left) and cartoon representation (right) of hDGAT1. b. Individual secondary structures of hDGAT1 shown as sticks, contoured in their density (green mesh). Density for oleoyl-CoA (green mesh) is shown at the same contour level as its neighboring helix, TM7 (red mesh). The tubular density (green mesh) is shown at the same contour level as its neighboring helix, TM4 (red mesh). c. Detailed view of each detergent/lipid molecule and its density. d. Electrostatic surface representations of hDGAT1 dimer in three orientations. The electrostatic potential is calculated using the APBS plugin41 from Pymol.
Extended Data Figure 5. Binding of the N-terminus to the neighboring protomer and its functional consequences.
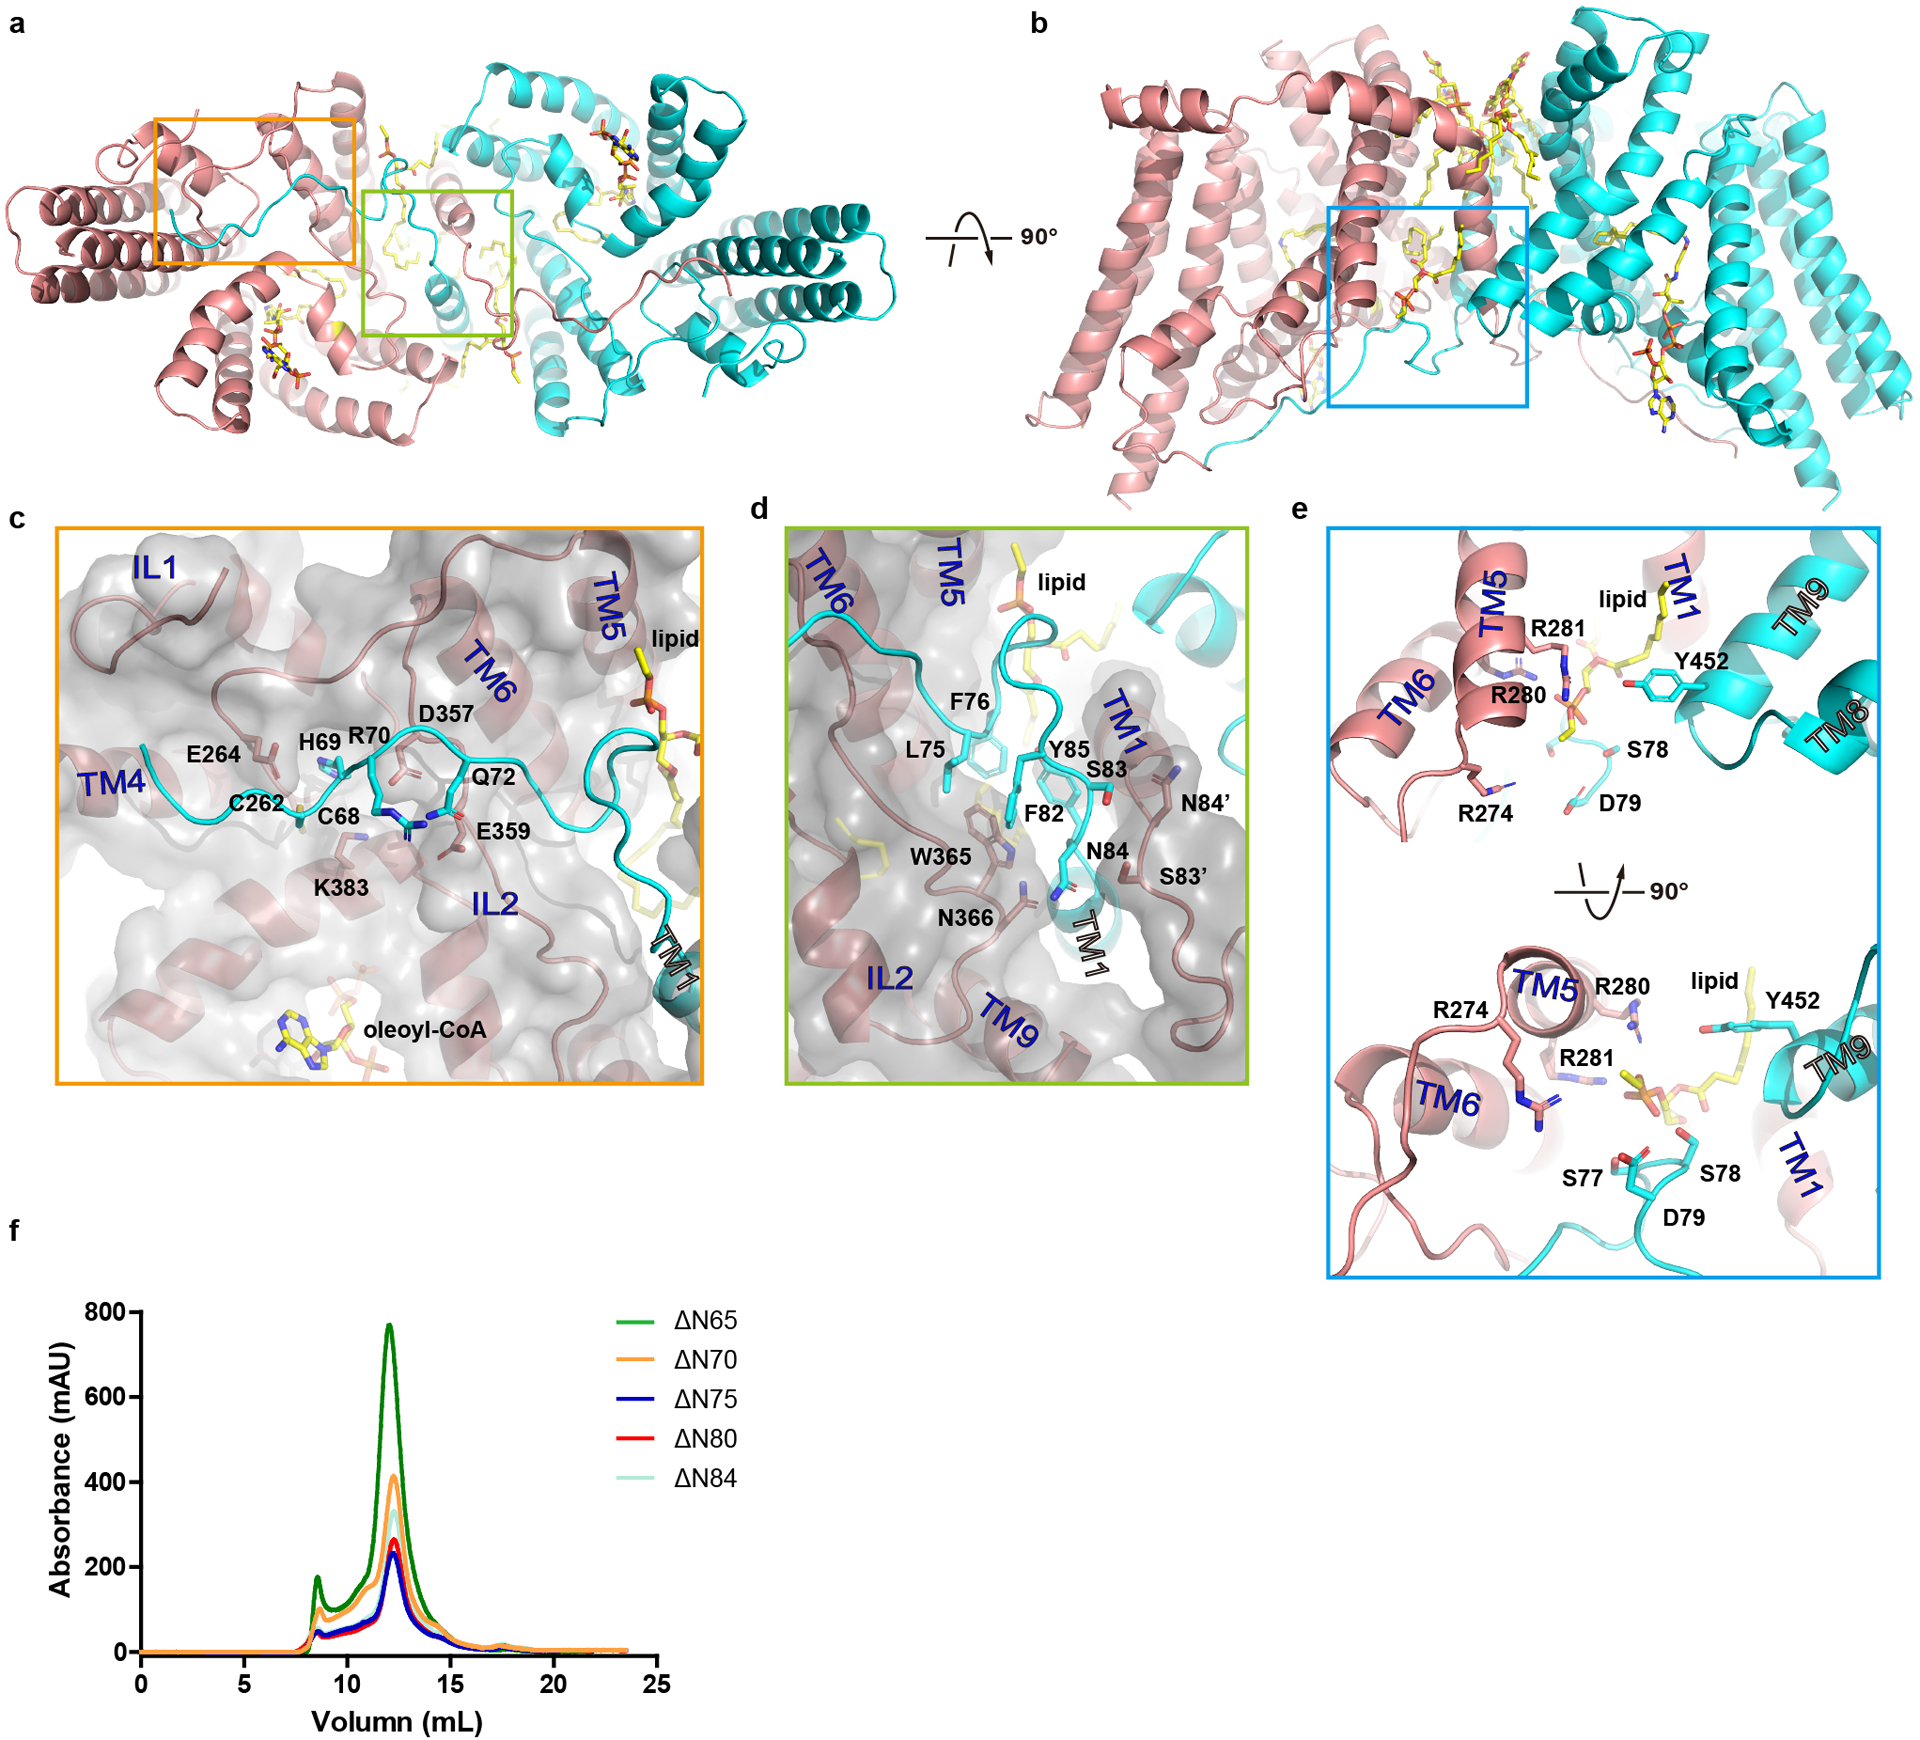
a-b. hDGAT1 dimer (cartoon) is viewed in two orientations. Detailed interactions between an hDGAT1 protomer and the N-terminus from the neighboring protomer are shown in c-e. Residues involved in the interactions are shown as sticks. f. Size-exclusion profiles of N-terminal truncations. Experiments in f were repeated independently 3 times with similar results.
Extended Data Figure 6. Oleoyl-CoA binding site.
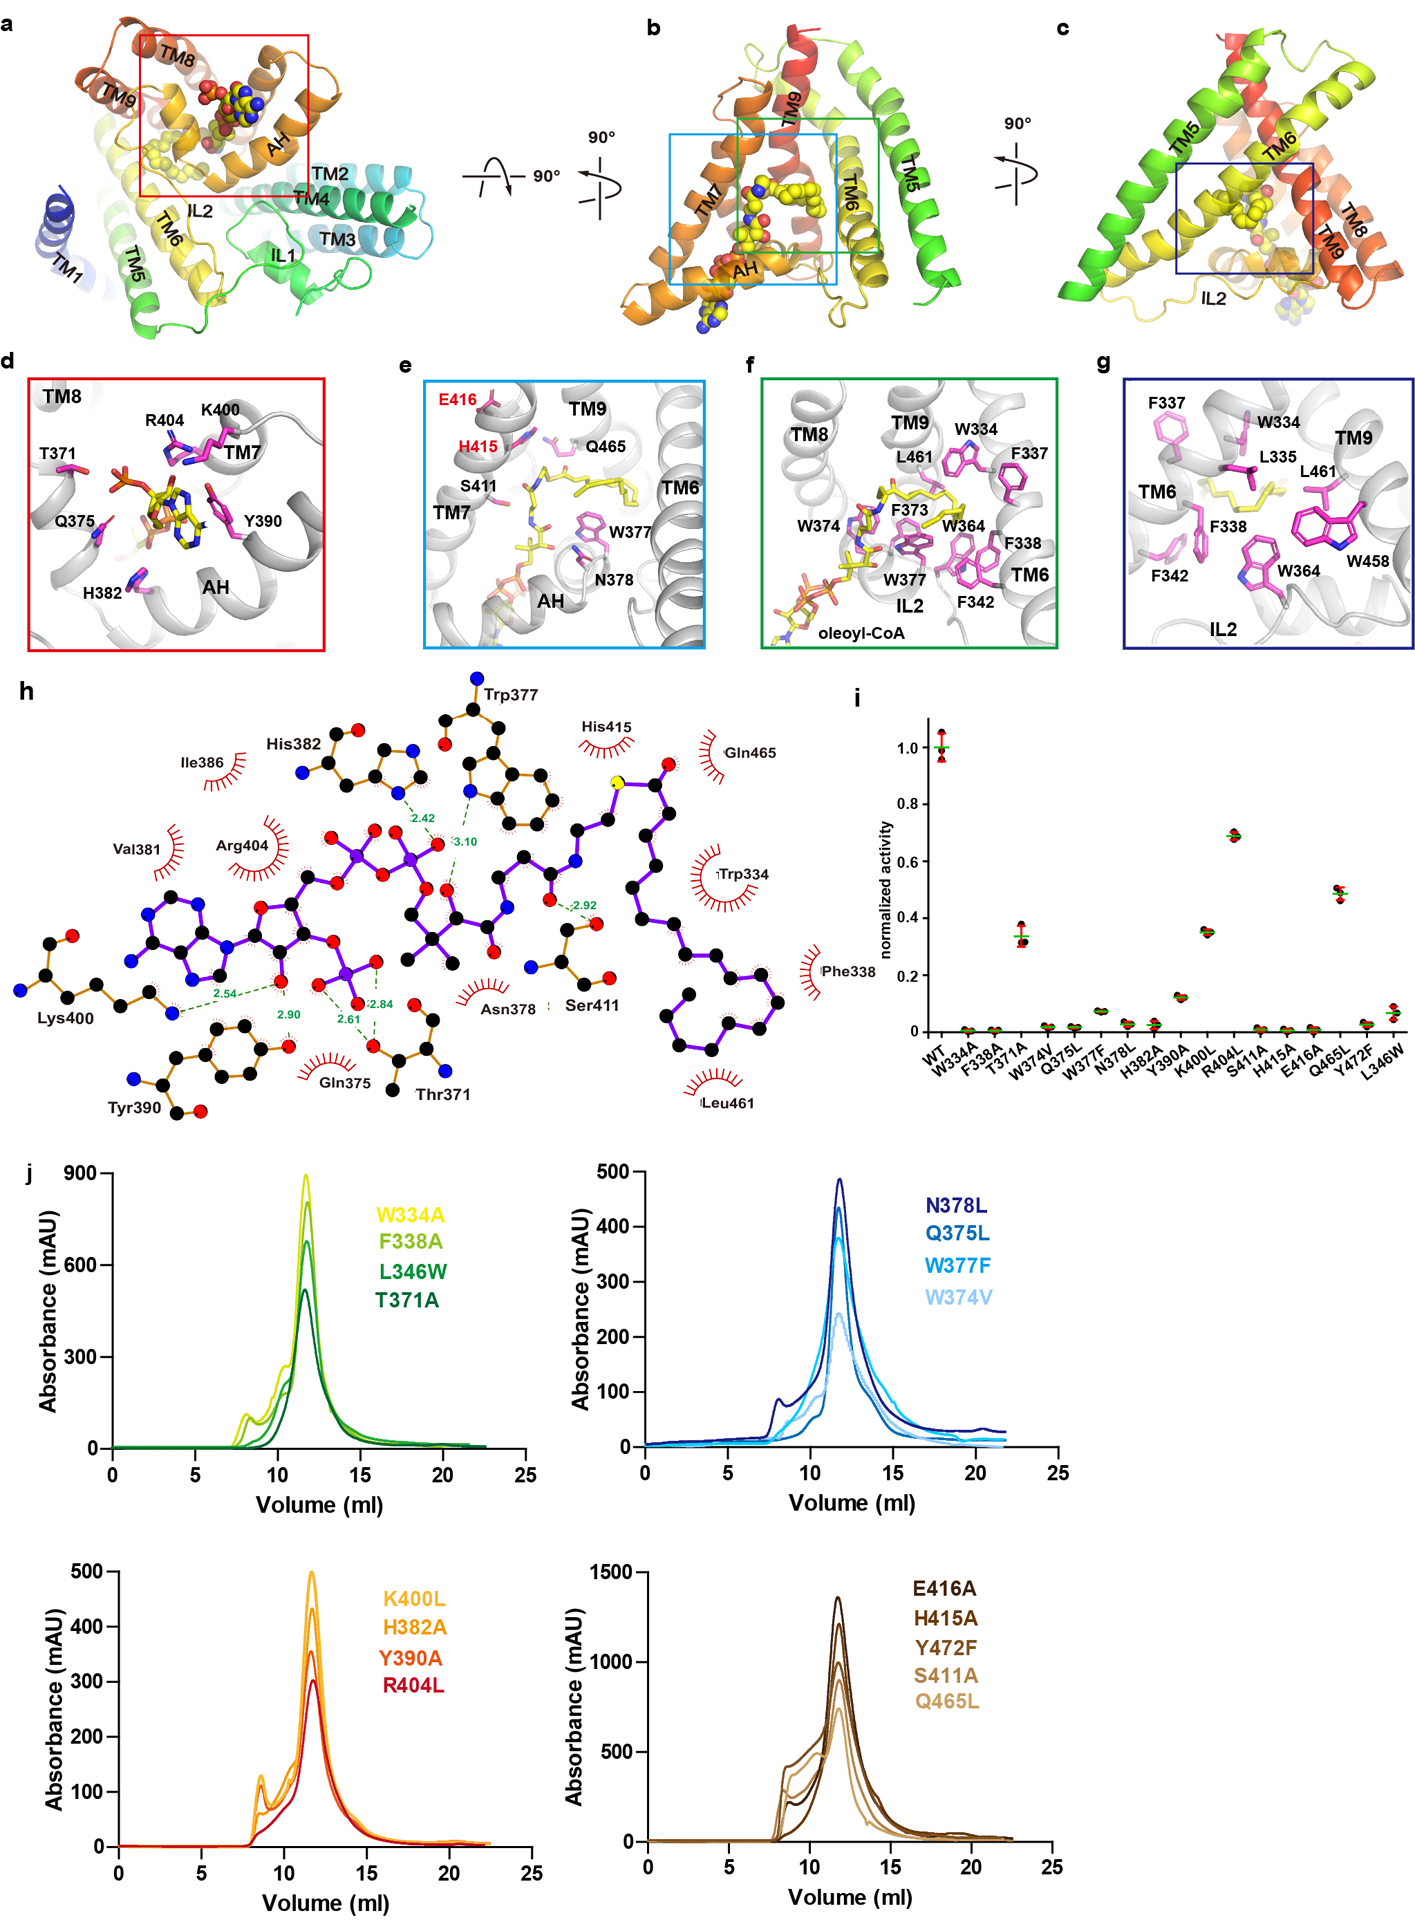
a-c. Oleoyl-CoA (spheres) bound to hDGAT1 protomer (cartoon) in three orientations. Details are shown in d-g. Residues coordinating oleoyl-CoA are shown as sticks with carbon atoms in magenta. h. LigPlus42,43 plot of the oleoyl-CoA binding site. i. Normalized enzymatic activity of hDGAT1 wild type and mutants. Error bars are s.e.m. derived from three independent repeats. j. Size-exclusion profiles of hDGAT1 mutants. Experiments in i were repeated independently 3 times with similar results.
Extended Data Figure 7. DGAT1 sequence alignment.
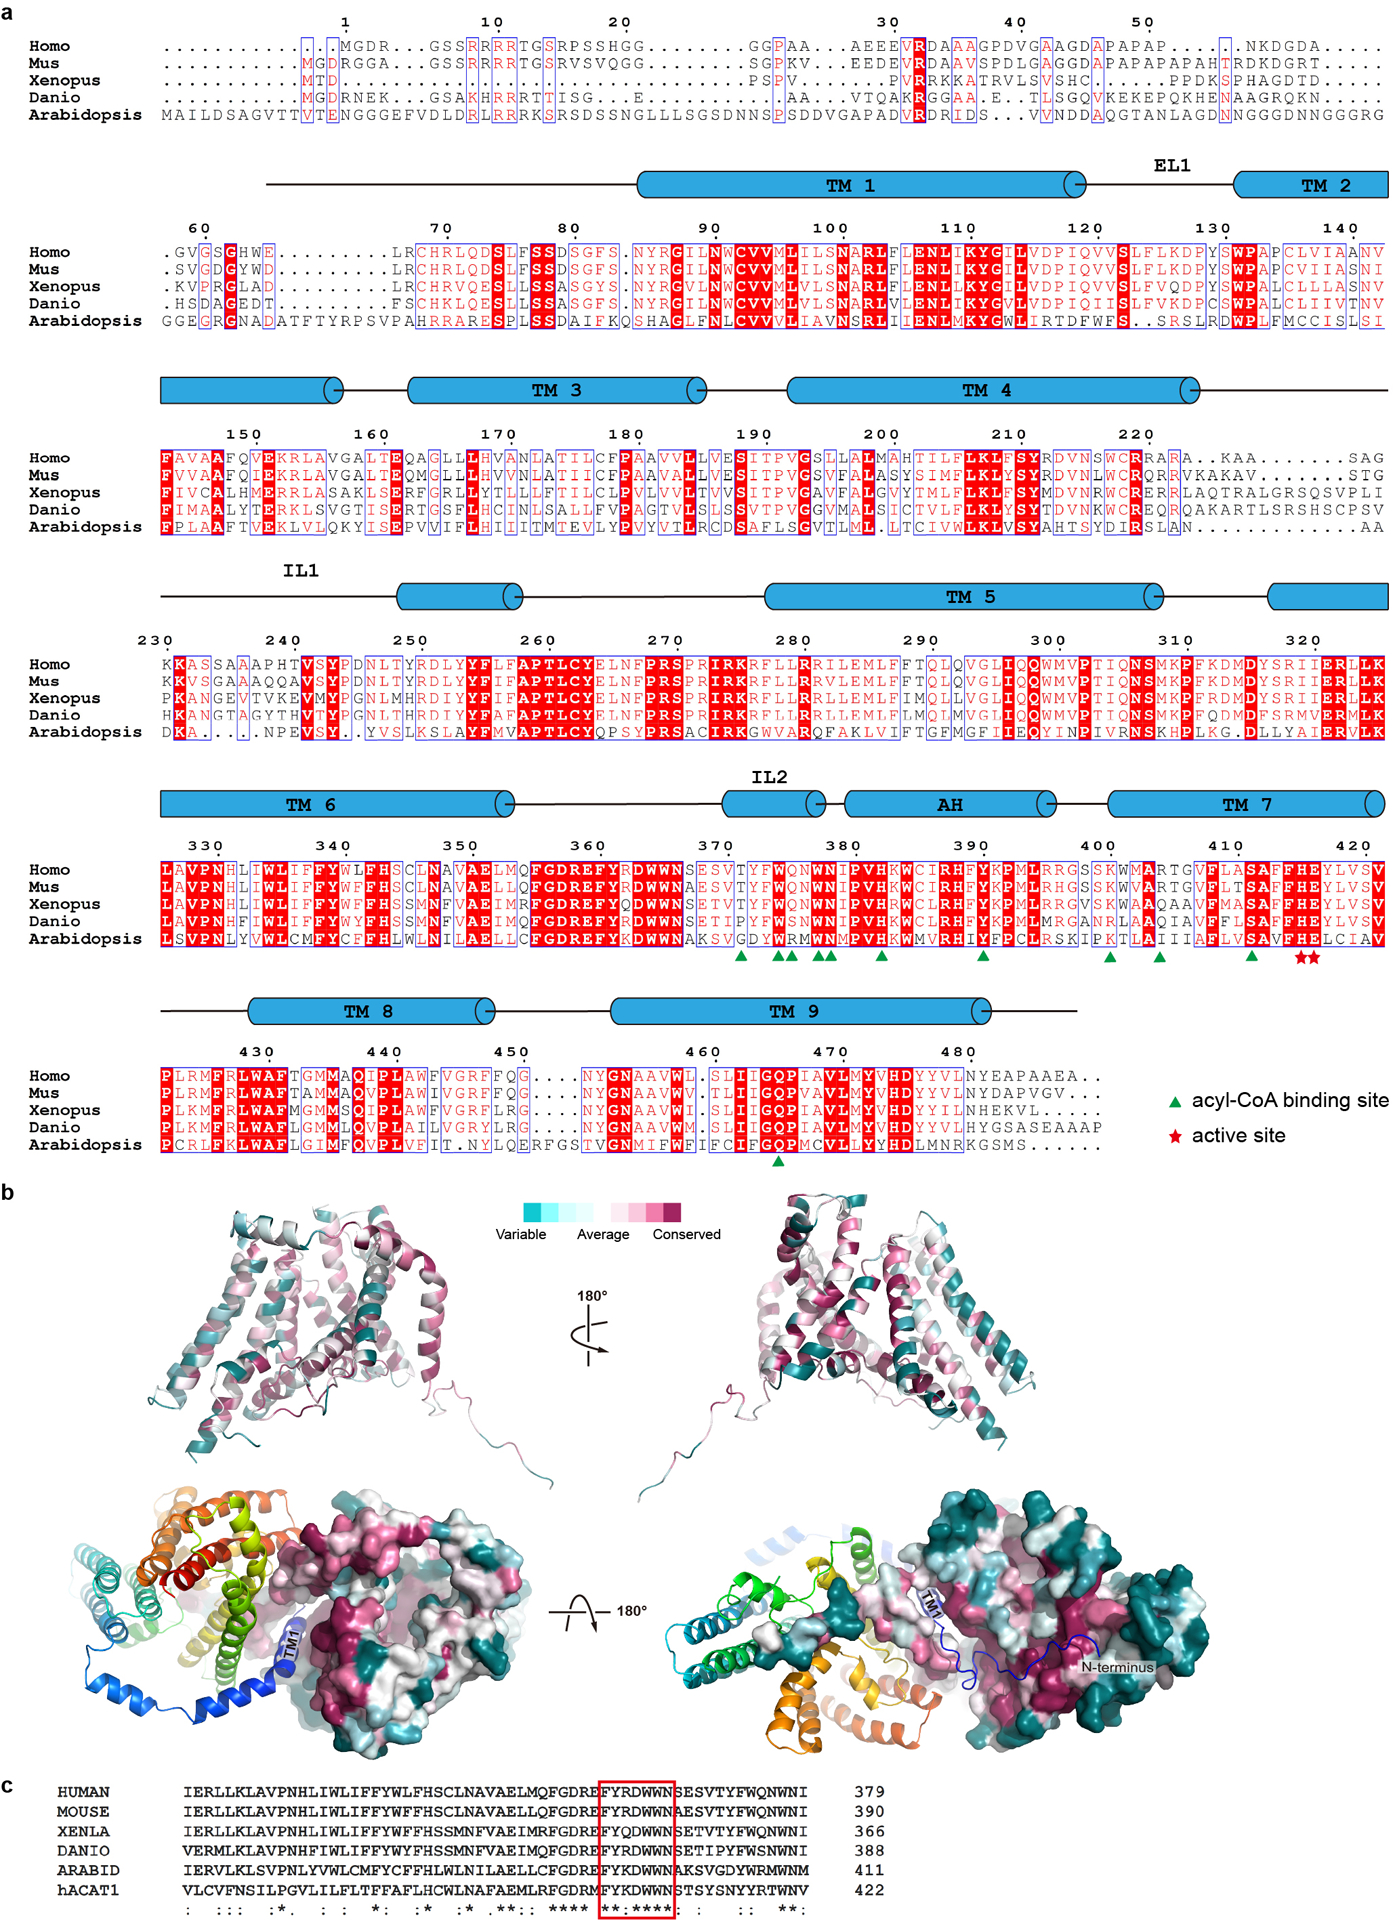
a. DGAT1 of human (Homo, Uniprot accession number O75907), mouse (Mus, Q9Z2A7), frog (Xenopus, A0A1L8G0L4), fish (Danio, Q6P3J0), and thale cress (Arabidopsis, Q9SLD2) are aligned using the Clustal Omega server44. Secondary structural elements of hDGAT1 are marked above the alignment. Residues are colored based on their conservation using the ESPript server45. Residues at the acyl-CoA binding site are marked with green triangles and those at the active site with red stars. b. Consurf mapped onto hDGAT1 structure. hDGAT1 is shown in different orientations in cartoon (top) and surface (bottom) representations. One hDGAT1 monomer is colored based on the conservation score of each residue, calculated by the Consurf server46. c. Sequence alignments of the FYXDWWN motif (red rectangle) from DGAT1 of different species and human ACAT1 (Uniprot accession number: P35610).
Extended Data Figure 8. Proposed gateway for DAG entry.
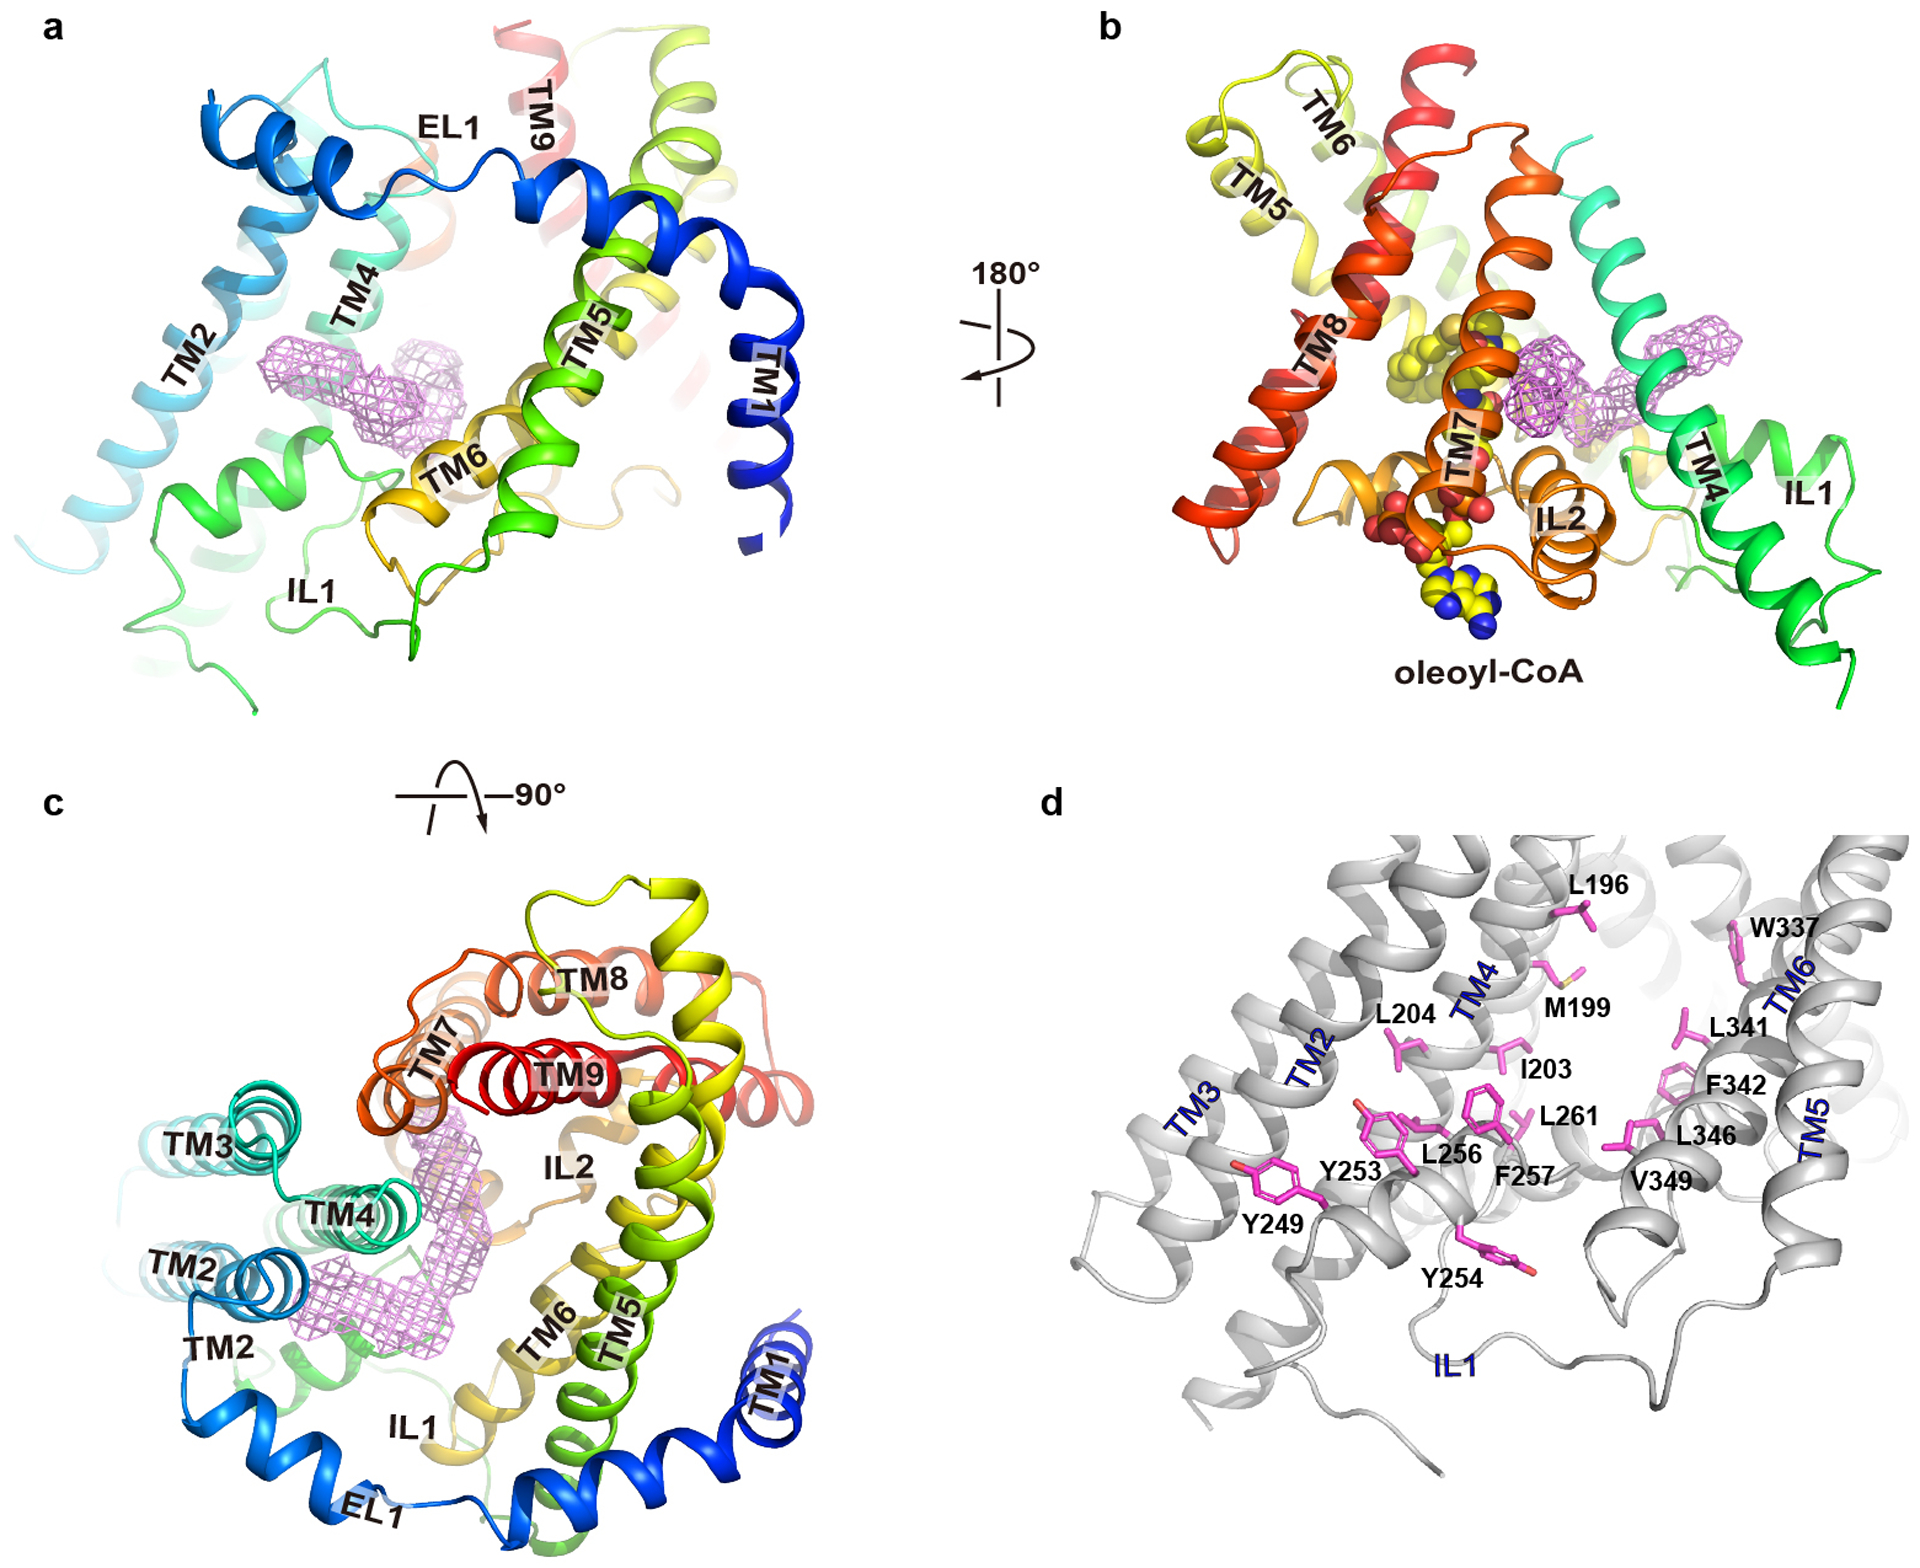
a-c. A large opening to the core of the membrane is framed by TM4 and TM6. A tubular density is observed extending into the reaction chamber. d. Residues that line the opening are shown as magenta sticks.
Extended Data Table 1 |.
Summary of Cryo-EM data collection, processing and structure refinement
| hDGATl (EMDB-21302) (PDB 6VP0) |
|
|---|---|
| Data collection and processing | |
| Magnification | 105,000 |
| Voltage (kV) | 300 |
| Electron exposure (e–/Å2) | 50 |
| Defocus range (nm) | [−2.0,−1.2] |
| Pixel size (Å) | 1.114 |
| Symmetry imposed | C2 |
| Initial particle images (no.) | 2,749,110 |
| Final particle images (no.) | 275,945 |
| Map resolution (Å) | 3.1 |
| FSC threshold | 0.143 |
| Map resolution range (Å) | 2.7–4.3 |
| Refinement | |
| Initial model used (PDB code) | 6VP0 |
| Model resolution (Å) | 3.24 |
| FSC threshold | 0.5 |
| Model resolution range (Å) | 3.24–3.33 |
| Map sharpening B factor (Å2) | −100 |
| Model composition | |
| Non-hydrogen atoms | 7212 |
| Protein residues | 808 |
| Ligands | 12 |
| B factors (Å2) | |
| Protein | 70.5 |
| Ligand | 78.1 |
| R.m.s. deviations | |
| Bond lengths (Å) | 0.005 |
| Bond angles (°) | 1.129 |
| Validation | |
| MolProbity score | 1.69 |
| Clashscore | 4.65 |
| Poor rotamers (%) | 1.96 |
| Ramachandran plot | |
| Favored (%) | 96.5 |
| Allowed (%) | 3.5 |
| Disallowed (%) | 0 |
Extended Data Table 2 |. Functional parameters of hDGAT1 and mutants.
KM and Vmax values were obtained from fitting the initial rate versus concentration plots shown in Fig. 1–2, and Extended Data Fig. 2 with equations defined in Methods. The errors are 95% confidence intervals. For each concentration of substrates, the rate was measured 3 times independently. Mutations marked with stars do not have sufficient enzymatic activity for estimation of the initial rate.
| substrates/mutants/truncations | KM (μM) | Vmax (pmol/min/μg) |
|---|---|---|
| oleoyl-CoA | 14.6 ± 1.3 | 956.6 ± 36.1 |
| stearoyl-CoA | 8.6 ± 1.3 | 839.4 ± 49.9 |
| palmitoleoyl-CoA | 6.2 ± 0.9 | 838.6 ± 31.6 |
| palmitoyl-CoA | 6.4 ± 1.1 | 767.8 ± 34.0 |
| octodecyl-CoA | 10.5 ± 1.4 | 642.9 ± 25.0 |
| 1,2-dioleoyl-sn-glycerol | 597.1 ± 94.5 | 3310 ± 279.1 (h = 1.5) |
| WT (dimer) | 14.6 ± 1.3 | 956.6 ± 36.1 |
| WT (tetramer) | 16.6 ± 2.2 | 1080.8 ± 45.3 |
| WT (membrane) | 15.9 ± 1.3 | 1643.4 ± 36.4 |
| W334A | * | * |
| F338A | * | * |
| L346W | * | * |
| T371A | - | - |
| W374V | * | * |
| Q375L | * | * |
| W377A | - | - |
| N378L | * | * |
| H382A | * | * |
| Y390A | * | * |
| K400L | - | - |
| R404L | - | - |
| S411A | * | * |
| H415A | * | * |
| E416A | * | * |
| Q465L | - | - |
| Y472F | * | * |
| ΔN65 | 13.9 ± 2.6 | 563.9 ± 32.5 |
| ΔN70 | 24.4 ± 1.5 | 540.7 ± 25.5 |
| ΔN75 | 28.2 ± 3.1 | 497.8 ± 21.9 |
| ΔN80 | 28.6 ± 4.2 | 276.1 ± 16.4 |
| ΔN84 | * | * |
Supplementary Material
Acknowledgments
This work was supported by grants from NIH (DK122784, HL086392 and GM098878 to M.Z.), Cancer Prevention and Research Institute of Texas (R1223 to M.Z.), the Robert Welch Foundation (Q1279 to B.V.V.P.), Ara Parseghian Medical Research Foundation (to N.Y. and Y.H.), and the New Jersey Council for Cancer Research (to H.Q.). N.Y. is supported by the Shirley M. Tilghman endowed professorship from Princeton University. We thank Paul Shao for technical support during EM image acquisition. We acknowledge the use of Princeton’s Imaging and Analysis Center, which is partially supported by the Princeton Center for Complex Materials, and the National Science Foundation (NSF)-MRSEC program (DMR-1420541).
Footnotes
Competing interests
The authors declare no competing financial interests.
Data Availability
The atomic coordinates of hDGAT1 have been deposited in the PDB (http://www.rcsb.org) under the accession codes 6VP0. The corresponding electron microscopy maps have been deposited in the Electron Microscopy Data Bank (https://www.ebi.ac.uk/pdbe/emdb/) under the accession codes EMD-21302.
References
- 1.Cases S et al. Identification of a gene encoding an acyl CoA:diacylglycerol acyltransferase, a key enzyme in triacylglycerol synthesis. Proceedings of the National Academy of Sciences 95, 13018, doi: 10.1073/pnas.95.22.13018 (1998). [DOI] [PMC free article] [PubMed] [Google Scholar]
- 2.Das A, Davis MA & Rudel LL Identification of putative active site residues of ACAT enzymes. Journal of lipid research 49, 1770–1781, doi: 10.1194/jlr.M800131-JLR200 (2008). [DOI] [PMC free article] [PubMed] [Google Scholar]
- 3.Nusse R Wnt signaling in disease and in development. Cell Research 15, 28–32, doi: 10.1038/sj.cr.7290260 (2005). [DOI] [PubMed] [Google Scholar]
- 4.Yen C-LE, Nelson DW & Yen M-I Intestinal triacylglycerol synthesis in fat absorption and systemic energy metabolism. Journal of lipid research 56, 489–501, doi: 10.1194/jlr.R052902 (2015). [DOI] [PMC free article] [PubMed] [Google Scholar]
- 5.Yen C-LE, Stone SJ, Koliwad S, Harris C & Farese RV Jr. Thematic review series: glycerolipids. DGAT enzymes and triacylglycerol biosynthesis. Journal of lipid research 49, 2283–2301, doi: 10.1194/jlr.R800018-JLR200 (2008). [DOI] [PMC free article] [PubMed] [Google Scholar]
- 6.Bhatt-Wessel B, Jordan TW, Miller JH & Peng L Role of DGAT enzymes in triacylglycerol metabolism. Archives of Biochemistry and Biophysics 655, 1–11, doi: 10.1016/j.abb.2018.08.001 (2018). [DOI] [PubMed] [Google Scholar]
- 7.Kühn C et al. Evidence for multiple alleles at the DGAT1 locus better explains a quantitative trait locus with major effect on milk fat content in cattle. Genetics 167, 1873–1881, doi: 10.1534/genetics.103.022749 (2004). [DOI] [PMC free article] [PubMed] [Google Scholar]
- 8.Smith SJ et al. Obesity resistance and multiple mechanisms of triglyceride synthesis in mice lacking Dgat. Nature Genetics 25, 87–90, doi: 10.1038/75651 (2000). [DOI] [PubMed] [Google Scholar]
- 9.Chen HC et al. Increased insulin and leptin sensitivity in mice lacking acyl CoA:diacylglycerol acyltransferase 1. The Journal of clinical investigation 109, 1049–1055, doi: 10.1172/JCI14672 (2002). [DOI] [PMC free article] [PubMed] [Google Scholar]
- 10.Zhao G et al. Validation of Diacyl Glycerolacyltransferase I as a Novel Target for the Treatment of Obesity and Dyslipidemia Using a Potent and Selective Small Molecule Inhibitor. Journal of Medicinal Chemistry 51, 380–383, doi: 10.1021/jm7013887 (2008). [DOI] [PubMed] [Google Scholar]
- 11.McFie PJ, Stone SL, Banman SL & Stone SJ Topological Orientation of Acyl-CoA:Diacylglycerol Acyltransferase-1 (DGAT1) and Identification of a Putative Active Site Histidine and the Role of the N Terminus in Dimer/Tetramer Formation. Journal of Biological Chemistry 285, 37377–37387 (2010). [DOI] [PMC free article] [PubMed] [Google Scholar]
- 12.Yang J, Brown MS, Liang G, Grishin NV & Goldstein JL Identification of the Acyltransferase that Octanoylates Ghrelin, an Appetite-Stimulating Peptide Hormone. Cell 132, 387–396, doi: 10.1016/j.cell.2008.01.017 (2008). [DOI] [PubMed] [Google Scholar]
- 13.Ma D et al. Crystal structure of a membrane-bound O-acyltransferase. Nature 562, 286–290, doi: 10.1038/s41586-018-0568-2 (2018). [DOI] [PMC free article] [PubMed] [Google Scholar]
- 14.Cheng D et al. Human acyl-CoA:diacylglycerol acyltransferase is a tetrameric protein. The Biochemical journal 359, 707–714 (2001). [DOI] [PMC free article] [PubMed] [Google Scholar]
- 15.Zhang J et al. Monoacylglycerol Acyltransferase-2 Is a Tetrameric Enzyme That Selectively Heterodimerizes with Diacylglycerol Acyltransferase-1. Journal of Biological Chemistry 289, 10909–10918 (2014). [DOI] [PMC free article] [PubMed] [Google Scholar]
- 16.Orland MD et al. Acyl coenzyme A dependent retinol esterification by acyl coenzyme A:diacylglycerol acyltransferase 1. Biochimica et Biophysica Acta (BBA) - Molecular and Cell Biology of Lipids 1737, 76–82, doi: 10.1016/j.bbalip.2005.09.003 (2005). [DOI] [PubMed] [Google Scholar]
- 17.von Heijne G & Gavel Y Topogenic signals in integral membrane proteins. European Journal of Biochemistry 174, 671–678, doi: 10.1111/j.1432-1033.1988.tb14150.x (1988). [DOI] [PubMed] [Google Scholar]
- 18.Caldo KMP et al. Diacylglycerol Acyltransferase 1 Is Regulated by Its N-Terminal Domain in Response to Allosteric Effectors. Plant physiology 175, 667–680, doi: 10.1104/pp.17.00934 (2017). [DOI] [PMC free article] [PubMed] [Google Scholar]
- 19.Weselake RJ et al. Acyl-CoA-binding and self-associating properties of a recombinant 13.3 kDa N-terminal fragment of diacylglycerol acyltransferase-1 from oilseed rape. BMC biochemistry 7, 24–24, doi: 10.1186/1471-2091-7-24 (2006). [DOI] [PMC free article] [PubMed] [Google Scholar]
- 20.Panigrahi R et al. Intrinsic disorder in the regulatory N-terminal domain of diacylglycerol acyltransferase 1 from Brassica napus. Sci Rep 8, 16665–16665, doi: 10.1038/s41598-018-34339-1 (2018). [DOI] [PMC free article] [PubMed] [Google Scholar]
- 21.Guo Z, Cromley D, Billheimer JT & Sturley SL Identification of potential substrate-binding sites in yeast and human acyl-CoA sterol acyltransferases by mutagenesis of conserved sequences. Journal of Lipid Research 42, 1282–1291 (2001). [PubMed] [Google Scholar]
- 22.Bai Y et al. X-ray structure of a mammalian stearoyl-CoA desaturase. Nature 524, 252–256, doi: 10.1038/nature14549 (2015). [DOI] [PMC free article] [PubMed] [Google Scholar]
- 23.Mastronarde DN Automated electron microscope tomography using robust prediction of specimen movements. J Struct Biol 152, 36–51, doi: 10.1016/j.jsb.2005.07.007 (2005). [DOI] [PubMed] [Google Scholar]
- 24.Zheng SQ et al. MotionCor2: anisotropic correction of beam-induced motion for improved cryo-electron microscopy. Nat Methods 14, 331–332, doi: 10.1038/nmeth.4193 (2017). [DOI] [PMC free article] [PubMed] [Google Scholar]
- 25.Grant T & Grigorieff N Measuring the optimal exposure for single particle cryo-EM using a 2.6 A reconstruction of rotavirus VP6. Elife 4, e06980, doi: 10.7554/eLife.06980 (2015). [DOI] [PMC free article] [PubMed] [Google Scholar]
- 26.Zhang K Gctf: Real-time CTF determination and correction. J Struct Biol 193, 1–12, doi: 10.1016/j.jsb.2015.11.003 (2016). [DOI] [PMC free article] [PubMed] [Google Scholar]
- 27.Scheres SH Semi-automated selection of cryo-EM particles in RELION-1.3. J Struct Biol 189, 114–122, doi: 10.1016/j.jsb.2014.11.010 (2015). [DOI] [PMC free article] [PubMed] [Google Scholar]
- 28.Scheres SH RELION: implementation of a Bayesian approach to cryo-EM structure determination. J Struct Biol 180, 519–530, doi: 10.1016/j.jsb.2012.09.006 (2012). [DOI] [PMC free article] [PubMed] [Google Scholar]
- 29.Kimanius D, Forsberg BO, Scheres SH & Lindahl E Accelerated cryo-EM structure determination with parallelisation using GPUs in RELION-2. Elife 5, doi: 10.7554/eLife.18722 (2016). [DOI] [PMC free article] [PubMed] [Google Scholar]
- 30.Punjani A, Rubinstein JL, Fleet DJ & Brubaker MA cryoSPARC: algorithms for rapid unsupervised cryo-EM structure determination. Nature Methods 14, 290–296, doi: 10.1038/nmeth.4169 (2017). [DOI] [PubMed] [Google Scholar]
- 31.Rosenthal PB & Henderson R Optimal determination of particle orientation, absolute hand, and contrast loss in single-particle electron cryomicroscopy. J Mol Biol 333, 721–745 (2003). [DOI] [PubMed] [Google Scholar]
- 32.Chen S et al. High-resolution noise substitution to measure overfitting and validate resolution in 3D structure determination by single particle electron cryomicroscopy. Ultramicroscopy 135, 24–35, doi: 10.1016/j.ultramic.2013.06.004 (2013). [DOI] [PMC free article] [PubMed] [Google Scholar]
- 33.Kucukelbir A, Sigworth FJ & Tagare HD Quantifying the local resolution of cryo-EM density maps. Nature Methods 11, 63–65, doi: 10.1038/nmeth.2727 (2014). [DOI] [PMC free article] [PubMed] [Google Scholar]
- 34.Emsley P, Lohkamp B, Scott WG & Cowtan K Features and development of Coot. Acta crystallographica. Section D, Biological crystallography 66, 486–501, doi: 10.1107/S0907444910007493 (2010). [DOI] [PMC free article] [PubMed] [Google Scholar]
- 35.Adams PD et al. PHENIX: a comprehensive Python-based system for macromolecular structure solution. Acta crystallographica. Section D, Biological crystallography 66, 213–221, doi: 10.1107/S0907444909052925 (2010). [DOI] [PMC free article] [PubMed] [Google Scholar]
- 36.Barad BA et al. EMRinger: side chain-directed model and map validation for 3D cryo-electron microscopy. Nature methods 12, 943–946, doi: 10.1038/nmeth.3541 (2015). [DOI] [PMC free article] [PubMed] [Google Scholar]
- 37.Rana MS et al. Fatty acyl recognition and transfer by an integral membrane S-acyltransferase. Science (New York, N.Y.) 359, eaao6326, doi: 10.1126/science.aao6326 (2018). [DOI] [PMC free article] [PubMed] [Google Scholar]
- 38.Stanley CJ & Perham RN Purification of 2-oxo acid dehydrogenase multienzyme complexes from ox heart by a new method. The Biochemical journal 191, 147–154, doi: 10.1042/bj1910147 (1980). [DOI] [PMC free article] [PubMed] [Google Scholar]
- 39.Ren Z et al. Structure of an EIIC sugar transporter trapped in an inward-facing conformation. Proceedings of the National Academy of Sciences of the United States of America 115, 5962–5967, doi: 10.1073/pnas.1800647115 (2018). [DOI] [PMC free article] [PubMed] [Google Scholar]
- 40.Cao J et al. Targeting Acyl-CoA:diacylglycerol acyltransferase 1 (DGAT1) with small molecule inhibitors for the treatment of metabolic diseases. The Journal of biological chemistry 286, 41838–41851, doi: 10.1074/jbc.M111.245456 (2011). [DOI] [PMC free article] [PubMed] [Google Scholar]
- 41.Baker NA, Sept D, Joseph S, Holst MJ & McCammon JA Electrostatics of nanosystems: Application to microtubules and the ribosome. Proceedings of the National Academy of Sciences 98, 10037 (2001). [DOI] [PMC free article] [PubMed] [Google Scholar]
- 42.Wallace AC, Laskowski RA & Thornton JM LIGPLOT: a program to generate schematic diagrams of protein-ligand interactions. Protein Engineering, Design and Selection 8, 127–134, doi: 10.1093/protein/8.2.127 (1995). [DOI] [PubMed] [Google Scholar]
- 43.Laskowski RA & Swindells MB LigPlot+: Multiple Ligand–Protein Interaction Diagrams for Drug Discovery. Journal of Chemical Information and Modeling 51, 2778–2786, doi: 10.1021/ci200227u (2011). [DOI] [PubMed] [Google Scholar]
- 44.Sievers F et al. Fast, scalable generation of high-quality protein multiple sequence alignments using Clustal Omega. Molecular systems biology 7, 539–539, doi: 10.1038/msb.2011.75 (2011). [DOI] [PMC free article] [PubMed] [Google Scholar]
- 45.Robert X & Gouet P Deciphering key features in protein structures with the new ENDscript server. Nucleic Acids Research 42, W320–W324, doi: 10.1093/nar/gku316 (2014). [DOI] [PMC free article] [PubMed] [Google Scholar]
- 46.Landau M et al. ConSurf 2005: the projection of evolutionary conservation scores of residues on protein structures. Nucleic acids research 33, W299–W302, doi: 10.1093/nar/gki370 (2005). [DOI] [PMC free article] [PubMed] [Google Scholar]
Associated Data
This section collects any data citations, data availability statements, or supplementary materials included in this article.


