Abstract
Purpose:
Chairside surface adjustments of zirconia dental restorations enhance the toughening stress-induced tetragonal-to-monoclinic phase transformation and domain reorientation by ferro-elastic domain switching (FDS), but also trigger subsurface damage, which could compromise long-term clinical performance. The purpose of this study was to assess the depth of phase transformation, associated FDS, and flexural strength of dental zirconia (BruxZir HT 2.0), after chairside surface treatments.
Materials and Methods:
Square specimens were sectioned from CAD/CAM blocks and sintered according to manufacturer’s recommendations (n = 30). They were left as-sintered (AS; control), air abraded with fine (AAF) or coarse (AAC) alumina particles, ground (G) or ground and polished (GP). Roughness was measured by profilometry. Crystalline phases were investigated by grazing incidence X-ray diffraction (GIXRD) (n = 3). GIXRD data were fit using semi-log regression protocols to assess transformation depth and extent of FDS. The mean biaxial flexural strength was measured according to ISO 6872. Subsurface damage was assessed from SEM images using a bonded polished interface configuration. Flaw distribution was assessed by Weibull analysis. Results were analyzed by Kruskal-Wallis with Tukey’s adjustment for multiple comparisons (p < 0.05).
Results:
Air-abraded and ground groups exhibited higher mean surface roughness than control. AAF group exhibited the highest flexural strength (1662.6 ± 202.6 MPa) with flaw size (5.9 ± 1.8 μm) smaller than transformation (14.5 ± 1.2 μm) or FDS depth (19.3 ± 1.1 μm), followed by GP group (1567.2 ± 209.7 MPa) with smallest FDS depth (9.3 ± 2.0 μm) and flaw size (2.6 ± 1.8 μm), but without m-phase. AAC group (1371.4 ± 147.6 MPa) had the largest flaw size (40.3 ± 20.3 μm), transformation depth (47.2 ± 3.0 μm) and FDS depth (41.2 ± 2.2 μm). G group (1357.0 ± 196.7 MPa) had the smallest transformation depth (8.6 ± 1.5 μm), and mean FDS depth (19.8 ± 3.7 μm) and flaw size (18.6 ± 3.1 μm). AAC and AAF exhibited the highest Weibull modulus (11.2 ± 0.4 and 9.8 ± 0.3 μm, respectively).
Conclusions:
Variations in mean biaxial flexural strength were explained by the balance between the depth of toughening mechanisms (phase transformation and FDS) and subsurface damage. AAF and GP groups were the most efficient surface adjustments in promoting the highest mean biaxial flexural strength.
Keywords: 3Y-TZP, air abrasion, chairside treatment, dental, zirconia
To date, zirconia dental ceramics have had an excellent clinical performance with a cumulative 5-year survival rate of 92.1% for zirconia-based all-ceramic single crowns,1 and 90.4% for tooth-supported fixed dental prostheses.2 Zirconia dental restorations are fabricated through the soft machining process, using computer-aided design/computer-aided manufacturing (CAD/CAM), and sintered at high temperature to achieve full density.3 The sintering temperature determines zirconia grain size, phase assemblage, and mechanical properties. Higher sintering temperatures lead to an increase in grain size, but a decrease in tetragonal content.4 Meanwhile, upon sintering, the pre-sintered zirconia blanks are subject to a dimensional shrinkage of approximately 20% to 25%.5 Although the shrinkage is compensated for by the computer-aided design, restorations often require clinical and laboratory surface adjustments to achieve optimal occlusion and proper seating. In addition, air abrasion is often recommended to improve bonding by creating micromechanical retentions between the restoration and luting cement.6,7
It is well established that chairside surface adjustments trigger the martensitic stress-induced transformation from the metastable tetragonal to the stable monoclinic phase (t-m).8 This transformation is associated with a substantial increase in volume (4.5%)9, combined with the formation of a net compressive stress field at the crack-tip, and an increase in toughness.10,11 The martensitic stress-induced transformation is an efficient toughening mechanism for zirconia and is associated with ferro-elastic domain switching (FDS).12,13
FDS is a reorientation of tetragonal zirconia crystalline domains. Polydomain tetragonal zirconia single crystals have crystallographically equivalent orientations of the c-axis. These domains can reorient (switching) by applied stress or in the presence of a propagating crack.12–14 FDS is detected by standard incidence X-ray diffraction (XRD) from a reversal of the relative intensities of the t(002) and t(200) tetragonal reflections.15 The switching of ferroelastic domains in tetragonal zirconia is also considered an efficient toughening mechanism since it occurs near the stress field of the crack tip and produces an energy absorption mechanism, leading to an increase in fracture toughness.13 Although stress-induced t-m transformation and FDS are both efficient toughening mechanisms for zirconia, they are different in nature, since the stress-induced transformation is reversed by heat treatment, whereas FDS is not.13 FDS also differs from stress-induced transformation in that there is no change in crystal structure, only a reorientation of twin domains after applied stress.12,13,16 These two unique toughening mechanisms largely explain the clinical success of zirconia in dentistry, exhibiting the highest fracture toughness and flexural strength of all dental ceramics currently available.
It is well established that chairside surface treatments trigger these toughening mechanisms, leading to an increase in the flexural strength of zirconia.8,17–22 However, as zirconia ceramics are intrinsically brittle, their flexural strength can be negatively affected by the production of surface and subsurface flaws.23,24 It has been shown that air abrasion with fine particles was most efficient in promoting the stress-induced t-m phase transformation, leading to significant increase in mean flexural strength.25 Surface modifications created by air abrasion with coarse particles or grinding with diamond-coated instruments led to mixed results, either increasing18,20 or decreasing the mean flexural strength.19,22 The extent of phase transformation induced by chairside adjustments has been shown to be sensitive to both instruments (e.g., particle size, grit size of the burs) and coolant system.21,25 However, polishing after grinding generally decreased the flaw size and also reduced the depth of the t-m phase transformation, leading to a decrease in strength.26
The effect of surface treatments on the microstructural changes of zirconia has been studied extensively.18,27 The techniques often used are standard incidence X-ray diffraction(XRD),17,18,28 atomic for cemicroscopy(AFM),12 scanning electron microscopy (SEM),18,28 and Raman spectroscopy.27,29 However, most of these techniques are limited to surface characterization and do not permit the evaluation of subsurface flaws or quantification of the depth of transformation, without damaging the specimens. Specific to metastable zirconia, any type of specimen preparation (e.g., sectioning) inevitably triggers the t-m phase transformation, leading to inaccurate results. Thus, in this study, we used a bonded polished interface configuration as described by Petersonetal30 to investigate subsurface damage. Briefly, two mirror polished zirconia specimen surfaces were bonded together, and the resultant top surfaces were subjected to various chairside treatments. After separation of the two bonded surfaces, subsurface damage was visualized by both optical microscopy and SEM. This technique provides an untouched cross-sectional snapshot of the treated specimens while avoiding further damage.
Another issue is that none of the techniques mentioned earlier permit in-depth phase characterization of surface-treated zirconia. Standard incidence XRD is commonly used to quantify the relative amount of monoclinic and tetragonal phases.19,21,22 However, these measurements give a global phase composition over the top 5 μm due to experimental setup and X-ray absorption.31 Meanwhile, grazing incidence XRD (GIXRD) permits phase analysis as a function of depth.15,31–34 The penetration of the X-ray beam into the specimen can be adjusted by varying the angle of incidence, where larger angles probe deeper into the material. In this study, GIXRD was used to characterize precise phase assemblage in zirconia as a function of depth.
Proper seating of CAD/CAM zirconia dental restorations often requires internal or occlusal adjustments of the restorations. These modifications usually trigger the t-m phase transformation and subsequent increase in flexural strength, but also lead to subsurface damage, which may compromise the long-term clinical performance of 3 mol% yttria-stabilized tetragonal zirconia polycrystals (3Y-TZP). Understanding the effect of surface modifications on the depth of the transformation, the extent of FDS, and subsurface damage are therefore critical for achieving successful and reliable restorations. The purpose of this study was to investigate the effect of clinically relevant (chairside or laboratory-performed) surface treatments on flexural strength, depth of stress-induced t-m phase transformation, and associated ferro-elastic domain switching of a commercially available monolithic dental zirconia (BruxZir HT 2.0; Glidewell Laboratories, Newport Beach, CA) using a bonded interface configuration, in combination with grazing incidence X-ray diffraction.
Materials and methods
Specimen preparation
Commercially available blanks of monolithic pre-sintered zirconia (BruxZir HT 2.0) were sectioned into squares (15 × 15 × 1.2 mm3), using a low-speed diamond saw (Buehler Isomet, Evanston, IL). Specimens (n = 30 per group) were sintered at 1580°C for 2.5 hours and furnace-cooled according to the manufacturer’s recommendations.35 The specimens were randomly assigned to various treatment groups as follows; (1) as-sintered (AS) (2) air abraded with fine alumina particles (50 μm) at pressure of 4 bars (AAF), (3) air abraded with coarse alumina particles (250 μm) at pressure of 4 bars (AAC), (4) ground with a fine grit diamond bur (856DEF.31.016; Brasseler, USA, Savannah, GA) with water spray cooling (G), and (5) ground with a fine-grit diamond bur with water spray cooling and further polished with recommended polishing kits (Diatlite, ZR; Brasseler, USA) (GP). The density of the sintered specimens was measured according to ASTM standard 1873–98,36 using a helium pycnometer (AccuPyc II 1340; Micromeritics, Norcross, GA).
Surface roughness and microstructure characterization
The surface roughness was analyzed by surface profilometry (Surftest SJ-210; Mitutoyo Corporation, Aurora, IL). The root mean square roughness (Rq) and highest average surface roughness (Rz) were measured on surface treated specimens (n = 5 per group) according to ASTM D7127–13.37 The mean real grain size was determined by the linear intercept method on scanning electron micrographs, as described in ASTM standard E112–96.38
Subsurface damage and defect characterization
The subsurface damage was assessed using a bonded polished interface configuration as described by Peterson et al.30 Barshaped specimens (10 × 6 × 4 mm3) were sectioned from monolithic pre-sintered zirconia blanks. After sintering, the largest surface of the specimens (10 × 6 mm2) was polished to a 1-μm finish. Two polished surfaces were bonded together, using a cyanoacrylate-based adhesive (n = 3 per group). The resultant top surfaces were treated according to the assigned groups. After separation of the polished surfaces by immersion in acetone, the subsurface damage was characterized by optical microscopy, using NIH ImageJ software (v1.51S; public domain). The depth of subsurface flaws was measured from the top surface to the deepest aspect of flaws. SEM (S-4800; Hitachi, Tokyo, Japan) was used to characterize and image the extent of the subsurface damage at higher magnification.
Crystalline phase characterization
Surface crystalline phases were analyzed by both standard incidence XRD and GIXRD on bulk specimens (n = 3 per group). Standard incidence XRD scans were performed in the twotheta range from 27° to 37° at a scanning rate of 0.5° per minute (Rigaku diffractometer, λ Cu Kα= 1.5406 Å). GIXRD was performed using parallel beam optics at various incidence angles, from 1° to 9°. By changing the incidence angle, the penetration depth also changed from 0.56 to 5.06 μm. The X-ray penetration depth (D) was calculated using the following equation.
| (1) |
Where μ is the X-ray absorption coefficient for 3Y-TZP (0.062 μm−1),33 and γ is the incidence angle.34 The monoclinic volume fraction was calculated using the equation proposed by Toraya et al, using the main reflection t(011) for the tetragonal phase, and the and m(111) reflections for the monoclinic phase.39 The extent of FDS was calculated from the ratio of intensities of t(002) to t(200) tetragonal reflections.13 Monoclinic volume fraction and FDS ratio as a function of depth were interpolated after fitting by semi-log linear regression. The maximum depth of the transformation was assessed by (1) the monoclinic volume fraction, with a control value of 0%; (2) the presence or absence of FDS, with a base value of 0.63, measured on the as-sintered specimens.
Biaxial flexural strength
The mean biaxial flexural strength was measured using a ballon-ring fixture following the method developed by Wachtman et al40 and modified according to Shetty et al,41,42 in which a circular groove supported a circle of freely moving ball bearings, rather than a continuous ring support. This setup is best in minimizing frictional stresses.43 Square specimens (n = 30 per group) were loaded at the center of the support circle, with the treated side in tension. The use of square rather than circular specimens was also validated by Shetty et al’s studies,41,42 demonstrating that “stress distribution in a square specimen is nearly identical to that in a circular specimen,” so that “the overhang portion of the plate has negligible influence on the stress distribution within the support ring.”42 Testing was performed at a 0.5 mm/min crosshead speed, using a universal testing machine (Instron 5965; Instron Corp., Canton, MA). The mean flexural strength was calculated from the failure loads, according to ISO standard 6872.44
Statistical methods
Results were analyzed by the Kruskal-Wallis test with Tukey’s adjustment for multiple comparisons (p < 0.05). The relationship between surface roughness and mean flaw size was analyzed by linear regression. GIXRD data were fit using various linear regression protocols as described earlier. Weibull parameters (Weibull modulus: m, and characteristic strength, σθ) were determined using linear regression according to the method described by Wachtman et al,45 Quinn and Quinn,46 and ASTM C1239–13.47
Results
Density, grain size, and surface roughness
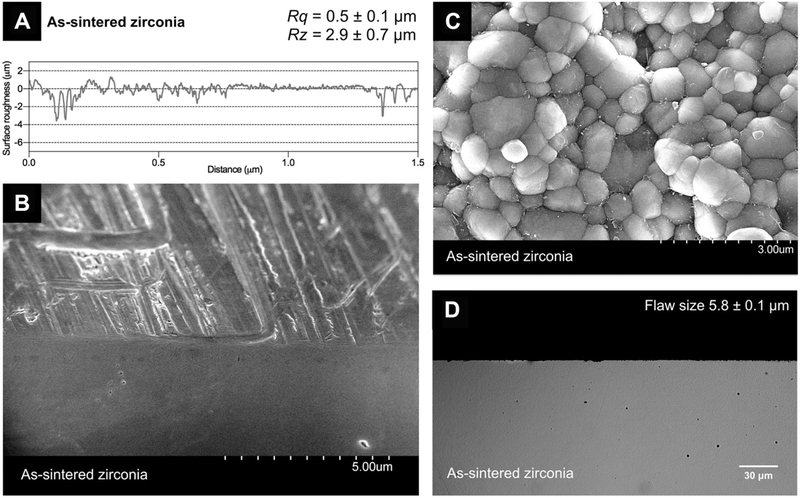
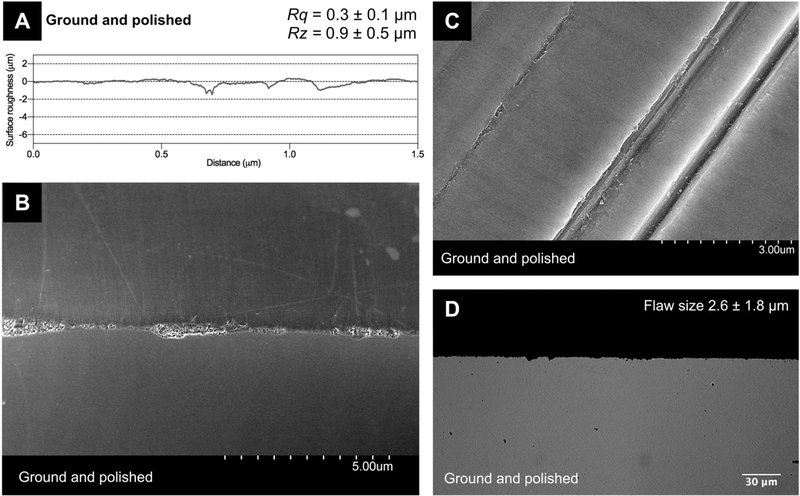
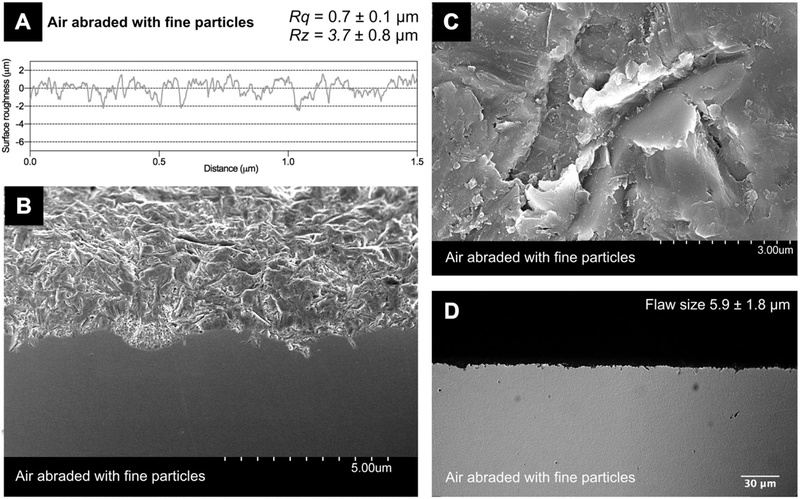
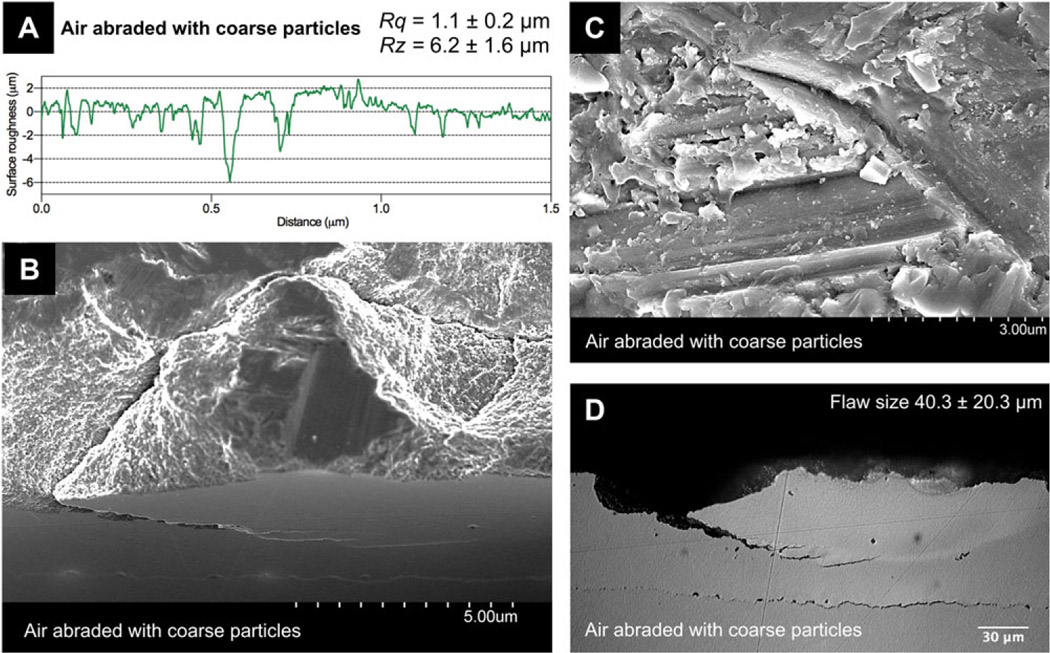
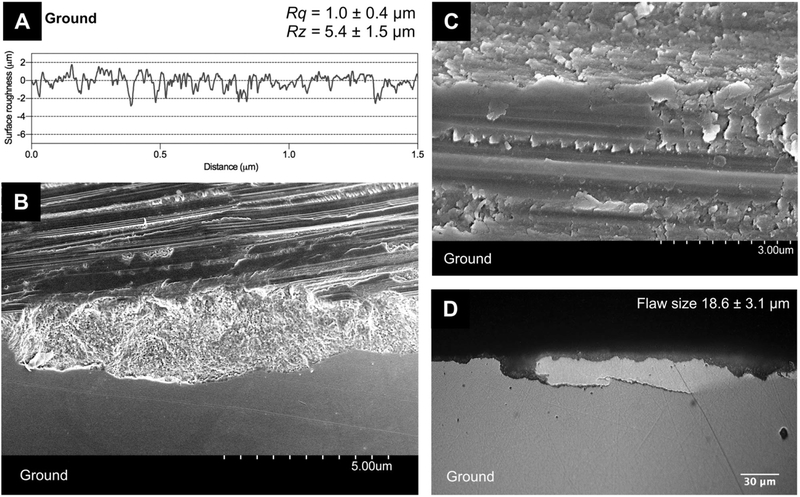
The mean density was 6.0631 ± 0.012 g/cm3. The mean real grain size of as-sintered specimens was 1.21 ± 0.16 μm. Surface roughness parameters (Rq and Rz) are summarized in Table 1. Surface roughness profiles are displayed in Figures 1A through 5A. Air abraded and ground groups had higher Rq and Rz than the control group, while there was no significant difference between the groups treated by air abrasion with coarse particles or grinding. The AAC group exhibited highest mean roughness depth (Rz), followed by G and AAF groups. A linear relationship between mean Rz roughness and the natural logarithm of flaw size was found (R2 = 0.941).
Table 1.
Mean surface roughness, monoclinic volume fraction measured by standard incidence XRD, transformations depth, flaw size, flexural strength, and Weibull parameters of various surface treatment groups
| Groups | Root mean square surface roughness: Rq (μ<m) (Mean ± SD) | Highest average surface roughness: Rz (μm) (Mean ± SD) | Flaw size (μm) (Mean ± SD) | Standard incidence XRD monoclinic volume fraction (%) (Mean ± SD) | GIXRD phase transformation depth (μm) (Mean ± SD) | FDS depth (μm) (Mean ± SD) | Flexural strength (MPa) (Mean ± SD) | Weibull modulus: m (Mean ± SD) | Characteristic strength: σθ (MPa) |
|---|---|---|---|---|---|---|---|---|---|
| AS | 0.5 ± 0.1a | 2.9 ± 0.7a | 5.8 ± 1.0a | traces | N/A | N/A | 1202.3 ± 141.9a | 9.0 ± 0.6b | 1275.7 |
| AAF | 0.7 ± 0.1b | 3.7 ± 0.8b | 5.9 ± 1.8a | 16.0 ± 1b | 14.5 ± 1.2a | 19.3 ± 1.1a | 1662.6 ± 202.6b | 9.8 ± 0.3a,b | 1755.4 |
| AAC | 1.1 ± 0.2c | 6.2 ± 1.6c | 40.3 ± 20.3b | 19.0 ± 2c | 47.2 ± 3.0b | 41.2 ± 2.2b | 1371.4 ± 147.6c | 11.2 ± 0.4a | 1428.3 |
| G | 1.0 ± 0.4c | 5.4 ± 1.5c | 18.6 ± 3.1c | 16.0 ± 1b | 8.6 ± 1.5c | 19.8 ± 3.7a | 1357.0 ± 196.7c | 8.3 ± 0.3b | 1446.2 |
| GP | 0.3 ± 0.1e | 0.9 ± 0.5e | 2.6 ± 1.8d | traces | N/A | 9.3 ± 2.0d | 1567.2 ± 209.7b | 8.4 ± 0.3b | 1663.9 |
Within columns, identical letters denote no statistically significant difference (p > 0.05)
Figure 1.
(A) Surface roughness profile of as-sintered group (AS). (B) Scanning electron micrographs in a 45° angled view. (C) Higher magnification of surface view. (D) Cross-sectional micrograph.
Figure 5.
(A) Surface roughness profile of ground and polished group (GP). (B) Scanning electron micrographs in a 45° angled view. (C) Higher magnification of surface view. (D) Cross-sectional micrograph.
Subsurface damage and defect characterization
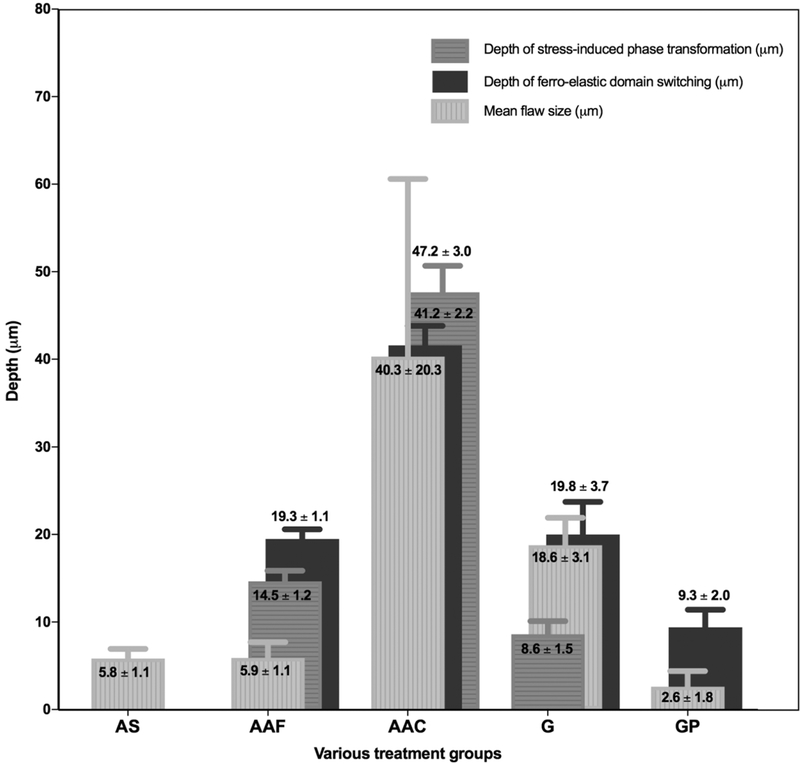
Optical and SEM micrographs are displayed in Figures 1 through 5. The mean flaw size measured on optical micrographs is summarized in Figure 6 and Table 1. The as-sintered specimens exhibited remnant grooves (5.8 ± 1.0 μm) from sectioning in the green state (Fig 1B). Zirconia grains are clearly seen at higher magnification (Fig 1C). Only minor subsurface damage was detected in cross-sectional optical micrographs (Fig 1D). Air abrasion with fine particles led to evenly distributed surface defects, with evidence of plastic deformation (Fig 2B, 2C). The mean subsurface flaw size was 5.9 ± 1.8 μm as shown in cross-sectional view (Fig 2D). Abrasion with coarse particles produced extensive surface damage with wide grooves and substantial plastic deformation on the treated surface(Fig 3B, 3C).Cross-sectional micrographs showed deep subsurface cracks extending parallel to the treated surface to a depth of 40.3 ± 20.3 μm (Fig 3D). Zirconia surfaces that were ground with a diamond bur exhibited deep sharp grooves, with an average flaw size of 18.6 ± 3.1 μm (Fig 4B, 4C). Flaws extending parallel to the ground surface were also noted (Fig 4D). The polished surface appeared optically smooth, but remaining grooves were present as seen at higher magnification (Fig 5B, 5C). The mean flaw size was 2.6 ± 1.8 μm (Fig 5D).
Figure 6.
Mean flaw size, depth of phase transformation and depth of ferro-elastic domain switching for various surface treatment groups.
Figure 2.
(A) Surface roughness profile of air abrasion with fine particles group (AAF). (B) Scanning electron micrographs in a 45° angled view. (C) Higher magnification of surface view. (D) Cross-sectional micrograph.
Figure 3.
(A) Surface roughness profile of air abrasion with coarse particles group (AAC). (B) Scanning electron micrographs in a 45° angled view. (C) Higher magnification of surface view. (D) Cross-sectional micrograph.
Figure 4.
(A) Surface roughness profile of ground group (G). B) Scanning electron micrographs in a 45° angled view. C) Higher magnification of surface view. D) Cross-sectional micrograph.
Crystalline phase characterization
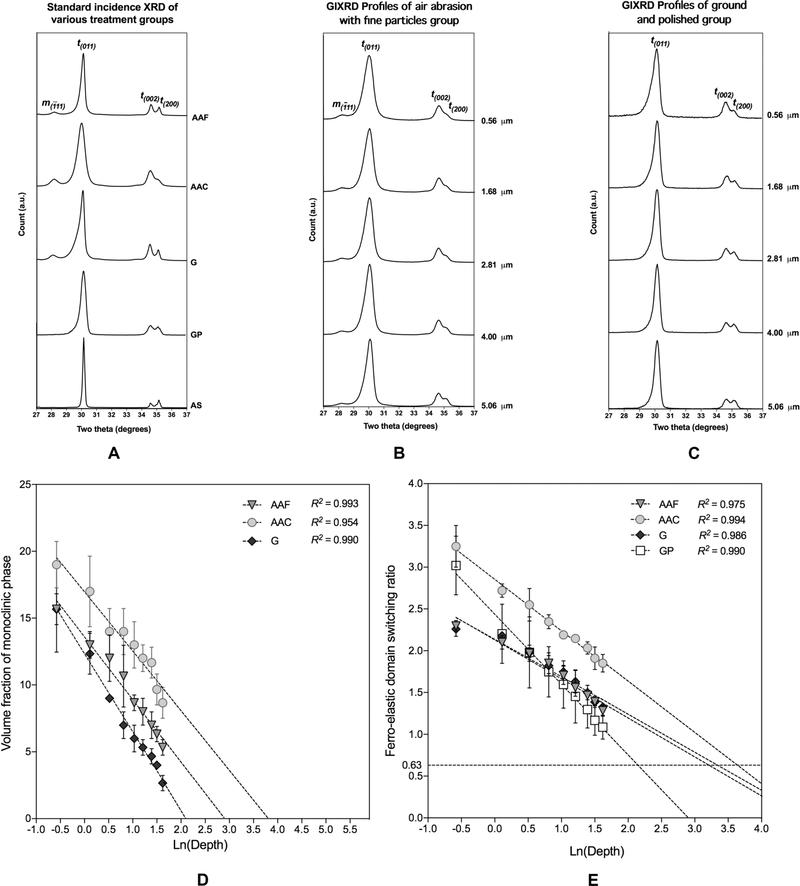
Standard incidence XRD patterns for the various treatment groups are displayed in Figure 7A. The volume fraction of monoclinic phase determined by standard incidence XRD is listed in Table 1. Air abrasion with fine or coarse particles as well as grinding led to the formation of monoclinic phase, whereas little or no monoclinic phase was presented for the assintered or the polished specimens. All treated groups exhibited a reversal of intensity for the tetragonal reflections t(002) and t(200), indicating the occurrence of ferroelastic domain switching. Representative GIXRD profiles as a function of incidence angle after air abrasion with fine particles or polishing are displayed in Figure 7B and 7C. AAF and GP groups exhibited an occurrence of FDS as a function of incidence angle. In addition, a decrease in monoclinic content was observed for the AAF group. No monoclinic phase was detected in the GP group.
Figure 7.
(A) Standard incidence XRD profiles for various surface treatment groups. All treated groups exhibited ferro-elastic domain switching as indicated by a reversal in the relative intensities of the t(002) and t(200) tetragonal reflections. (B) GIXRD profile as a function of incidence angle after air abrasion with fine particles. (C) GIXRD profile as a function of incidence angle after grinding and polishing. (D) Monoclinic volume fraction as a function of depth measured by GIXRD. The depth of t-m phase transformation was calculated from semi-log linear regression, where graphs intercepted the x-axis at zero (monoclinic volume fraction was zero). (E) FDS as a function of depth measured by GIXRD. The depth of FDS was calculated from semi-log linear regression, where graphs intercepted the x-axis at 0.63, control value.
The depth of transformation was interpolated from semi-log regression, assuming the maximum depth of transformation corresponded to a volume fraction of monoclinic phase equal to zero. The depth of FDS was also interpolated from semi-log regression graphs, assuming a base intensity ratio of 0.63, as measured for the as-sintered group. Results are summarized in Figure 6, 7D, and 7E, and Table 1. The AAC group showed the highest depth of phase transformation (47.2 ± 3.0 μm) and FDS (41.2 ± 2.2 μm), followed by the AAF group with a transformation depth of 14.5 ± 1.2 μm and FDS depth of m. The ground group showed a transformation 1.5 μm and FDS depth of 19.8 ± 3.7 μm. No evidence of phase transformation was seen in the GP group; however, evidence of FDS was observed to a calculated depth of 9.3 ± 2.0 μm.
Biaxial flexural strength
The mean biaxial flexural strength values are summarized in Table 1. The as-sintered control group exhibited the lowest mean biaxial flexural strength (1202.3 ± 141.9 MPa), which was significantly lower than all other groups after adjustment for multiple comparisons (p < 0.05). There was no significant difference between the AAC (1371.4 ± 147.6 MPa) and the G group (1357.0 ± 196.7 MPa). There was no significant difference between the AAF (1662.6 ± 202.6 MPa) and the GP group (1567.2 ± 209.7 MPa), both of which exhibited significantly higher strength than the AAC or the G group.
Reliability
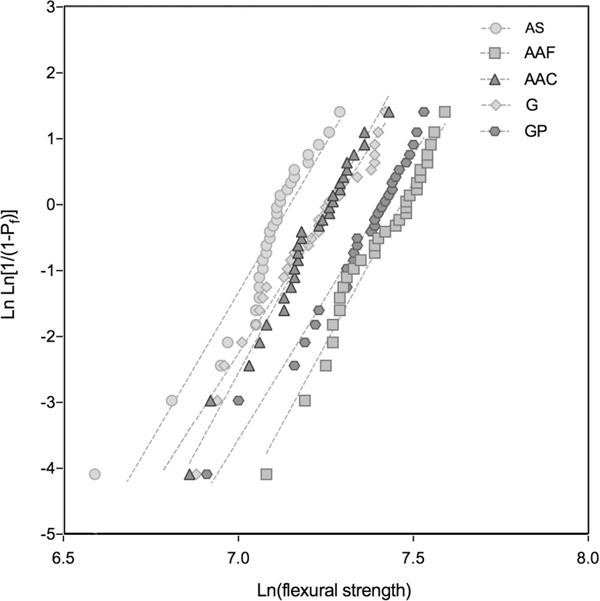
Plots for the various treatment groups are displayed in Figure 8. Weibull parameters are summarized in Table 1. Both the G and GP groups exhibited a lower Weibull modulus than the control group, but this difference was not statistically significant. On the other hand, the air abraded groups exhibited higher Weibull modulus than the as-sintered control group, and this difference was statistically significant for the AAC group (p < 0.05).
Figure 8.
Weibull plots of various surface treatment groups.
Discussion
As expected, air abrasion with coarse particles, the most aggressive procedure, introduced the largest flaw size, as well as the roughest surface, followed by grinding and air abrasion with fine particles. There was a linear relationship between the Rz roughness parameter and the natural logarithm of flaw size (R2 = 0.941). This is in agreement with previous studies19,48–51 showing that surface damage in zirconia is associated with an increase in the surface roughness. Further studies are needed to confirm this linear relationship between Rz and the natural logarithm of flaw size. This simple profilometry measurement could be used to extrapolate flaw size in CAD/CAM restorations.
GIXRD is a non-destructive technique, which is able to characterize in-depth phase composition as a function of incidence angle. Larger incidence angles result in deeper x-ray penetration, giving information on subsurface phases.32,52 In this study, a series of GIXRD profiles were performed at incidence angles from 1° to 9° and showed that the intensity of the diffraction Peak of the monocleinic phase decreased as the penetration depth increased; however, the maximum GIXRD incidence angle is 9°, which corresponds to a penetration depth of 5.06 μm. Thus, semi-log linear regression protocols were used to extrapolate the full depth of phase transformation. The depth was obtained by the x intercept on the semi-log regression plot, corresponding to a monoclinic content of zero. Our results revealed that AAC, the most aggressive treatment, produced the deepest phase transformation (47.2 ± 3.0 μm), followed by AAF (14.5 ± 1.2 μm), and G groups (8.6 ± 1.5 μm). These results are in good agreement with other literature findings, showing that the depth of transformation was 12 ± 1 μm after air abrasion with 110 μm particles at 2 bar pressure27 or 8 μm after grinding with a diamond disc with water cooling.15 It is well established that the monoclinic volume fraction and the depth of the transformation are closely related to the magnitude of applied stresses and experimental conditions, e.g., specifically airborne-particle diameter,28,53 abrading pressure,54,55 diamond grit-size, applied load, and grinding speed.56 Grain size could also influence the depth of transformation, with smaller grain sizes being less transformable.11
In addition to the martensitic t-m phase transformation, all treatment groups exhibited FDS. Under stress, domains within each zirconia grain switched to a different orientation, associated with twinning, and resulting in an irreversible change in the intensity ratio of t(200) and t(002) reflections of the standard incidence XRD profile.12,13 FDS is also associated with significant strengthening in zirconia ceramics.13,57 Our results and those of others showed that the intensity and depth of FDS transformation were dictated by the magnitude of the applied stress15,58 since AAC group showed the deepest FDS ratio (41.2 ± 2.2 μm), followed by G (19.8 ± 3.7 μm), AAF (19.3 ± 1.1 μm), and GP groups (9.3 ± 2.0 μm).
The effect of surface adjustments involving airborne-particle abrasion or grinding with or without polishing on the flexural strength of Y-TZP ceramics has been extensively studied.17–19,25,26,59 However, there is no consensus on whether surface adjustments are overall beneficial or detrimental to the flexural strength and long-term performance. Our results showed that the flexural strength was determined by the balance between the depth of the toughening mechanisms (stressinduced transformation and FDS) and the mean flaw size and distribution (Fig 6). The AAF and GP groups exhibited the highest mean biaxial flexural strength, while both the depth of phase transformation and FDS were greater than the mean flaw size. In contrast, the AAC and G groups showed deeper phase transformation and FDS than the other groups, but the mean flaw size was greater than the transformation depth for the AAC groups and similar for the G groups, leading to lower mean flexural strength values.
Comparing the group treated by air abrasion with fine particles and ground groups revealed that the largest contribution to the final mean biaxial flexural strength was from the mean flaw size, followed by the depth of monoclinic phase transformation and the depth of FDS. The results were in accordance with other literature findings showing that the incidence of catastrophic failures is increased when the size of defects created by adjustments is greater than that of the compressive layer from the t-m phase transformation.20,22 Meanwhile, when subsurface damage is shallower than the depth of stressinduced compressive layer, crack propagation is hindered and associated with a decrease in the incidence of catastrophic failures.60,61
Weibull plots for each treatment group are displayed in Figure 8. Weibull parameters are summarized in Table 1. The analysis is used to provide a statistical comparison of the relative quality of test data and for assessing reliability.47 The reliability of strength was explained in terms of Weibull modulus (m) and characteristic strength (σθ). Higher m corresponded to a homogenous flaw distribution with narrow strength distribution, leading to greater reliability.46 It is commonly accepted that prior to determining the Weibull modulus, the data should be screened for outlying observations.46 An adequate Weibull fit is suggestive of a consistent underlying flaw population, with single dominant flaw type. However, ceramics typically contain two or more flaw distributions.47,52 These flaws may result from intrinsic factors associated with processing, e.g., pores, inclusions, distributed micro-crack along grain boundaries, phase changes during processing, or chemical variations. Meanwhile extrinsic flaws could also be produced as a result of surface modification, e.g., grinding adjustment or air abrasion.46
In this study, treated groups, with the exception of the ground group, exhibited a bimodal flaw distribution, with typically three to four specimens failing with low strength values and the rest following a Weibull distribution with linearity of the Weibull plots (Fig 8). We proposed that specimens failing at low strength value could correspond to specimens with intrinsic flaws, whereas the other specimens represented specimens with extrinsic flaws. It could be argued that since Weibull analysis is based on a single flaw distribution, specimens corresponding to intrinsic flaws should be discarded for analyzing the Weibull parameters, to avoid bias associated with wide confidence bounds.47 However, intrinsic flaws are also of clinical relevance and could be present in dental restorations. Thus, we have chosen to calculate the Weibull modulus and characteristic strength from the complete data set corresponding to the flaw distribution (Fig 8).
The AAC group exhibited the highest m value (11.2 ± 0.4), indicating that flaws from specimen preparation were distributed homogenously, as illustrated in SEM micrographs (Fig 3B); however, the AAC group exhibited the lowest characteristic strength value among treated groups (1428.3 MPa), due to a mean flaw size extending beyond the depth of the toughening mechanisms. Air abrasion with fine particles (AAF) led to a large transformation depth associated with smaller flaw size, and a high characteristic strength (1755.4 MPa); however, the Weibull modulus value (9.8 ± 0.3) reflected a wider flaw size distribution, either from air abrasion or existing grinding grooves from specimen preparation. Comparing the Weibull modulus of both air-abraded groups showed that there was no significant difference. The as-sintered group exhibited larger m value than the G and GP groups. This could be explained by the homogenous distribution of flaws from machining; however, the AS group had the smallest characteristic strength (1275.7 MPa) due to the absence of t-m phase transformation and FDS. The GP group exhibited similar Weibull modulus (8.4 ± 0.3) compared to the G group (8.3 ± 0.3). This indicates that flaws were distributed evenly in the G group, whereas defects were successfully polished off in the GP group, leading to the second highest characteristic strength.
Within the limitations of this study, according to the manufacturer’s recommendations, it is clinically acceptable to air abrade the intaglio surface of 3Y-TZP restorations with fine alumina particles. If occlusal adjustments are required, careful grinding with diamond burs followed by polishing with recommended polishing kits for zirconia is also an acceptable procedure. These two treatments led to the highest strength values, without being detrimental to the reliability; however, the polishing procedure, no matter how carefully performed, still leaves some surface defect that could diminish the reliability of the restorations and be associated with a decrease in the long-term performance.
Conclusions
Within the limitations of this study, the following conclusions could be drawn:
Mean biaxial flexural strength results can be explained based on the balance between the depth of phase transformation, associated ferro-elastic domain switching and that of the deepest flaw from subsurface damage.
Air abrasion with fine alumina particles and polishing after grinding led to the highest mean biaxial flexural strength and can therefore be proposed as clinically acceptable procedures, as they are also accompanied with a modest increase in Weibull modulus and characteristic strength.
Acknowledgments
This work was supported by Research Grant R21DE25380 from the National Institutes of Health, National Institute of Dental and Craniofacial Research, and the ACPEF Research Fellowship Grants from The American College of Prosthodontists.
Footnotes
The authors deny any conflicts of interest related to this study.
References
- 1.Sailer I, Makarov NA, Thoma DS, et al. : All-ceramic or metalceramic tooth-supported fixed dental prostheses (FDPs)? A systematic review of the survival and complication rates. Part I: Single crowns (SCs). Dent Mater 2015;31:603–623 [DOI] [PubMed] [Google Scholar]
- 2.Pjetursson BE, Sailer I, Makarov NA, et al. : All-ceramic ormetal-ceramic tooth-supported fixed dental prostheses (FDPs)? A systematic review of the survival and complication rates. Part II: Multiple-unit FDPs. Dent Mater 2015;31:624–639 [DOI] [PubMed] [Google Scholar]
- 3.Denry I, Holloway J: Ceramics for dental applications: A review. Materials 2010;3:351–368 [Google Scholar]
- 4.Ruiz L, Readey MJ: Effect of heat-treatment on grain size, phase assemblage, and mechanical properties of 3 mol% Y-TZP. J Am Ceram Soc 1996;79:2331–2340 [Google Scholar]
- 5.Filser F, Kocher P, Weibel F, et al. : Reliability and strength ofall-ceramic dental restorations fabricated by direct ceramic machining (DCM). Int J Comput Dent 2001;4:89–106 [PubMed] [Google Scholar]
- 6.Miyazaki T, Nakamura T, Matsumura H, et al. : Current status ofzirconia restoration. J Prosthodont Res 2013;57:236–261 [DOI] [PubMed] [Google Scholar]
- 7.Wolfart M, Lehmann F, Wolfart S, et al. : Durability of the resinbond strength to zirconia ceramic after using different surface conditioning methods. Dent Mater 2007;23:45–50 [DOI] [PubMed] [Google Scholar]
- 8.Garvie RC, Hannink RH, Pascoe RT: Ceramic steel? Nature 1975;258:703–704 [Google Scholar]
- 9.Evans AG, Cannon RM: Overview no. 48: Toughening of brittlesolids by martensitic transformations. Acta Metall 1986;34:761–800 [Google Scholar]
- 10.Chevalier J: What future for zirconia as a biomaterial? Biomaterials 2006;27:535–543 [DOI] [PubMed] [Google Scholar]
- 11.Denry I, Kelly JR: State of the art of zirconia for dental applications. Dent Mater 2008;24:299–307 [DOI] [PubMed] [Google Scholar]
- 12.Chevalier J, Grémillard L, Virkar AV, et al. : The tetragonal-monoclinic transformation in zirconia: Lessons learned and future trends. J Am Ceram Soc 2009;92:1901–1920 [Google Scholar]
- 13.Virkar AV, Matsumoto RLK: Ferroelastic domain switching as atoughening mechanism in tetragonal zirconia. J Am Ceram Soc 1986;69:C-224-C-226 [Google Scholar]
- 14.Chan CJ, Lange FF, Ruhle M, et al. : Ferroelastic domain switching in tetragonal zirconia single-crystals microstructural aspects. J Am Ceram Soc 1991;74:807–813 [Google Scholar]
- 15.Muñoz-Tabares JA, Jiménez-Piqué E, Reyes-Gasga J, et al. : Microstructural changes in ground 3Y-TZP and their effect on mechanical properties. Acta Mater 2011;59:6670–6683 [Google Scholar]
- 16.Denry I, Kelly JR: Emerging ceramic-based materials fordentistry. J Dent Res 2014;93:1235–1242 [DOI] [PMC free article] [PubMed] [Google Scholar]
- 17.Kosmac T, Oblak C, Jevnikar P, et al. : The effect of surfacegrinding and sandblasting on flexural strength and reliability of Y-TZP zirconia ceramic. Dent Mater 1999;15:426–433 [DOI] [PubMed] [Google Scholar]
- 18.Denry I, Holloway J: Microstructural and crystallographicsurface changes after grinding zirconia-based dental ceramics. J Biomed Mater Res B-Appl Biomater 2006;76B:440–448 [DOI] [PubMed] [Google Scholar]
- 19.Curtis AR, Wright AJ, Fleming GJP: The influence of surfacemodification techniques on the performance of a Y-TZP dental ceramic. J Dent 2006;34:195–206 [DOI] [PubMed] [Google Scholar]
- 20.Guazzato M, Quach L, Albakry M, et al. : Influence of surface andheat treatments on the flexural strength of Y-TZP dental ceramic. J Dent 2005;33:9–18 [DOI] [PubMed] [Google Scholar]
- 21.Pereira GK, Fraga S, Montagner AF, et al. : The effect of grindingon the mechanical behavior of Y-TZP ceramics: A systematic review and meta-analyses. J Mech Behav Biomed Mater 2016;63:417–442 [DOI] [PubMed] [Google Scholar]
- 22.Kosmac T, Oblak C, Marion L: The effects of dental grindingand sandblasting on ageing and fatigue behavior of dental zirconia (Y-TZP) ceramics. J Eur Ceram Soc 2008;28:1085–1090 [Google Scholar]
- 23.Quinn GD, Ives LK, Jahanmir S: On the nature of machiningcracks in ground ceramics: Part I: SRBSN strengths and fractographic analysis. Mach Sci Technol 2005;9:169–210 [Google Scholar]
- 24.Malkin S, Hwang TW: Grinding mechanisms for ceramics. CIRPAnn-Manuf Technol 1996;45:569–580 [Google Scholar]
- 25.Aurélio IL, Marchionatti AME, Montagner AF, et al. : Does aiŕ particle abrasion affect the flexural strength and phase transformation of Y-TZP? A systematic review and meta-analysis. Dent Mater 2016;32:827–845 [DOI] [PubMed] [Google Scholar]
- 26.Guazzato M, Albakry M, Quach L, et al. : Influence of surface andheat treatments on the flexural strength of a glass-infiltrated alumina/zirconia-reinforced dental ceramic. Dent Mater 2005;21:454–463 [DOI] [PubMed] [Google Scholar]
- 27.Chintapalli RK, Marro FG, Jimenez-Pique E, et al. : Phasetransformation and subsurface damage in 3Y-TZP after sandblasting. Dent Mater 2013;29:566–572 [DOI] [PubMed] [Google Scholar]
- 28.Passos SP, Linke B, Major PW, et al. : The effect of air-abrasionand heat treatment on the fracture behavior of Y-TZP. Dent Mater 2015;31:1011–1021 [DOI] [PubMed] [Google Scholar]
- 29.Bolon AM, Gentleman MM: Raman spectroscopic observations of ferroelastic switching in ceria-stabilized zirconia. J Am Ceram Soc 2011;94:4478–4482 [Google Scholar]
- 30.Peterson IM, Wuttiphan S, Lawn BR, et al. : Role of microstructure on contact damage and strength degradation of micaceous glass-ceramics. Dent Mater 1998;14:80–89 [DOI] [PubMed] [Google Scholar]
- 31.Gremillard L, Grandjean S, Chevalier J: A new method tomeasure monoclinic depth profile in zirconia-based ceramics from X-ray diffraction data. Int J Mater Res 2010;101:88–94 [Google Scholar]
- 32.Simeone D, Baldinozzi G, Gosset D, et al. : Grazing incidence X-ray diffraction for the study of polycrystalline layers. Thin Solid Films 2013;530:9–13 [Google Scholar]
- 33.Valdez JA, Chi Z, Sickafus KE: Light ion irradiation-inducedphase transformation in the monoclinic polymorph of zirconia. J Nucl Mater 2008;381:259–266 [Google Scholar]
- 34.Cattani-Lorente M, Scherrer SS, Ammann P, et al. : Low temperature degradation of a Y-TZP dental ceramic. Acta Biomater 2011;7:858–865 [DOI] [PubMed] [Google Scholar]
- 35.Direct Glidewell. Bruxzir milling blanks instruction for use, Irvine, CA, Glidewell Direct, 2014, pp 1–2 [Google Scholar]
- 36.ASTM. F1873–98 standard specification for high-purity denseyttria-tetragonal zirconium oxide polycrystal (Y-TZP) for surgical implant applications. ASTM International, 2004 [Google Scholar]
- 37.ASTM. D7127–13 Standard test method for measurement of surface roughness of abrasive blast cleaned metal surfaces using a portable stylus instrument. ASTM International, 2013 [Google Scholar]
- 38.ASTM: E112–96 Standard Test Methods for Determining Average Grain Size. 2003 [Google Scholar]
- 39.Toraya H, Yoshimura M, Somiya S: Calibration curvequantitative analysis of the monoclinic tetragonal ZrO2 system by X-ray diffraction. J Am Ceram Soc 1984;67:C119–C121 [Google Scholar]
- 40.Wachtman JBJ, Capps W, Mandel J: Biaxial flexure testing of ceramic substrates. J Mater 1972;7:188–194 [Google Scholar]
- 41.Shetty DK, Rosenfield AR, Duckworth WH, et al. : Abiaxial-flexure test for evaluating ceramic strength. J Am Ceram Soc 1983;66:36–42 [Google Scholar]
- 42.Shetty DK, Rosenfield AR, McGuire P, et al. : Biaxial flexure testsfor ceramics. J Am Ceram Soc 1980;59:1193–1197 [Google Scholar]
- 43.Cranmer DC, Richerson DW: Mechanical Testing Methodology for Ceramic Design and Reliability, New York, CRC Press, 1998 [Google Scholar]
- 44.ISO: ISO 6872 Dentistry - ceramic material. 2008 [Google Scholar]
- 45.Wachtman JB, Cannon WR, Matthewson MJ: Mechanical Properties of Ceramics. Hoboken, NJ, Wiley, 1996 [Google Scholar]
- 46.Quinn JB, Quinn GD: A practical and systematic review of Weibull statistics for reporting strengths of dental materials. Dent Mater 2010;26:135–147 [DOI] [PMC free article] [PubMed] [Google Scholar]
- 47.ASTM: C1239–13 Standard Practice for Reporting UniaxialStrength Data and Estimating Weibull Distribution Parameters for Advanced Ceramics. ASTM International, 2013 [Google Scholar]
- 48.Preis V, Grumser K, Schneider-Feyrer S, et al. : The effectiveness of polishing kits: influence on surface roughness of zirconia. Int J Prosthodont 2015;28:149–151 [DOI] [PubMed] [Google Scholar]
- 49.Karakoca S, Yilmaz H: Influence of surface treatments on surface roughness, phase transformation, and biaxial flexural strength of Y-TZP ceramics. J Biomed Mater Res B Appl Biomater 2009;91:930–937 [DOI] [PubMed] [Google Scholar]
- 50.Mochales C, Maerten A, Rack A, et al. : Monoclinic phasetrans formations of zirconia-based dental prostheses, induced by clinically practised surface manipulations. Acta Biomater 2011;7:2994–3002 [DOI] [PubMed] [Google Scholar]
- 51.Maerten A, Zaslansky P, Mochales C, et al. : Characterizing the transformation near indents and cracks in clinically used dental yttria-stabilized zirconium oxide constructs. Dent Mater 2013;29:241–251 [DOI] [PubMed] [Google Scholar]
- 52.Strasberg M, Barrett AA, Anusavice KJ, et al. : Influence of roughness on the efficacy of grazing incidence X-ray diffraction to characterize grinding-induced phase changes in yttria-tetragonal zirconia polycrystals (Y-TZP). J Mater Sci 2014;49:1630–1638 [Google Scholar]
- 53.Özcan M, Melo RM, Souza ROA, et al. : Effect of air-particlë abrasion protocols on the biaxial flexural strength, surface characteristics and phase transformation of zirconia after cyclic loading. J Mech Behav Biomed Mater 2013;20:19–28 [DOI] [PubMed] [Google Scholar]
- 54.Egilmez F, Ergun G, Cekic-Nagas I, et al. : Factors affecting themechanical behavior of Y-TZP. J Mech Behav Biomed Mater 2014;37:78–87 [DOI] [PubMed] [Google Scholar]
- 55.Ban S, Sato H, Suehiro Y, et al. : Effect of sandblasting and heattreatment on biaxial flexure strength of the zirconia/alumina nanocomposite. Key Eng Mater 2007;330–332 I:353–356 [Google Scholar]
- 56.Pereira GKR, Amaral M, Cesar PF, et al. : Effect oflow-temperature aging on the mechanical behavior of ground Y-TZP. J Mech Behav Biomed Mater 2015;45:183–192 [DOI] [PubMed] [Google Scholar]
- 57.Michel D, Mazerolles L, Perez Y, et al. : Fracture of metastable tetragonal zirconia crystals. J Mater Sci 1983;18:2618–2628 [Google Scholar]
- 58.Kiguchi T, Saiki A, Shinozaki K, et al. : Effect of the species of substituted ion on ferroelastic domain switching of rare-earth ion-doped ZrO2 pseudo-single crystals. J Mater Res 1999;14:142–145 [Google Scholar]
- 59.Garcia Fonseca R, de Oliveira Abi-Rached F, dos Santos NunesReis JM, et al. : Effect of particle size on the flexural strength and phase transformation of an airborne-particle abraded yttria-stabilized tetragonal zirconia polycrystal ceramic. J Prosthet Dent 2013;110:510–514 [DOI] [PubMed] [Google Scholar]
- 60.Papanagiotou HP, Morgano SM, Giordano RA, et al. : In vitroevaluation of low-temperature aging effects and finishing procedures on the flexural strength and structural stability of Y-TZP dental ceramics. J Prosthet Dent 2006;96:154–164 [DOI] [PubMed] [Google Scholar]
- 61.Chevalier J, Gremillard L, Deville S: Low-Temperature Degradation of Zirconia and Implications for Biomedical Implants. Ann Rev Mater Res 2007;37:1–32 [Google Scholar]


