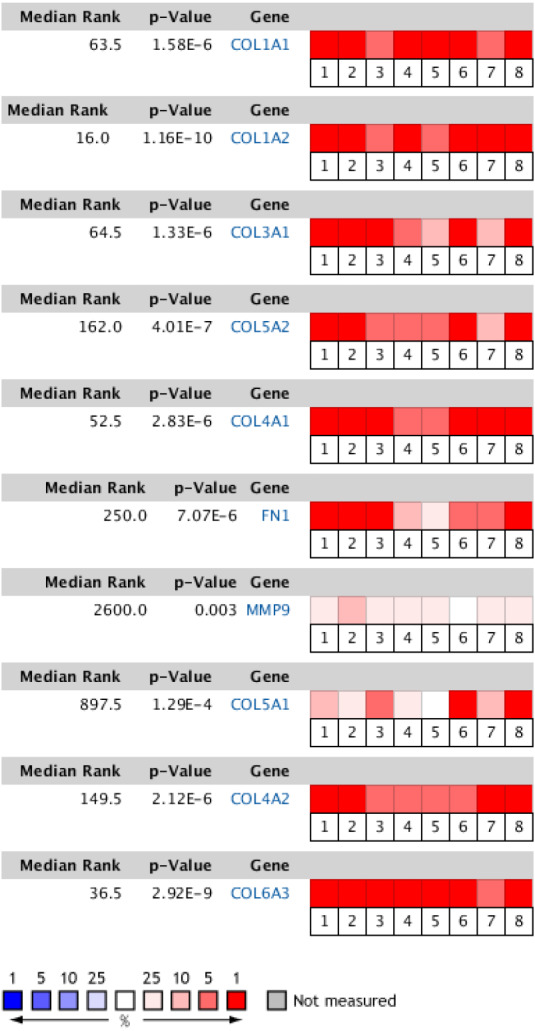
Figure 6. Heat map of differential expression between clinical GC samples and normal samples in the Oncomine dataset.

The overexpression (red) or underexpression (blue) of target genes in eight validation datasets. In each dataset, all genes were sequenced from high to low according to their expression differences between tumor and normal tissues, and then the target gene sequencing percentiles were analyzed. Cell color was determined by the gene rank percentile for the dataset analyses (the more overexpressed the gene, the redder the dataset color, and the more underexpressed genes were blue). 1. Diffuse gastric adenocarcinoma vs. normal (Chen et al.,, 2003). 2. Gastric intestinal type adenocarcinoma vs. normal (Chen et al.,, 2003). 3. Gastric mixed adenocarcinoma vs normal (Chen et al.,, 2003). 4. Diffuse gastric adenocarcinoma vs. normal (Cho et al.,, 2011). 5. Gastric intestinal type adenocarcinoma vs. normal (Cho et al.,, 2011). 6. GC vs. normal (Cui et al.,, 2011). 7. Gastric intestinal type adenocarcinoma vs. normal ( DÉrrico et al.,, 2009). 8. GC vs. normal (Wang et al.,, 2012).
