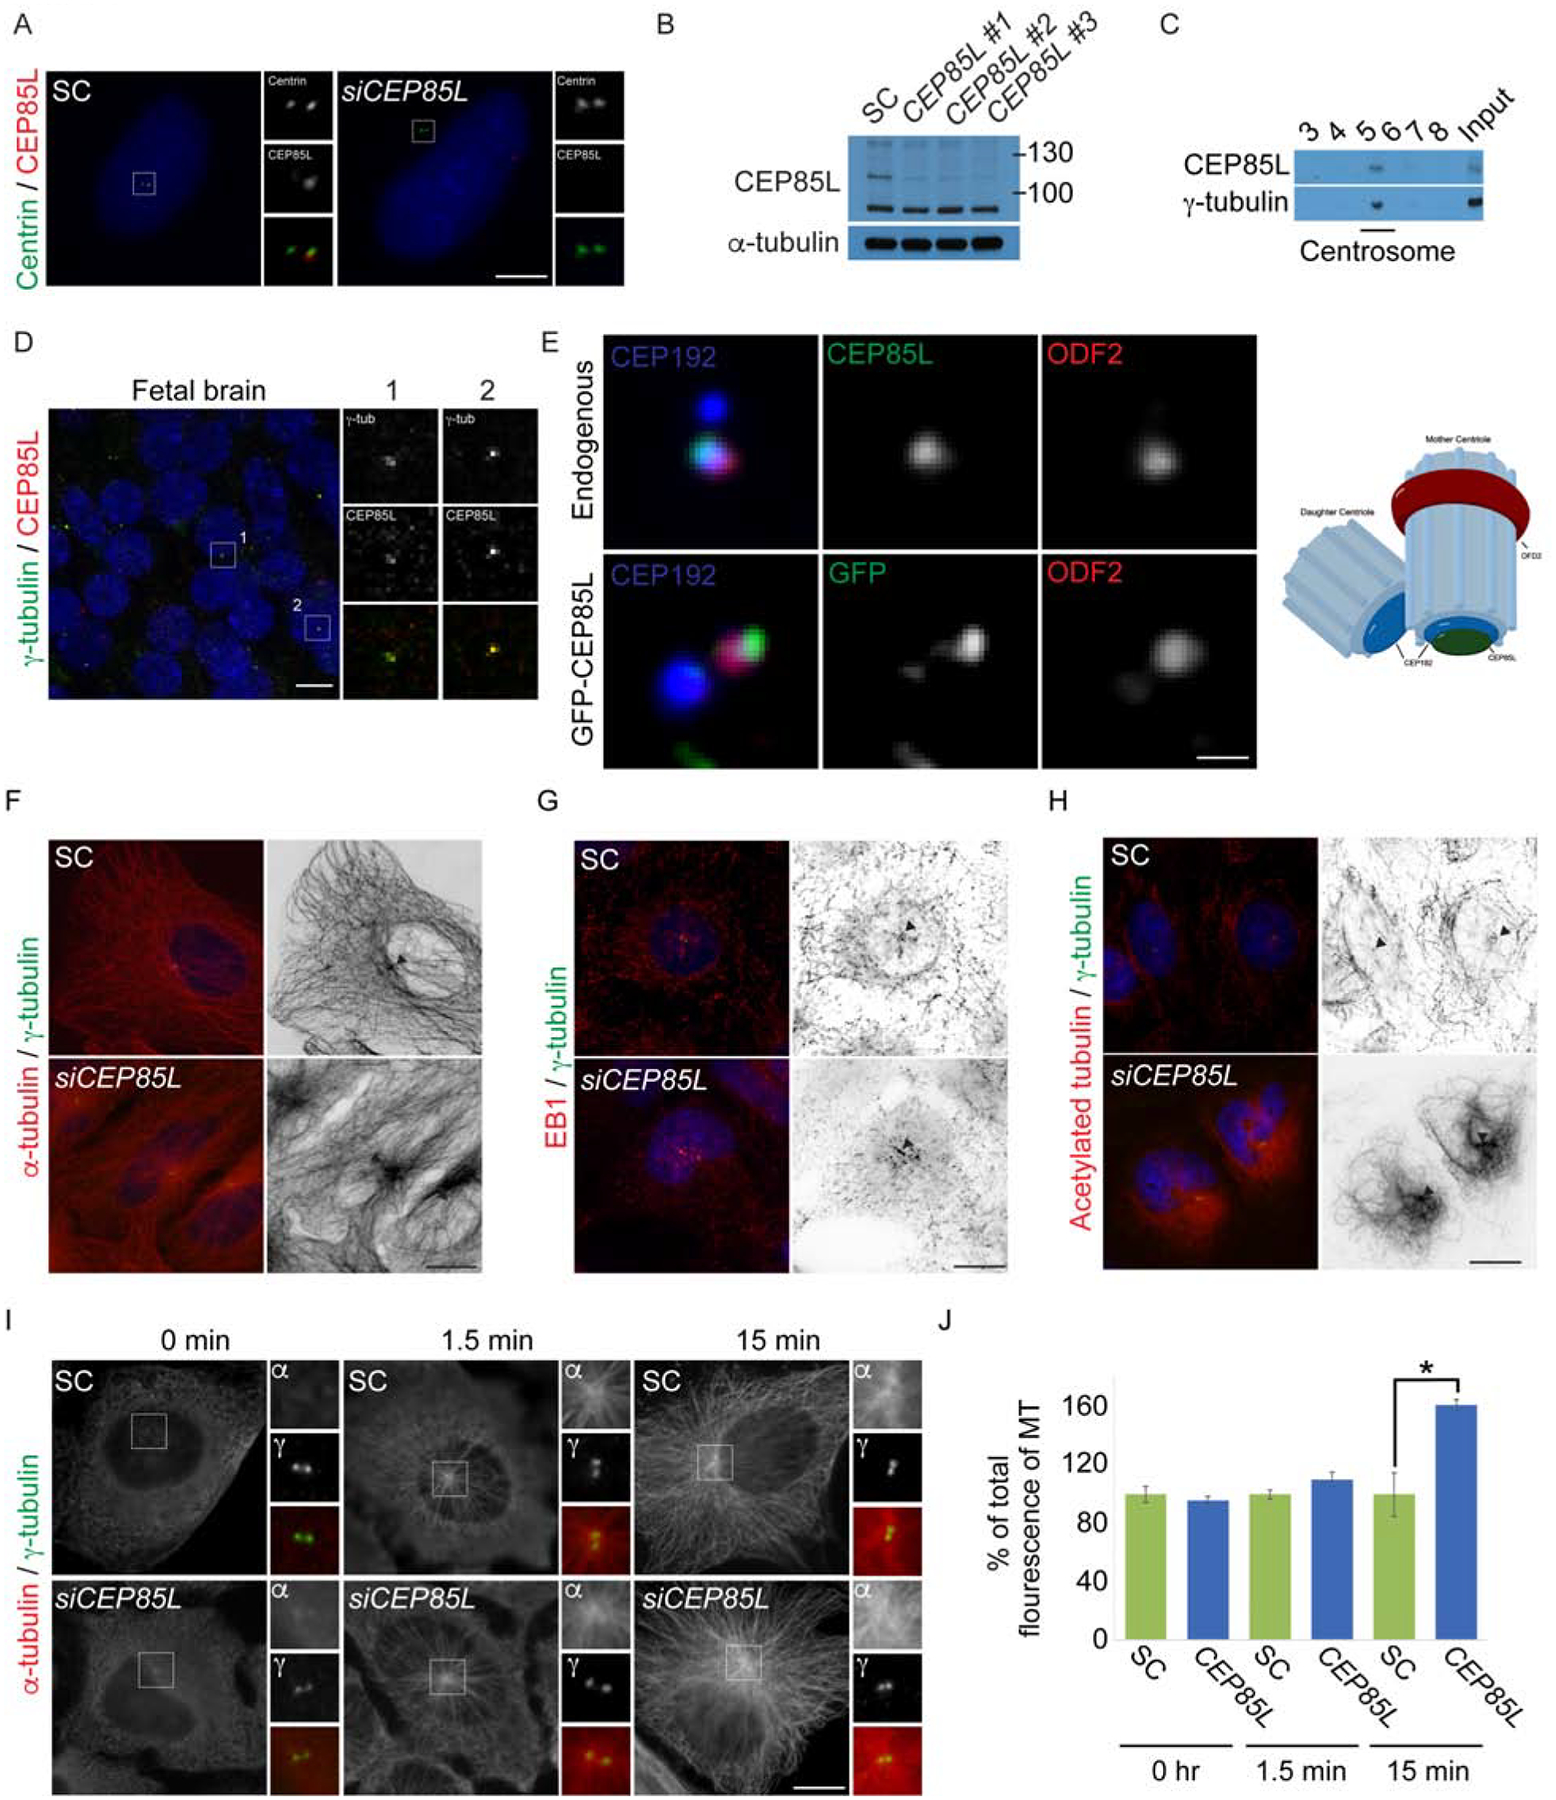
Figure 3: CEP85L localizes to the mother centriole and regulates microtubule cytoskeletal organization.

A. U2-OS cells treated with scrambled control (SC) or CEP85L siRNA co-stained with antibodies to Centrin (green) and CEP85L (red). Scale bar represents 5mm for all images. B. Whole-cell lysate from SC, CEP85L #1, #2 or #3 siRNA-treated U2-OS cells immunoblotted for CEP85L. Actin served as a loading control. C. Fractions from sucrose gradient-separated U2-OS cell lysates immunoblotted for CEP85L and γ-tubulin to identify the centrosomal fraction. D. Fresh frozen gestational week 23 fetal brains were co-stained for γ-tubulin (green) and CEP85L (red) Scale bar is 5mm for all images. E. Airyscan microscopy of U2-OS cells co-stained for CEP192 (blue) to mark the proximal centrioles, ODF2 (red) to mark subdistal appendages, and CEP85L (green) or GFP-CEP85L (green). Scale bar represents 1μm for Airyscan images. F-H. Immunofluorescence analysis of SC and CEP85L siRNA-treated U2-OS cells co-stained with γ-tubulin (green) and α-tubulin, EB1, or acetylated tubulin (red). Figures right of the merged image are inverted images of α-tubulin, EB1 or acetylated tubulin. Triangles denote the centrosome. Scale bars represent 10mm for all images. I. SC and CEP85L siRNA-treated U2-OS cells were subjected to a microtubule regrowth assay, fixed at the indicated time points and co-stained with α-tubulin (red) and γ-tubulin (green). Scale bar indicates 5mm for all images. J. Quantification of the mean fluorescence intensities ± s.d. of centrosomal α-tubulin in SC and CEP85L siRNA treated cells as expressed as the mean percentage ± s.d. of the fluorescence intensities of SC cells. For all quantifications, 10 cells were analyzed per experiment (n=3). * − p < 0.005 (Student’s t-test).
