

Abstract
The mRNA cap‐binding oncoprotein “eIF4E” is phosphorylated at residue S209 by Mnk kinases, and is closely associated with tumor development and progression. Despite being well‐established, mechanistic details at the molecular level of mRNA recognition by eIF4E due to phosphorylation have not been clearly elucidated. We investigated this through molecular modeling and simulations of the S209 phosphorylated derivative of eIF4E and explored the associated implication on the binding of the different variants of mRNA‐cap analogs. A key feature that emerges as a result of eIF4E phosphorylation is a salt‐bridge network between the phosphorylated S209 (pS209) and a specific pair of lysine residues (K159 and K162) within the cap‐binding interface on eIF4E. This interaction linkage stabilizes the otherwise dynamic C‐terminal region of the protein, resulting in the attenuation of the overall plasticity and accessibility of the binding pocket. The pS209‐K159 salt‐bridge also results in an energetically less favorable environment for the bound mRNA‐cap primarily due to electrostatic repulsion between the negative potentials from the phosphates in the cap and those appearing as a result of phosphorylation of S209. These observations collectively imply that the binding of the mRNA‐cap will be adversely affected in the phosphorylated derivative of eIF4E. We propose a mechanistic model highlighting the role of eIF4E phosphorylation as a regulatory tool in modulating eIF4E: mRNA‐cap recognition and its potential impact on translation initiation.
Keywords: electrostatics, eIF4E, molecular dynamics simulations, mRNA‐cap analogs, phosphorylation
1. INTRODUCTION
Protein phosphorylation is one of the most important post‐translational modifications that play a key role in modulating the structural and functional properties of protein molecules for the regulation of most cellular processes.1 It is a reversible process that is mediated by kinases.2 A well‐studied example are the MAP kinase signal‐integrating kinases (Mnks)3 which phosphorylates, as one of their substrates, a key driver of protein synthesis, the eukaryotic translational initiation factor 4E (eIF4E) protein.4 eIF4E recognizes precursor mRNA and the scaffold protein eIF4G which in turn recruits the helicase enzyme eIF4A to form the tripartite eIF4F protein complex5; this complex subsequently enables the recruitment of the 40S ribosomal subunit to initiate the process of scanning the mRNA for the start codon to initiate translation.6 The scaffold eIF4G protein also interacts with Mnk kinases as part of the eIF4F complex and facilitates the efficient phosphorylation of eIF4E (phospho‐eIF4E) by bringing the two molecules into close proximity with each other.7 The precise regulatory role of eIF4E phosphorylation on the translation process is a matter of debate,8 although phospho‐eIF4E has been shown to be sensitive to increments in the translation efficiency of a subset of mRNAs which encode for proteins involved in tumor development and progression.4, 9, 10, 11 Phosphorylation is suggested to be involved in the export of mRNA from the nucleus,12 while a growing body of evidence also implicates phospho‐eIF4E in the pathophysiology of neurodevelopmental and neuropsychiatric disorders.13, 14, 15
The bulk of eukaryotic precursor mRNAs have an m7G (7‐methylguanosine) triphosphate cap‐structure at the 5′ end which serves as the docking point with eIF4E.16 Structures of eIF4E proteins with a cap‐analog [7‐methylguanosine 5′ triphosphate (m7GTP)] revealed that the mRNA cap‐binding interface of the protein is surrounded by four‐loop segments connecting the antiparallel arrangement of beta strands (β1–β8) which form the base of the recognition pocket (Figure 1). Three of these loop segments connecting the respective pairs of beta strands (β1β2 loop, β3β4 loop, and β5β6 loop) have at‐least one residue involved in specific intermolecular recognition of the cap; these include W56 (from the β1β2 loop), W102 and E103 (from the β3β4 loop) and R157 and K159 (from the β5β6 loop). These residues engage in aromatic stacking (W56 and W102) and hydrogen‐bond (E102) interactions with the guanosine base and in salt‐bridge interactions (R157 and K159) with the phosphates of the cap‐analogs. However, the salt‐bridge interaction formed by K159 is not observed in all the structures. The loop segment connecting β7 and β8 (β7β8 loop) does not form any such specific interaction with the cap across this set of structures. S209 has been established as the only site of phosphorylation on eIF4E by Mnk kinases.8, 17 It lies in the loop segment connecting β7 and β8 towards the C‐terminus of the protein, in close proximity to the bound cap molecule (Figure 1). Experimental studies have shown that phosphorylation of S209 results in a reduction in the affinity of eIF4E for capped mRNA,18, 19, 20, 21 underscoring the role of phosphorylation in modulating the recognition between eIF4E and cap mRNA. However, there are multiple interpretations of the underlying mechanisms; Scheper et al suggest that the recognition affinity is reduced due to increase in the rate of dissociation19 while in contrast, Slepenkov et al show that the reduction results from a decrease in the rate of association.20 The m7GTP bound structures of eIF4E suggest that S209 phosphorylation results in the formation of a salt‐bridge interaction with the closely located K159 residue (Figure 1) and thereby clamps the mRNA in the binding pocket. Such a clamp would be expected to stabilize the capped mRNA in the bound state and improve its affinity by resulting in lowered rates of dissociation. Alternatively, if phosphorylation occurs prior to recognition, then this clamp would prevent the entry of the mRNA into the binding pocket, resulting in the reported decrease in affinity. There may also be an ensemble of phosphorylated structures resulting in a distribution of states corresponding to both scenarios. To date, the lack of structural data of phosphorylated eIF4E has eluded molecular level insights into S209 phosphorylation and its effects on the binding of cap mRNA.
Figure 1.
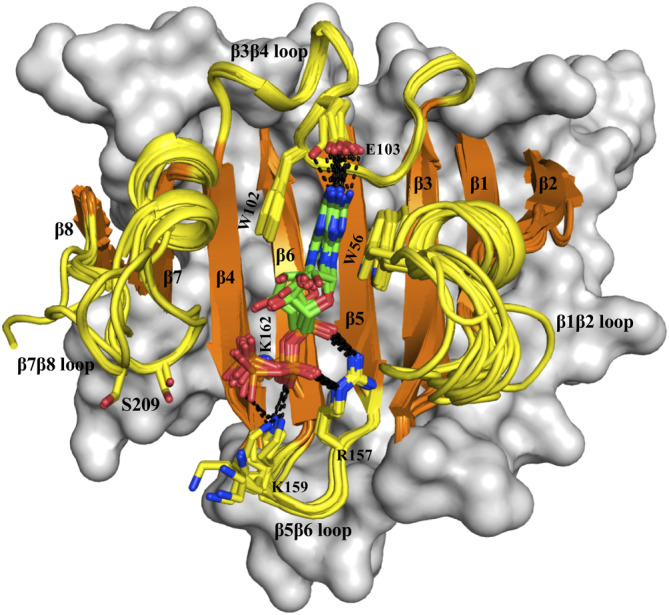
m7GTP bound eIF4E structures. Superimposition of sixteen distinct crystal structures of human eIF4E (see Table S1 for PDB IDs) in complex with m7GTP cap‐analog. The eight beta strands (orange color) and the four connecting loop segments (yellow color) which form the cap‐binding interface are shown in cartoon representation and labeled. The rest of the protein is shown in surface representation in gray color. The m7GTP cap and the residues from eIF4E which are involved in its recognition are shown in stick representation and labeled. Salt‐bridge and hydrogen‐bond interactions are explicitly represented with dashed lines. Residue S209 that is located in the β7β8 loop is also shown. All the molecular graphics figures were created using Pymol molecular visualization software (Schrodinger)
To address this question, we have carried out a comprehensive structure modeling and molecular dynamics (MD) simulations study to investigate the S209 phosphorylated state of eIF4E and explored its implications for the binding of the different variants of mRNA cap‐analogs. Our study demonstrates that a salt‐bridge clamp between phosphorylated S209 and lysine residues that are part of the cap‐binding interface is indeed formed, and modulates the pockets in a manner that is likely to hinder the docking of mRNA cap and also creates an energetically unfavorable bound state configuration for the cap. This picture provides a rationale for the apparent discrepancies between different studies and also creates a coherent understanding of the effect of S209 phosphorylation on the recognition mechanism of mRNA‐cap by eIF4E.
2. RESULTS
2.1. Phosphorylation of the cap‐free state of eIF4E
We first investigated the effect of S209 phosphorylation on the cap‐free state of human eIF4E. A comparative structural analysis of 11 available distinct cap‐free crystal structures showed that the β7β8 loop (contains the S209 residue) is completely resolved in only three structures (PDB IDs: 3U7X: chains A and B, and 5ZML) (Figure 2a). The β1β2 loop segment is resolved in most structures (except for 2W97: chain B and 3TF2: chain B) but is observed to adopt different conformations. The backbone coordinates of the other two‐loop segments (β3β4 loop and β5β6 loop) are resolved in all the structures and they adopt very similar conformations. MD simulations of “3U7X: chain A” as a representative cap‐free unphosphorylated structure showed that the β7β8 loop segment has the highest degree of fluctuation (Figure S1 a and Movie S1) which underscores its poor resolution in the crystal structures. The high flexibility of the β7β8 loop has also been previously reported by Tomoo et al in their simulation study of the cap‐free eIF4E structure.22
Figure 2.
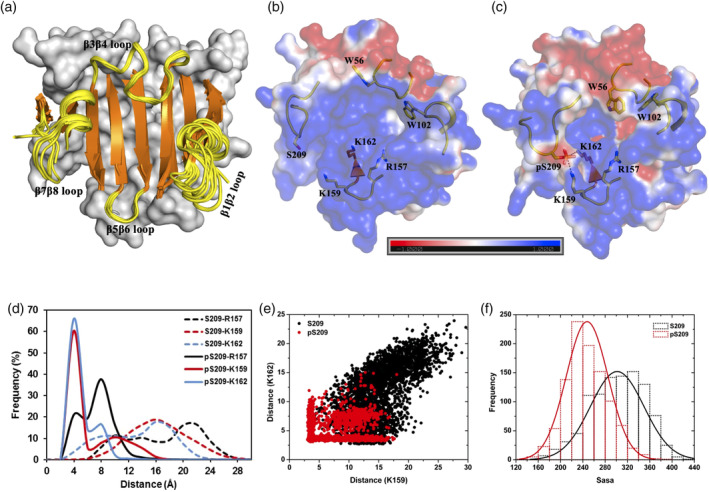
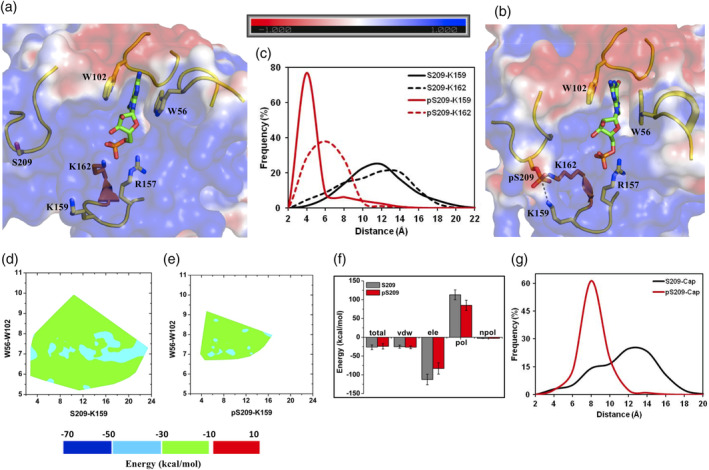
Cap‐free eIF4E structure and its phosphorylated derivative. (a) Superimposition of 11 distinct crystal structures of cap‐free state of human eIF4E (see Table S1 for PDB IDs). The eight beta strands (orange color) and the four connecting loop segments (yellow color and labeled) which form the cap‐binding interface are shown in cartoon representation. The rest of the protein is shown in surface representation in gray color. (b and c) Representative structures from MD simulations of the unphosphorylated and phosphorylated states of cap‐free eIF4E, respectively. The protein is shown in electrostatic surface representation that was created using the APBS plugin through the Pymol molecular visualization software (Schrodinger). A color gradient from blue to red represents the range of surface potential kT/e values from strongly positive (+1.0) to strongly negative (−1.0). Specific residues primarily from the four‐loop segments (displayed in yellow‐colored cartoon backbone) are shown in stick representation and labeled. The salt‐bridge tripartite network between K157‐pS209‐K162 is demonstrated explicitly with dashed lines. (d) Frequency distribution of the minimum distance between heavy atoms of specific residue pairs from MD simulations of the unphosphorylated (S209) and phosphorylated (pS209) states. (e) Scatter plot of the pair‐wise distance “K159 (NZ)‐S209/pS209 (OG)” and “K162 (NZ)‐S209/pS209 (OG)” from MD simulations of the unphosphorylated (S209) and phosphorylated (pS209) states. (f) Frequency distribution of solvent accessible surface area (Sasa) summed over a group of residues (D90, S92, F94, R112, L114, T116, G151, V153, N155, K162, A164, and W166) from MD simulations of unphosphorylated (S209) and phosphorylated (pS209) states
The S209 phosphorylated (pS209) state of eIF4E was generated from the same starting state (3U7X: chain A) and when subject to MD simulations, it is clear that upon phosphorylation, the flexibility of the β7β8 loop was relatively reduced, although it still displayed the highest fluctuations (Figure S1a). The reduction arises because pS209 is stabilized by ionic interactions with a cluster of basic residues (R157, K159, and K162) present in and around the beta‐hairpin loop connecting β5 and β6 (Figure 2b–d, Movies S1 and S2). The interaction was particularly strong with K159 and K162, while the salt‐bridge with R157 was observed less frequently and exclusively only when it was not interacting with either of the two lysine residues. S209 does not engage in any such stable interactions with any of these three residues in the unphosphorylated state. It has been previously postulated, based on crystal structures, that phosphorylation of S209 could result in the formation of a salt‐bridge with K1598, 18, 19 (Figure 2b). Our simulation data clearly showed that this interaction is indeed formed and additionally pS209 can also interact simultaneously with K162, resulting in a tripartite interaction network with the phosphate group from pS209 inserted between the side‐chain amines of these two lysine residues (Figure 2c). A pairwise distance‐based (S209/pS209‐K159 and S209/pS209‐K162) clustering of the local structural conformations in the cap‐binding interface indicated that the unphosphorylated protein occupies diverse conformations, while upon phosphorylation, the salt‐bridge network mentioned above resulted in a more restrained distribution, indicating that S209 phosphorylation orders the conformations (Figure 2e). A comparative evaluation of the solvent‐accessible surface area of the residues present in the base of the recognition pocket clearly indicated that upon phosphorylation, access to the binding pocket is significantly reduced (Figure 2f). The solvent accessible surface reduces from 160 to 400Å2 (with maximum at 290Å2) in the unphosphoryated state to 120 to 360Å2 (with maximum at 250Å2) upon phosphorylation. The data collectively indicates that phosphorylation of S209 introduces an anionic potential at the interface and also constrains the conformation of the region, thereby reducing accessibility of the pocket for the cap‐analogs.
2.2. Phosphorylation of m7GTP bound state of eIF4E
m7GTP is the most commonly used chemical analog to study the structure and mechanism of mRNA 5′ cap binding to eIF4E. A comparative structural analysis of the available 16 distinct m7GTP bound structures indicated that the β7β8 loop is completely resolved in only 6 structures (Figures 1 and S2a). In three of these structures (PDB IDs: 2W97: chain A, http://firstglance.jmol.org/fg.htm?mol=4TPW: chain A, and 4TQB: chain A), the loop is partly stabilized by interactions between the “206SGS208” residues of the region and the γ phosphate of the cap. However, in the other three structures (PDB IDs: http://firstglance.jmol.org/fg.htm?mol=4TPW: chain B, 4TQB: chain B, and 3AM7), the β7β8 loop is resolved without any observed interactions with the cap. The conformation of the loop is similar in structures within the two groups, but is different between the groups (Figure S2a). In addition, there are 10 other structures where this loop is not completely resolved. Together this indicates that the S209 containing loop is dynamic and can adopt alternate conformational states even when the m7GTP is bound. This is also corroborated from MD simulations of two representative m7GTP bound structures (PDB ID: http://firstglance.jmol.org/fg.htm?mol=4TPW: chains A and B) initiated from different conformational states of the β7β8 loop, where it is clear that the degree of fluctuations is very distinct between the two states (Figure S1b,c). In the “http://firstglance.jmol.org/fg.htm?mol=4TPW: chain A” simulation (loop oriented towards the cap), the β7β8 loop exhibited low fluctuations, whereas in the simulation of “http://firstglance.jmol.org/fg.htm?mol=4TPW: chain B” structure (loop oriented away from the cap), the β7β8 loop is observed to be the most flexible region in the protein.
Structural models with the phosphorylated state of S209 were generated from the same two different starting states mentioned above and simulated (Movies S3 and S4). Phosphorylation resulted in pS209‐K159 salt‐bridge interactions which configured the β7β8 loop into a stable state, irrespective of the starting state conformation of the loop (Figures 3a–c, S1b,c, and S3a–c); therefore, the analysis from simulation trajectories of “http://firstglance.jmol.org/fg.htm?mol=4TPW: chain A” structure are discussed in detail. The ensemble of structures generated from the simulations was clustered as a function of two distance reaction coordinates (S209‐K159 and W56‐W102). Each of these residues belonged to the four different loop segments that surround the cap‐binding interface. Clustering the data revealed that the unphosphorylated protein has relatively dispersed conformational states whereas phosphorylation resulted in a more concentrated population distribution of the structures (Figure 3d,e). The variation in the conformational distribution originates primarily from the difference in the pS209‐K159 reaction coordinate between the two systems. The binding energy of the m7GTP cap with eIF4E was then computed and mapped on to this distance‐based clustered population of the structures (Figure 3d,e). It was interesting to observe a distinct energy landscape between the two systems especially in conformations where β5β6 and β7β8 loops are close to each other (S209/pS209‐K159 distance ≤8Å). The clustered structures in this population exhibited favorable binding energies (−70 to −30 kcal/mol) for the cap in the unphosphorylated state of S209, which shifted towards significantly less favorable binding energies (−30 to −10 kcal/mol) in the phosphorylated state. Subsets of the population showed very unfavorable binding energies (−10 to 10 kcal/mol) for the cap in phosphorylated eIF4E. Further analysis of the individual binding energy components showed that the major difference is observed for the electrostatics and polar solvation terms, while the van der Waals and nonpolar solvation remained similar for both the systems (Figure 3f). The desolvation penalty for complex formation is lower for the phosphorylated state, but the weakening in the electrostatic component of binding by almost 50% upon phosphorylation results in a net reduction in the total binding energy (−43 to −19 kcal/mol) (Figure 3f). Evaluation of the binding energy contribution from residues involved in cap recognition showed that only S209 exhibited contrasting energetics between the unphosphorylated (favorable) and phosphorylated (unfavorable) states (Figure S4a). The negatively charged phosphates from pS209 and m7GTP cap are configured in close proximity (average ~4Å) (Figure 3g) due to the pS209‐K159 salt‐bridge in phosphorylated eIF4E which is a primary factor for the observed variation and decrease in the electrostatic potential in this system. Similar observations are made from the simulations of the “http://firstglance.jmol.org/fg.htm?mol=4TPW: chain B” structure (Figures S3 and S4B).
Figure 3.
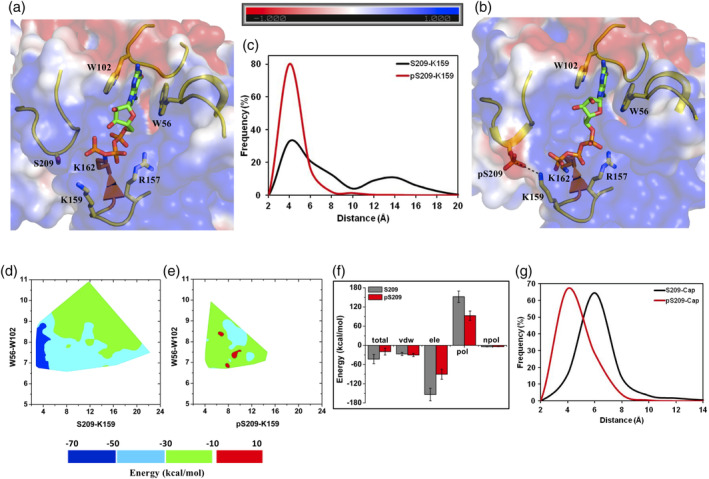
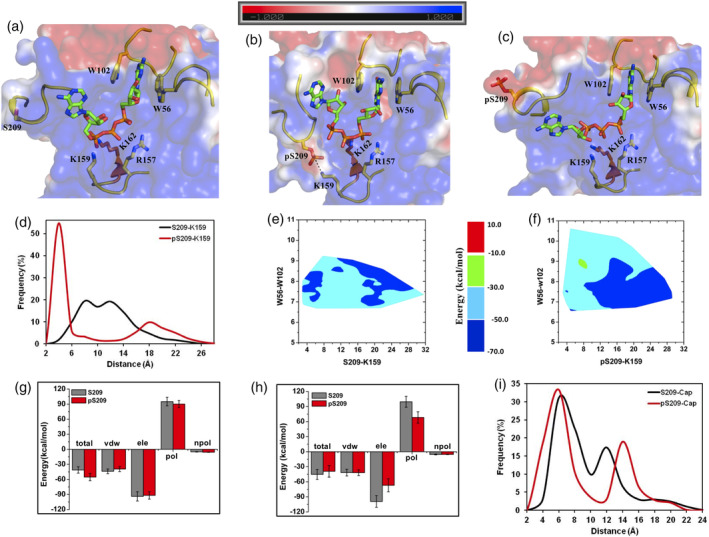
m7GTP bound eIF4E structure and its phosphorylated derivative. Representative structures from MD simulations (initiated from 4TPW: chain A) of the (a) unphosphorylated and (b) phosphorylated states of m7GTP bound eIF4E. The salt‐bridge between K159‐pS209 is demonstrated explicitly with dashed lines. (c) Frequency distribution of the minimum distance between heavy atoms of “K159‐S209/pS209” residue pairs from MD simulations of the unphosphorylated (S209) and phosphorylated (pS209) states. (d and e) Contour plot of the m7GTP binding energy with eIF4E as a function of the pairwise distance reaction coordinates between “W56‐W102” (distance between center of mass of the indole rings) and “K159 (NZ)‐S209/pS209 (OG)” from MD simulations of the unphosphorylated and phosphorylated states respectively. (f) Binding energy of m7GTP cap with eIF4E and its decomposition into individual components from MD simulations of the unphosphorylated (S209) and phosphorylated (pS209) states. Tot, total binding energy; vdw, van der walls; ele, electrostatics; pol, polar solvation; npol, nonpolar solvation energy terms. The actual “ele” (−923 kcal/mol and − 541 kcal/mol) and “pol” (911 kcal/mol and 556 kcal/mol) energy values are divided by a factor of six for efficient comparison with other energy terms. (g) Frequency distribution of the minimum distance between heavy atoms of the m7GTP cap and residue S209/pS209 from MD simulations of the unphosphorylated (S209) and phosphorylated (pS209) states
In summary, phosphorylation of S209 promoted the formation of the salt‐bridge with K159 as was previously postulated.8, 18, 19 However, the general notion that this would favorably clamp and stabilize the cap‐analog in the binding pocket is not supported by our data. On the contrary, it suggests that the bound state energetics in‐fact become less favorable due to electrostatic repulsion between the phosphate moieties of the cap and phosphoserine.
2.3. Phosphorylation of m7GDP and m7GMP bound states of eIF4E
We next investigated the influence of S209 phosphorylation on the binding energetics of cap‐analogs with reduced negative charges. For this, we considered the di (m7GDP) and mono (m7GMP) phosphate derivatives of the cap‐analog.
2.4. m7GDP
MD simulations of an m7GDP bound structure (PDB ID: http://firstglance.jmol.org/fg.htm?mol=4TQC: chain A) with a modeled β7β8 loop (based on http://firstglance.jmol.org/fg.htm?mol=4TPW: chain A conformation; Figure S2b) and its S209 phosphorylated derivative showed that the inherent flexibility of the β7β8 loop region in the unphosphorylated protein is stabilized upon phosphorylation of S209 by a pS209‐K159 salt‐bridge (Figures S1d, 4a–c, Movies S5 and S6). Consequently, the conformational distributions of the clustered structural populations between the two states (broad: S209 and restricted: pS209) of the protein (Figure 4d,e) were observed to be similar to that seen in the m7GTP bound complex. The binding energy of m7GDP cap computed and mapped onto the clustered populations of structures also shows different energy profiles between the two states of eIF4E (Figure 4d,e). When the two loops enclose the cap (S209/pS209‐K159 distance ≤8 Å), the energy is considerably less favorable (−30 to 10 kcal/mol) for phosphorylated eIF4E as compared to the unphosphorylated protein (−70 to −30 kcal/mol) (Figure 4d,e). Decomposition of the binding energy showed that the desolvation cost is lower in phosphorylated eIF4E, but the electrostatic component of binding is reduced significantly (~50%) (Figure 4f) due to the repulsive potential created by the close proximity (average ~4Å) of the phosphates from pS209 and m7GDP (Figure 4g). This is also reflected in the contrasting binding energy contributions from S209 between the systems (Figure S4c). The electrostatic potential contributes to the overall decrease in the binding energetics by almost half (−39 to −17 kcal/mol) for the cap‐analog when eIF4E is phosphorylated (Figure 4f). Thus, despite the reduction in the negative charge of the cap‐analog, the pS209‐K159 salt‐bridge clamp still created an energetically unfavorable bound state for m7GDP.
Figure 4.
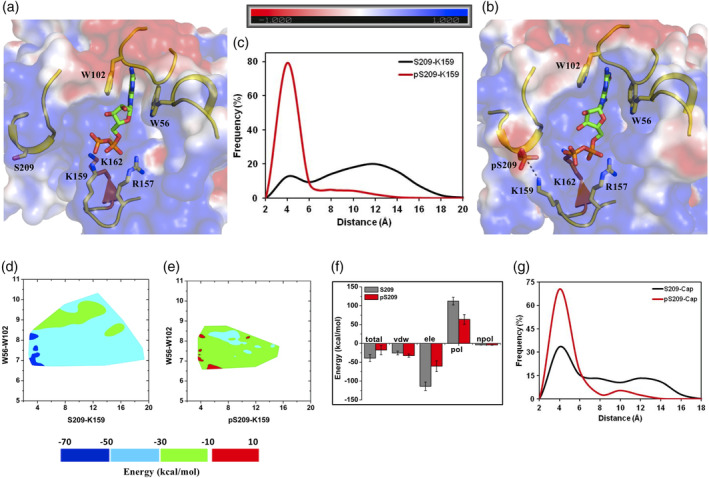
m7GDP bound eIF4E structure and its phosphorylated derivative. Representative structures from MD simulations of the (a) unphosphorylated and (b) phosphorylated states of m7GDP bound eIF4E. The salt‐bridge between K159‐pS209 is demonstrated explicitly with dashed lines. (c) Frequency distribution of the minimum distance between heavy atoms of “K159‐S209/pS209” residue pairs from MD simulations of the unphosphorylated (S209) and phosphorylated (pS209) states. (d and e) Contour plot of the m7GDP binding energy with eIF4E as a function of the pairwise distance reaction coordinates between “W56‐W102” (distance between center of mass of the indole rings) and “K159 (NZ)‐S209/pS209 (OG)” from MD simulations of the unphosphorylated and phosphorylated states respectively. (f) Binding energy of m7GDP cap with eIF4E and its decomposition into individual components from MD simulations of the unphosphorylated (S209) and phosphorylated (pS209) states. Tot, Total binding energy; vdw, van der walls; ele, electrostatics; pol, polar solvation; npol, nonpolar solvation energy terms. The actual “ele” (−682 kcal/mol and −363 kcal/mol) and “pol” (672 kcal/mol and 381 kcal/mol) energy values are divided by a factor of six for efficient comparison with other energy terms. (g) Frequency distribution of the minimum distance between heavy atoms of the m7GDP cap and residue S209/pS209 from MD simulations of the unphosphorylated (S209) and phosphorylated (pS209) states
2.5. m7GMP
MD simulations of an m7GMP bound eIF4E (PDB ID: http://firstglance.jmol.org/fg.htm?mol=5ZK7: chain A) with a modeled β7β8 loop (based on the conformation of http://firstglance.jmol.org/fg.htm?mol=4TPW: chain A structure; Figure S2c) and its S209 phosphorylated derivative showed that the β7β8 loop has the highest degree of fluctuation in the unphosphorylated protein which was stabilized in its phosphorylated state (Figure S1e). The stabilization occurs through a tripartite salt‐bridge linkage between pS209, K159, and K162 (Figure 5a–c, Movies S7 and S8). The local interaction network is similar to that observed in the case of the cap‐free state of eIF4E wherein the phosphate of pS209 was inserted between the amines of the two lysine residues (Figure 5b). The nature of the conformational distribution for the clustered ensemble of structures between the two states of the protein is similar to that observed in the di‐ and tri‐phosphate derivatives (Figure 5d,e). Significantly, the energy landscape, unlike in the case of the other two cap‐analogs, is found to be comparable (−50 to −10 kcal/mol) between the phosphorylated and unphosphorylated eIF4E (Figure 5d,e) and the overall binding energy of m7GMP cap remains similar (−26 and − 24 kcal/mol) (Figure 5f). The individual energy terms including desolvation and the electrostatic components of binding were found to be relatively less affected by phosphorylation (Figure 5f). There was also negligible binding energy contribution from S209 in both the systems (Figure S4d). This energetic profile could primarily result because the negatively charged phosphates from the cap and pS209 were spatially more distant in this complex (average ~10 Å) (Figure 5g) as compared to the previous two cap‐analogs (average ~4 Å) (Figures 3g and 4g). The data collectively suggested that the pS209‐K159/K162 salt‐bridge clamp that emerges upon phosphorylation did not adversely affect the bound state energetics of m7GMP.
Figure 5.
m7GMP bound eIF4E structure and its phosphorylated derivative. Representative structures from MD simulations of the (a) unphosphorylated and (b) phosphorylated states of m7GMP bound eIF4E. The salt‐bridge tripartite network between K157‐pS209‐K162 is demonstrated explicitly with dashed lines. (c) Frequency distribution of the minimum distance between heavy atoms of “K159‐S209/pS209” and “K162‐S209/pS209” residue pairs from MD simulations of the unphosphorylated (S209) and phosphorylated (pS209) states. (d and e) Contour plot of the m7GMP binding energy with eIF4E as a function of the pairwise distance reaction coordinates between “W56‐W102” (distance between center of mass of the indole rings) and “K159 (NZ)‐S209/pS209 (OG)” from MD simulations of the unphosphorylated and phosphorylated states respectively. (f) Binding energy of m7GMP cap with eIF4E and its decomposition into individual components from MD simulations of the unphosphorylated (S209) and phosphorylated (pS209) states. Tot, Total binding energy; vdw, van der walls; ele, electrostatics; pol, polar solvation; npol, nonpolar solvation energy terms. The actual “ele” (−337 kcal/mol and −249 kcal/mol) and “pol” (339 kcal/mol and 254 kcal/mol) energy values are divided by a factor of three for efficient comparison with other energy terms. (g) Frequency distribution of the minimum distance between heavy atoms of the m7GMP cap and residue S209/pS209 from MD simulations of the unphosphorylated (S209) and phosphorylated (pS209) states
2.6. Phosphorylation of m7GpppA bound state of eIF4E
The “m7GpppX (X is the second nucleoside)” derivative has also been frequently used as a chemical analog to study mRNA‐cap: eIF4E interactions. Crystal structures of m7GpppA in complex with human eIF4E protein (PDB IDs: 1WKW and 1IPB) showed that the adenine nucleoside interacted with the β7β8 loop and the segment was completely resolved in these structures (Figure S2d). MD simulations initiated from a representative complex structure (1WKW) indicated that the adenine nucleoside largely remained in contact with the β7β8 loop as observed in the crystal structure; but there were additional conformations of the nucleoside where it was either exposed to the solvent or interacted with other regions of the binding interface (Movie S9). The disruption of the crystallographically observed interaction of the adenine nucleoside with the protein was also reported by Tomoo et al in their simulation of the m7GpppA: eIF4E complex.22 The dynamic nature of the nucleoside meant that it did not entirely stabilize the β7β8 loop and consequently, it was observed to have the highest degree of fluctuation in the protein (Figure S1f). Interestingly, phosphorylation of S209 residue did not promote the stability of the loop region as was observed in the case of the other cap‐analogs (Figure S1f). The principal reason for this difference was the absence of a salt‐bridge between pS209 and K159 in a substantial population (~35%) in the ensemble of MD simulated structures because the second nucleoside interacted and displaced the β7β8 loop away from the binding interface (Figure 6a–d, Movies S9 and S10). However, the salt‐bridge clamp was still formed in the remaining population (~65%) of structures when the nucleoside was not in contact with the β7β8 loop (Figure 6b,d). Tomoo et al did not observe any direct salt‐bridge formation in their simulation of the phosphorylated derivative of this complex despite the shortening of the pS209–K159 distance probably due to the shorter time scale of their simulation.22
Figure 6.
m7GpppA bound eIF4E structure and its phosphorylated derivative. Representative structures from MD simulations of the (a) unphosphorylated and (b and c) phosphorylated states of m7GpppA bound eIF4E. The salt‐bridge between K159‐pS209 is demonstrated explicitly with dashed lines. (d) Frequency distribution of the minimum distance between the heavy atoms of “K159‐S209/pS209” residue pairs from MD simulations of the unphosphorylated (S209) and phosphorylated (pS209) states. (e and f) Contour plot of the m7GpppA binding energy with eIF4E as a function of the pairwise distance reaction coordinates between “W56‐W102” (distance between center of mass of the indole rings) and “K159 (NZ)‐S209/pS209 (OG)” from MD simulations of the unphosphorylated and phosphorylated states respectively. (g and h) Binding energies of m7GpppA cap with eIF4E and its decomposition into individual components from MD simulations of the unphosphorylated (S209) and phosphorylated (pS209) states. Tot, Total binding energy; vdw, van der walls; ele, electrostatics; pol, polar solvation; npol, nonpolar solvation energy terms. The actual “ele” (−563/−585 kcal/mol and −550/−415 kcal/mol) and “pol” (570/589 kcal/mol and 540/416 kcal/mol) energy values are divided by a factor of six for efficient comparison with other energy terms. (i) Frequency distributions of the minimum distances between the heavy atoms of the m7GMP cap and S209/pS209 from MD simulations of the unphosphorylated (S209) and phosphorylated (pS209) states
The dynamic nature of the adenosine nucleoside collectively produced a broad conformational distribution of the clustered structures in both the phosphorylated and unphosphorylated states of S209 (Figure 6e,f). Interestingly, the binding energy of the cap‐analog plotted onto these conformations showed a distinct pattern between the two systems. In conformations where the β7β8 loop is displaced by the second nucleoside (pS209/S209‐K159 distance ≥8Å), the binding energy was largely similar in both the states (−70 to −30 kcal/mol); whereas in conformations where the pocket is constricted (pS209/S209‐K159 distance ≤8Å), the binding energy of the cap in the unphosphorylated state was relatively more favorable (−70 to −30 kcal/mol) as compared to the phosphorylated state (−50 to −30 kcal/mol). The average binding energy and its decomposition clearly showed that the energy values were similar (Figures 6g and S4e) when the negatively charged phosphates of pS209 and the cap‐analog were apart (populations with distances ≥12Å) and no pS209‐K159 salt‐bridge was formed (Figure 6i). However, when these charged phosphate moieties are brought into closer proximity (populations with average distance of 8 Å) (Figure 6i) through the formation of the salt‐bridge, the desolvation penalty along with the electrostatic interaction energy for complexation is decreased in the phosphorylated system (Figure 6h). The residue‐wise binding energy contribution from pS209 in this configuration is also observed to be unfavorable (Figure S4f), unlike in structures without the salt‐bridge where it has negligible contribution to the binding energetics (Figure S4e). Collectively, these analyses further strengthen the observation that the spatial configuration of the phosphates can contribute to the reduction in the binding energy of the cap‐analog. In summary, the formation of the clamp between the β7β8 loop and the β5β6 loop via the pS209‐K159 salt‐bridge interactions created an energetically less favorable bound state for the m7GpppA cap‐analog, despite the presence of the second nucleoside.
3. DISCUSSION
We have explored molecular details of eIF4E phosphorylation at S209 and its effects on the structure and interactions with mRNA‐cap using MD simulations. The findings support the postulate made from an examination of the eIF4E crystal structures that salt‐bridge interactions between phosphorylated S209 and K159 are an integral feature that emerges as a consequence of the phosphorylation event.8, 18, 19 The intra‐molecular interactions between residues located at different spatial regions in the cap‐binding pocket of the protein results in the conformational restriction of the otherwise highly flexible loop segment connecting strands β7 and β8 in eIF4E. The plasticity of the loop is also captured in the only reported solution‐state structure of apo eIF4E (PDB ID: http://firstglance.jmol.org/fg.htm?mol=2GPQ) (Figure S5a,b) which highlights the large scale motion required to form the interactions with the β5β6 loop. It was interesting to observe that phosphorylation of S209 could indeed drive this movement (distances ≥30Å) of the loop towards the cluster of basic residues eventually resulting in the formation of the salt‐bridge network with K159 and K162 (Figure S5c–e). Long‐range electrostatic forces are one of the major determinants which direct the cap towards its recognition interface on eIF4E.23, 24 A postulated two‐step mechanism of binding involves initial docking between the negatively charged phosphates in the cap and the positively charged residues (R157, K159, and K162) present in the pocket followed by the formation of stacking interactions between the guanosine base and the aromatic residues (W56 and W102).24 The presence of the negative potential due to phosphorylation of S209 is thus generally considered as a primary factor that could affect mRNA cap binding due to electrostatic repulsion between the phosphorylated S209 and the negatively charged phosphates of the cap. Our data suggest that phosphorylation of S209 could also alter the physical nature of the binding interface through the formation of an interaction network with K159 and K162. It thereby reduces the accessibility of the binding cavity and this in principle should result in a less favorable environment for the cap‐analog to efficiently dock into the binding interface. The association kinetics of mRNA cap‐analogs with recombinant eIF4E protein have been shown to be reduced by phosphorylation,20 which could be rationalized by this structural state of the protein.
Phosphorylation and the subsequent formation of the salt‐bridge have also been postulated to clamp and stabilize the mRNA cap in the binding pocket,8, 18, 19 which is however at odds with the observed increase in their rates of dissociation from phosphorylated eIF4E.19 The discrepancy can be explained by the observation that the bound‐state energy of the mRNA cap is found to be significantly compromised in the phosphorylated state of eIF4E because the salt‐bridge structures the negative charges from the phosphates of pS209 and the cap in a confined spatial environment. The impact of this local structural configuration is also highlighted by the fact that when the phosphate groups are separated (m7GMP or in a subpopulation of m7GpppA), the binding energy of the cap is unaffected by phosphorylation. In order to further examine this aspect, a monoanionic charge state of pS209 and m7GTP cap (net charge of “‐1e” and “‐2e”, respectively) was modeled into the complex. Simulation of this system showed that the pS209‐K159 salt‐bridge formed is comparatively weaker as compared to the formation of this salt‐bridge in the dianionic state of phosphoserine (Figure S6a–c). It is also remarkable to find that the binding energetics of the cap in the clustered population of structures is significantly better (mean of −37 kcal/mol for monoanionic phosphoserine and −19 kcal/mol for dianionic phosphoserine) with the reduced negative charges on the phosphates (Figure S6d,e). The favorable energy state in the monanionic version, despite having a similar structural organization of the phosphates as in the dianionic state (Figure S6f), arises because the concentrated negative potential in this chemical environment is markedly neutralized by the attached protons. It captures the essence of the electrostatic forces in the process and although the simulations do not explicitly witness the actual release of the cap from the interface, the energetics undoubtedly highlights the weakening of the protein: cap association. Zuberek et al have shown through generation of mutant and phosphorylated derivatives of eIF4E that electrostatic repulsion between negatively charged phosphate groups has a definite detrimental influence on the interaction of phosphorylated eIF4E and mRNA capped analogs.18, 21 Thus, the observed reduction of bound state energy in our simulations should in principle be an event that precedes dissociation which underscores the revelation that the salt‐bridge does not act as a clamp, instead it potentially leads to destabilization of the cap from the binding pocket.
Based on these observations, we propose a model for the phosphorylated regulation of eIF4E: mRNA‐cap interaction (Figure 7). Unphosphorylated eIF4E has been shown to initiate translation,25, 26 which indicates that this post‐translational modification is not critical for the normal biological activity of the protein (Figure 7a,b,e). One of the crucial aspects about the process of eIF4E phosphorylation that currently remains uncertain is whether the protein is phosphorylated before or after mRNA binding. If phosphorylation does occur after its interaction with the mRNA, the unfavorable electrostatic forces in the pocket suggest that the mRNA will dissociate at a faster rate from the protein (Figure 7c,e). On the other hand, if phosphorylation occurs prior to mRNA binding, the physical nature of the cap recognition pocket is modulated such that it is not optimum for mRNA‐cap docking (Figure 7d). This coupled with the presence of the negative potential at the pocket interface would suggest a reduction in the association rate of the mRNA‐cap with the protein. The mRNA released from the phosphorylated eIF4E can potentially be recognized by unphosphorylated or dephosphorylated eIF4E to reinitiate the process of translation (Figure 7a,d). Thus, the model collectively indicates that eIF4E phosphorylation can regulate the frequency of mRNA translation based on the period of occurrence of the modification. The selective enhancement in the synthesis of oncogenic proteins is generally correlated with eIF4E phosphorylation.9, 10, 11 The increased rate of mRNA dissociation and translation re‐initiation due to phosphorylation could be a primary aspect in this biological process. Thus phosphorylation as a regulatory model has an incremental effect on cap‐dependent translation but this is achieved through a counter‐intuitive process which involves a decrease in the binding affinity of the mRNA‐cap with eIF4E.
Figure 7.
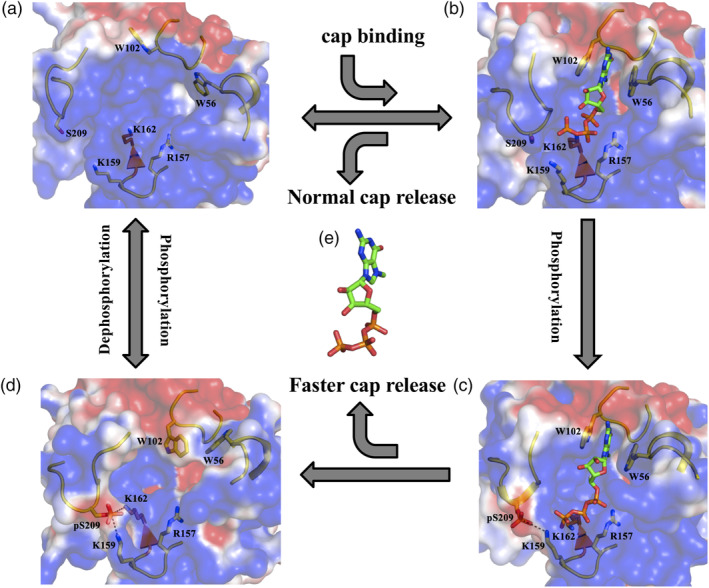
Molecular model for the phosphorylated regulation of eIF4E: mRNA‐cap interaction. Representative structural state of (a) cap‐free, (b) m7GTP bound, (c) S209 phosphorylated m7GTP bound and (d) S209 phosphorylated cap‐free eIF4E. The salt‐bridge between K159‐pS209 and K162‐pS209 is demonstrated explicitly with dashed lines. The arrows indicate the transition between different states, binding and release of the m7GTP cap accompanying the phosphorylation/dephosphorylation events, which are accordingly labeled. (e) Stick representation of the m7GTP cap‐analog
4. MATERIALS AND METHODS
4.1. Structural data
The atomic coordinates of the crystallographically resolved structures of human eIF4E were obtained from the protein data bank (PDB). A total of 37 structures (including multiple chains in some unit cells) were available (as of July 1, 2019) which were classified into different groups based on the presence/absence of cap‐analogs and also on the different variants of the analogs (Table S1). These included 11 structures that are cap‐free, 16 structures with m7GTP bound, two structures each with m7GDP, m7GMP, and m7GpppA bound cap‐analogs.
4.2. Initial structures for modeling and MD simulations
The selection of the initial structures for modeling and MD simulations of the phosphorylated and unphoshorylated states of eIF4E was mainly guided by the structural information available for the β7β8 loop which contains the S209 residue. 3U7X (chain A) was used as a representative structure for simulation of cap‐free eIF4E because it was one of the only three structures in which the backbone coordinates of β7β8 loop were completely resolved and the conformation of the loop was similar across all of them (Figure 2a). Simulations of m7GTP bound state were initiated from two starting structures (PDB ID: http://firstglance.jmol.org/fg.htm?mol=4TPW: chains A and B) which only differed in the backbone conformation of the β7β8 loop (Figure S2a). Chain A from 4TQC and 5ZKA were respectively selected for the m7GDP and m7GMP bound states (Figure S2b,c); the unresolved regions of the β7β8 loop in both these structures were modeled using the m7GTP bound representative structure (http://firstglance.jmol.org/fg.htm?mol=4TPW: chain A) as a template. The backbone conformation of β7β8 loop was similar in both the m7GpppA structures (Figure S2d) and 1WKW was selected as a starting state model. The respective S209 phosphorylated state simulations (pS209) for each of the five different systems were initiated from the same starting conformations as the selected representative structures. This information is also summarized in Table S1.
4.3. Simulation parameters for cap‐analogs and phosphoserine
The phosphate groups in the different cap derivatives were considered to be in the dianionic states and so the net charge of m7GTP, m7GDP, m7GMP, and m7GpppA analogs were “‐3e”, “‐2e”, “‐1e”, and “‐2e”, respectively. RESP (restricted electrostatic potential) based atomic charges were derived using a combination of the building block fragments from F‐90 R.E.DD.B database27 and the R.E.D. server28 by employing the RESP‐A1A (HF/6‐31G*) charge model and the Guassian_2009_C.01 quantum_mechanics program. The RESP atomic charges for the second adenosine nucleoside in m7GpppA analog were obtained from the RNA library of AMBER16.29 All other force field parameters for the cap‐analogs were derived from GAFF2 database30, 31 available through the Antechamber30 module in AMBER16.29 The phosphate group in phosphorylated serine was also considered to be in the dianionic state with a net charge of “‐2e”. The amber library files for phosphoserine were downloaded from http://research.bmh.manchester.ac.uk/bryce/amber wherein the force field parameters for the modified amino acid were derived from the work by Craft and Legge.32
4.4. Simulation details
The N‐terminal region of eIF4E is not completely resolved in any of these structures and so the effective length of the protein considered for the study is from K36 to V217 (Uniprot ID: P06730). The N‐terminus was capped with ACE (acetyl) functional group while the C‐terminus was uncapped, and hence terminated with the COO− carboxyl group. A cuboid box was used for simulations whose dimensions were fixed by placing the structures in the center and maintaining a minimum distance of 10 Å between any protein atom and the box boundaries, ensuring reasonable solvation layers around the structures; solvation was carried out with the TIP3P water model.33 The net charge of each system was neutralized by adding an appropriate number of counter ions (Na+ or Cl−). MD simulations were carried out using the PMEMD module through the AMBER16 suite of programs. All‐atom ff14SB force field parameters34 were used for the protein and GAFF2 parameters from AMBER1629 with RESP derived charges were employed for the cap‐analogs. The simulation protocol involved energy minimization (steepest descent followed by conjugate gradient), followed by heating to 300 K over 30 ps under NVT ensemble, equilibration for 500 ps and finally production dynamics, the latter two carried out under NPT conditions. All the systems were simulated in triplicates for 100 ns each with different initial velocities during equilibration, totaling 3.6 μs of simulated trajectories (Table S1). Langevin dynamics35 was used to maintain the temperature at 300 K (collision frequency: 1.0 ps−1) while the pressure was maintained at 1 atm using weak‐coupling36 (relaxation time: 1 ps). Periodic boundary conditions were appropriately applied and the long‐range electrostatic interactions were computed using the Particle Mesh Ewald (PME) method.37 All the bonds involving hydrogen atoms were constrained using the SHAKE algorithm38 which enabled an integration time step of 2 fs for solving the equations of motion.
4.5. Binding energy calculations
Binding energies were estimated using the MM/GBSA (molecular mechanics/generalized born surface area) method39 in which the free energy of a state is calculated according to the following equation:
where E bon comprises of three bonded (bond, angle, and dihedral) energy components, E vdw and E elec together represent the nonbonded interactions. These energies are calculated from the standard molecular mechanics (MM) force field terms used in the MD simulations. G pol and G npol are the polar and nonpolar solvation energies which are respectively obtained by solving the generalized born (GB) solvation model and an empirical linear relationship (γ*SASA), where “γ” is the surface‐tension and “SASA” is the solvent accessible surface area. “T” is the absolute temperature and “S” is the entropy which is computed using normal mode analysis on the structures generated from simulations.
An estimate of the binding free energy for eIF4E: Cap complex formation was obtained from:
Single trajectory protocol (STP) approach was employed in which the complex state simulations were used to generate the ensembles of structures for the corresponding free states of the protein and cap. This approach leads to the cancelation of the bonded (E bon) energy terms. Entropy was also not included in the calculations because of the large size of the systems, which resulted in the effective free energy of binding composed of the following energy terms:
Three thousand structures covering the entire simulation period of the concatenated trajectories were extracted at equal intervals and the explicit solvent molecules used in the complex simulations were removed from each of these snapshots. An implicit GB model (IGB = 2) was subsequently used to represent the continuum solvent environment. The internal dielectric constant for the protein was set to one while that for solvent water was set to 80, γ = 0.0072 kcal/mol/Å2 and the salt‐concentration were set to 150 mM, assumed to represent the physiological concentration. The MMPBSA.py script40 available through the AMBER16 suite of programs was used to carry out the binding energy calculations and its decomposition.
4.6. Binding energy landscape
A total of 3,000 sampled structures were extracted at equal intervals of time over the entire range of the concatenated (300 ns) simulation trajectories. They were then clustered by using two distance reaction coordinates (S209/pS209‐K159 and W56‐W102). Each of these residues belonged to the four different loop segments (β1β2 loop, β3β4 loop, β5β6 loop, and β7β8 loop) that are involved in the recognition of the mRNA‐cap. The binding energy of the cap‐analogs with eIF4E was computed (as described under Section 4.5) for the structures and mapped on to the distance‐based cluster. They were segregated into four different energy groups and color coded differently to define the energy landscape of the cap‐bound state with eIF4E as a function of the two distance reaction coordinates.
4.7. Clustering of simulated structures
The ensemble of structures generated from the MD simulations was clustered into distinct sets based on the conformation of residues W56, W102, S029/pS209, and K159. A total of 3,000 structures sampled were extracted at equal intervals of time over the entire range of the concatenated (300 ns) simulation trajectories. Only the heavy atoms of these residues were considered for the analysis. Clustering was performed using the average‐linkage algorithm41 and root mean square deviation (RMSD) was used as a distance matrix.
CONFLICTS OF INTEREST
Chandra S. Verma is the founder director of Sinopsee therapeutics, a biotech company developing molecules for therapeutic purposes; the current work has no conflict with the company.
Supporting information
Data S1: Supporting information
ACKNOWLEDGMENTS
We thank BMRC (A*STAR) Singapore for financial support (grant IAF111213C) and for computational resources.
Lama D, Verma CS. Deciphering the mechanistic effects of eIF4E phosphorylation on mRNA‐cap recognition. Protein Science. 2020;29:1373–1386. 10.1002/pro.3798
Funding information BMRC (A*STAR) Singapore, Grant/Award Number: IAF111213C
Contributor Information
Dilraj Lama, Email: dilraj.lama@ki.se.
Chandra S. Verma, Email: chandra@bii.a-star.edu.sg.
REFERENCES
- 1. Ardito F, Giuliani M, Perrone D, Troiano G, Muzio LL. The crucial role of protein phosphorylation in cell signaling and its use as targeted therapy. Int J Mol Med. 2017;40:271–280. [DOI] [PMC free article] [PubMed] [Google Scholar]
- 2. Taylor SS, Kornev AP. Protein kinases: Evolution of dynamic regulatory proteins. Trends Biochem Sci. 2011;36:65–77. [DOI] [PMC free article] [PubMed] [Google Scholar]
- 3. Joshi S, Platanias LC. Mnk kinase pathway: Cellular functions and biological outcomes. World J Biol Chem. 2014;5:321–333. [DOI] [PMC free article] [PubMed] [Google Scholar]
- 4. Proud CG. Mnks, eIF4E phosphorylation and cancer. Biochim Biophys Acta. 2015;1849:766–773. [DOI] [PubMed] [Google Scholar]
- 5. Merrick WC. eIF4F: A retrospective. J Biol Chem. 2015;290:24091–24099. [DOI] [PMC free article] [PubMed] [Google Scholar]
- 6. Pelletier J, Graff J, Ruggero D, Sonenberg N. Targeting the eIF4F translation initiation complex: A critical nexus for cancer development. Cancer Res. 2015;75:250–263. [DOI] [PMC free article] [PubMed] [Google Scholar]
- 7. Shveygert M, Kaiser C, Bradrick SS, Gromeier M. Regulation of eukaryotic initiation factor 4E (eIF4E) phosphorylation by mitogen‐activated protein kinase occurs through modulation of Mnk1‐eIF4G interaction. Mol Cell Biol. 2010;30:5160–5167. [DOI] [PMC free article] [PubMed] [Google Scholar]
- 8. Scheper GC, Proud CG. Does phosphorylation of the cap‐binding protein eIF4E play a role in translation initiation? Eur J Biochem. 2002;269:5350–5359. [DOI] [PMC free article] [PubMed] [Google Scholar]
- 9. D'Abronzo LS, Ghosh PM. eIF4E phosphorylation in prostate vancer. Neoplasia. 2018;20:563–573. [DOI] [PMC free article] [PubMed] [Google Scholar]
- 10. Fan S, Ramalingam SS, Kauh J, Xu Z, Khuri FR, Sun SY. Phosphorylated eukaryotic translation initiation factor 4 (eIF4E) is elevated in human cancer tissues. Cancer Biol Ther. 2009;8:1463–1469. [DOI] [PMC free article] [PubMed] [Google Scholar]
- 11. Bramham CR, Jensen KB, Proud CG. Tuning specific translation in cancer metastasis and synaptic memory: Control at the MNK‐eIF4E axis. Trends Biochem Sci. 2016;41:847–858. [DOI] [PubMed] [Google Scholar]
- 12. Topisirovic I, Ruiz‐Gutierrez M, Borden KL. Phosphorylation of the eukaryotic translation initiation factor eIF4E contributes to its transformation and mRNA transport activities. Cancer Res. 2004;64:8639–8642. [DOI] [PubMed] [Google Scholar]
- 13. Aguilar‐Valles A, Haji N, De Gregorio D, et al. Translational control of depression‐like behavior via phosphorylation of eukaryotic translation initiation factor 4E. Nat Commun. 2018;9:2459. [DOI] [PMC free article] [PubMed] [Google Scholar]
- 14. Amorim IS, Kedia S, Kouloulia S, et al. Loss of eIF4E phosphorylation engenders depression‐like behaviors via selective mRNA translation. J Neurosci. 2018;38:2118–2133. [DOI] [PMC free article] [PubMed] [Google Scholar]
- 15. Amorim IS, Lach G, Gkogkas CG. The role of the eukaryotic translation initiation factor 4E (eIF4E) in neuropsychiatric disorders. Front Genet. 2018;9:561. [DOI] [PMC free article] [PubMed] [Google Scholar]
- 16. Borden KL. The eukaryotic translation initiation factor eIF4E wears a "cap" for many occasions. Translation. 2016;4:e1220899. [DOI] [PMC free article] [PubMed] [Google Scholar]
- 17. Pyronnet S. Phosphorylation of the cap‐binding protein eIF4E by the MAPK‐activated protein kinase Mnk1. Biochem Pharmacol. 2000;60:1237–1243. [DOI] [PubMed] [Google Scholar]
- 18. Zuberek J, Wyslouch‐Cieszynska A, Niedzwiecka A, et al. Phosphorylation of eIF4E attenuates its interaction with mRNA 5′ cap analogs by electrostatic repulsion: Intein‐mediated protein ligation strategy to obtain phosphorylated protein. RNA. 2003;9:52–61. [DOI] [PMC free article] [PubMed] [Google Scholar]
- 19. Scheper GC, van Kollenburg B, Hu J, Luo Y, Goss DJ, Proud CG. Phosphorylation of eukaryotic initiation factor 4E markedly reduces its affinity for capped mRNA. J Biol Chem. 2002;277:3303–3309. [DOI] [PubMed] [Google Scholar]
- 20. Slepenkov SV, Darzynkiewicz E, Rhoads RE. Stopped‐flow kinetic analysis of eIF4E and phosphorylated eIF4E binding to cap analogs and capped oligoribonucleotides: Evidence for a one‐step binding mechanism. J Biol Chem. 2006;281:14927–14938. [DOI] [PubMed] [Google Scholar]
- 21. Zuberek J, Jemielity J, Jablonowska A, et al. Influence of electric charge variation at residues 209 and 159 on the interaction of eIF4E with the mRNA 5′ terminus. Biochemistry. 2004;43:5370–5379. [DOI] [PubMed] [Google Scholar]
- 22. Tomoo K, Shen X, Okabe K, et al. Structural features of human initiation factor 4E, studied by X‐ray crystal analyses and molecular dynamics simulations. J Mol Biol. 2003;328:365–383. [DOI] [PubMed] [Google Scholar]
- 23. Blachut‐Okrasinska E, Antosiewicz JM. Brownian dynamics simulations of binding mRNA cap analogues to eIF4E protein. J Phys Chem B. 2007;111:13107–13115. [DOI] [PubMed] [Google Scholar]
- 24. Niedzwiecka A, Marcotrigiano J, Stepinski J, et al. Biophysical studies of eIF4E cap‐binding protein: Recognition of mRNA 5′ cap structure and synthetic fragments of eIF4G and 4E‐BP1 proteins. J Mol Biol. 2002;319:615–635. [DOI] [PubMed] [Google Scholar]
- 25. Ueda T, Watanabe‐Fukunaga R, Fukuyama H, Nagata S, Fukunaga R. Mnk2 and Mnk1 are essential for constitutive and inducible phosphorylation of eukaryotic initiation factor 4E but not for cell growth or development. Mol Cell Biol. 2004;24:6539–6549. [DOI] [PMC free article] [PubMed] [Google Scholar]
- 26. Furic L, Rong L, Larsson O, et al. eIF4E phosphorylation promotes tumorigenesis and is associated with prostate cancer progression. Proc Natl Acad Sci U S A. 2010;107:14134–14139. [DOI] [PMC free article] [PubMed] [Google Scholar]
- 27. Dupradeau FY, Cezard C, Lelong R, et al. R.E.DD.B.: A database for RESP and ESP atomic charges, and force field libraries. Nucleic Acids Res. 2008;36:D360–D367. [DOI] [PMC free article] [PubMed] [Google Scholar]
- 28. Vanquelef E, Simon S, Marquant G, et al. R.E.D. server: A web service for deriving RESP and ESP charges and building force field libraries for new molecules and molecular fragments. Nucleic Acids Res. 2011;39:W511–W517. [DOI] [PMC free article] [PubMed] [Google Scholar]
- 29. Case DA, Betz RM, Cerutti DS, et al. AMBER 16. San Francisco: University of California, 2016. [Google Scholar]
- 30. Wang J, Wolf RM, Caldwell JW, Kollman PA, Case DA. Development and testing of a general AMBER force field. J Comput Chem. 2004;25:1157–1174. [DOI] [PubMed] [Google Scholar]
- 31. Vassetti D, Pagliai M, Procacci P. Assessment of GAFF2 and OPLS‐AA general force fields in combination with the water models TIP3P, SPCE, and OPC3 for the solvation free energy of druglike organic molecules. J Chem Theory Comput. 2019;15:1983–1995. [DOI] [PubMed] [Google Scholar]
- 32. Craft JW, Legge GB. An AMBER/DYANA/MOLMOL phosphorylated amino acid library set and incorporation into NMR structure calculations. J Biomol NMR. 2005;33:15–24. [DOI] [PubMed] [Google Scholar]
- 33. Jorgensen WL, Chandrasekhar J, Madura JD, Impey WR, Klein ML. Comparison of simple potential functions for simulating liquid water. J Chem Phys. 1983;79:926–935. [Google Scholar]
- 34. Maier JA, Martinez C, Kasavajhala K, Wickstrom L, Hauser KE, Simmerling C. ff14SB: Improving the accuracy of protein side chain and backbone parameters from ff99SB. J Chem Theory Comput. 2015;11:3696–3713. [DOI] [PMC free article] [PubMed] [Google Scholar]
- 35. Loncharich RJ, Brooks BR, Pastor RW. Langevin dynamics of peptides: The frictional dependence of isomerization rates of N‐acetylalanyl‐N'‐methylamide. Biopolymers. 1992;32:523–535. [DOI] [PubMed] [Google Scholar]
- 36. Berendsen HJC, Postma JPM, Van Gunsteren WF, DiNola A, Haak JR. Molecular dynamics with coupling to an external bath. J Chem Phys. 1984;81:3684–3690. [Google Scholar]
- 37. Darden T, York D, Pedersen L. Particle mesh Ewald ‐ An Nlog(N) method for Ewald sums in large systems. J Chem Phys. 1993;98:10089–10092. [Google Scholar]
- 38. Ryckaert J‐P, Ciccotti G, Berendsen HJC. Numerical integration of the cartesian equations of motion of a system with constraints: Molecular dynamics of n‐alkanes. J Comput Phys. 1977;23:327–341. [Google Scholar]
- 39. Genheden S, Ryde U. The MM/PBSA and MM/GBSA methods to estimate ligand‐binding affinities. Expert Opin Drug Discov. 2015;10:449–461. [DOI] [PMC free article] [PubMed] [Google Scholar]
- 40. Miller BRI, McGee DTJ, Swails JM, Homeyer N, Gohlke H, Roitberg AE. MMPBSA.py: An efficient program for end‐state energy calculations. J Chem Theory Comput. 2012;8:3314–3321. [DOI] [PubMed] [Google Scholar]
- 41. Shao J, Tanner SW, Thompson N, Cheatham TE. Clustering molecular dynamics trajectories: 1. Characterizing the performance of different clustering algorithms. J Chem Theory Comput. 2007;3:2312–2334. [DOI] [PubMed] [Google Scholar]
Associated Data
This section collects any data citations, data availability statements, or supplementary materials included in this article.
Supplementary Materials
Data S1: Supporting information