Abstract
Purpose
To develop and evaluate a deep learning (DL) system for retinal hemorrhage (RH) screening using ultra-widefield fundus (UWF) images.
Methods
A total of 16,827 UWF images from 11,339 individuals were used to develop the DL system. Three experienced retina specialists were recruited to grade UWF images independently. Three independent data sets from 3 different institutions were used to validate the effectiveness of the DL system. The data set from Zhongshan Ophthalmic Center (ZOC) was selected to compare the classification performance of the DL system and general ophthalmologists. A heatmap was generated to identify the most important area used by the DL model to classify RH and to discern whether the RH involved the anatomical macula.
Results
In the three independent data sets, the DL model for detecting RH achieved areas under the curve of 0.997, 0.998, and 0.999, with sensitivities of 97.6%, 96.7%, and 98.9% and specificities of 98.0%, 98.7%, and 99.4%. In the ZOC data set, the sensitivity of the DL model was better than that of the general ophthalmologists, although the general ophthalmologists had slightly higher specificities. The heatmaps highlighted RH regions in all true-positive images, and the RH within the anatomical macula was determined based on heatmaps.
Conclusions
Our DL system showed reliable performance for detecting RH and could be used to screen for RH-related diseases.
Translational Relevance
As a screening tool, this automated system may aid early diagnosis and management of RH-related retinal and systemic diseases by allowing timely referral.
Keywords: deep learning, fundus image, retinal hemorrhage, screening, ultra-widefield
Introduction
Retinal hemorrhage (RH) can be a sign of many ocular and systemic diseases. For example, diabetes (prevalence of 11% in people over 20 years old) can lead to damage to tiny blood vessels as a result of chronically high blood glucose, and 34.6% of adults with diabetes develop diabetic retinopathy (DR).1–4 DR is a leading cause of visual impairment in working-age adults, and the most common early clinically visible manifestations of DR include microaneurysm formation and RH.4 Retinal vein occlusion (RVO) is the second most common retinal disorder following DR with a prevalence of 0.5% in the general population, and RVO can often result in visual loss. The most important clinical manifestation of RVO is RH.5 Many other retinal and systemic diseases may also be associated with RH, such as age-related macular degeneration (AMD), hypertension, Eales disease, ocular ischemic syndrome, and leukemia.6–10 Notably, in clinical practice, it is not uncommon for RH to be the first manifestation of many systemic diseases.10
Patients with RH are usually asymptomatic except when hemorrhages involve the center of the macula.11 RH screening on a large scale can promote early diagnosis and treatment of most retinal diseases and some widespread systemic diseases, such as those mentioned above, by facilitating timely referral. Image screening with automated tools might increase access to care in regions with few or no ophthalmologists. Although recent deep learning (DL) systems have high accuracy in diagnosing DR, AMD, and glaucoma based on fundus images, these systems cannot make further medical decisions other than recommending patients with suspected diseases to see a doctor.12–14 In addition, as most retinal diseases and some systemic diseases can present with RH, a specific diagnosis cannot be made based solely on fundus images without considering other clinical information and examinations. Therefore, in using a DL system to screen for diseases based on fundus images with the aim to avoid misdiagnosis due to the similar clinical signs, the detection of RH is more reliable and feasible than specifying a diagnosis related to RH.
Traditional fundus imaging can only provide a 30- to 60-degree field of view, which is not ideal when used in the screening program to detect RH due to its limited visible scope. Furthermore, patients with many diseases, such as Eales disease and hematologic disorders, initially develop RH in the peripheral retina.7,15 Therefore, it is advantageous to use ultra-widefield fundus (UWF) imaging, which can provide a 200-degree panoramic image of the retina to reduce the rate of missed diagnosis in RH screening.16 More important, the peripheral retina can be observed through UWF imaging with a single capture without requiring a dark setting, contact lens, or pupillary dilation.16 The utilization of the DL system developed based on UWF images may provide accurate identification of RH with high efficiency, thus facilitating the implementation of the screening program in the general population. In this study, we aimed to develop a DL system based on UWF images to automatically detect RH and to evaluate its performance in three independent data sets from different clinical settings.
Methods
Image Collection
A total of 16,827 macula-centered UWF images (11,339 individuals) were obtained from the Chinese Medical Alliance for Artificial Intelligence (CMAAI). The CMAAI is a union of medical institutions, computer science research groups, and enterprises in the field of artificial intelligence (AI) with the purpose of promoting the research and translational application of AI in medicine. The CMAAI data sets include individuals who presented for retinopathy examinations and needed ophthalmology consultation because of retinopathies caused by various systemic diseases such as hypertension, hematologic diseases, and preeclampsia and those who were undergoing routine ophthalmic health evaluations. The images were captured between June 2016 and April 2019 using an OPTOS nonmydriatic camera (OPTOS Daytona, Dunefermline, UK) and 200-degree fields of view. All participants were examined without mydriasis. All images were deidentified prior to transfer to research investigators. This study was approved by the Institutional Review Board of Zhongshan Ophthalmic Center (ZOC) and adhered to the tenets of the Declaration of Helsinki.
Image Labeling, Quality Control, and Reference Standard
First, all images were assigned to two categories, RH and non-RH. The RH category included images of various types of hemorrhages, such as preretinal, retinal, intraretinal, subretinal, and disc hemorrhages. Microaneurysms were also included in the RH category, as they were difficult to distinguish from dot hemorrhages in the UWF images. The non-RH category included images of normal retinas and various retinopathies such as retinal detachment, central serous chorioretinopathy, and retinitis pigmentosa. Image quality was included in the classification as follows:
-
1.
Excellent quality referred to images without any problems.
-
2.
Adequate quality referred to images in which RH could still be identified despite deficiencies in focus, illumination, or other artifacts.
-
3.
Poor quality referred to images that were insufficient for any interpretation (an obscured area covering greater than or equal to one-third of the image).
Poor-quality images were excluded from the study.
Training a DL system requires a robust reference standard.17,18 To ensure accuracy of the image classification, all anonymous images were labeled separately by three board-certified retina specialists with at least five years of experience. The reference standard was determined based on the agreement achieved by all three retina specialists. Any level of disagreement was adjudicated by another senior retina specialist with over 20 years of experience. The performance of the DL system in detecting the RH was compared with this reference standard.
Image Preprocessing and Augmentation
We performed image standardization before deep feature learning. The images were downsized to 512 by 512, and the pixel values were normalized within the range of 0 to 1. Data augmentation was used to increase the diversity of the data set and thus reduce the chance of overfitting in the deep learning process. Horizontal and vertical flipping, rotation up to 90 degrees, and brightness shift within the range of 0.8 to 1.6 were randomly applied to the images in the training data set to increase its size to five times the original size (from 11,291 to 56,455).
Deep Learning Model Development
In the current study, the DL model was trained using a state-of-the-art convolutional neural network (CNN) architecture, InceptionResNetV2. InceptionResNetV2 mimics the architectural characteristics of two previous state-of-the-art CNNs, the Residual Network and the Inception Network. Weights pretrained for ImageNet classification were used to initialize the CNN architectures.19
Each DL model was trained up to 180 epochs. During the training process, the validation loss was evaluated using the validation set after each epoch and used as a reference for model selection. Early stopping was applied, and if the validation loss did not improve over 60 consecutive epochs, the training process was stopped. The model state where the validation loss was the lowest was saved as the final state of the model.
The entire data set from CMAAI was randomly divided into three independent sets: 70% in a training set, 15% in a validation set, and the remaining 15% in a test set, with no individuals overlapping among these sets. The training and validation sets were used to train and validate the DL model, respectively. The test set was used to evaluate the performance of the selected model. Two other data sets were applied to further verify the performance of the DL model. One was from the outpatient clinic at ZOC in Guangzhou (southeast China), and the other was from the outpatient clinic and health examination center at Xudong Ophthalmic Hospital (XOH) in Inner Mongolia (northwest China). The reference standard of the images used in these two data sets is same as that of the CMAAI data set.
Features of Misclassification by the Deep Learning Model
UWF images misclassified by the DL model (false positive and false negative) were reviewed and analyzed by a senior retina specialist in terms of their most commonly observed features.
Visualization Heatmap
In the ZOC data set, heatmaps highlighting the regions in which RH was detected using the DL model were generated using the Saliency Map visualization technique for all true-positive images. The Saliency Map technique calculates the gradient of the output of the CNN with respect to each pixel in the image, to identify the pixels with the greatest impact on the final prediction. The intensity value of the heatmap is a direct indication of the pixels’ influence on the model's prediction. The effectiveness of the heatmaps was determined based on whether the highlighted regions were colocalized with the RH, which was confirmed by the senior retina specialist.
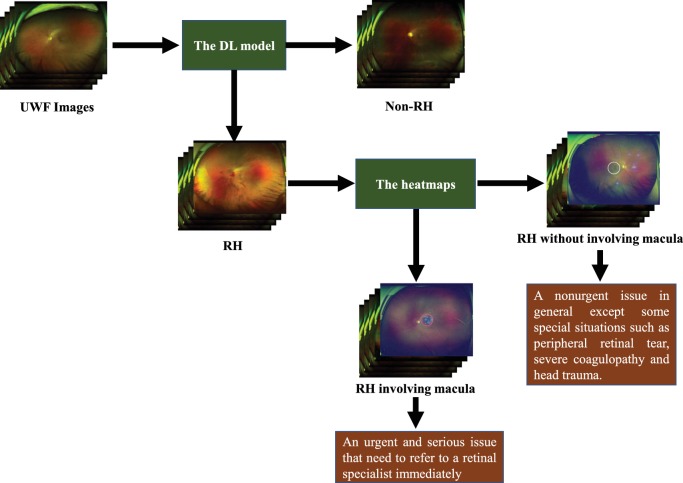
As the mean optic disc-fovea distance (DFD) is 4.74 to 4.90 mm and the diameter of macula is 5.5 mm,20,21 the area of the anatomical macula in the macula-centered UWF image is approximately equal to the region within three-fifths of the DFD semidiameter of the image center, which is marked with a white circle of corresponding size (Fig. 1). Based on the heatmap, RH images that included highlighted regions (heatmap intensity over a threshold of 36) in this central region were considered to have macular hemorrhage, causing the white circle to change to a red circle. The threshold of heatmap intensity representing the highlighted region in the circle corresponded to a sensitivity of 97% for detecting macular hemorrhage in the ZOC data set because a high sensitivity is a precondition for a potential screening approach 12. The XOH data set was used to verify the effectiveness of this heatmap intensity threshold. Figure 2 shows the workflow of this DL system.
Figure 1.
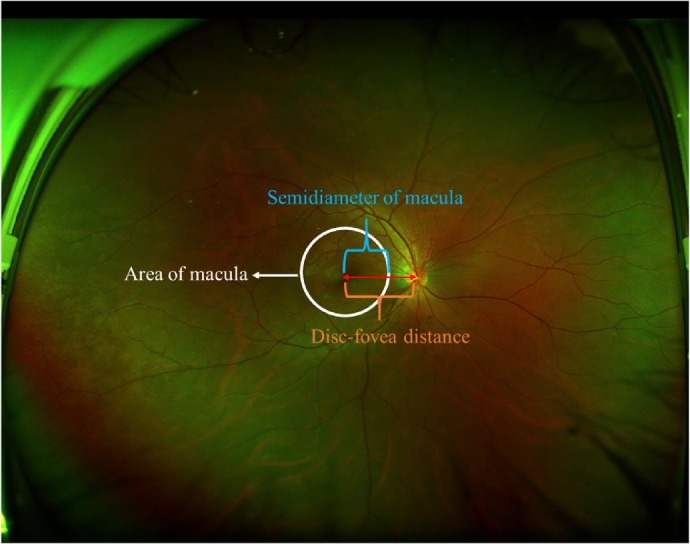
The area of the macula in the macula-centered ultra-widefield fundus image. Disc-fovea distance is the length between the optic disc center and the fovea.
Figure 2.
Workflow of the deep learning system and its corresponding clinical application. The red circle indicates the RH involving the macula, and the white circle indicates the RH outside the macula.
General Ophthalmologist Comparisons
To evaluate our DL system in the context of RH screening, we recruited two general ophthalmologists who had three and five years of experience, respectively, in UWF image analysis at a physical examination center and then compared the performance of the DL system and the general ophthalmologists with the reference standard using the ZOC data set.
Statistical Analyses
A receiver operating characteristic (ROC) curve and an area under the curve (AUC) with 95% confidence intervals (CIs) were used to evaluate the performance of the DL system. The sensitivity, specificity, and accuracy of the system and general ophthalmologists for detecting RH were computed according to the reference standard. Unweighted Cohen's κ coefficients were employed to compare the results of the system with the reference standard as established by the aforementioned retina specialists. All statistical analyses were performed using Python 3.7.3 (Wilmington, Delaware, USA).
Results
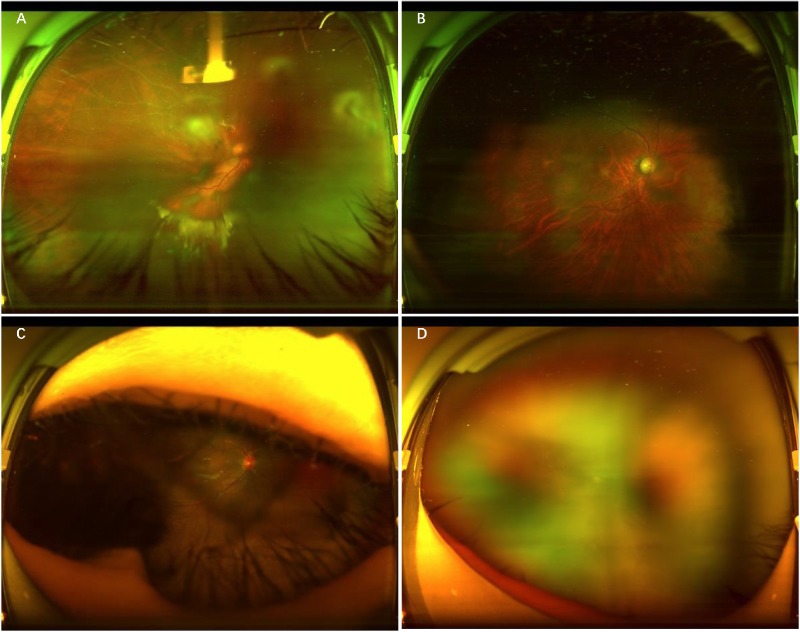
Demographics and image characteristics of the three independent data sets are summarized in Table 1, and detailed diagnostic information from the patients is shown in Table 2. In total, 689 poor-quality images from CMAAI were excluded due to the opacity of the refractive media or artifacts (e.g., arc defects, eyelid, eyelash, and defocused images) (Fig. 3). The training, validation, and test sets included 11,291, 2424 and 2423 images, respectively. After removing the poor-quality images, the ZOC and XOH data sets consisted of 872 and 1220 images, respectively.
Table 1.
Demographics and Image Characteristics of the Data Sets
| Characteristic | CMAAI Data set | Zhongshan Ophthalmic Center Data Set | Xudong Ophthalmic Hospital Data Set | ||
|---|---|---|---|---|---|
| Total No. of images | 16,827 | 905 | 1236 | ||
| Total No. of gradable images | 16,138 | 872 | 1220 | ||
| No. of individuals | 11,339 | 339 | 445 | ||
| Age, mean (range), y | 48.7 (5–86) | 46.3 (3–75) | 50.8 (3–89) | ||
| No. (%) of women | 5273 (46.5) | 150 (44.8) | 242 (54.4) | ||
| Location of institution | South of China | Southeast of China | Northwest of China | ||
| Camera model | OPTOS Daytona | OPTOS 200TX | OPTOS Daytona | ||
| Training set | Validation set | Test set | |||
| Retinal hemorrhagea | 2398/11,291 (21.2) | 512/2424 (21.1) | 523/2423 (21.6) | 121/872 (13.9) | 210/1220 (17.2) |
| Nonretinal hemorrhagea | 8893/11291 (78.8) | 1912/2424 (78.9) | 1900/2423 (78.4) | 751/872 (86.1) | 1010/1220 (82.8) |
Data are presented as number of images/total number (%) unless otherwise indicated.
Table 2.
Diagnostic Information of the Data Sets
| Diagnosis | CMAAI Data Set | Zhongshan Ophthalmic Center Data Set | Xudong Ophthalmic Hospital Data Set |
|---|---|---|---|
| RH group | |||
| Diabetic retinopathy | 855 (35.4) | 34 (36.6) | 48 (41.3) |
| Retinal vein occlusion | 220 (9.1) | 7 (7.5) | 6 (5.2) |
| Wet age-related macular degeneration | 423 (17.5) | 11 (11.8) | 8 (6.9) |
| Eales disease | 62 (2.6) | 5 (5.4) | 3 (2.6) |
| Retinitis with RH | 57 (2.4) | 4 (4.3) | 3 (2.6) |
| Retinal breaks with RH | 21 (0.9) | 2 (2.2) | – |
| Optic neuritis | 46 (1.9) | 2 (2.2) | 3 (2.6) |
| Leukemia | 12 (0.5) | 1 (1.1) | – |
| Hypertension | 55 (2.3) | 3 (3.2) | 4 (3.4) |
| Heart failure | 5 (0.2) | – | – |
| Tuberculosis | 20 (0.9) | 3 (3.2) | – |
| Preeclampsia | 23 (1.0) | 1 (1.1) | – |
| Unknown cause | 257 (10.6) | 4 (4.3) | 19 (16.4) |
| Information missing | 362 (15.0) | 16 (17.2) | 22 (20.0) |
| Total patients in RH group | 2418 (100.0) | 93 (100.0) | 116 (100.0) |
| Non-RH group | |||
| Normal | 2787 (31.2) | 88 (35.8) | 112 (34.0) |
| Retinal detachment | 773 (8.7) | 16 (6.5) | 8 (2.4) |
| Lattice degeneration | 352 (3.9) | 8 (3.3) | 14 (4.3) |
| Glaucoma | 560 (6.3) | 16 (6.5) | 15 (4.6) |
| Retinitis pigmentosa | 49 (0.5) | 3 (1.2) | 5 (1.5) |
| Dry age-related macular degeneration | 323 (3.6) | 8 (3.3) | 16 (4.9) |
| Retinitis without RH | 39 (0.4) | 2 (0.8) | 6 (1.8) |
| Macular hole | 40 (0.4) | 3 (1.2) | 3 (0.9) |
| Macular epiretinal membrane | 33 (0.4) | 5 (2.0) | 2 (0.6) |
| Central serous chorioretinopathy | 29 (0.3) | 3 (1.2) | 5 (1.5) |
| Retinal breaks without RH | 211 (2.4) | 3 (1.2) | 3 (0.9) |
| Othersa | 1327 (14.9) | 38 (15.4) | 51 (15.5) |
| Information missing | 2398 (26.9) | 53 (21.5) | 89 (27.1) |
| Total patients in non-RH group | 8921 (100.0) | 246 (100.0) | 329 (100.0) |
Data are presented as no. of patients (%) unless otherwise indicated.
“Others” indicates other fundus conditions of non-RH group, such as retinal pigmentation, optic atrophy, and congenital myelinated nerve fibers.
Figure 3.
Typical examples of poor-quality images. A, Image with opacity of the refractive media. B, Image with arc defects. C, Image with eyelid and eyelashes. D, Defocused image.
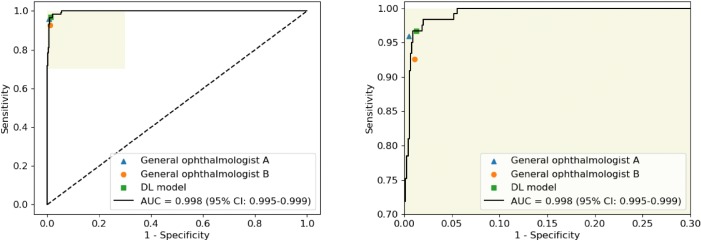
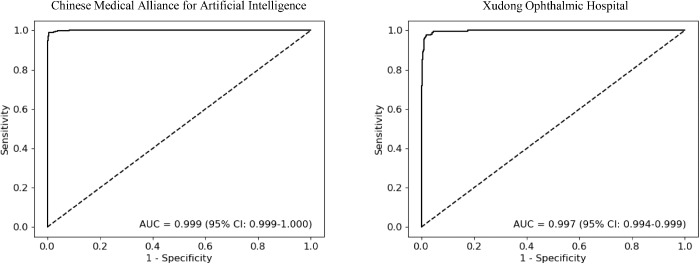
The performance of the DL model for identification of RH in the CMAAI, ZOC, and XOH data sets is shown in Table 3. In the ZOC data set, the general ophthalmologist with five years of experience had a 95.9% sensitivity and a 99.5% specificity, the general ophthalmologist with three years of experience had a 92.6% sensitivity and a 98.9% specificity, and the DL model had a 96.7% sensitivity and a 98.7% specificity with an AUC of 0.998 (95% CI, 0.995–0.999) (Fig. 4). Compared with the reference standard of the CMAAI, ZOC, and XOH data sets, the unweighted Cohen's κ coefficients of the DL model were 0.979 (95% CI, 0.970–0.989), 0.934 (95% CI, 0.900–0.968), and 0.930 (95% CI, 0.903–0.957), respectively. ROC curves of the DL model derived from the CMAAI test set and the XOH data set are shown in Figure 5.
Table 3.
Performance of the Deep Learning Model in Detecting Retinal Hemorrhage
| Characteristic | CMAAI Data Set | Zhongshan Ophthalmic Center Data Set | Xudong Ophthalmic Hospital Data Set |
|---|---|---|---|
| AUC (95% CI) | 0.999 (0.999–1.000) | 0.998 (0.995–0.999) | 0.997 (0.994–0.999) |
| Sensitivity (95% CI), % | 98.9 (98.0–99.8) | 96.7 (93.5–99.9) | 97.6 (95.5–99.7) |
| Specificity (95% CI), % | 99.4 (99.1–99.7) | 98.7 (97.9–99.5) | 98.0 (97.1–98.9) |
| Accuracy (95% CI), % | 99.3 (99.0–99.6) | 98.4 (97.6–99.2) | 98.0 (97.2–98.8) |
Figure 4.
Comparison of the deep learning model and general ophthalmologists with the reference standard for detection of retinal hemorrhage in the data set of the Zhongshan Ophthalmic Center. General ophthalmologist A, 5 years of working experience at a physical examination center; general ophthalmologist B, 3 years of working experience at a physical examination center. The figure on the right side is the enlarged portion of the yellow shadow of the figure on the left side.
Figure 5.
ROC curves of the deep learning model for detection of retinal hemorrhage in the test set from Chinese Medical Alliance for Artificial Intelligence and the data set from Xudong Ophthalmic Hospital.
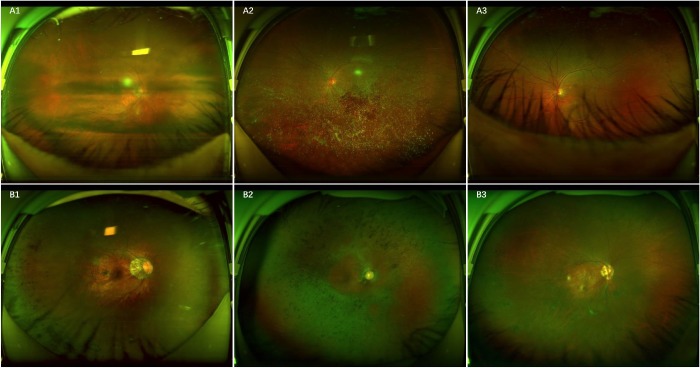
In the CMAAI test set and the ZOC and XOH data sets, a total of 15 RH images were classified erroneously into the non-RH category by the DL model, 13 of which showed the RH under the obscured optical media and 2 of which showed the RH partly covered by eyelashes (Fig. 6A). In contrast, a total of 41 non-RH images were mistakenly assigned to the RH category, including 31 images of retinal pigmentation of varying degrees, 7 images of retinal pigmentosa, and 3 images of round retinal holes (Fig. 6B).
Figure 6.
Ultra-widefield fundus images showing typical false-negative and false-positive cases in RH detection. A, False-negative images: A1, scattered RH under the obscured optical media; A2, RH in the center, partly covered by the opaque vitreous body; A3, RH at the bottom, partly covered by eyelashes. B, False-positive images: B1, retinal pigmentation on the left side; B2, retinal pigmentosa; B3, round retinal holes on the left side.
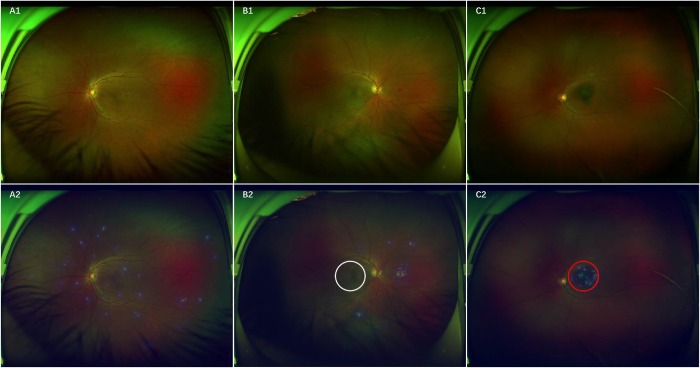
To visualize how the DL system makes RH predictions, heatmaps were generated to indicate the regions of RH. Figure 7 presents typical examples of activation maps for RH, accompanied by the corresponding original image. Heatmaps effectively highlighted regions of RH regardless of the size, location, and shape of RH, even for a single-dot hemorrhage/microaneurysm (Fig. 7A). To determine whether hemorrhages involved the area of the macula based on the heatmaps of the RH images, the DL system identified 96.3% (158/164) of the images of macular hemorrhage compared with the reference standard of the XOH data set. Figure 7B shows RH outside the region of the macula, and Figure 7C displays RH involving the region of the macula.
Figure 7.
Ultra-widefield fundus images and corresponding heatmaps showing typical true-positive cases. A, RH shown in A1 corresponds to the highlighted regions displayed in heatmap A2. B, RH without involving the macula manifested in B1 is present in the highlighted regions outside the white circle visualized in heatmap B2. C, RH within the area of the macula presented in C1 is present in the highlighted regions in the red circle shown in heatmap C2.
Discussion
In this study, we developed a DL system using 16,827 UWF images for automated identification of RH, and we evaluated its performance using data sets from three different institutions. The results showed that our DL system performed very well in RH detection (Table 3). In addition, the system exhibited wide applicability, as the AUCs were ideal for all the tested data sets. Moreover, the unweighted Cohen's κ coefficients illustrate that the agreement between the DL model and the reference standard was almost perfect, which further substantiated the effectiveness of our DL system. When compared with the performance of general ophthalmologists in identifying RH, the DL model had higher sensitivity, although the specificity was slightly lower. Because high sensitivity is a prerequisite for a potential screening tool and can reduce the workload and medical costs by avoiding the need for further examination of normal eyes,12,22,23 this system qualifies for application in health examination centers or primary eye care settings to screen for individuals with RH. Before the era of deep learning, several reports of automated methods for RH detection had been published. Tang et al.11 developed a technique using a splat feature classification method based on 300 fundus images to detect RH and validated it in 900 images achieving an AUC of 87% at the image level. Niemeijer et al.24 used 40 fundus images to train a RH detection method based on pixel classification and tested it in 100 images, obtaining a sensitivity of 100% and a specificity of 87%. Based on feature extraction, the above studies would inevitably introduce errors in the localization and segmentation that would lead to misalignment and misclassification.25 In addition, the pixel-based technique needs experienced ophthalmologists to carefully annotate all RH in the images to provide a reference standard, which is not feasible for applying to a large data set as this process would be extremely labor-intensive and time-consuming. In contrast, the deep learning algorithm used in this study avoids such problems by learning predictive features directly from the global labeled images.
The current study has four unique differences compared with previous studies. First, most previous studies used DL to screen for specific retinal diseases, such as DR, AMD, and glaucoma, based on fundus images.12–14 However, there are some overlaps in lesion characteristics of fundus images among many retinopathies. For example, RH may appear in DR, AMD, retinal vein occlusions, and retinal vasculitis. Normally, neither retina specialists using only a fundus image without other clinical information and examinations nor the DL system developed based on the reference standard established by the retina specialists can make an accurate diagnosis. Detailed inquiry and careful comprehensive examinations by the retina specialist are crucial for making a medical decision. As a screening tool, our system only includes one DL model and is mainly used to detect multiple RH-related diseases, which is more practical and economical in real-world settings. Second, although DL systems developed based on traditional fundus images showed reliable performance for the detection of retinopathies, missed diagnoses were inevitable due to the limited visible scope of these fundus images.16,26 Our study developed a robust DL model for detecting RH based on UWF images, the visible scope of which was five times larger than that of traditional fundus images. Thus, our system minimizes missed diagnoses of RH. Third, most previous studies have built DL systems based on fundus images to predict retinal diseases.12–14 However, our DL system could help to detect not only retinal disease but also systemic diseases, as RH can also be an initial sign of systemic diseases such as congestive heart failure, hypertension, diabetes, and leukemia.1,9,10,27 Fourth, to the best of our knowledge, this study was the first to use DL to detect RH based on a large number of UWF images and validated its performance with three independent data sets.
Although various DL systems have reliable performance in automated prediction of diseases, the interpretation of the output generated by these systems is unclear.12,14 In this study, the salient regions that the DL model used to detect RH were located through heatmaps to illuminate the rationale of this screening method. Encouragingly, based on the DL algorithm, the heatmaps highlighted the region of RH in all true-positive images, which could help clinicians understand how the final RH prediction was made. This interpretability may increase the public’s understanding and acceptance of the proposed DL system and promote its application in real-world settings.
In this study, the circle indicating the macular region was automatically generated in the UWF image, and our DL model successfully identified the RH within the macula area based on the heatmap. Notably, deterioration of visual acuity often occurs in a short time when RH is located near the center of the macula.11,28 Our DL model is able to advise patients regarding how urgent their disease state is and encourage patients with macular hemorrhage to visit a retina specialist immediately. These features will increase the probability of an improved visual prognosis, as early treatment of hemorrhage at the macula can reduce damage to the macula.28,29
The DL model misclassified a few images when compared with the reference standard. When investigating the reasons for false-negative cases, all false-negative images were a result of unclear RH features caused by the obscured optical media or eyelashes. When assessing the reasons for false-positive classifications, approximately nine-tenths of false-positive cases were due to the presence of retinal pigmented spots with a color similar to that of old RH. The remaining false-positive cases were round retinal holes, the color of which resembled that of fresh RH. An ideal screening tool should minimize the number of false-negative results, and more studies are needed to explore strategies to reduce this kind of error. For false-positive cases, a quarter of the results showed round retinal holes and retinal pigmentosa that also required further investigation by ophthalmologists. Therefore, the increased workload caused by false-positive results seems to be reasonable given that such cases would benefit from further clinical examination.
There are several limitations of this study. First, poor-quality images were removed from the study because it was unclear whether the defects were caused by human or camera factors or by the opacity of the refractive media. Referring people whose images are ungradable merely due to artifacts or bad illumination (underexposure or overexposure) will bring unnecessary burden to both individuals and health care systems. Consequently, further study is needed to develop approaches that can decrease the number of deficient images attributed to human or camera factors or that can distinguish poor-quality images resulting from optical media. Second, although UWF imaging can capture the largest retinal view among existing technologies, the entire retina still cannot be observed with this method. Thus, our DL system may miss a few RH diagnoses that are not captured by the UWF imaging. A missed diagnosis would also occur if RH appears in an obscured area of the image. Third, the circle that represents the macular region is determined based on the macula-centered UWF images, which is not available for images in which the macula is not at the image center.
Overall, based on the UWF images, our high-accuracy DL system not only detects the RH but also discerns whether the RH involves the macula. As a screening tool, the DL system may help identify RH-related retinal and systemic diseases. Prospective clinical studies to evaluate the cost-effectiveness and the performance of our DL system in real-world settings are ongoing.
Acknowledgments
Supported by the National Key R&D Program of China (grant no. 2018YFC0116500), the National Natural Science Foundation of China (grant no. 81770967), the National Natural Science Fund for Distinguished Young Scholars (grant no. 81822010), the Science and Technology Planning Projects of Guangdong Province (grant no. 2018B010109008), and the Key Research Plan for the National Natural Science Foundation of China in Cultivation Project (grant no. 91846109). The sponsor or funding organization had no role in the design or conduct of this research.
The code used in this study can be accessed at GitHub (https://github.com/gocai/uwf_hemorrhage).
ZL, CG, and DN contributed equally as first authors.
Disclosure: Zhongwen Li, None; Chong Guo, None; Danyao Nie, None; Duoru Lin, None; Yi Zhu, None; Chuan Chen, None; Yifan Xiang, None; Fabao Xu, None; Chenjin Jin, None; Xiayin Zhang, None; Yahan Yang, None; Kai Zhang, None; Lanqin Zhao, None; Ping Zhang, None; Yu Han, None; Dongyuan Yun, None; Xiaohang Wu, None; Pisong Yan, None; Haotian Lin, None
References
- 1. Frank RN. Diabetic retinopathy. N Engl J Med. 2004;350:48–58. [DOI] [PubMed] [Google Scholar]
- 2. Cheung N, Mitchell P, Wong TY. Diabetic retinopathy. Lancet. 2010;376:124–136. [DOI] [PubMed] [Google Scholar]
- 3. Lamoureux EL, Taylor H, Wong TY. Frequency of evidence-based screening for diabetic retinopathy. N Engl J Med. 2017;377:194–195. [DOI] [PubMed] [Google Scholar]
- 4. American Academy of Ophthalmology Retina/Vitreous Panel. Diabetic retinopathy. 2017. Available at: www.aao.org/ppp. Accessed May 14, 2019.
- 5. American Academy of Ophthalmology Retina/Vitreous Panel. Retinal vein occlusions. 2015. Available at: www.aao.org/ppp. Accessed May 14, 2019.
- 6. Mizener JB, Podhajsky P, Hayreh SS. Ocular ischemic syndrome. Ophthalmology. 1997;104:859–864. [DOI] [PubMed] [Google Scholar]
- 7. Das T, Pathengay A, Hussain N, Biswas J. Eales' disease: diagnosis and management. Eye (Lond). 2010;24:472–482. [DOI] [PubMed] [Google Scholar]
- 8. Mitchell P, Liew G, Gopinath B, Wong TY. Age-related macular degeneration. Lancet. 2018;392:1147–1159. [DOI] [PubMed] [Google Scholar]
- 9. Wong TY, Mitchell P. Hypertensive retinopathy. N Engl J Med. 2004;351:2310–2317. [DOI] [PubMed] [Google Scholar]
- 10. Rehak M, Feltgen N, Meier P, Wiedemann P. [retinal manifestation in hematological diseases]. Ophthalmologe. 2018;115:799–812. [DOI] [PubMed] [Google Scholar]
- 11. Tang L, Niemeijer M, Reinhardt JM, Garvin MK, Abramoff MD. Splat feature classification with application to retinal hemorrhage detection in fundus images. IEEE Trans Med Imaging. 2013;32:364–375. [DOI] [PubMed] [Google Scholar]
- 12. Gulshan V, Peng L, Coram M et al.. Development and validation of a deep learning algorithm for detection of diabetic retinopathy in retinal fundus photographs. JAMA. 2016;316:2402–2410. [DOI] [PubMed] [Google Scholar]
- 13. Ting D, Cheung CY, Lim G et al.. Development and validation of a deep learning system for diabetic retinopathy and related eye diseases using retinal images from multiethnic populations with diabetes. JAMA. 2017;318:2211–2223. [DOI] [PMC free article] [PubMed] [Google Scholar]
- 14. Li Z, He Y, Keel S et al.. Efficacy of a deep learning system for detecting glaucomatous optic neuropathy based on color fundus photographs. Ophthalmology. 2018;125:1199–1206. [DOI] [PubMed] [Google Scholar]
- 15. Tolls DB. Peripheral retinal hemorrhages: a literature review and report on thirty-three patients. J Am Optom Assoc. 1998;69:563–574. [PubMed] [Google Scholar]
- 16. Nagiel A, Lalane RA, Sadda SR, Schwartz SD. Ultra-widefield fundus imaging: a review of clinical applications and future trends. Retina. 2016;36:660–678. [DOI] [PubMed] [Google Scholar]
- 17. LeCun Y, Bengio Y, Hinton G. Deep learning. Nature. 2015;521:436–444. [DOI] [PubMed] [Google Scholar]
- 18. Krause J, Gulshan V, Rahimy E et al.. Grader variability and the importance of reference standards for evaluating machine learning models for diabetic retinopathy. Ophthalmology. 2018;125:1264–1272. [DOI] [PubMed] [Google Scholar]
- 19. Russakovsky O, Deng J, Su H et al.. Imagenet large scale visual recognition challenge. Int J Comput Vision. 2015;115:211–252. [Google Scholar]
- 20. Jonas RA, Wang YX, Yang H et al.. Optic disc-fovea distance, axial length and parapapillary zones: The Beijing Eye Study 2011. PLoS One. 2015;10:e138701. [DOI] [PMC free article] [PubMed] [Google Scholar]
- 21. Qiu K, Chen B, Yang J et al.. Effect of optic disc-fovea distance on the normative classifications of macular inner retinal layers as assessed with oct in healthy subjects. Br J Ophthalmol. 2019;103:821–825. [DOI] [PMC free article] [PubMed] [Google Scholar]
- 22. Marmor MF, Kellner U, Lai TY, Lyons JS, Mieler WF. Revised recommendations on screening for chloroquine and hydroxychloroquine retinopathy. Ophthalmology. 2011;118:415–422. [DOI] [PubMed] [Google Scholar]
- 23. Tufail A, Rudisill C, Egan C et al.. Automated diabetic retinopathy image assessment software: diagnostic accuracy and cost-effectiveness compared with human graders. Ophthalmology. 2017;124:343–351. [DOI] [PubMed] [Google Scholar]
- 24. Niemeijer M, van Ginneken B, Staal J, Suttorp-Schulten MS, Abramoff MD. Automatic detection of red lesions in digital color fundus photographs. IEEE Trans Med Imaging. 2005;24:584–592. [DOI] [PubMed] [Google Scholar]
- 25. Yang M, Zhang L, Shiu SC, Zhang D. Robust kernel representation with statistical local features for face recognition. IEEE Trans Neural Netw Learn Syst. 2013;24:900–912. [DOI] [PubMed] [Google Scholar]
- 26. Son J, Shin JY, Kim HD et al.. Development and validation of deep learning models for screening multiple abnormal findings in retinal fundus images [published online May 31, 2019]. Ophthalmology. [DOI] [PubMed] [Google Scholar]
- 27. Wong TY, Rosamond W, Chang PP et al.. Retinopathy and risk of congestive heart failure. JAMA. 2005;293:63–69. [DOI] [PubMed] [Google Scholar]
- 28. Mennel S. Subhyaloidal and macular haemorrhage: localisation and treatment strategies. Br J Ophthalmol. 2007;91:850–852. [DOI] [PMC free article] [PubMed] [Google Scholar]
- 29. de Silva SR, Bindra MS. Early treatment of acute submacular haemorrhage secondary to wet AMD using intravitreal tissue plasminogen activator, c3f8, and an anti-VEGF agent. Eye (Lond). 2016;30:952–957. [DOI] [PMC free article] [PubMed] [Google Scholar]


