

Abstract
Overexpression and enhanced activity of insulin-like growth factor-I receptor (IGF-IR) in diverse tumor types make it an attractive target for cancer therapy. BMS-536924 is a potent small molecule inhibitor of IGF-IR, which shows antitumor activity in multiple tumor models, including sarcoma. To facilitate the development of IGF-IR inhibitors as cancer therapy, identification of biomarkers for selecting patients most likely to derive clinical benefit is needed. To do so, 28 sarcoma and neuroblastoma cell lines were screened for in vitro response to BMS-536924 to identify sensitive and resistant cell lines. Notably, Ewing’s sarcoma, rhabdomyosarcoma, and neuroblastoma are more responsive to BMS-536924, suggesting these specific subtypes may represent potential targeted patient subpopulations for the IGF-IR inhibitor. Gene expression and protein profiling were performed on these cell lines, and candidate biomarkers correlating with intrinsic and/or acquired resistance to BMS-536924 were identified. IGF-I, IGF-II, and IGF-IR were highly expressed in sensitive cell lines, whereas IGFBP-3 and IGFBP-6 were highly expressed in resistant lines. Overexpression of epidermal growth factor receptor (EGFR) and its ligands in resistant cell lines may represent one possible resistance mechanism by the adaptation of IGF-IR–independent growth using alternative signaling pathways. Based on cross-talk between IGF-IR and EGFR pathways, combination studies to target both pathways were performed, and enhanced inhibitory activities were observed. These results provide a strategy for testing combinations of IGF-IR inhibitors with other targeted therapies in clinical studies to achieve improved patient outcomes. Further exploration of mechanisms for intrinsic and acquired drug resistance by these preclinical studies may lead to more rationally designed drugs that target multiple pathways for enhanced antitumor efficacy.
Introduction
The insulin-like growth factor (IGF) axis plays an essential role in regulating cellular growth, differentiation, apoptosis, tumor angiogenesis, and metastasis and in conferring radioresistance and multiple drug resistance (1). It is a complex multifactorial system consisting of ligands, receptors, and IGF-binding proteins (IGFBPs). Under normal physiologic conditions, the balance between the expression and activities of these molecules is tightly controlled; changes in this delicate balance may trigger a cascade of molecular events that can ultimately lead to malignancy (2). Binding of its ligands to IGF-I receptor (IGF-IR) initiates a cascade of events leading to activation of mitogenic signaling pathways [Ras/Raf/mitogen-activated protein kinase (MAPK)] and antiapoptotic/survival pathways (PI3K-Akt/mTor), resulting in proliferation, transformation and survival in tumor cells (3, 4). IGF-IR overexpression and/or enhanced activity has been observed in diverse tumor types, suggesting the potential therapeutic use of agents targeting this pathway may be broad. Various drug discovery approaches, including monoclonal antibody, small molecule inhibitor, antisense, IGF-I peptide mimetic, and dominant-negative mutants that lack enzyme activity have been explored in recent years to modulate the function of IGF-IR and reverse the malignant phenotype in tumor cells (5, 6).
Sarcomas and neuroblastomas are areas of highly unmet medical needs. Due to aggressive local behavior and high metastatic propensity, survival rates of these rare cancers are disappointingly low with multimodal treatments and very aggressive chemotherapeutic regimens. IGF-IR and its ligands undergo autocrine/paracrine regulatory responses, which are important growth regulators in sarcomas (7–10). Inhibition of IGF-IR by antibodies or small molecules, either alone or in combination with other chemotherapeutic agents, has shown antitumor activity in sarcomas (11–13). IGF-IR and insulin receptor are structurally and functionally related and can form heterotetrameric receptors. Insulin receptor activates signaling pathways similar to IGF-IR and has been implicated in human cancers (14, 15). In addition to IGF-IR, preclinical data support an important role for insulin receptor in regulating IGF action, either as a hybrid or holoreceptor(16). Increased insulin sensitivity in breast cancer was observed when targeting IGF-IR (17). Agents targeting all of the receptors responsible for IGF signaling may be necessary to disrupt the malignant phenotype regulated by this growth factor receptor family. BMS-536924, a small molecule inhibitor potent against both IGF-IR and insulin receptor (18), may not only be an advantage but a prerequisite in treating cancers. BMS-536924 showed antitumor activity both in vitro and in vivo in multiple tumor types and is most potent in sarcomas (18).
The development of targeted therapies, such as Herceptin and epidermal growth factor receptor (EGFR) kinase inhibitors, have shown that careful measurement of biomarkers is necessary to identify a subset of patients having receptor-driven tumors (19, 20). Targeting IGF-IR may only be successful if the receptor is absolutely necessary for pathogenesis and tumor progression. Therefore, one of the integral goals in the development of BMS-536924 is to identify biomarkers that can be used to select the patient population most likely to benefit from the therapy. More recently, gene expression profiling studies have shown the advantages of molecular signatures in predicting chemotherapeutic responses and guiding targeted therapies (21–24). By using molecular signatures to personalize effective drugs for the right patients, cancer treatments in the future could be vastly improved.
The purposes of the present study are to identify molecular signature associated with the sensitivity to BMS-536924 using gene expression profiling and LC/MS-based label-free protein profiling, to elucidate the possible resistance mechanisms to the inhibitor, and further to explore combination strategies to increase drug efficacy by cotargeting IGF-IR and other signal pathways that may contribute to the IGF-IR inhibitor resistance. This could shed light on the strategy for clinical development of IGF-IR inhibitors.
Materials and Methods
Cell lines.
All cell lines were provided by Dr. Lee Helman and grown in RPMI medium + GlutaMax supplemented with 10% fetal bovine serum (FBS), 10 mmol/L HEPES, penicillin, and streptomycin. For the baseline profiling study, cells were harvested at 70% to 80% confluence. To develop acquired resistant cells to BMS-536924, sensitive RD-1S cells (IC50, 0.238 μmol/L) were first exposed to the drug at the IC50 concentration and then at gradually increasing concentrations every other culture passage. The IC50 value to the compound was measured periodically during this treatment time until the resistance level reached a plateau. The resulting resistant RD-1R cells have an IC50 of 2.0 μmol/L to BMS-536924.
In vitro cellular proliferation assays.
Cell proliferation was evaluated by [3H]thymidine incorporation after exposure to BMS-536924 for 72 h. Cells were plated at an optimized density in 96-well plates, incubated overnight at 37°C, and then exposed to a serial dilution of the drug. After a 72-h incubation, cells were pulsed with 4 μCi/mL [3H]thymidine (Amersham Pharmacia Biotech) for 3 h, trypsinized, harvested onto UniFilter-96 GF/B plates (PerkinElmer); scintillation was measured on a TopCount NXT. Results were expressed as an IC50, which is the drug concentration required to inhibit cell proliferation by 50% compared with untreated control cells. The mean IC50 and SD from multiple tests for each cell line were calculated.
In vitro drug combination study.
A dilution of ratios of drug combination method (25) was used in cellular proliferation assays to determine whether there was synergy, additivity, or antagonism when two compounds were added simultaneously to cells in vitro. Drug stock solutions for two compounds were combined in ratios of 10:1, 5:1, 3:1, 1:1, 1:3, and 1:5. These ratios, as well as the individual compound stock solutions, were diluted in a serial manner using 70% DMSO. These serial dilutions were then mixed with RPMI growth medium and added to cells to test the IC50 values of single agent as well as two compounds in the cellular proliferation assays. Combination indices, SEs, and 95% confidence intervals were calculated for the different ratios and used to determine if the combination results represented synergistic, additive, or antagonistic effects. Combination index values below 1 would be considered to be synergistic when the 95% confidence interval (index value, ±2× SE) did not exceed the value of 1.
Gene expression profiling.
RNA was isolated from the cultured cells using the RNeasy kits from Qiagen for generating gene expression data using Affymetrix HG-U133A 2.0 GeneChip (Affymetrix), as described previously (24).
Protein profiling.
Label-free protein profiling (26, 27) was performed using 26 cell lines. Briefly, the cells were lysed, protein was extracted, and total protein content was normalized across all the cell lines. Tryptic digestion of protein extraction was performed, and the resulting peptide mixtures were analyzed by a high-resolution liquid chromatography-mass spectrometry. Mass spectral data were processed with a suite of proprietary in-house software; the data went through charge state reduction, isotope deconvolution, retention time adjustment to yield a list of unique peptide ions with information of accurate mass, retention time, and associated intensity (corresponds to peptide abundance). The signal intensity for each unique peptide ion in the mass spectrometer was used as an indicator for the expression level of its corresponding protein in the cell lines. Approximately, 10,000 unique peptides were detected in this study for each sample. All these unique peptide ions were then subjected to relevant statistical tests (detailed below). The resulting unique peptide ions of interest were then subjected to tandem mass spectrometry (MS/MS) for sequence identifications. The generated MS/MS spectra were submitted for database searching by SEQUEST (28) for peptide sequence information and subsequent yield protein identifications.
Statistical analyses of baseline gene and protein expression of cell lines.
The gene expression raw data were normalized by the Robust Multichip Average (RMA) method (29), whereas the label-free protein profiling data were quantile normalized. Two separate statistical analyses were performed on normalized and log2-transformed gene and protein expression data sets to identify genes and proteins whose expression level significantly correlate with the sensitivity of cells to BMS-536924. First, a two-sample t test with unequal variance between resistant and sensitive cell lines (based on an IC50 cutoff of 0.35 μmol/L) was performed. Second, Pearson correlation between the normalized expression level of each gene/protein and the log2 (IC50) values of the cell line panel was calculated to identify genes and proteins correlated with drug sensitivity (IC50). A logistic regression modeling approach was used on selected genes to predict sensitivity to BMS-536924.
Western blot analyses.
Cells were treated as indicated in the figure legends and rinsed twice with ice-cold PBS on ice before harvest. The protein was extracted in TTG lysis buffer [1% Triton X-100, 5% glycerol, 0.15 mol/L NaCl, 20 mmol/L Tris-HCl (pH 7.6)] with phosphatase inhibitor cocktail 2 (Sigma). Protein concentrations of total cell lysates were determined using a bicinchoninic acid assay kit (Pierce). Lysates were resolved by SDS-PAGE (Invitrogen), transferred to nitrocellulose membranes (Bio-Rad Laboratories), and immunoblotted with specified antibodies as indicated in the figure legends in Odyssey Blocking Buffer with 0.1% Tween 20 (Li-Cor Biosciences). Membranes were then incubated with appropriate infrared–labeled secondary antibodies, and protein was visualized using Li-Cor Biosciences Odyssey Infrared Imaging System.
Flow cytometry and cell cycle analysis.
Rh41 and Rh36 cells were treated with BMS-536924 at 0.5×, 1×, or 3× of IC50 for 17, 24, 48, or 72 h. Cells were fixed in 0.25% formaldehyde followed by 80% methanol and stained with p85PARP (Promega) and propidium iodide (Sigma). Cell cycle effects were evaluated on the FACSCanto with Diva 6.1.1software, and data were analyzed on gated single cells by using FlowJo 8.5.3 and the Watson Pragmatic algorithm.
Results
Determination of sensitivty to IGF-IR inhibitor BMS-536924 and its correlation to cell subtypes in a panel of cancer cell lines.
To identify cell lines with differential response to BMS-536924, a panel of 28 sarcoma and neuroblastoma cell lines was screened in cellular proliferation assays (Supplementary Fig. S1). The sensitivity of each cell line was presented as an IC50, and a wide range of sensitivity was observed across this panel (Table 1). The sensitive/resistant phenotype of this panel to BMS-536924 was classified as follows: the cell lines with log2(IC50) below the mean log2(IC50) across all cell lines were defined as sensitive to the compound, whereas those with log2(IC50) above the mean log2(IC50) were considered to be resistant. Although the sensitive/resistant demarcation is arbitrary, the cut off is around 0.35 μmol/L, which is clinical achievable dose. It should be noted that the sensitivity or resistance of cell lines is not correlated with their doubling times, as cell lines in both the sensitive and resistant groups grow at variable rates.
Table 1.
IC50 and sensitive/resistant classification of each cell line to IGF-IR inhibitor BMS-536924
| Cell type | Cell line | BMS-536924 | |
|---|---|---|---|
| IC50 (μmol/L)* | Sensitivity Classification | ||
| Ewing | TC32 | 0.055 | Sensitive |
| Ewing | LG | 0.063 | Sensitive |
| Ewing | VW | 0.101 | Sensitive |
| Ewing | TC71 | 0.119 | Sensitive |
| Ewing | RDES† | 0.123 | Sensitive |
| Ewing | Rh1 | 0.135 | Sensitive |
| Ewing | 5838 | 0.172 | Sensitive |
| Ewing | JD | 0.232 | Sensitive |
| Ewing | KAG | 2.113 | Resistant |
| Fibrosarcoma | HT1080/S | 1.409 | Resistant |
| Fibrosarcoma | SW-684 | 5 | Resistant |
| Leiomyosarcoma | SK-LMS-1 | 0.5 | Resistant |
| Liposarcoma | HTB-92 | 0.584 | Resistant |
| Liposarcoma | SA-4 | 0.779 | Resistant |
| Malignant Pleural Mesothelioma | H2052 | 0.403 | Resistant |
| Malignant Pleural Mesothelioma | H211 | 0.418 | Resistant |
| Malignant Pleural Mesothelioma | H513 | 3.117 | Resistant |
| Malignant Pleural Mesothelioma | H2595 | 5 | Resistant |
| Neuroblastoma | LAN-1 | 0.136 | Sensitive |
| Neuroblastoma | SHSY5Y | 0.149 | Sensitive |
| Neuroblastoma | SK-NAS | 0.192 | Sensitive |
| Neuroblastoma | SK-NSH | 0.196 | Sensitive |
| Neuroblastoma | IMR-32 | 0.277 | Sensitive |
| Rhabdomyosarcoma | Rh4† | 0.027 | Sensitive |
| Rhabdomyosarcoma | Rh41 | 0.069 | Sensitive |
| Rhabdomyosarcoma | ME | 0.163 | Sensitive |
| Rhabdomyosarcoma | CTR | 0.37 | Resistant |
| Rhabdomyosarcoma | Rh36 | 1.6 | Resistant |
NOTE: IC50 values are determined by cell proliferation assays, and the sensitivity classification cutoff is 0.35 μmol/L. Cell lines with IC50 below 0.35 μmol/L are defined as sensitive, whereas cell lines with IC50 above 0.35 μmol/L are defined as resistant to BMS-536924. The cell subtypes are indicated.
IC50 is the drug concentration required for 50% cell proliferation inhibition.
Cell lines not included in protein profiling analysis.
There is a clear correlation between the sensitive/resistant classification to BMS-536924 and specific tumor subtypes. Most Ewing’s sarcoma, rhabdomyosarcoma, and all neuroblastoma cell lines tested in this study are sensitive to the compound, whereas all fibrosarcoma, leiomyosarcoma, liposarcoma, and malignant pleural mesothelioma cell lines are relatively resistant (Table 1). The distribution of cell subtypes is significantly different in BMS-536924–sensitive and –resistant groups (P = 0.0004, Fisher’s exact test). Although the sample size for each subtype is not large enough to be conclusive, the results suggest that certain tumor subtypes are more responsive than others which may be of particular interest in terms of targeted clinical studies for IGF-IR inhibitors, such as BMS-536924.
Identification of genes/proteins whose expression levels significantly correlated with in vitro sensitivity to BMS-536924.
To identify genes or proteins whose basal expression patterns were strongly correlated with the sensitivity/resistance classification to BMS-536924, both gene and protein expression profiling were performed in parallel using the 28 cell lines. Two statistical methods were applied to the expression data sets, the two-sample t-test and Pearson’s correlation; the latter has the benefit of avoiding the arbitrary classification cutoff required for the two-sample t-test. The genes/proteins exceeding the significance threshold (P < 0.001) in both statistical tests were identified. For gene expression profiling, the molecular signature consists of 497 probe sets representing 386 unique genes (Supplementary Table S1); for protein profiling, it consists of 251 unique peptide ions representing 74 peptides from 44 unique proteins (Supplementary Table S2). Figure 1A and B shows how gene and protein expression levels of these molecular signatures correlated with the sensitivity to BMS-536924 in this cell line panel, respectively. Seventy percent (31 of 44) of identified proteins (Supplementary Table S2) is overlapping with the genes identified in Supplementary Table S1, demonstrating good concordance between the results from two profiling platforms.
Figure 1.
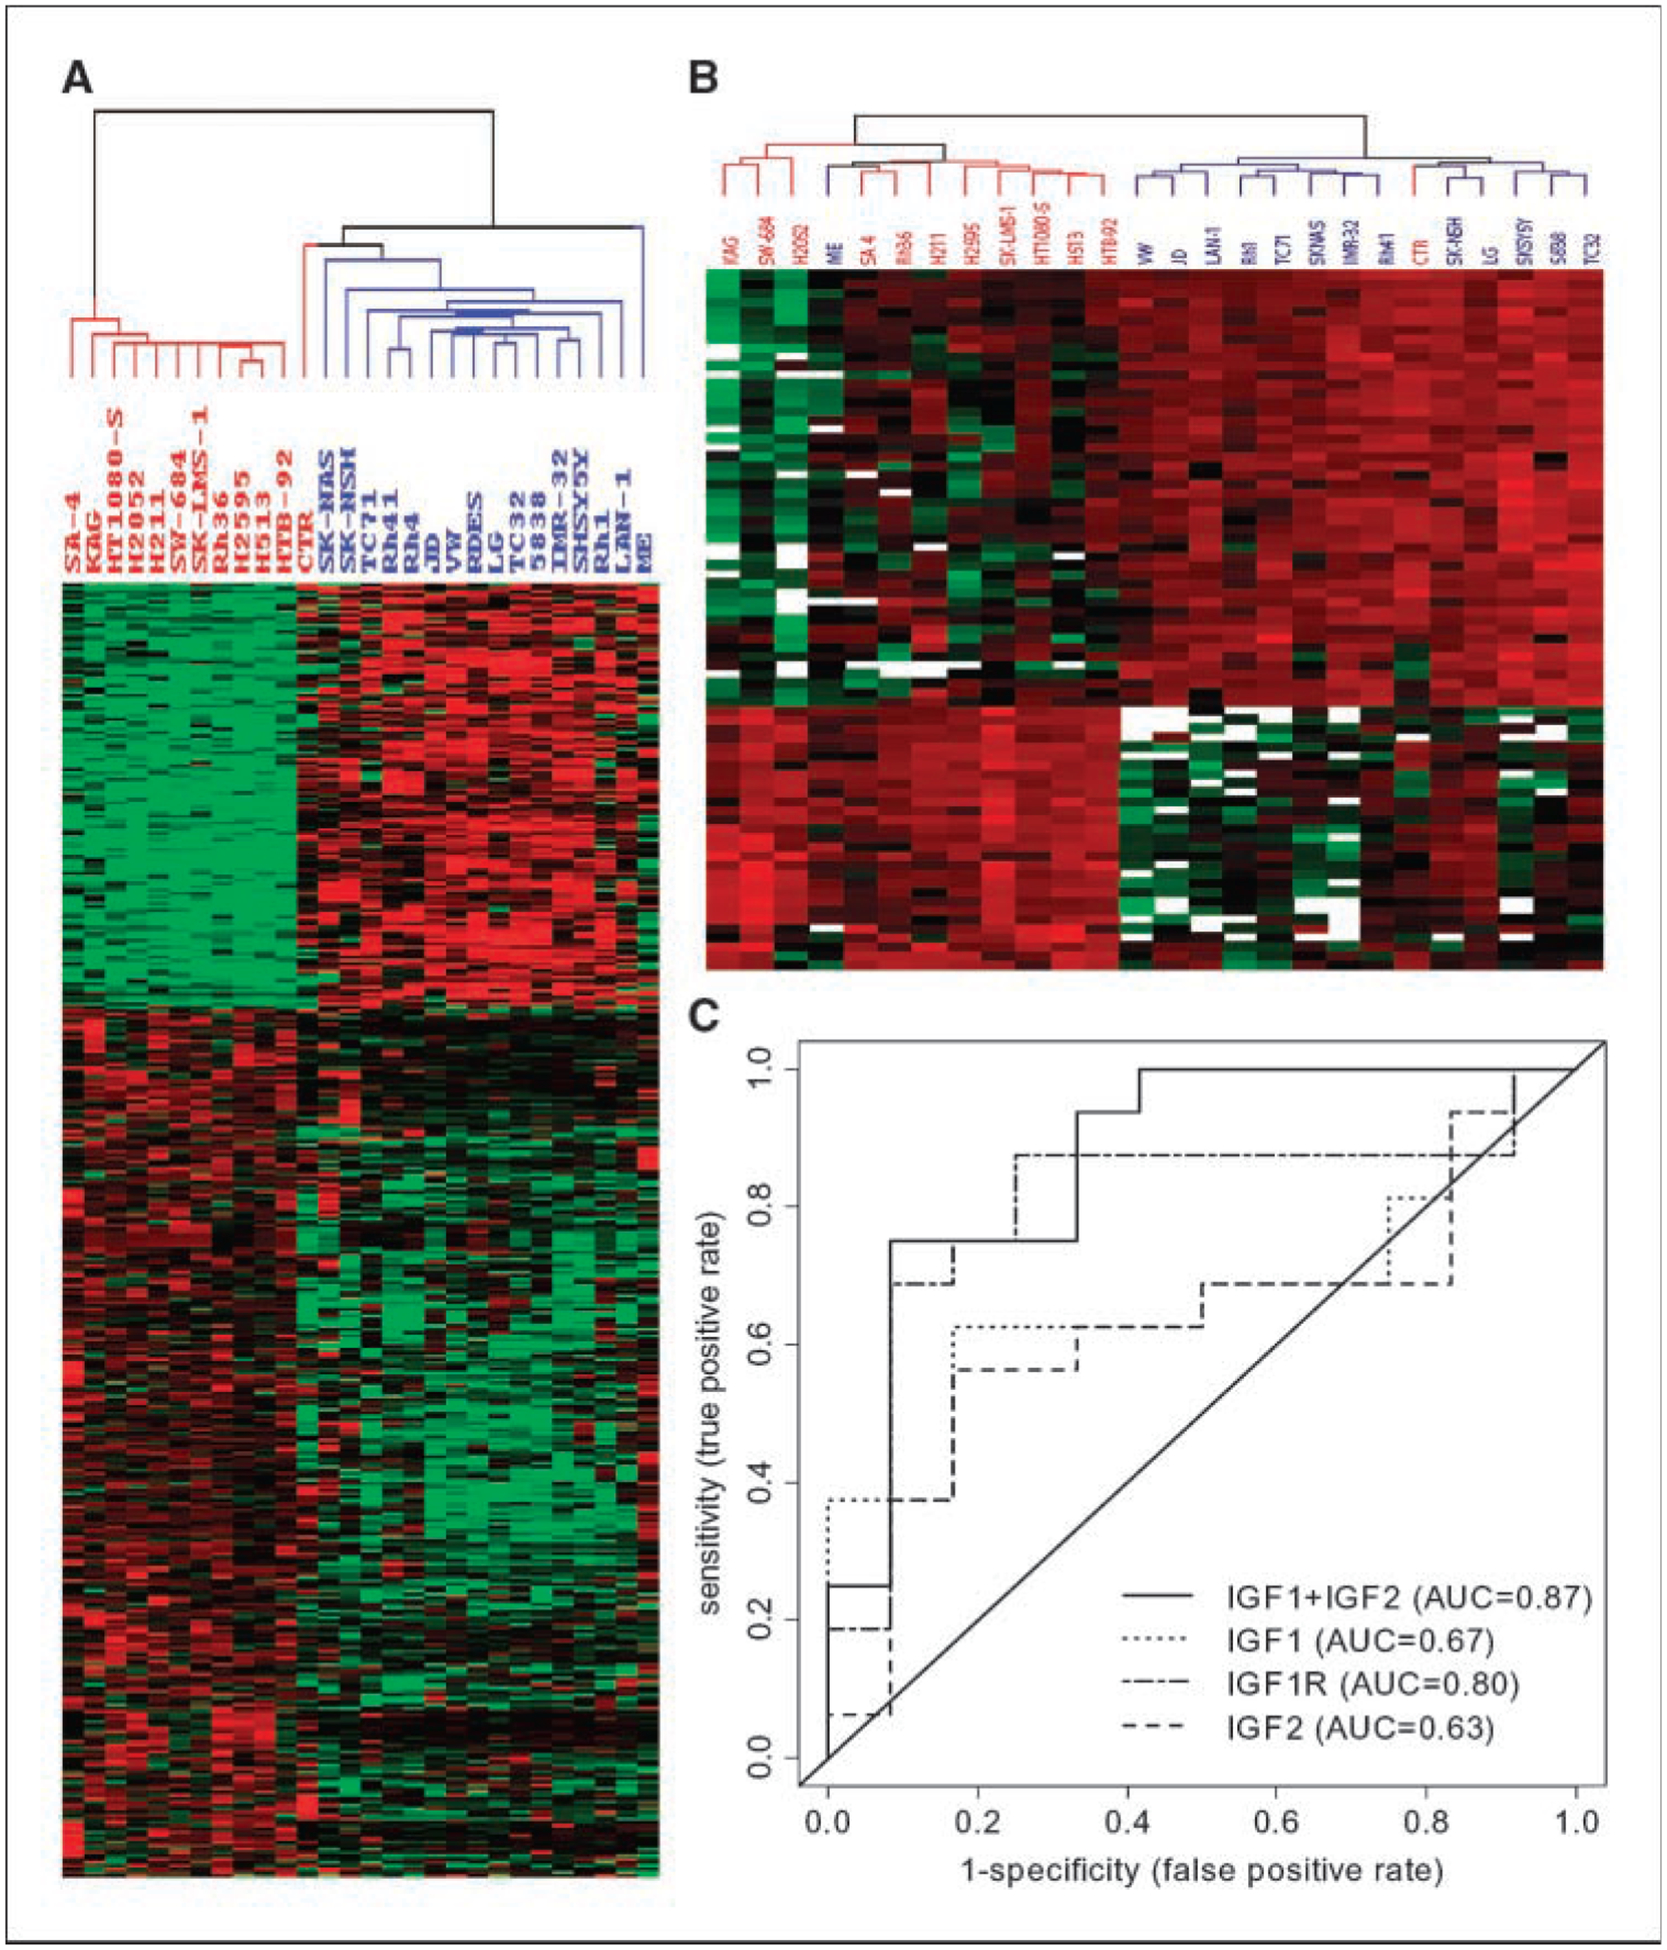
The expression patterns of genes/proteins that are correlated with the sensitivity of BMS-536924. A, expression pattern of 386 genes (see Supplementary Table S1) that are differentially expressed between 16 sensitive cell lines and 12 resistant cell lines, as defined in Table 1. B, expression pattern of 74 peptides (Supplementary Table S2) in 26 cell lines. Blue, BMS-536924–sensitive cell lines; red, resistant cell lines labeled. In both A and B, each column represents a cell line, and each row represents a gene or peptide. Expression is normalized across all cell lines with red being high z score values and green being low values, respectively. The missing values on data points in B are indicated by white. C, receiver operating characteristic (ROC) curves for each of IGF-IR, IGF-I, IGF-II alone, or IGF-I and IGF-II together in prediction of BMS-536924 sensitivity.
Expression of IGFs/IGF-IR and relations to the sensitivity to BMS-536924.
Because BMS-536924 is an inhibitor for IGF-IR and insulin receptor (18), the expression levels of the receptors and ligands were of primary interest. Although IGF-IR, IGF-I, and IGF-II did not pass the stringent statistical significance threshold, their expression was significantly higher in the sensitive cell lines. The logistic regression analysis results for IGF-IR, IGF-I, IGF-II alone, and IGF-I plus IGF-II were shown in Table 2, and the corresponding receiver operating characteristic curves were plotted in Fig. 1C. Interestingly, when IGF-I and IGF-II genes were combined into a single model, the overall predictive ability increased dramatically. This suggests each of the sensitive cell lines may use at least one of the ligands for IGF-IR pathway activation, and the IGFs/IGF-IR pathway may be the predominant driver for growth in sensitive cell lines. However, the expression level of insulin or insulin receptor did not predict the sensitivity to BMS-536924 (Table 2). On the other hand, IGFBP-3 and IGFBP-6 had significant higher expression levels in the resistant cell lines (Supplementary Table S1) and were able to predict the sensitivity to BMS-536924 (Table 2). Because some IGFBPs can sequester and inhibit the activity of IGFs, the role of IGFBP-3 on BMS-536924 resistance was further tested. As shown in Fig. 2A, in sensitive Rh41 cells, BMS-536924 substantially reduced growth in both complete and conditional medium; addition of recombinant IGFBP-3 alone also had marked inhibitory effect on cell growth; however, BMS-536924 has no growth inhibitory effect in the presence of IGFBP-3, indicating IGFBP-3 contributors to BMS-536924 resistance.
Table 2.
Logistic regression analyses of components in IGFs/IGF-IR system in relation to the sensitivity to IGF-IR inhibitor BMS-536924
| Gene | P | Odds ratio* (95% CI) | AUC |
|---|---|---|---|
| IGF-I | 0.039 | 2.86 (0.08–0.96) | 0.67 |
| IGF-II | 0.062 | 2.27 (0.13–1.04) | 0.63 |
| IGF-I + IGF-II | 0.0004 | 4.76 (0.07–0.62) | 0.87 |
| IGF-IR | 0.011 | 3.45 (0.07–0.78) | 0.8 |
| IGFBP-3 | 0.006 | 0.27 (1.39–14.58) | 0.75 |
| IGFBP-6 | 6.79E–06 | 0.07 (3.45–150.88) | 0.91 |
| Insulin | 0.556 | 1.26 (0.58–2.98) | 0.53 |
| IR | 0.1094 | 1.94 (0.87–5.08) | 0.75 |
Abbreviations: 95% CI, 95% confidence interval; AUC, area under the receiver operating characteristic curve; IR, insulin receptor.
For odds of BMS-536924–sensitive versus resistant cell line groups, as defined in Table 1.
Figure 2.
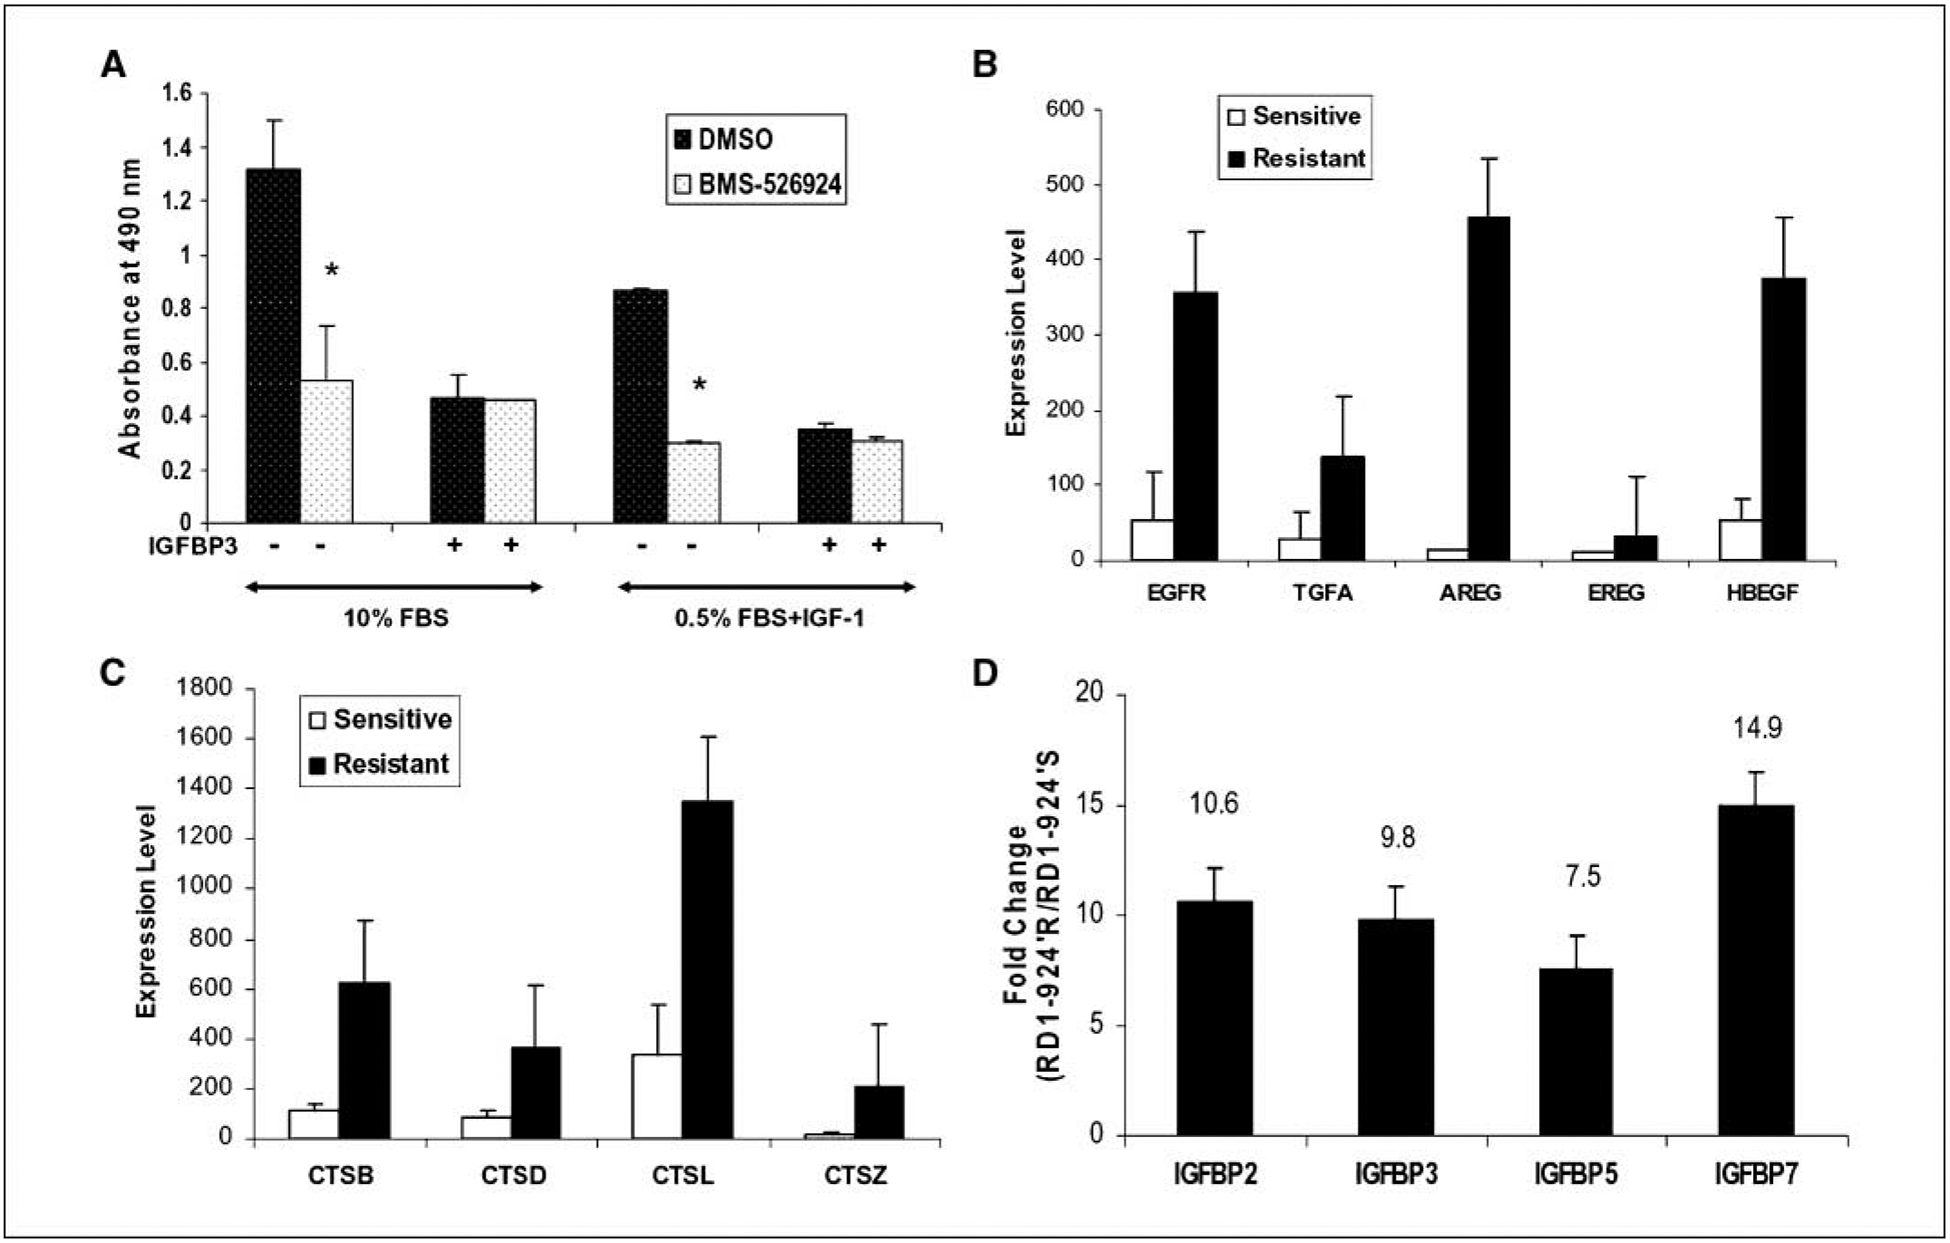
A, effect of IGFBP-3 in resistance to BMS-536924. Rh41 cells were grown in 96-well plates at 3.5 × 10³ per well in complete medium (10% FBS) for 24 h and then washed with PBS. The cells were either incubated with complete medium or 0.5% FBS-containing medium with 50 ng/mL human recombinant IGF-I for 4 h prior treatment with 0.1 μmol/L BMS-536924 and/or 1 μg/mL IGFBP-3 for 72 h. Cell growth was assessed using CellTiter96 aqueous nonradioactive cell proliferation assay kit (Promega). Columns, mean of absorbance measurements at 490 nm from representative experiment; bars, SE. *, P < 0.05 in Student’s t test. B, EGFR and ligands are overexpressed in BMS-536924 primary resistant cell lines. C, cathepsin family members are overexpressed in BMS-536924 primary resistant cell lines. B and C, expression data were detected by Affymetrix Genechip and RMA normalized; the mean expression values (y axis) of the 16 sensitive and the12 resistant cell lines with standard deviations are shown. D, IGFBP family members, IGFBP-2, IGFBP-3, IGFBP-5, and IGFBP-7, are more highly expressed in the BMS-536924 acquired resistant cell RD-1R compared with sensitive parental RD-1S cells. The fold changes (y axis) between BMS-536924 acquired resistant RD-1R and the sensitive parental RD-1S cells are shown.
Possible mechanisms of primary resistance to BMS-536924.
Lower activation or loss of dependency on the IGF-IR pathway in the resistant cell lines is probably due to the adaptation of an IGF-IR–independent mechanism of growth by overexpression of alternative growth signaling pathways. Interestingly, the EGFR RNA expression level was 6.5-fold higher in the BMS-536924–resistant cell lines compared with sensitive ones (Supplementary Table S1). Furthermore, the expression patterns of EGFR protein in this cell line panel were significantly correlated with RNA expression (P = 0.00001; Supplementary Fig. S2). EGFR ligands were further examined; some were also overexpressed in the resistant cell lines (Fig. 2B). The fold change between the resistant and the sensitive cell lines was 4.8-fold, 33.8-fold, 3.2-fold, and 6.9-fold for transforming growth factor α (TGFα; P = 0.002), amphiregulin (P = 0.008), epiregulin (P = 0.016), and heparin-binding EGF-like growth factor (P = 0.00004), respectively. The results suggested that these resistant cell lines may use the EGFR pathway as an alternative growth signal for proliferation and survival; therefore, overexpression of the EGFR pathway may represent one of the primary resistance mechanisms to BMS-536924. Indeed, a recent study showed that activation and overexpression of EGFR are sufficient for resistance to BMS-536924 (30).
Genes previously reported to be associated with resistance to anticancer drugs were also observed in this study with higher expression levels in the resistant cell lines. Several cathepsin family members were expressed 2-fold to 14-fold higher in resistant cell lines (Fig. 2C). Cathepsins are proteases that can cleave and modulate IGFs and IGFBPs (31). Metallothionein, known to be involved in chemoresistance and radiotherapy resistance (32), was another gene family expressed 4-fold to 9-fold higher in resistant cell lines (Supplementary Fig. S3) and may also contribute to the primary resistance to IGF-IR inhibitor BMS-536924.
Genes associated with acquired resistance to BMS-536924.
Acquired resistance to anticancer agents is a significant clinical problem. To study the mechanism of acquired resistance to IGF-IR inhibitor, gene expression profiles of the acquired resistant RD1R cells (IC50, 2.0 μmol/L) were compared with that of the parental sensitive RD-1S cells (IC50, 0.238 μmol/L) to identify differentially expressed genes, which may be involved in acquired resistance to BMS-536924. Interestingly, IGFBP-2, IGFBP-3, IGFBP-5, and IGFBP-7 were expressed at higher levels in the acquired resistant RD1R cells compared with the parental sensitive RD-1S (Fig. 2D), whereas IGF-II had an inverse expression pattern (data not shown).
Genes correlated with both primary and acquired resistance were identified (Supplementary Table S3), which suggests possible common mechanisms for both types of drug resistance to BMS-536924. DSG2, THBS1, and CD55 are examples (Supplementary Fig. S4). Further studies to confirm the role of these genes in contributing to BMS-536924 resistance will require cross-validation in independent models of acquired resistance and functional testing.
BMS-536924 inhibits cell proliferation and induces apoptosis preferentially in the sensitive cells.
A pair of human rhabdomyosarcoma cell lines with differential sensitivity to BMS-536924, Rh41 (sensitive; IC50, 0.069 μmol/L) and Rh36 (resistant; IC50, 1.6μmol/L) were chosen for further studies. No mutations on IGF-IR were observed in either cell line. Rh41 cells had a significant IGF-IR expression but limited insulin receptor, whereas Rh36 had relatively low IGF-IR but abundant insulin receptor as detected at both RNA and protein levels (Fig. 3A). This was confirmed by fluorescence-activated cell sorting (FACS) analyses (Supplementary Fig. S5). As shown in Fig. 3B, pIGF-IR/pIR was activated upon IGF-I/insulin stimulation and the activation was inhibited by BMS-536924 at similar potencies in both cell lines. However, the activation of downstream signaling components was inhibited by the drug preferentially in sensitive Rh41 cells in a dose-dependent fashion, as evidenced by decreased pAkt, whereas in the resistant Rh36 cells, a much higher dose of BMS-536924 was required to achieve the same inhibitory effects. Similar effects of BMS-536924 on pMAPK were also observed (data not shown). Compared with Rh41, Rh36 has much higher levels of EGFR (Supplementary Fig. S2) and Her2 (data not shown), suggesting Akt and MAPK may be activated through alternative growth factor pathways in addition to IGF-IR/insulin receptor pathway in Rh36, so targeting IGF-IR/insulin receptor may not be sufficient to inhibit downstream pathways.
Figure 3.
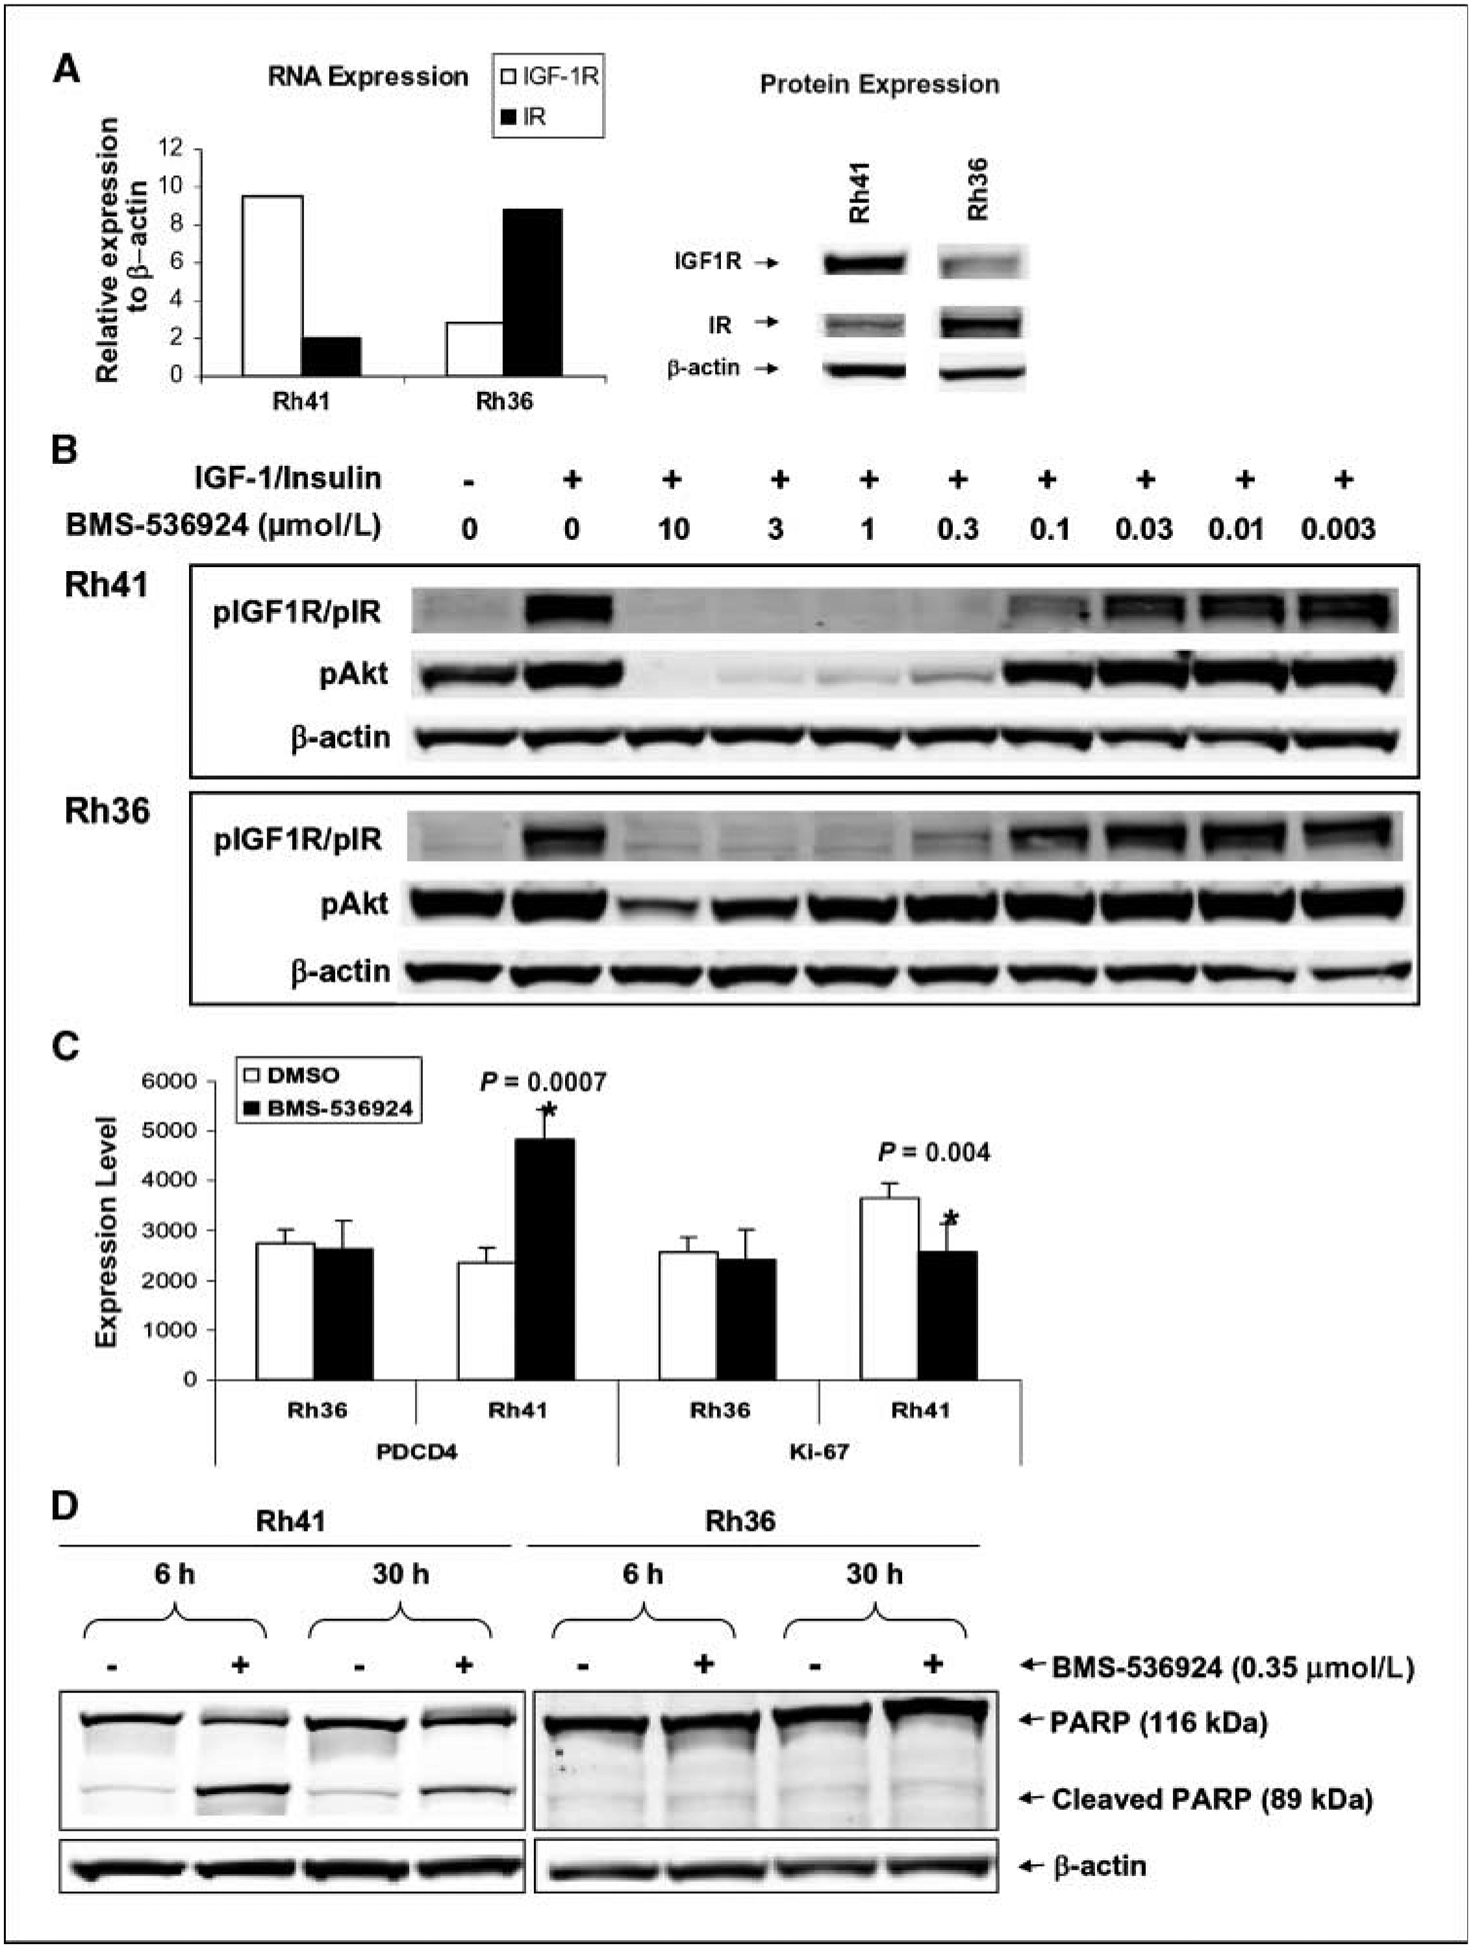
Differential effects of BMS-536924 on IGF-IR/insulin receptor signaling, cell proliferation, and apoptosis in sensitive Rh41 and resistant Rh36 cell lines. A, differential expression levels of IGF-IR and insulin receptor: RNA as measured by Affymetrix chip (left) and protein as analyzed by Western blots (right) against IGF-IRβ (Santa Cruz; 1:200 dilution), IRβ (Santa Cruz; 1:200 dilution), and β-actin (Chemicon International; 1:5,000 dilution). B, differential activity of BMS-536924 on pAkt. Cells were exposed to increasing concentrations of BMS-536924 in medium containing 10% FBS for 1 h; IGF-I and insulin both at 50 ng/mL were added to costimulate for 5 min. Protein (20 μg) of cell lysates was analyzed by Western blots against pIGF-IR/pIR (Cell Signaling Technology; 1:1,000 dilution), pAkt (Cell Signaling Technology; 1:1,000 dilution), and β-actin. C, differential response to BMS-536924 on expression levels of PDCD4 and Ki-67 genes. D, differential induction of apoptosis by BMS-536924 in sensitive cell line. Rh41 and Rh36 cells exposed to 0.35 μmol/L BMS-536924 or DMSO for 6 and 30 h. Both media and cells were collected to prepare cell lysates. Total proteins (20 μg) were analyzed for cleaved PARP (Cell Signaling Technology; 1:1,000 dilution) and β-actin.
To examine the effects of BMS-536924 on IGF-IR/insulin receptor downstream pathways, preferentially in sensitive cells, Rh41 and Rh36 cells were treated with BMS-536924. Genes differentially modulated in the two cell lines were evaluated using gene expression profiling. Overall, the drug had little effect on gene expression in resistant Rh36 cells compared with the sensitive Rh41 cells in which 30% of the genes had dramatic change in expression levels upon the drug treatment. Many genes involved in multiple pathways, such as apoptosis, cell growth and proliferation, and cell cycle regulation, were modulated by BMS-536924 treatment in Rh41 cells (Supplementary Table S4). For example, the expression of programmed cell death 4 (PDCD4) was up-regulated (Fig. 3C), suggesting induction of apoptosis. Indeed, increased cleavage of poly(ADP-ribose) polymerase (PARP; Fig. 3D) and caspase-3 (data not shown) were observed preferably in Rh41 cells treated with BMS-536924. In contrast, the proliferation marker Ki-67 was down-regulated by BMS-536924 in the sensitive Rh41 cells, but not in resistant Rh36 cells (Fig. 3C). Taken together, these results suggest that induction of apoptosis and inhibition of proliferation by BMS-536924 occurs preferentially in the sensitive cell line.
Effects of BMS-536924 on cell cycle and apoptosis in Rh41 and Rh36 were further analyzed by FACS. There was no significant difference in cell cycle profiles in both cell lines after exposure to BMS-536924 at 0.5×, 1× and 3× of corresponding IC50 value for each for up to 72 hours, whereas the PARP cleavage is significantly higher in Rh41 cells (data not shown), which is consistent with Fig. 3D. These results indicated apoptosis is not caused by cell cycle perturbations in sensitive cells.
Significant differences in multiple pathways between sensitive and resistant cell lines to BMS-536924.
Pathway analysis on the gene expression data from the 28 cell line panel using global test showed that 74 of the 182 tested KEGG pathways were significantly (FWER adjusted P < 0.05) associated with the sensitive/resistant classification to BMS-536924 (Supplementary Table S4). Pathways including apoptosis, signaling via MAPK, TGFβ, Jak-STAT, insulin, VEGF, and natural killer cell-mediated cytotoxicity were among the pathways significantly different between the sensitive and resistant cell lines and may contribute to the differential sensitivity to the IGF-IR inhibitor. It was noticed that antiapoptotic genes, such as Bcl-2, Bcl-XL, and API2 have higher expression in the resistant cell lines. This may speculate that resistant cell lines have higher threshold to be apoptotic due to the presence of other growth signaling pathways in addition to IGF-IR. This is in agreement with Fig. 3D that BMS-536924 does not induce apoptosis in the resistant Rh36 cells and, with Fig. 2B, that resistant cells have higher expression of EGFR.
Ingenuity pathway analysis was performed on genes that significantly correlated with the sensitivity to BMS-536924 in this cell line panel. In the most significant network, overexpression and cross-talk between multiple kinases (e.g., EGFR, MET, TGFβR2) were observed in BMS-536924–resistant cell lines (Supplementary Fig. S6). In addition to IGF-IR, overexpression of alternative growth signal pathways, such as EGFR in resistant cell lines (Fig. 2B), may explain why they survive and proliferate even in the presence of BMS-536924. Targeting multiple pathways may be necessary to sufficiently inhibit the growth of resistant cells.
Enhanced activity between inhibitors of IGF-IR and EGFR pathways.
Because tumor cells rely on multiple receptors for activation of critical signaling pathways, strategies designed to block signaling from these receptors may be advantageous. Given the important roles of IGF-IR and EGFR in cell cycle progression, combination studies were performed to investigate whether inhibition of IGF-IR and EGFR may result in enhanced growth inhibition in Rh36 cells, which expresses both EGFR and HER2. Table 3 summarizes the in vitro combination results using BMS-536924 combining with either a pan-HER inhibitor BMS-690514(33) or an EGFR inhibitor gefitinib; synergistic or additive antiproliferative effects (Supplementary Fig. S7) were observed, respectively. The synergistic effects were also observed in vitro with another IGF-IR inhibitor in combination with either EGFR or pan-HER inhibitor in Rh36 cell line (data not shown) and further supports the rationale for combining IGF-IR and EGFR inhibitors. Furthermore, in vivo combination of BMS-536924 with Erbitux in xenografts also showed enhanced antitumor activities (Supplementary Fig. S8).
Table 3.
In vitro combination study of IGF-IR inhibitor BMS-536924 with Her1/Her2 inhibitors gefitinib or BMS-690514 in Rh36 cell lines
| Ratio of BMS-536924/gefitinib or BMS-690514 in combination | Combining with gefitinib | Combining with BMS-690514 | ||
|---|---|---|---|---|
| Combination index with SE | 95% CI for Combination index | Combination index with SE | 95% CI for Combination index | |
| 9:1 | 1.09 ± 0.20 | 0.69–1.49 | 0.69 ± 0.09 | 0.52–0.87 |
| 4:1 | 1.01 ± 0.19 | 0.63–1.39 | 0.63 ± 0.08 | 0.46–0.79 |
| 2:1 | 1.01 ± 0.20 | 0.63–1.40 | 0.47 ± 0.05 | 0.37–0.57 |
| 1:1 | 0.89 ± 0.15 | 0.60–1.18 | 0.46 ± 0.06 | 0.34–0.58 |
| 1:2 | 0.98 ± 0.14 | 0.70–1.26 | 0.47 ± 0.07 | 0.33–0.61 |
| 1:4 | 0.89 ± 0.11 | 0.67–1.10 | 0.48 ± 0.08 | 0.32–0.64 |
NOTE: A dilution of ratios of drug combination method was used in cellular proliferation assays to test the IC50 values of single agents, as well as in combination. Combination indices, SEs, and 95% confidence intervals were calculated for the different ratios and used to determine if the combination results represent synergistic, additive, or antagonistic effects when two compounds were added simultaneously. The combination results were analyzed by Isobolograms. Combination index ± 2× SE <1 indicates synergy and >1 indicates additivity. Synergistic efforts observed for IGF-IR inhibitor BMS-536924 in combination with BMS-690514, a Her1/Her2 inhibitor. Additive effort of BMS-536924 in combination with gefitinib was observed.
Discussion
Because there may be only a subset of patients response to IGF-IR inhibitors, selecting patients most likely to derive clinical benefit could help clinical development of BMS-536924. In this study, a correlation between the sensitive/resistant classification to BMS-536924 and cell subtypes in the panel of cell lines was found: Ewing’s sarcoma, rhabdomyosarcoma, and neuroblastoma are more sensitive to the inhibitor, making these subtypes the preferred target population for the drug. The observation is in agreement with favorable clinical response data showing that several chemoresistant Ewing’s sarcoma patients have benefited from therapies using an antibody against IGF-IR (34).
Ewing’s sarcomas overexpress IGF-IR and rely on signaling through IGF-IR for growth and transformation (10). It is known that 85% of Ewing’s sarcoma have t(11;22)(q24:q12) chromosomal translocation that generates an EWS-FLI-1 fusion protein, an aberrant transcriptional activator that alters the expression of its target genes, including TGFβRII and IGFBP-3 (35). RNA interference knockdown of the EWS-FLI-1 fusion gene in Ewing’s cells leads to the up-regulation of a group of genes, including IGFBP-3, IGFBP-6, TGFβIIR, TGFβI, PLAUR, and CD44 (36, 37). These genes highly expressed in BMS-536924–resistant cell lines (Supplementary Table S1), implicating the potential role of EWS-FLI-1 in sensitivity to IGF-IR inhibitors. However, EWS-FLT-1 translocation may not be the only factor determining the sensitivity to BMS-536924 because other cell types, such as rhabdomyosarcoma and neuroblastomas, are in absence of EWS-FLT-1 translocation, but sensitive to the inhibitor.
Using both microarray gene expression profiling and LC/MS-based label-free protein profiling technologies to study a panel of cell lines, we identified genes and proteins correlated with the sensitivity to BMS-536924. Components of IGF axis seem to play an important role in the sensitivity to IGF-IR inhibitor. IGF-I, IGF-II, and IGF-IR were overexpressed in the sensitive cell lines; IGF-I and IGF-II together predicted the sensitivity of BMS-536924 in these cell lines more efficiently than either ligand alone (Fig. 1C). These results imply that sensitive cell lines may have enhanced activity of IGF-IR pathways, and IGF-IR signaling may likely be the major growth driver for these cell lines. Furthermore, IGFBP-3 and IGFBP-6 overexpression may contribute to the primary resistance to BMS-536924. Addition of IGFBP-3 in growth medium decreased the sensitivity of Rh41 cells to BMS-536924 (Fig. 2A), indicating its role in resistance to IGF-IR inhibitor. Furthermore, IGFBP-2, IGFBP-3, IGFBP-5, and IGFBP-7 were elevated 7-fold to 15-fold in the BMS-536924 acquired resistant cells compared with the parental sensitive cells (Fig. 2D). IGFBPs are important members of the IGF axis; they regulate the IGF-I pathway and influence IGF signaling by modulating the biological accessibility and activity of the IGFs in several ways: they transport IGFs from the circulation to peripheral tissues (e.g., IGFBP-1, IGFBP-2, and IGFBP-4), maintain a reservoir of IGFs in the circulation (e.g., IGFBP-3), inhibit IGF action, and mediate IGF-independent biological effects (1, 38). Several IGFBPs have been implicated in drug resistance. IGFBP-3 and IGFBP-5 were reported to be significantly higher in ovarian cancer patients who failed treatment with letrozole, an aromatase inhibitor, compared with responders (39); IGFBP-2 mRNA and protein levels were overex pressed in cell lines resistant to the antiestrogens, Faslodex/Fulvestrant, tamoxifen, or RU 58,668 (40) or to multikinase inhibitor dasatinib (24).
IGFBPs actions can be modulated by IGFBP proteases, and there are at least three classes of proteases, cathepsins, kallikreins, and matrix metalloproteinases (MMP) that cleave IGFBPs. The levels of cathepsin B and/or cathepsin L have been shown to correlate with drug resistance (41, 42). Interestingly, higher basal expression levels of cathepsin B, L, Z, and D (Fig. 2C), kallikrein 5, and kallikrein 6 (data not shown) were observed in BMS-536924–resistant cell lines. Increased expression of MMP1 and MMP2 also observed in BMS-536924 acquired resistant cells (data not shown). These results suggest that elevation of proteases that modulate IGFBPs action may be one of the potential mechanisms of resistance to IGF-IR inhibitor BMS-536924.
DSG2, THBS1, and CD55 overexpressed in both primary and acquired resistant cell lines (Supplementary Fig. S4), suggesting some potential common mechanisms for both types of resistance to BMS-536924. These genes are all somehow involved in drug resistance (43–45); further study of their roles in resistance to BMS-536924 is warranted.
BMS-536924 has similar potencies to inhibit pIGF-IR/pIR in both Rh41 and Rh36, but is more effective at inhibiting pAkt in Rh41 cells compared with Rh36 cells (Fig. 3B). It is possible that only IGF-IR–driven activation of Akt and MAPK signaling is dominant for survival in sensitive Rh41 cell, whereas in resistant Rh36 cells, IGF-IR is not the only survival factor and other factor or receptor-driven activation of downstream signaling effectors for survival may be dominant. Therefore, cells totally dependent on IGF-IR signaling for survival and apoptosis are highly susceptible to IGF-IR inhibitor BMS-536924. Furthermore, apoptosis is induced by BMS-536924 predominantly in the sensitive cell line, as evidenced by up-regulation of PDCD4 (Fig. 3C), increased cleavage of PARP (Fig. 3D), and reduction of survivin (data not shown).
Inhibition of oncogenic kinases has proved to be a valuable strategy for target-specific treatment of an ever-increasing number of cancer types. These include the treatment of HER2-positive breast cancers with HER2 antibody trastuzumab, chronic myeloid leukemia with the BCR-ABL inhibitors, imatinib and dasatinib, and colorectal and non–small cell lung cancer with the EGFR inhibitors cetuximab and erlotinib. Unfortunately, initial success is often hampered by a relatively rapid onset of resistance to the drugs and subsequent relapse particularly in patients with advanced disease. In addition to developing mutations, loss of target dependence due to the activation of parallel signaling pathways has been reported as cause for acquired drug resistance (46, 47). Revelation of drug resistance mechanistic details could provide the basis for the development of therapies with novel or conventional antitumor drugs in combination with specific inhibitors to reestablish chemosensitivity. From the present study, it is noteworthy that in the cell lines with primary resistance to BMS-536924, other kinases, such as EGFR, TGFβR2, and Met, were overexpressed (Supplementary Table S1). This may suggest that loss of IGF-IR dependence due to overexpression of other kinases and activation of alternative signaling pathways may play a mechanistic role in resistance to the IGF-IR inhibitor. The EGFR pathway, for example, is presumably more activated and may be one of the major drivers for growth signaling in resistant cell lines, targeting IGF-IR alone may not be sufficient to inhibit growth of these cells. Based on these observations, it was hypothesized that an EGFR inhibitor should sensitize resistant cells to IGF-IR inhibitors. Combination of BMS-536924 with a HER1/HER2 inhibitor BMS-690514 in Rh36 cells showed synergistic effects, whereas with EGFR inhibitor gefitinib demonstated additive effects (Table 3). A recent study showed that inhibition of IGF-IR or HER receptors stimulates reciprocal receptor phosphorylation, suggesting a bidirectional functional cross-talk between the IGF and HER family of receptors; activation and overexpression of EGFR or HER2 are sufficient for resistance to BMS-536924 (30). Simultaneous inhibition of both IGF-IR and HER pathways achieved synergic activity via enhanced apoptosis further support the observation that cotargeting IGF-IR and EGFR sensitize cancer cells to apoptosis induction (48, 49). IGF signaling through IGF-IR has been shown to protect cancer cells from the cytotoxic effects of chemotherapy therapy (50). IGF-IR inhibitors may have the potential to be combined with other therapies in a wide range of tumors to increase the overall survival of patients. Combining BMS-536924 with cytotoxic agents also resulted in synergistic and/or additive effects in multiple types of cancer cell lines (data not shown).
In summary, molecular characterization of a panel of 28 cell lines led to the identification of molecular signatures correlated with the intrinsic in vitro sensitivity to the IGF-IR inhibitor BMS-536924. The expression of IGF ligands and IGF-IR seems likely predictive of the sensitivity to BMS-536924 in sarcomas. A priori screening for IGF-I, IGF-II, and IGF-IR may help to stratify patients likely to benefit from IGF-IR inhibitors in patients with sarcomas. This should be tested retrospectively in clinical studies and then further validated in perspective studies. One resistance mechanism may be alternate activation of other parallel signaling pathways, including EGFR. Enhanced growth inhibitions were observed both in vitro and in vivo when combining BMS-536924 with different EGFR inhibitors. Strategies for developing IGF-IR inhibitors as potential combination agents in clinical trials to achieve activity in chemoresistant tumors are necessary and will be facilitated by this preclincal study. Further testing of the genes identified in this study on whether they are necessary and/or sufficient for the differential sensitivity to agents targeting the IGF signaling pathway is needed to validate the hypotheses generated by the present study.
Supplementary Material
Acknowledgments
We thank Becky Penhallow for the cell cycle analysis and Xi-De Wang for assistance in preparing figures in this manuscript.
Footnotes
Disclosure of Potential Conflicts of Interest
No potential conflicts of interest were disclosed.
Note: Supplementary data for this article are available at Cancer Research Online (http://cancerres.aacrjournals.org/).
References
- 1.Samani AA, Yakar S, LeRoith D, Brodt P. The role of the IGF system in cancer growth and metastasis: overview and recent insights. Endocr Rev 2007;28:20–47. [DOI] [PubMed] [Google Scholar]
- 2.Khandwala HM, McCutcheon IE, Flyvbjerg A, Friend KE. The effects of insulin-like growth factors on tumorigenesis and neoplastic growth. Endocr Rev 2000;21:215–44. [DOI] [PubMed] [Google Scholar]
- 3.LeRoith D, Roberts CT Jr. The insulin-like growth factor system and cancer. Cancer Lett 2003;195:127–37. [DOI] [PubMed] [Google Scholar]
- 4.Baserga R, Peruzzi F, Reiss K. The IGF-I receptor in cancer biology. Int J Cancer 2003;107:873–7. [DOI] [PubMed] [Google Scholar]
- 5.Sachdev D, Yee D. Disrupting insulin-like growth factor signaling as a potential cancer therapy. Mol Cancer Ther 2007;6:1–12. [DOI] [PubMed] [Google Scholar]
- 6.Hartog H, Wesseling J, Boezen HM, van der Graaf WT. The insulin-like growth factor 1 receptor in cancer: old focus, new future. Eur J Cancer 2007;43:1895–904. [DOI] [PubMed] [Google Scholar]
- 7.Merlino G, Helman LJ. Rhabdomyosarcoma working out the pathways. Oncogene 1999;18:5340–8. [DOI] [PubMed] [Google Scholar]
- 8.Scotlandi K, Benini S, Sarti M, et al. Insulin-like growth factor I receptor-mediated circuit in Ewing’s sarcoma/peripheral neuroectodermal tumor: a possible therapeutic target. Cancer Res 1996;56:4570–4. [PubMed] [Google Scholar]
- 9.Burrow S, Andrulis IL, Pollak M, Bell RS. Expression of insulin-like growth factor receptor, IGF-1, and IGF-II in primary and metastatic osteosarcoma. J Surg Oncol 1998;69:21–7. [DOI] [PubMed] [Google Scholar]
- 10.Sekyi-Otu A, Bell RS, Ohashi C, Pollak M, Andrulis IL. Insulin-like growth factor 1 (IGF-1) receptors, IGF-1, and IGF-II are expressed in primary human sarcomas. Cancer Res 1995;55:129–34. [PubMed] [Google Scholar]
- 11.Benini S, Manara MC, Baldini N, et al. Inhibition of insulin-like growth factor I receptor increases the antitumor activity of doxorubicin and vincristine against Ewing’s sarcoma cells. Clin Cancer Res 2001; 7:1790–7. [PubMed] [Google Scholar]
- 12.Scotlandi K, Manara MC, Nicoletti G, et al. Antitumor activity of the insulin-like growth factor-I receptor kinase inhibitor NVP-AEW541 in musculoskeletal tumors. Cancer Res 2005;65:3868–76. [DOI] [PubMed] [Google Scholar]
- 13.Manara MC, Landuzzi L, Nanni P, et al. Preclinical in vivo study of new insulin-like growth factor-I receptor-specific inhibitor in Ewing’s sarcoma. Clin Cancer Res 2007;13:1322–30. [DOI] [PubMed] [Google Scholar]
- 14.Mulligan AM, O’Malley FP, Ennis M, Fantus IG, Goodwin PJ. Insulin receptor is an independent predictor of a favorable outcome in early stage breast cancer. Breast Cancer Res Treat 2007;106:39–47. [DOI] [PubMed] [Google Scholar]
- 15.Storz P, Döppler H, Pfizenmaier K, Müller G. Insulin selectively activates STAT5b, but not STAT5a, via a JAK2-independent signalling pathway in Kym-1 rhabdomyosarcoma cells. FEBS Lett 1999;464:159–63. [DOI] [PubMed] [Google Scholar]
- 16.Morrione A, Valentinis B, Xu SQ, et al. Insulin-like growth factor II stimulates cell proliferation through the insulin receptor. Proc Natl Acad Sci U S A 1997; 94:3777–82. [DOI] [PMC free article] [PubMed] [Google Scholar]
- 17.Zhang H, Pelzer AM, Kiang DT, Yee D. Down-regulation of type I insulin-like growth factor receptor increases sensitivity of breast cancer cells to insulin. Cancer Res 2007;67:391–7. [DOI] [PubMed] [Google Scholar]
- 18.Wittman M, Carboni J, Attar R, et al. Discovery of a (1H-benzoimidazol-2-yl)-1H-pyridin-2-one (BMS-536924) inhibitor of insulin-like growth factor I receptor kinase with in vivo antitumor activity. J Med Chem 2005; 48:5639–43. [DOI] [PubMed] [Google Scholar]
- 19.Baselga J, Tripathy D, Mendelsohn, et al. Phase II study of weekly intravenous recombinant humanized anti-p185HER2 monoclonal antibody in patients with HER2/neu-overexpressing metastatic breast cancer. J Clin Oncol 2005;14:737–44. [DOI] [PubMed] [Google Scholar]
- 20.Lynch TJ, Bell DW, Sordella R, et al. Activating mutations in the epidermal growth factor receptor underlying responsiveness of non-small-cell lung cancer to gefitinib. N Engl J Med 2004;350:2129–39. [DOI] [PubMed] [Google Scholar]
- 21.Iwao-Koizumi K, Matoba R, Ueno N, et al. Prediction of docetaxel response in human breast cancer by gene expression profiling. J Clin Oncol 2005;23:422–31. [DOI] [PubMed] [Google Scholar]
- 22.Hess KR, Anderson K, Symmans WF, et al. Pharma-cogenomic predictor of sensitivity to preoperative chemotherapy with paclitaxel and fluorouracil, doxorubicin, and cyclophosphamide in breast cancer. J Clin Oncol 2006;24:4236–44. [DOI] [PubMed] [Google Scholar]
- 23.Potti A, Dressman HK, Bild A, et al. Genomic signatures to guide the use of chemotherapeutics. Nat Med 2006;12:1294–300. [DOI] [PubMed] [Google Scholar]
- 24.Huang F, Reeves K, Han X, et al. Identification of candidate molecular markers predicting sensitivity in solid tumors to dasatinib: rationale for patient selection. Cancer Res 2007;67:2226–38. [DOI] [PubMed] [Google Scholar]
- 25.Tallarida RJ. Drug Synergism and Dose-Effect Data Analysis. 1st ed Chapman & Hall/CRC; 2000. [Google Scholar]
- 26.Anderle M, Roy S, Lin H, Becker C, Joho K. Quantifying reproducibility for differential proteomics: noise analysis for protein liquid chromatography-mass spectrometry of human serum. Bioinformatics 2004;20: 3575–82. [DOI] [PubMed] [Google Scholar]
- 27.Fanyu MF, Wiener MC, Sachs JR, et al. Quantitative analysis of complex peptide mixtures using FTMS and differential mass spectrometry. J Am Soc Mass Spectrom 2007;18:226–33. [DOI] [PubMed] [Google Scholar]
- 28.Eng JK, McCormack AL, Yates JR. An approach to correlate tandem mass spectral data of peptides with amino acid sequences in a protein database. J Am Soc Mass Spectrom 1994;5:976–89. [DOI] [PubMed] [Google Scholar]
- 29.Irizarry RA, Hobbs B, Collin F, et al. Exploration, normalization, and summaries of high density oligonucleotide array probe level data. Biostatistics 2003;4:249–64. [DOI] [PubMed] [Google Scholar]
- 30.Haluska P, Carboni JM, TenEyck C, et al. HER receptor signaling confers resistance to the insulin-like growth factor-I receptor inhibitor, BMS-536924. Mol Cancer Ther 2008;7:2589–98. [DOI] [PMC free article] [PubMed] [Google Scholar]
- 31.Claussen M, Kübler B, Wendland M, et al. Proteolysis of insulin-like growth factors (IGF) and IGF binding proteins by cathepsin D. Endocrinology 1997;138:3797–803. [DOI] [PubMed] [Google Scholar]
- 32.Ebadi M, Iversen PL. Metallothionein in carcinogenesis and cancer chemotherapy. Gen Pharmacol 1994;25: 1297–310. [DOI] [PubMed] [Google Scholar]
- 33.Gavai A, Chen P, Norris D, et al. Structure activity relationships for 5-substituted pyrrolo(2,1-f)(1,2,4)triazine-based inhibitors of pan-HER/VEGFR2 kinases: identification of the clinical candidate. Proceedings of the 98th Annual Meeting of the American Association for Cancer Research; April 14–18, 2007; Abstract #4170. [Google Scholar]
- 34.Tolcher AW, Rothenberg ML, Rodon J, et al. A phase I pharmacokinetic and pharmacodynamic study of AMG 479, a fully human monoclonal antibody against insulin-like growth factor type 1 receptor (IGF-1R), in advanced solid tumors. J Clin Oncol 2007;25:3002. [DOI] [PubMed] [Google Scholar]
- 35.Delattre O, Zucman J, Plougastel B, et al. Gene fusion with an ETS DNA-binding domain caused by chromosome translocation in human tumours. Nature 1991;359:162–5. [DOI] [PubMed] [Google Scholar]
- 36.Hahm KB, Cecile Lee KC, Im YH, et al. Repression of the gene encoding the TGF-β type II receptor is a major target of the EWS-FLI1 oncoprotein. Nat Genet 1999;23:222–7. [DOI] [PubMed] [Google Scholar]
- 37.Prieur A, Tirode F, Cohen P, Delattre O. EWS/FLI-1 silencing and gene profiling of Ewing cells reveal downstream oncogenic pathways and a crucial role for repression of insulin-like growth factor binding protein 3. Mol Cell Biol 2004;24:7275–83. [DOI] [PMC free article] [PubMed] [Google Scholar]
- 38.Jones JI, Clemmons DR. Insulin-like growth factors and their binding proteins: biological actions. Endocr Rev 1995;16:3–34. [DOI] [PubMed] [Google Scholar]
- 39.Walker G, MacLeod K, Williams AR, Cameron DA, Smyth JF, Langdon SP. Insulin-like growth factor binding proteins IGFBP3, IGFBP4, and IGFBP5 predict endocrine responsiveness in patients with ovarian cancer. Clin Cancer Res 2007;13:1438–44. [DOI] [PubMed] [Google Scholar]
- 40.Juncker-Jensen A, Lykkesfeldt AE, Worm J, Ralfkiaer U, Espelund U, Jepsen JS. Insulin-like growth factor binding protein 2 is a marker for antiestrogen resistant human breast cancer cell lines but is not a major growth regulator. Growth Horm IGF Res 2006;16:224–39. [DOI] [PubMed] [Google Scholar]
- 41.Osmak M, Svetic B, Gabrijelcic-Geiger D, Skrk J. Drug-resistant human laryngeal carcinoma cells have increased levels of cathepsin B. Anticancer Res 2001; 21:481–3. [PubMed] [Google Scholar]
- 42.Zheng X, Chou PM, Mirkin BL, Rebbaa A. Senescence-initiated reversal of drug resistance: specific role of cathepsin L. Cancer Res 2004;64:1773–80. [DOI] [PubMed] [Google Scholar]
- 43.Brennan D, Hu Y, Joubeh S, et al. Suprabasal Dsg2 expression in transgenic mouse skin confers a hyper-proliferative and apoptosis-resistant phenotype to keratinocytes. J Cell Sci 2007;120:758–71. [DOI] [PubMed] [Google Scholar]
- 44.Rath GM, Schneider C, Dedieu S, et al. The C-terminal CD47/IAP-binding domain of thrombospondin-1 prevents camptothecin and doxorubicin-induced apoptosis in human thyroid carcinoma cells. Biochim Biophys Acta 2006;1763:1125–34. [DOI] [PubMed] [Google Scholar]
- 45.Cerny T, Borisch B, Introna M, Johnson P, Rose AL. Mechanism of action of rituximab. Anticancer Drugs 2002;13:S3–10. [DOI] [PubMed] [Google Scholar]
- 46.Mahadevan D, Cooke L, Riley C, et al. A novel tyrosine kinase switch is a mechanism of imatinib resistance in gastrointestinal stromal tumors. Oncogene 2007;26:3909–19. [DOI] [PubMed] [Google Scholar]
- 47.Bean J, Brennan C, Shih JY, et al. MET amplification occurs with or without T790M mutations in EGFR mutant lung tumors with acquired resistance to gefitinib or erlotinib. Proc Natl Acad Sci U S A 2007; 104:20932–7. [DOI] [PMC free article] [PubMed] [Google Scholar]
- 48.Camirand A, Zakikhani M, Young F, Pollak M. Inhibition of insulin-like growth factor-1 receptor signaling enhances growth-inhibitory and proapoptotic effects of gefitinib (Iressa) in human breast cancer cells. Breast Cancer Res 2005;7:R570–9. [DOI] [PMC free article] [PubMed] [Google Scholar]
- 49.Steinbach JP, Eisenmann C, Klumpp A, Weller M. Co-inhibition of epidermal growth factor receptor and type 1 insulin-like growth factor receptor synergistically sensitizes human malignant glioma cells to CD95L-induced apoptosis. Biochem Biophys Res Commun 2004;321:524–30. [DOI] [PubMed] [Google Scholar]
- 50.Gooch JL, Van Den Berg CL, Yee D. Insulin-like growth factor (IGF)-I rescues breast cancer cells from chemotherapy-induced cell death-proliferative and anti apoptotic effects. Breast Cancer Res Treat 1999;56:1–10. [DOI] [PubMed] [Google Scholar]
Associated Data
This section collects any data citations, data availability statements, or supplementary materials included in this article.