
Figure 4. Physiological experiments: iGluSnFR expression slows uptake by cortical astrocytes.
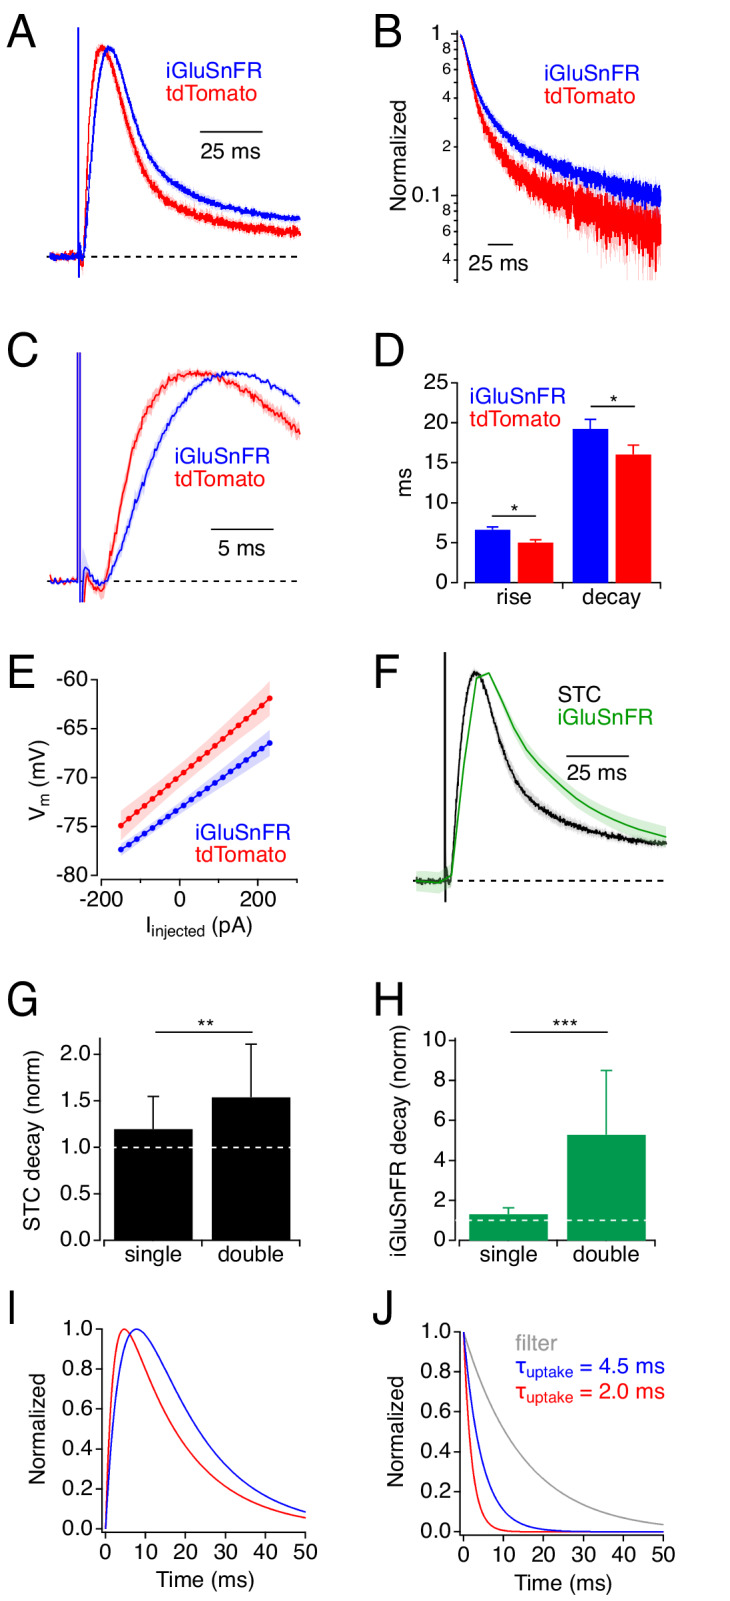
(A) Synaptic transporter currents (STCs) recorded in cortical astrocytes expressing either iGluSnFR (blue) or tdTomato (red). Traces indicate average responses (mean ± SEM; iGluSnFR: n = 21 cells; tdTomato: n = 15 cells), normalized in amplitude. (B) Responses in A, plotted on a semi-log scale. (C) Rising phases (± SEM) of the responses in A, plotted on an expanded time scale. (D) Summary data showing that STC rise and decay were slower in iGluSnFR+ astrocytes. * indicates p<0.05. (E) Astrocyte Vm (mean ± SEM), as a function of injected current, shows that iGluSnFR+ astrocytes rested at slightly more hyperpolarized potentials compared to tdTomato+ astrocytes. Input resistances (indicated by the slope of the relation) were not different in the two groups, although intercell variability diminished the statistical power of this comparison (power = 0.8 would require n = 250). (F) STCs and iGluSnFR signals measured in the same experiments (mean ± SEM, n = 10 cells). (G) Expressing iGluSnFR in both neurons and glia (‘double’) slowed STCs to a greater extent than when iGluSnFR was expressed in astrocytes only (‘single’). Asterisks indicate p=0.007 (Wilcoxon Rank test between single (n = 15) and double (n = 13)). Decay time constants normalized to average STC decay in control. (H) As in G, but showing the decays of iGluSnFR signals. Asterisks indicate p=0.0003 (Wilcoxon Rank test between single (n = 10) and double (n = 5)). (I) Simulated STC waveforms corresponding to average responses in iGluSnFR+ (blue) and tdTomato+ (red) astrocytes from panel A. (J) Waveforms used to derive STCs in I. In each case a clearance time course (red or blue) was convolved with a filter waveform (gray). This simple example demonstrates how even subtle differences in STC time course can reflect substantial differences in glutamate clearance time course (Diamond, 2005).