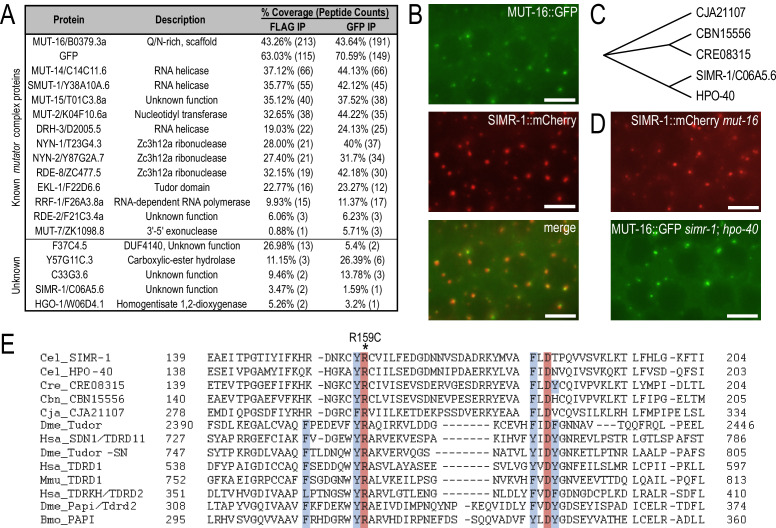
Figure 1. SIMR-1 is a perinuclear-localized Tudor domain protein.
(A) Proteins identified by IP-mass spec of MUT-16::GFP::3xFLAG but not wild-type animals. The percent coverage and total number of peptides captured are indicated for each MUT-16-associated protein. See Supplementary file 2 for complete list of immunoprecipitated proteins. (B) Live imaging of SIMR-1::mCherry demonstrate that it is adjacent to or colocalizes with MUT-16::GFP foci. Scale bars, 5 μm. (C) Cladogram representing the relationship between SIMR-1 and related proteins CJA21107 (C. japonica), CBN15556 (C. brenneri), CRE08315 (C. remanei), and HPO-40 (C. elegans). The protein alignment was generated using Clustal Omega and cladogram was made in Evolview V3. (D) Live imaging of SIMR-1::mCherry in a mut-16 mutant and MUT-16::GFP in a simr-1; hpo-40 double mutant indicate that mut-16 is not required for SIMR-1 foci formation, nor are simr-1 and hpo-40 required for Mutator foci formation. Scale bars, 5 μm. (E) Alignment of Tudor domain region generated by Clustal Omega of SIMR-1, HPO-40, their related nematode orthologs, and the eight most significant hits from HHpred server (see Methods). The four aromatic residues that constitute the aromatic cage are highlighted in blue and the absolutely conserved arginine and aspartate residues characteristic of extended Tudor domains are highlighted in red. The location of the simr-1[R159C] mutation is marked with an asterisk. Cel - C. elegans, Cre – C. remanei, Cbn – C. brenneri, Cja – C. japonica, Dme – D. melanogaster, Hsa – H. sapiens, Mmu – M. musculus, and Bmo – B. mori.


