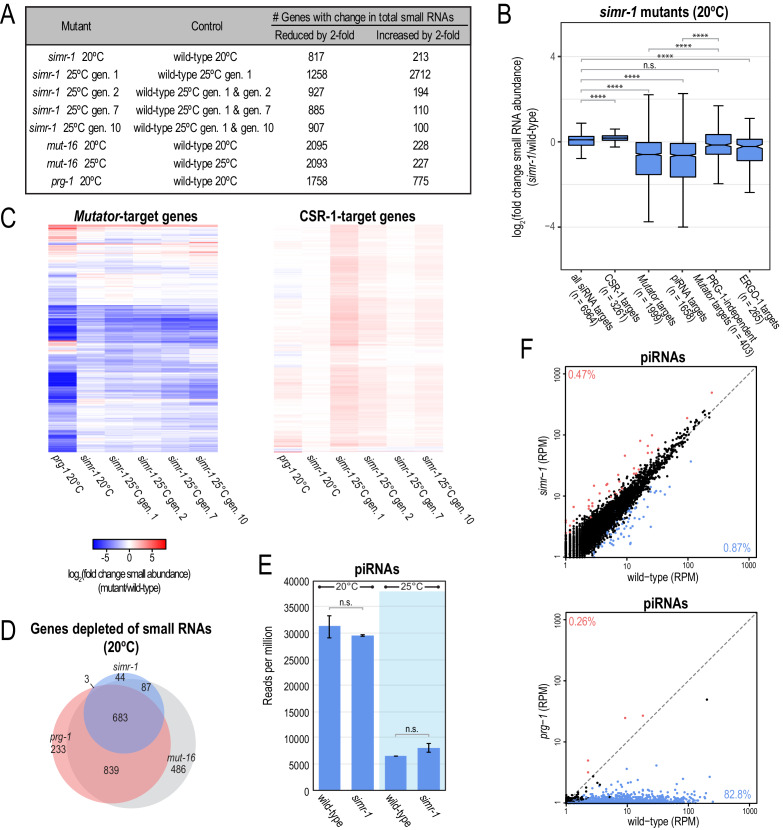
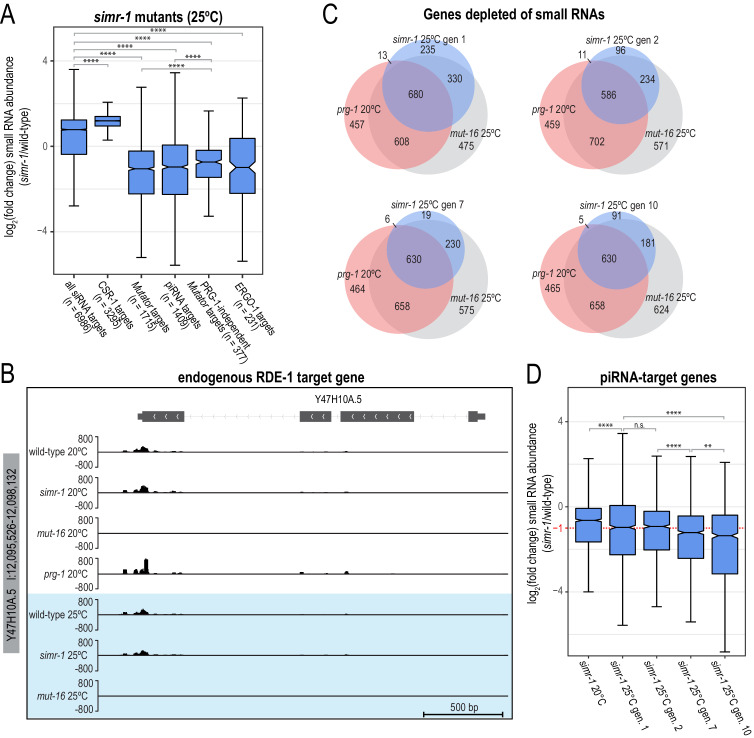
Figure 5. simr-1 mutants display reduced small RNAs mapping to mutator and piRNA-target genes.
(A) Table indicating the number of genes for which the total small RNA levels are either increased or reduced by at least two-fold for each indicated mutant. All genes also met the requirements of having at least 10 RPM in either mutant or control and a DESeq2 adjusted p-value of ≤0.05. (B) Box plots displaying total small RNAs levels mapping to genes from the indicated small RNA pathways in simr-1 mutants compared to wild-type animals raised at 20°C. Details regarding definition of small RNA target gene classes is provided in the Materials and Methods section. At least 10 RPM in wild-type or simr-1 mutant libraries was required to be included in the analysis. (C) Heat maps displaying total small RNAs levels targeting mutator-target genes or CSR-1-target genes in simr-1 mutants raised at 20°C, a single generation at 25°C, or two, seven, or 10 generations at 25°C relative to wild-type at the same temperature and generation. (D) Venn diagrams indicating overlap of genes depleted of total small RNAs by two-fold or more in mutants compared to wild-type. (E) Reads per total million reads mapping to piRNA and piRNA-target gene loci in wild-type and simr-1 mutants raised at either 20°C, or for a single generation at 25°C, indicate that piRNAs are not reduced in simr-1 mutants. Error bars indicate standard deviation of two replicate libraries. (F) Scatter plots display piRNA reads per million total reads in wild-type and simr-1 mutants (top) and wild-type and prg-1 mutants (bottom). Genes with two-fold increase in piRNA abundance and DESeq2 adjusted p-value≤0.05 are colored dark red and genes with two-fold reduction in piRNA abundance and DESeq2 adjusted p-value≤0.05 are colored light blue. The percentage of total piRNAs with an increase or reduction of greater than two-fold is indicated in the corners of the graph. n.s. denotes not significant and indicates a p-value>0.05 and **** indicates a p-value≤0.0001. See Supplementary file 8 for more details regarding statistical analysis.


