Abstract
Within germinal centers (GCs), complex and highly orchestrated molecular programs must balance proliferation, somatic hypermutation (SHM) and selection to both provide effective humoral immunity and to protect against genomic instability and neoplastic transformation. In contrast to this complexity, GC B cells are canonically divided into two principal populations, dark zone (DZ) and light zone (LZ) cells. We now demonstrate that following selection in the LZ, B cells migrated to specialized sites within the canonical DZ that contained tingible body macrophages (TBMs) and were sites of ongoing cell division. Proliferating DZ (DZp) cells then transited into the larger DZ to become differentiating DZ (DZd) cells before re-entering the LZ. Multidimensional analysis revealed distinct molecular programs in each population commensurate with observed compartmentization of non-compatable functions. These data provide a new three-cell population model that both orders critical GC functions and reveals essential molecular programs of humoral adaptive immunity.
INTRODUCTION
Adaptive humoral immunity evolves in germinal centers (GCs), which contain environments and structures that both select for B cells expressing high-affinity antibodies and ensure immunological memory1. Canonically, the fully formed GC is divided into dark zone (DZ) and light zone (LZ) compartments2. The DZ contains CXCR4+ proliferating B cells undergoing somatic hypermutation (SHM)3. The LZ contains more sparse populations of CD83+ B cells that capture antigen from follicular dendritic cells (FDCs) and receive help from cognate T follicular helper (TFH) cells4. B cells in the LZ are selected based on their competency to present antigen to TFH cells5, 6 more so than B cell antigen receptor (BCR) signal strength7. Strong T cell selection primes for proliferation8, 9 and re-entry into the DZ for further rounds of SHM and cell division10. Therefore, while selection has been ascribed to the LZ, both proliferation and SHM transpire in the DZ.
A wealth of data indicate that transcription factors (TFs) determine GC B cell (GCBC) fate decisions1. Most notable is the transcriptional repressor BCL6, which both initiates and maintains GCBC development 1, 11. BCL6 also inhibits plasma cell (PC) differentiation by repressing Prdm1 (BLIMP-1)12. Upstream of Bcl6, IRF4 expression is proportional to BCR affinity thereby enabling it to play a rheostatic role in controlling GC function and affinity maturation1, 13. MYC also plays a central role as it is induced in positively selected LZ B cells where it initiates metabolic and proliferative programs necessary for proliferation in the DZ8, 9. Multiple other TFs, including PU.1, IRF8, CTCF, PAX5, E2A, BACH2, EBF1, FOXO1, YY1, SPIB, and ABF-1 play critical roles in GC function1, 11, 14, 15, 16, 17. Furthermore, epigenetic mechanisms are also important in GC repsonses as deletion of the epigenetic writer EZH2 arrests GCBC proliferation and induces PC differentiation18, 19. Therefore, copious genetic evidence indicate that the regulation of transcription plays major and multiple roles in GC initiation, maintenance, function and subsequent cell fate decisions.
In contrast, comparison of GC DZ (CXCR4hiCD83lo) and LZ (CXCR4loCD83hi) B cells has revealed relatively few transcriptional differences5, 20. It is possible that modest transcriptional differences in DZ and LZ B cells result in large functional differences and/or post-transcriptional mechanisms play a central role within the GC. Alternatively, division of the GC into DZ and LZ B cell populations might not allow capture of underlying genetic programs. Indeed, the GC was originally divided into the DZ and LZ based on histological appearance and not features of molecular identity4, 21.
Herein, we report that the DZ contains two distinct B cell populations that differ both in function and location within the canonical DZ area. Separating GCBCs into three populations revealed unique molecular programs obscured when canonical GC DZ and LZ cells were compared. These, and other observations, provide for a new model that segregates fundamental and opposing molecular GC functions into discrete cell states.
RESULTS
Different transcriptional programs in LZ, DZ, and GZ B cells
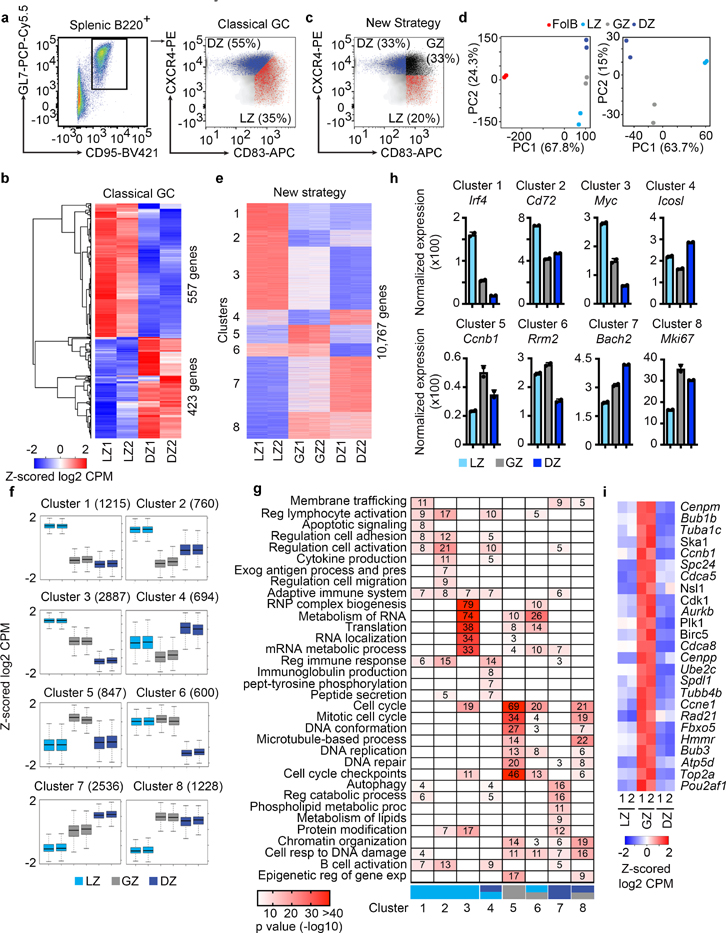
We first flow-sorted canonical DZ (B220+GL7+CD95+CXCR4+CD83lo) and LZ (B220+GL7+CD95+CXCR4loCD83+) cells from immunized mice using the classical GCBC flow cytometry gating strategy and subjected them to RNA-Sequencing (RNA-Seq)(Fig. 1a, Extended Data Fig. 1a,b, Supplementary Data 1). These studies revealed 980 differentially regulated genes (q<0.01)(Fig. 1b). In contrast, interrogation of Immgen low-input RNA-Seq data20, indicated that only 137 genes were differentially regulated between the canonical DZ and LZ (q<0.01, Supplementary Table 1). Overall, these data suggest relatively few transcriptional differences between the canonical LZ and DZ.
Figure 1. Transcriptional differences between the LZ, GZ, and DZ.
a, Flow cytometric gating strategy for the isolation of B220+ GCBCs. Classical GC strategy to distinguish LZ and DZ B cells by CXCR4 and CD83. b, RNA-Seq heatmap displaying differentially regulated genes between the LZ and DZ (isolated by Classical GC strategy) (q<0.01). q values were generated with edgeR (see methods). c, Flow cytometry plot displaying the New Strategy to isolate LZ, DZ, and GZ B cells. d, PCA of mRNA expression in FoB, LZ, GZ and DZ B cells (isolated by New Strategy) Each dot corresponds to an independent biological sample. e, RNA-Seq heatmap displaying differences between GCBC subsets (as isolated in panel (c), q<0.05) as determined by unsupervised K-means clustering analysis. Log2 CPM color scale same as in (b). f, Box plots displaying differential transcription trends between GCBC subsets. Boxes represent interquartile ranges (IQRs; Q1–Q3 percentile) and black vertical lines represent median values. Maximum and minimum values (ends of whiskers) are defined as Q3 + 1.5× the IQR and Q1 − 1.5× the IQR, respectively. g, Pathway analysis heatmap of enriched pathways for each transcriptional cluster. Each cluster is associated with the indicated GCBC subset(s), LZ-light blue, GZ-gray, and DZ-dark blue. Numbers and color intensity correspond to enrichment (-log10 P value). For each cluster, n= the number of genes indicated in panel (f). P values were generated by Metascape using an established hypergeometric test coupled with Benjamini-Hochberg p-value correction algorithm. h, Bar graphs displaying representative genes for the indicated mRNA cluster. i, RNA-Seq heatmap displaying genes upregulated by GZ cells. For RNA-Seq, n=2 per cell type. Each n represents cells pooled from 20 mice. See also Extended Data Fig. 1, Supplementary Data 1, and Supplementary Data 2.
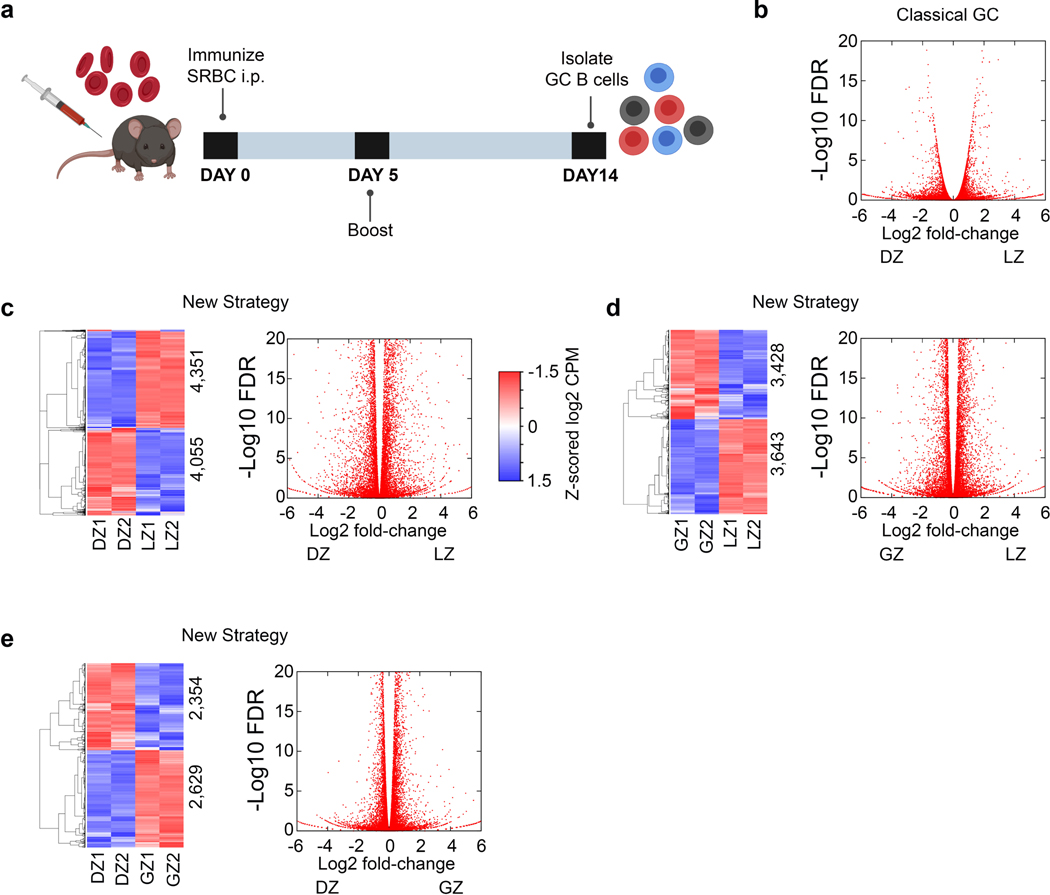
As expression of CXCR4 and CD83 are continuous, dividing the DZ and LZ by splitting the CXCR4hi and CD83hi populations might obscure important transcriptional differences. Therefore, we devised a new gating strategy in which DZ cells were defined as CXCR4+CD83–, LZ cells as CXCR4–CD83+ and a new gate, the Gray Zone (GZ) as CXCR4+CD83+ (Fig. 1c). RNA-Seq of flow-sorted populations revealed that the LZ, GZ, and DZ B cells were transcriptionally distinct from follicular B cells (FoB) (Fig. 1d). Furthermore, LZ and DZ B cells were separate from each other and from GZ cells. There were 8,406 (q≤0.01) differentially expressed genes between the new DZ and LZ populations (Extended Data Fig. 1c). Therefore, this new gating strategy revealed many more differences between GCBC subsets.
Interestingly, there were eight clusters of differentially expressed genes (Fig. 1e, Extended Data Fig. 1d,e, Supplementary Data 2). Of note was cluster 4, which contained GZ genes with lower expression than those in either DZ or LZ, and cluster 5 in which the converse was true (Fig. 1f). These data suggest that GZ B cells contain one or more cell populations with unique transcriptional programs.
The mRNA clusters 1–3 had highest expression in the LZ and were enriched for pathways including lymphocyte activation, apoptotic signaling, and antigen processing/presentation (Fig. 1g). Examples of genes in these clusters include Irf4, Cd72 and Myc (Fig. 1h). mRNA cluster 7 represented DZ B cell genes, such as Bach2, and included enrichment for autophagy and regulation of catabolic processes. Genes in cluster 4 included Icosl and were associated with positive regulation of the immune response and immunoglobulin production. Cluster 5, which contained genes most highly expressed in GZ B cells, was broadly enriched for cell cycle genes such as Ccnb1 (Fig. 1i). These marked transcriptional differences suggest distinct functions for the LZ, DZ and GZ GC subsets.
Dynamic genome accessibility across GCBC subsets
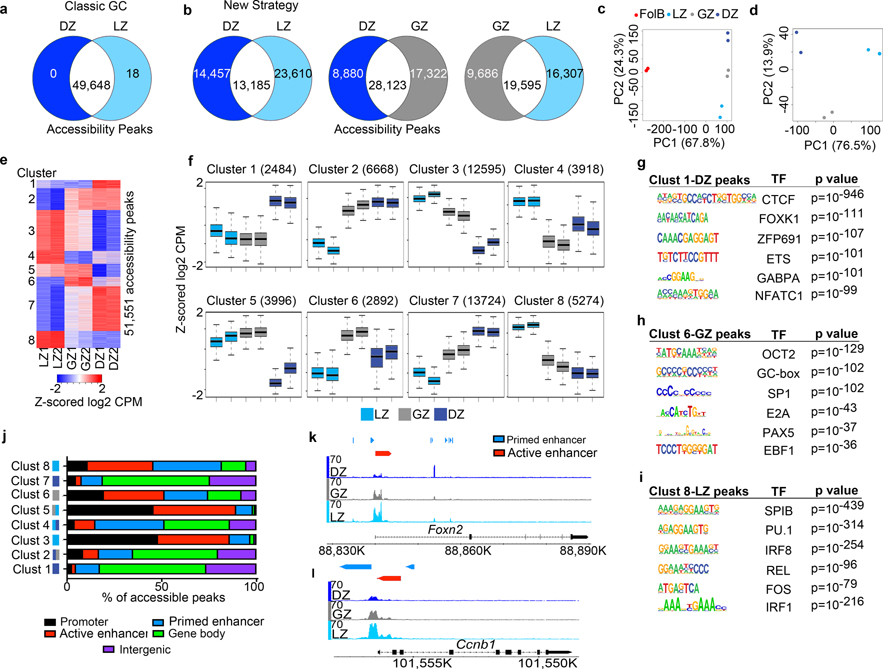
We examined how genome accessibility varied between GC subsets using Assay for Transposase-Accessible Chromatin with sequencing (ATAC-Seq). Comparing canonical LZ and DZ cells, we found only 18 differentially regulated accessibility peaks (q<0.05, Fig. 2a, Supplementary Data 3). When we examined relevant Immgen datasets20, there were only 1243 differentially regulated accessibility peaks in the DZ and LZ (q<0.05)(Supplementary Table 2). These data suggest that there are relatively small differences in accessibility between canonical GC populations.
Figure 2. LZ, DZ, and GZ B cells have unique genome accessibility profiles.
a, Venn diagram comparing differentially regulated genome accessibility (ATAC-Seq) peaks between DZ and LZ B cells isolated by using Classical GC gating. q values were generated with edgeR (see methods). b, Head-to-head comparison of genome accessibility peaks among LZ, GZ, and DZ B cells isolated by the New Strategy. For (a, b), the number of common and differentially regulated accessibility peaks were determined by q<0.05 and log2 CPM>2. c and d, PCA plots displaying accessibility for indicated cell types. Each dot corresponds to an independent biological sample. e, ATAC-Seq heatmap of differentially regulated genome accessibility peaks among GCBC subsets isolated by the New Strategy. Clusters were generated by unsupervised K-means clustering. f, Box plots of differential genome accessibility at the indicated cluster of accessibility peaks. Boxes represent interquartile ranges (IQRs; Q1–Q3 percentile) and black vertical lines represent median values. Maximum and minimum values (ends of whiskers) are defined as Q3 + 1.5× the IQR and Q1 − 1.5× the IQR, respectively. g-i, TF motifs enriched in accessible regions for the indicated genome accessibility cluster and associated GCBC subset as seen for Cluster 1-DZ peaks (g), Cluster 6-GZ peaks (h), and Cluster 8-LZ peaks (i) p values were generated using Hypergeometric Optimization of Motif EnRichment (HOMER) (see methods). For each cluster, n= the number of accessibility peaks indicated in panel (f). j, Plot displaying the proportion of peaks in the indicated clusters that annotate to promoter, primed enhancer, active enhancer, gene body, and intergenic regions of the genome. Increased expression in each cluster is associated with one or more GCBC subsets, LZ-light blue, GZ-gray, and DZ-dark blue. k and l, Genome accessibility and enhancer tracks aligned at the Foxn2 (k) and Ccnb1 (l) loci for GCBCs isolated by the New Strategy. (a-l)For ATAC-Seq data, n=2 per cell type. Each n represents cells pooled from 20 mice. See also Extended Data Fig. 2 and Supplementary Data 3.
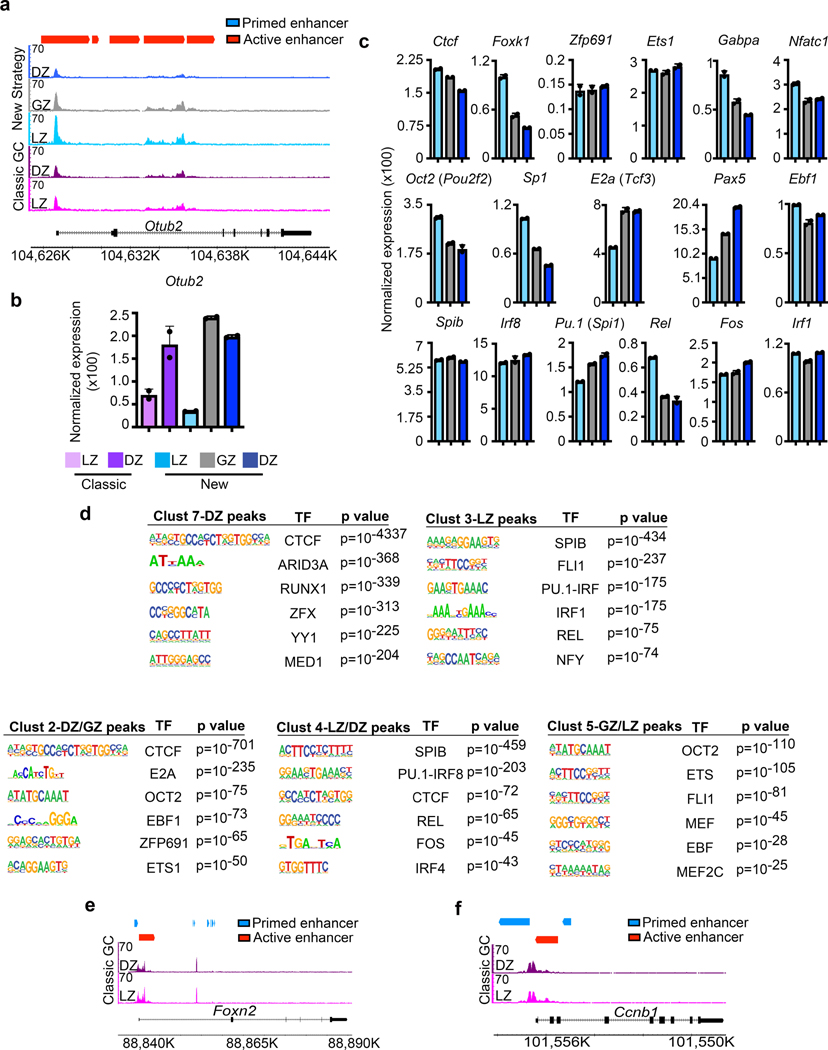
In contrast, analysis of GC cells sorted into three populations revealed large differences in LZ and DZ B cell genome accessibility (Fig. 2b, Supplementary Data 3, Supplementary Table 2), with enhanced accessibility at 23,610 unique sites in LZ B cells and 14,457 sites in DZ B cells. We also observed substantial differences between GZ B cells compared to LZ or DZ B cells. Examining specific genes such as Otub2 (Extended Data Fig. 2a,b) revealed significant differences in both accessibility and transcription obscured when just considering the canonical DZ and LZ.
PCA of ATAC-Seq data revealed that GCBC subsets were very distinct from FoB cells and from one another (Fig. 2c,d). To understand these differences, we clustered accessibility sites across the LZ, GZ, and DZ subsets. As with our transcriptional analysis, we observed eight distinct accessibility site clusters (Fig. 2e,f). Most notable were clusters 4 and 6, which reveal differential accessibility specific to GZ B cells.
We next examined differential accessibility of binding motifs for GC expressed TFs across the three GCBC subsets (Fig. 2g, Extended Data Fig. 2c). In DZ-specific cluster 1, binding motifs for CTCF, FOXK1, and ZFP691were most enriched. DZ peaks in cluster 7 were enriched for CTCF binding motifs as well for YY1 and MED1 (Extended Data Fig. 2d). GZ cluster 6 displayed enrichment for OCT2, SP1, E2A, and EBF1 binding motifs (Fig. 2h). LZ cluster 8 peaks were enriched for SPIB, PU.1, and IRF8 binding motifs (Fig. 2i). Similar motifs were also found in LZ cluster 3 peaks. These data suggest that each GC subset has a unique epigenetic landscape conducive to the binding of different expressed TFs.
Several accessibility clusters were ascribed to more than one GCBC subset (cluster 2 – DZ/GZ, cluster 4 - LZ/DZ, and cluster 5 – GZ/LZ). These clusters were enriched for both unique TF binding motifs and motifs found in other clusters (Extended Data Fig. 2d). For example, cluster 4 was enriched for both SPIB and CTCF binding motifs which are characteristic of the LZ and DZ, respectively. These observations could reflect common epigenetic programs across subsets or programs that occur during transition between GC subsets.
We next performed ChIP-Tagmentation sequencing (ChIPTag-Seq) on GCBCs for H3K4me1 and H3K27Ac. Accessibility peaks were then assigned to specific gene elements (see methods). For the DZ clusters (1, 7), accessibility was enriched at gene bodies (Fig. 2j). Interestingly, GZ (cluster 6) and LZ (clusters 3, 8) specific accessibility sites were preferentially located in promoters, active enhancers, and primed enhancers. Shared LZ/GZ accessibility sites (cluster 5) were enriched at promoters and active enhancers. Specific examples revealed clear accessibility differences at regulatory regions across the three GC populations (Fig. 2k,l). However, these differences were obscured when GCBCs were sorted into two populations (Extended Data Fig. 2e,f). These data indicate across the three GC subsets, there are profound qualitative differences in genome accessibility at potentially important gene regulatory regions.
The proteome and phosphoproteome of GCBC subsets
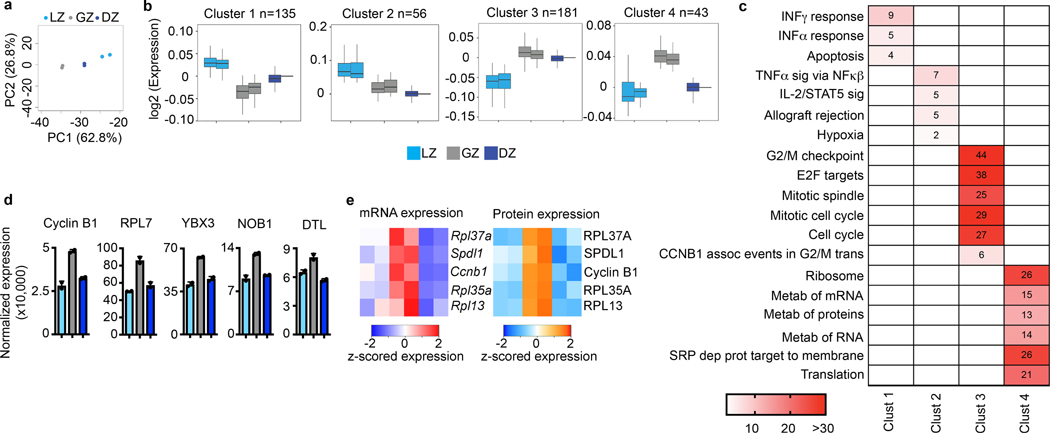
Assessment of the proteome and phosphoproteome of each GCBC subset by mass spectrometry revealed that each was unique (Fig. 3a). Of 8,000 identified proteins, 415 were differentially expressed (FDR<0.1, FC >0.5) across LZ, GZ, and DZ B cells. By weighted gene co-expression network analysis (WGCNA), we observed four groups of differentially expressed proteins (Fig. 3b, Supplementary Data 4). Notably, there was a cluster containing proteins more prevalent in GZ B cells than other GC subpopulations (cluster 4). Pathway analysis (Fig. 3c) revealed that LZ clusters 1 and 2 were enriched for proteins associated with interferon responses, apoptosis, and TNF signaling. GZ cells were enriched for proteins involved in metabolism (cluster 4) while GZ/DZ cluster 3 was enriched for cell cycle related proteins. Proteins that were most prevalent in GZ B cells included Cyclin B1, RPL7, and DTL (Fig. 3d). For some GZ enriched proteins, such as Cyclin B1, the encoding mRNA was also most abundant in these cells (Fig. 3e).
Figure 3. Proteomic analysis of GCBC subsets.
a, Total proteome PCA plot of the indicated cell populations. Each dot corresponds to an independent biological sample. b, Box plots of proteomic clustering analysis. Boxes represent interquartile ranges (IQRs; Q1–Q3 percentile) and black vertical lines represent median values. Maximum and minimum values (ends of whiskers) are defined as Q3 + 1.5× the IQR and Q1 − 1.5× the IQR, respectively. c, Pathway analysis for the indicated protein clusters. Numbers and color correspond to -log10 p value. For each cluster, n= the number of proteins indicated in panel (c). P values were generated by Metascape using an established hypergeometric test coupled with Benjamini-Hochberg p-value correction algorithm. d, Normalized protein expression for example proteins upregulated in the GZ. e, Heatmaps of gene expression (left) and protein expression (right) for the indicated genes/proteins upregulated in GZ B cells. For total proteome data, n=2 per cell type. Cells were isolated from a total of 120 mice. Each n was generated from 5–6 million purified B cell subsets. See also Extended Data Fig. 3 and Supplementary Data 4.
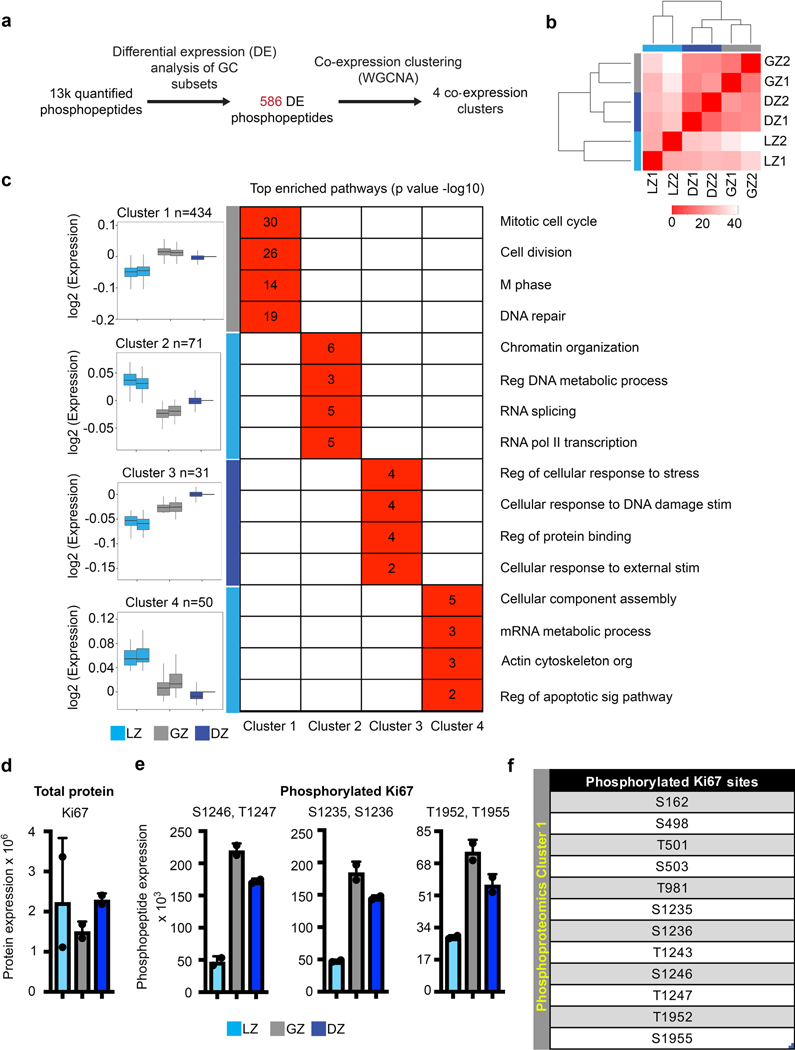
Phosphoprotein profiling of GCBC subsets identified 13,000 phosphopeptides with 586 of these being differentially expressed (FDR<0.1, |log2|>0.5 fold)(Extended Data Fig. 3a). By plotting cell population relatedness (Extended Data Fig. 3b), we found the LZ, GZ, and DZ cells cluster differently with the GZ and DZ being more closely related than the LZ. WGCNA clustering of phosphopeptides revealed 4 clusters that resolved the LZ, GZ, and DZ (Extended Data Fig. 3c, Supplementary Data 5). Phosphoproteome cluster 1 contained 434 phosphopeptides that were relatively increased in the GZ. Consistent with mRNA and proteome data, the GZ cluster 1 pathways were enriched for proteins in cell cycle-related pathways (Extended Data Fig. 3c). LZ clusters 2 and 4 were enriched for proteins involved in RNA metabolic processes, transcription, and apoptotic signaling. Interestingly, DZ cluster 3 included regulation of cellular response to stress and DNA damage.
One difference captured by our phosphoproteome dataset was Ki67 phosphorylation. Ki67 protein abundance did not differ between GCBC subsets (Extended Data Fig. 3d). However, 12 different Ki67 phosphorylated peptides were enriched in the GZ (Extended Data Fig. 3e, f). In toto, these data suggest proliferation occurs within the GZ22.
The GZ resides in the dark zone
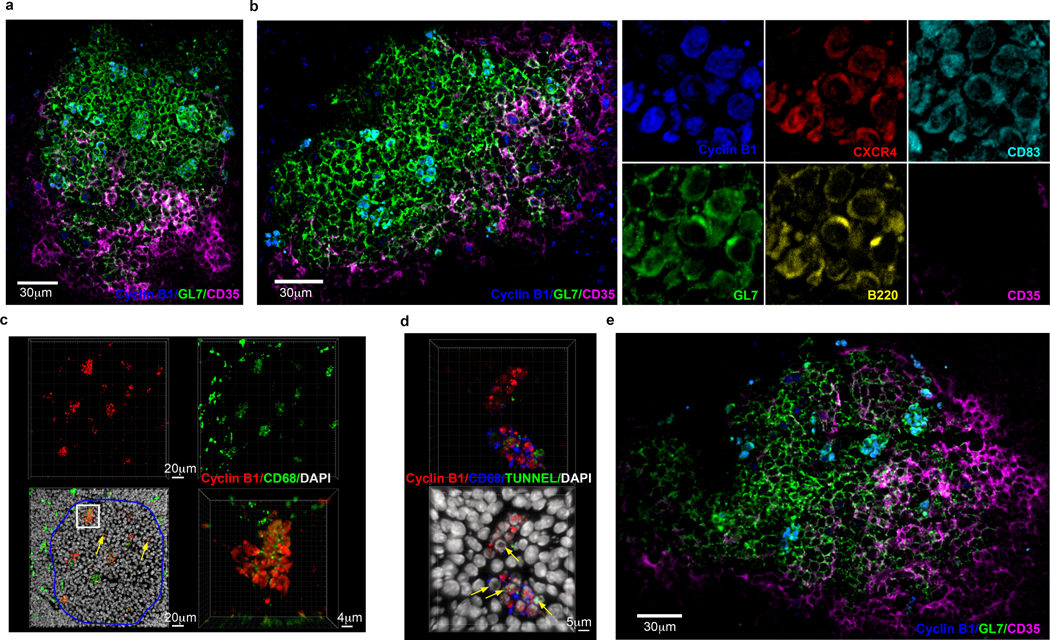
Histologically, the GC is separated into two zones, DZ and LZ21. The above studies suggested that Cyclin B1, in addition to GL7, CXCR4 and CD83, might serve as markers to identify GZ B cells within the GC. We performed multicolor confocal microscopy on spleens from immunized mice examining the position of Cyclin B1+GL7+CXCR4+CD83+ B cells. Remarkably, Cyclin B1+ GZ B cells localized to discrete clusters within the GC (Fig. 4a, b left panel, Extended Data Fig. 4a, b). GZ clusters appeared primarily in the GL7+CD35– DZ4 and at the border of the DZ and GL7+CD35+ LZ. To a lesser extent, regions containing one to two Cyclin B1+ B cells in isolation were observed. Cyclin B1+GL7+CXCR4+CD83+ B cells were six times more likely to be in the DZ than LZ (data not shown). Higher-power fields confirmed the discrete nature of the GZ Cyclin B1+CXCR4+CD83+GL7+B220+CD35– clusters (Fig. 4b right panel). These data indicate that GZ B cells form defined clusters both within the classical DZ and at the DZ/LZ border.
Figure 4. Histological identification of GZ B cells within GCs.
a and b, Immunofluorescent microscopy of splenic GCs 14 days post SRBC immunization stained with antibodies to GL7 (green), CD35 (magenta) and Cyclin B1 (blue) (n>7 mice). Examination of GZ B cells using individual indicated markers (b-right). c, Immunofluorescent microscopy 3-dimensional (3D) z-stacks displaying splenic GCs stained with antibodies to Cyclin B1 (red), CD68 (green), and DAPI (white). GC circled in blue. Isolated Cyclin B1 positive cells not in clusters (yellow arrows). (n=3 mice) d, Immunofluorescent microscopy 3D z-stacks of splenic GCs (10 microns thick) stained with antibodies to Cyclin B1 (red), CD68 (blue), TUNNEL (green), and DAPI (white). Yellow arrows indicate apoptotic cells. (n=3 mice) e, Immunofluorescence microscopy of splenic GC in response to influenza infection stained with antibodies to GL7 (green), CD35 (magenta) and Cyclin B1 (blue) (n=4). See also Extended Data Fig. 4.
The distribution of GZ clusters within the DZ was reminiscent of the distribution of tingible body macrophages (TBMs)4. Indeed, staining for TBMs with CD68 specific antibodies revealed that most localized to Cyclin B1+ B cell clusters (Fig. 4c). The intracellular distribution of CD68 within these clusters was consistent with its localization in endosomes and lysosomes23. These data suggest TBMs are intimately associated with GZ clusters.
B cells failing LZ selection display phosphatidylserine on their surfaces which marks them for clearance by TBMs24. Indeed, TUNNEL staining of CyclinB1+ B cell clusters associated with CD68+ TBMs revealed that both nonapoptotic and apoptotic B cells were present (Fig. 4d). TUNNEL+ apoptotic cells displayed pyknotic nuclei, while the nuclei of TUNNEL–Cyclin B1+ cells appeared normal. These data suggest that the GZ compartment contains some B cells that failed LZ selection and are fated for phagocytosis by TBMs.
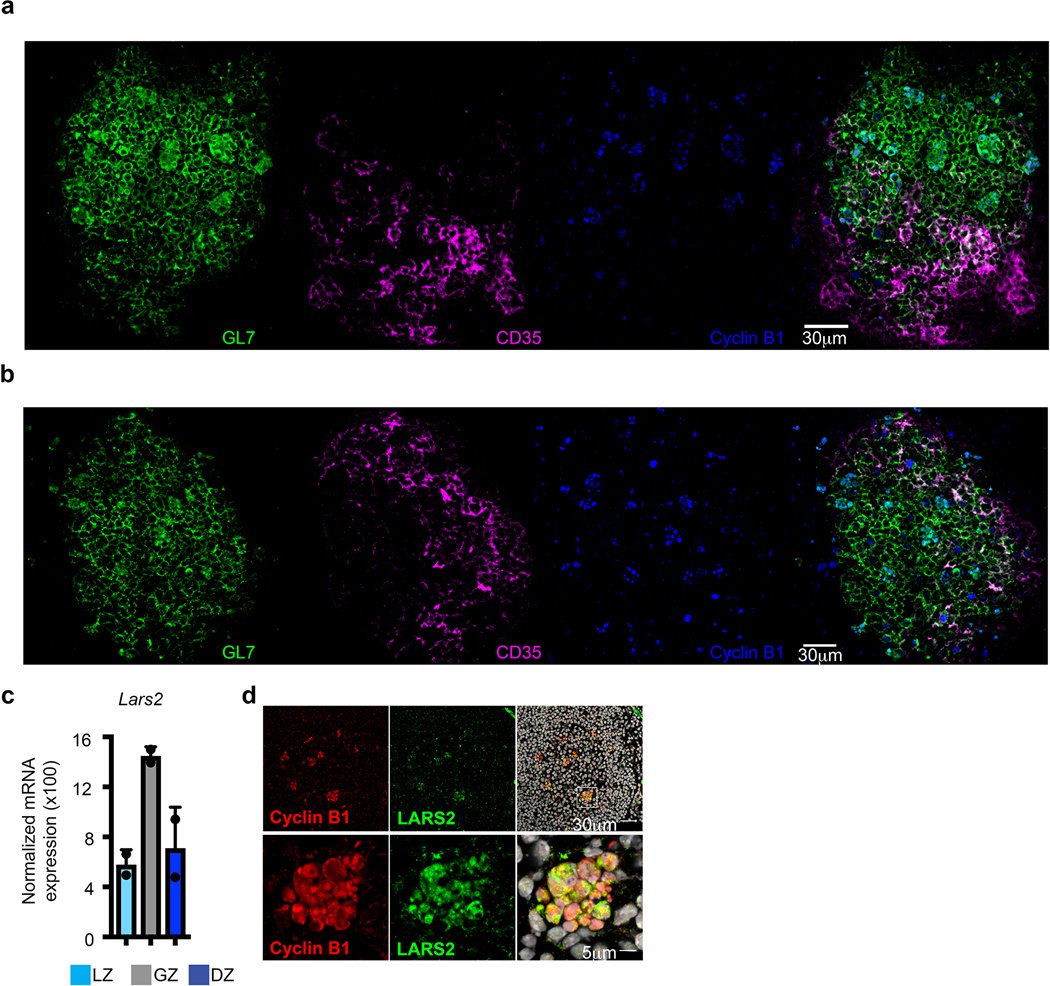
To determine if GZ clusters were a common feature of GCs, we analyzed the spleens of influenza virus infected mice. Consistent with immunized mice, GZ B cells formed clusters in the DZ and at the DZ/LZ border (Fig. 4e). In addition to the above markers, mRNA encoding the tRNA synthase LARS2 was upregulated in GZ B cells (Supplemental Fig. 4c). Indeed, LARS2 localized with Cyclin B1 in the GZ clusters (Supplemental Fig. 4d). These data suggest that GZ B cell clusters are a general feature of GC responses.
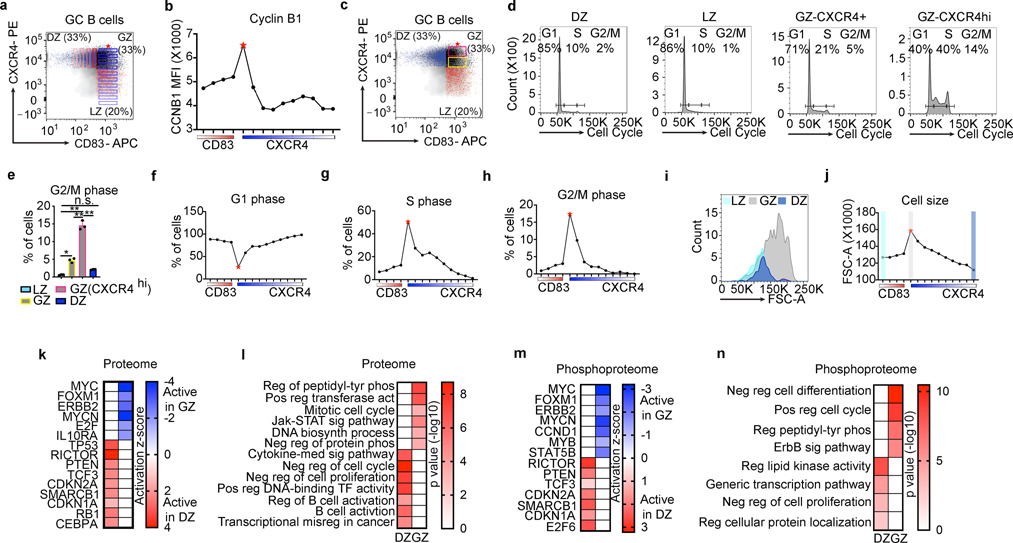
We next sought to identify Cyclin B1+ GC cells by intracellular staining and flow cytometry. For these studies, we defined a series of gates going along the GCBC plot for the CD83 axis (red gradient), and the CXCR4 axis (blue gradient) (Fig. 5a). Using these gates, we found that Cyclin B1 expression increased with both increasing CD83 and CXCR4 expression (Fig. 5b) with the highest expression of Cyclin B1 found in CXCR4hiCD83hi cells (red star).
Figure 5. GZ B cells are the major dividing population in the GC.
a, Flow cytometry plot of gating scheme to visualize Cyclin B1 across CXCR4 and CD83 protein expression gradients shown later in panel (b). GCBCs were sorted from live lymphocyte gates. b, Cyclin B1-FITC mean fluorescence intensity (MFI) for gates defined in panel (a). c, Flow cytometry plot displaying CXCR4+ GZ gate (yellow) and CXCR4hi GZ gate (pink). d, Cell cycle analysis based on DZ, GZ, and LZ populations defined in panel (c). e, Quantification of the indicated GCBC subsets in G2/M phase of the cell cycle, n=3 mice. f-h, Percentage of cells in (f) G1 phase, (g) S phase, or (h) G2/M phase along CD83 and CXCR4 gradient defined in panel (a). i, Cell size of the indicated cell populations defined by FSC-A. j, Cell size for cells in gates defined in panel (a). Color scheme within plot corresponds to populations displayed in panel (i). k and l, Ingenuity Pathway core analysis (IPA) of upstream regulators based on proteome dataset. k, Heatmap corresponding to activated proteins in the DZ vs GZ. l, Pathway analysis of “DZ active” vs “GZ active” proteins based on data in (k). n= 35 DZ, n=26 GZ proteins. m and n, IPA upstream regulator analysis based on phosphoproteome dataset. m, Heatmap corresponding to activated phosphoproteins in the DZ vs GZ. n, Pathway analysis of “DZ active” vs “GZ active” phosphoproteins based on data in (m). n= 22 DZ, n=35 GZ phosphoproteins. Data in (b, d, and f-j) are representative of ≥ 3 mice. Data in (e) were analyzed by ANOVA in combination with Tukey’s Multiple Comparisons Test. Bar graphs are displayed as the mean ± SD. * P = 0.0005, ** P < 0.0001, n.s.P = 0.125. (l,n) P values were generated by Metascape using an established hypergeometric test coupled with Benjamini-Hochberg p-value correction algorithm.
We next directly examined cell cycle progression in each GCBC subpopulation. For this analysis, we divided the GZ into CXCR4+ and CXCR4hi populations (Fig. 5c). Most of the cells in the DZ and LZ gates were in G1 (DZ-85%, LZ-86%), with 10% of the cells in S phase, and 1–2% of the cells in G2/M-phase (Fig. 5d, e). In contrast, in CXCR4+ GZ cells, 71% were in G1, 21% in S, and 5% in G2/M phase. The CXCR4hi GZ cells had the highest percentage of cells in S phase (40%) and G2/M phase (14%). The percentage of cells in G1 phase inversely correlated with Cyclin B1 expression (Fig. 5b,f), while the percentage of cells in S phase and M phase increased as CD83 and CXCR4 expression increased (Fig. 5g, h). In parallel with proliferation, cell size increased with both increasing CXCR4 and CD83 surface expression (Fig. 5i, j). These data indicate that the GZ contains the major dividing B cell population in the GC25.
We next used our proteomics data to identify molecules and signaling pathways differentially activated in GC populations. Relative expression levels of downstream targets were used to infer if an upstream regulator was in an “active” or “inhibited” state. This analysis revealed that MYC, FOXM1, ERBB2, and MYCN were active in the GZ. In contrast, TP53, PTEN, CDKN2A, CDKN1A, and RB1 were active in the DZ (Fig. 5k). Proliferation-associated pathways were upregulated in GZ B cells including mitotic cell cycle (Fig. 5l). In contrast, anti-proliferative and differentiation pathways were upregulated in DZ B cells.
Many of the same activated factors and pathways were reflected in our phosphoproteome analysis (Fig. 5m,n). In GZ B cells cell cycle pathways were activated and differentiation pathways inhibited, while in DZ B cells the converse was true. From these data, we conclude that GZ B cells are the major dividing population in the GC while differentiation occurs in the DZ.
GCBCs progress from LZ to GZ to DZ
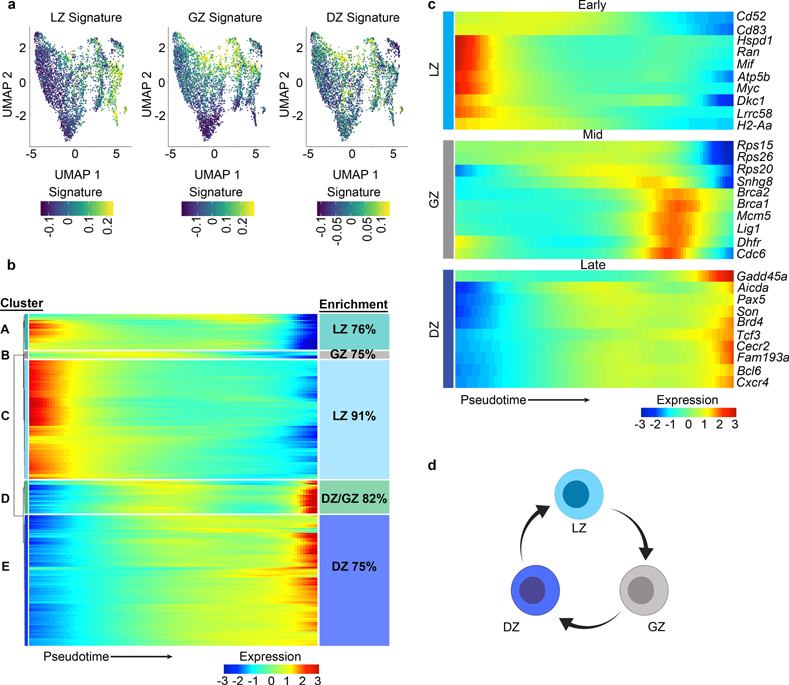
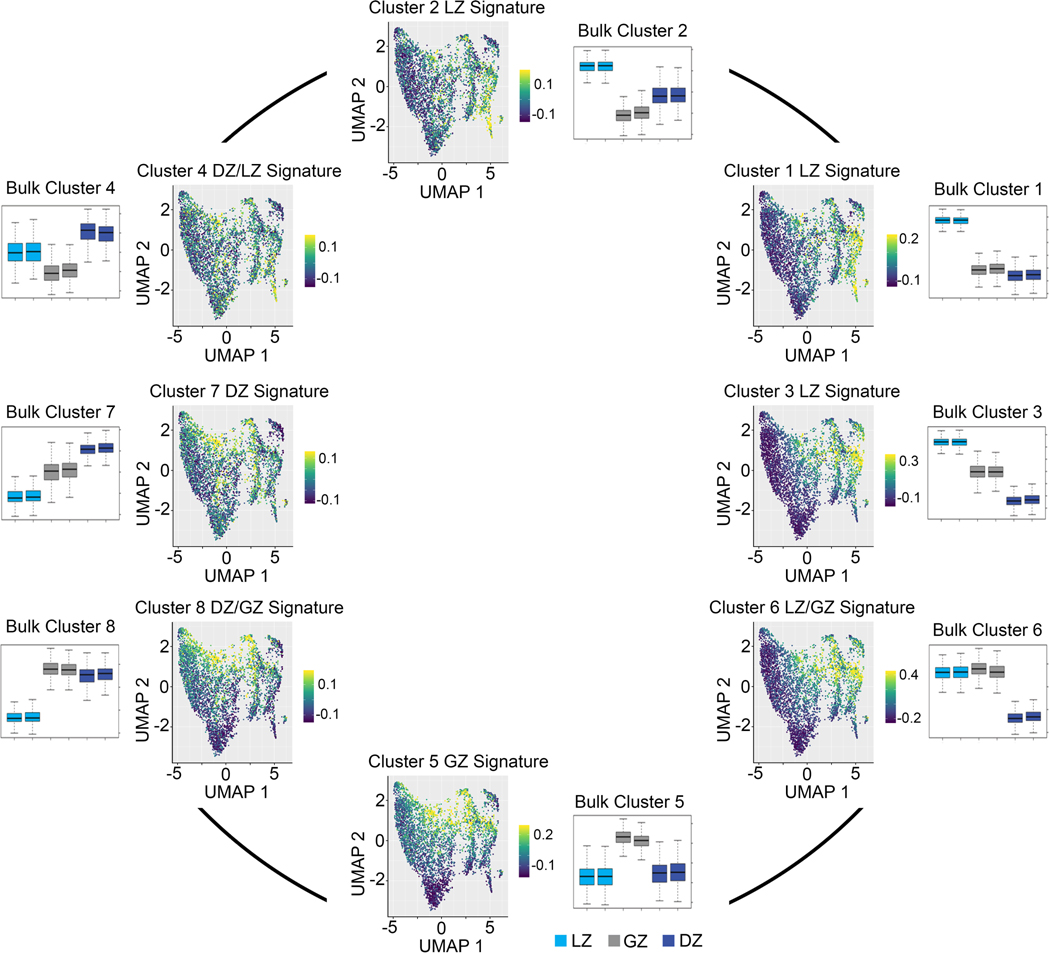
To resolve GC cell heterogeneity, we sorted GCBCs and performed single-cell (sc) RNA-Seq. By visualizing gene signatures that correspond to bulk RNA-Seq clusters, we found gene expression transitioned through general areas of the Uniform Manifold Approximation and Projection (UMAP) plot (Fig. 6a, Extended Data Fig. 5). Strong signatures for LZ and GZ B cells were found in the right and middle portions of the plot, respectively. While localization of the DZ B cell signature was not as robust, there was preferential enrichment for this signature on the bottom left of the plot.
Figure 6. GCBCs progress from LZ to GZ to DZ.
a, scRNA-Seq UMAP plots displaying enrichment for the indicated bulk RNA-Seq gene signature. Gene signatures are derived from the following bulk RNA-Seq clusters: LZ (bulk cluster 1), GZ (bulk cluster 5), and DZ (bulk cluster 7) (n=5,159 cells). b, Heatmap displaying changes in gene expression across pseudotime. Unsupervised clustering was performed to generate the indicated clusters. n=1,200 genes q<0.05. Enrichment of pseudotime clusters for LZ, GZ, or DZ B cell genes (as defined from bulk RNA-Seq data) indicated. Color scale bar represents gene expression. c, Pseudotime analysis heatmap of scRNA-Seq data displaying the indicated gene expression changes with pseudotime. Displayed genes are representative of those differentially expressed in scRNA-Seq pseudotime (q<0.05) and in bulk RNA-seq (q<0.01 and at least log2CPM>5) datasets (Supplementary Table 1). q value for scRNA-seq was determined by Likelihood ratio test using Monocle2. n=1,200 genes. Bulk RNA-seq q values were generated with edgeR (see methods). d, Schematic diagram of GCBC progression from LZ to GZ to DZ. scRNA-Seq was performed on GCBCs isolated from 20 mice pooled prior to sequencing. See also Extended Data Fig. 5.
To understand the temporal relationships between the different GC populations, we performed a pseudotime analysis (Monocle2). We identified 1200 genes differentially expressed across pseudotime (q<0.05), Unsupervised clustering of these genes revealed five clusters (A-E) that exhibited different gene expression patterns across the spectrum of early, mid, or late pseudotime (Fig. 6b). Pseudotime clusters A and C (high expression early), were enriched for genes associated with LZ B cells (76% and 91% clusters A and C respectively). In contrast, cluster E (peak expression late) was enriched for DZ genes (75%). Cluster D, (high expression mid and late) were enriched for GZ and DZ genes. Interestingly, Cluster B was highest at mid timepoints and was enriched for GZ B cell genes (75%). Visualization of highly and differentially expressed example genes from our bulk RNA-Seq analysis (q<0.01, and at least log2Counts Per Million(CPM)>5) confirmed the ordering of the LZ, GZ, and DZ in early, mid, and late pseudotime, respectively (Fig. 6c). In aggregate, our data are consistent with a model in which B cells selected in the LZ migrate to the GZ to divide before entering the DZ (Fig. 6d).
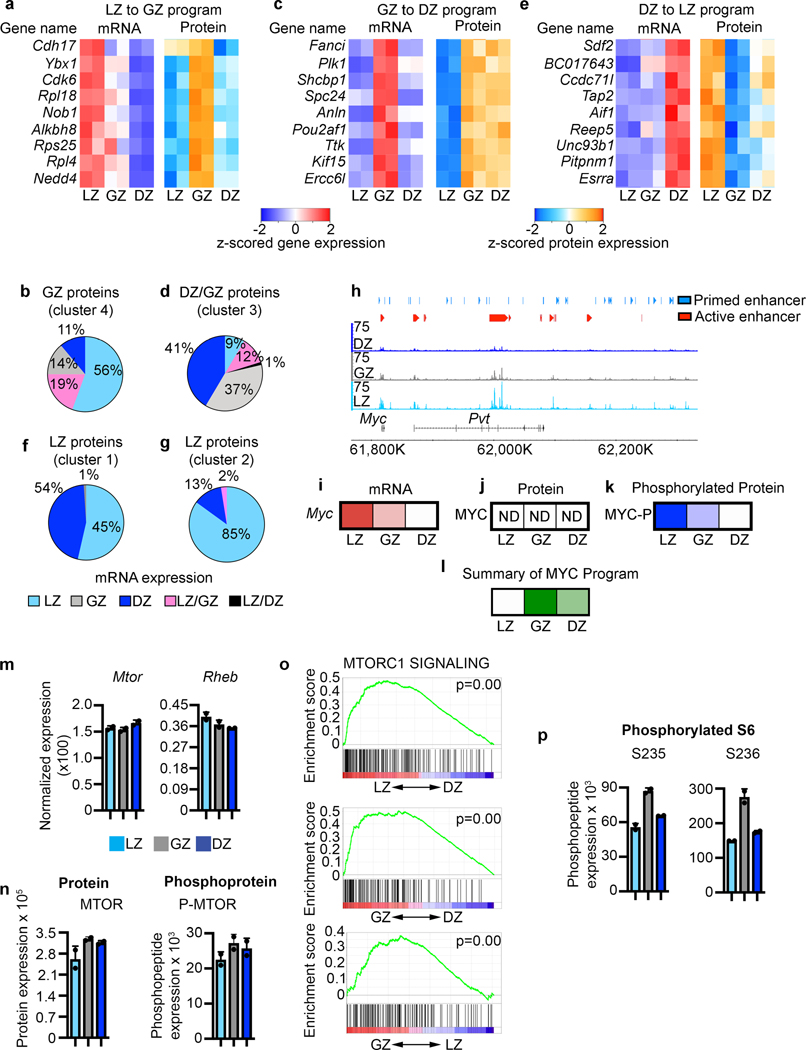
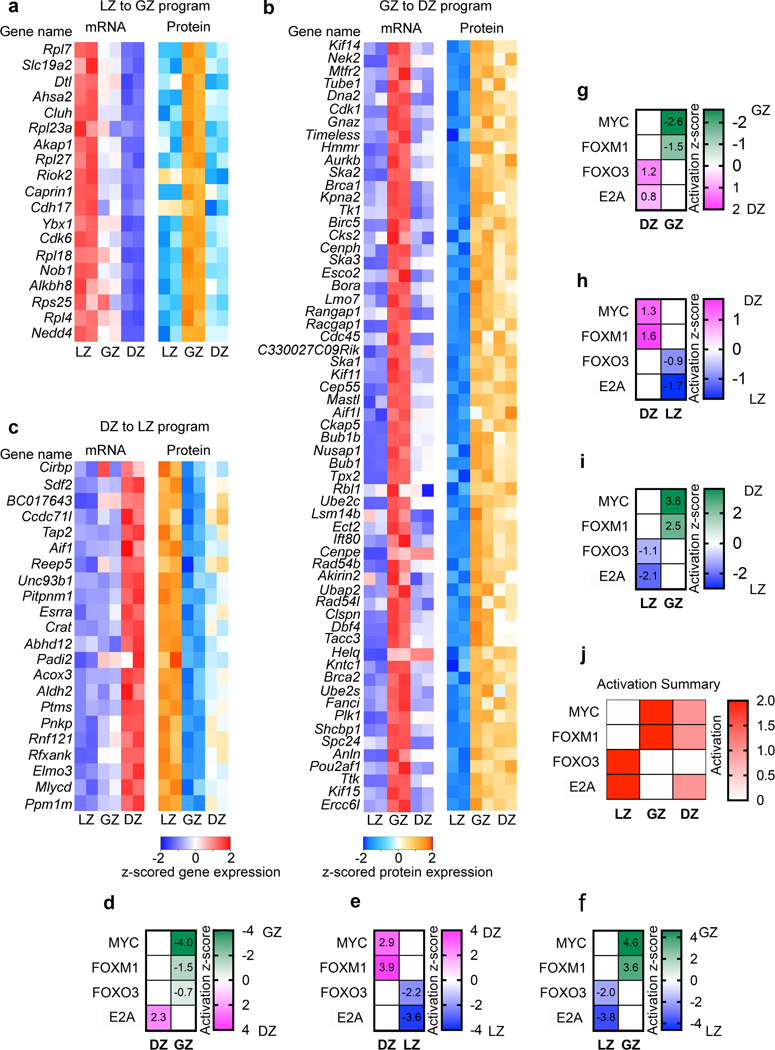
GCs are highly dynamic with rapid transitions between subpopulations5, 26, 27, 28. Therefore, we expected that proteins expressed at a particular stage (e.g., GZ) would likely result from mRNAs expressed at that or the prior stage (e.g., LZ). Indeed, we observed mRNAs encoding GZ proteins (protein cluster 4) tend to be most abundant in LZ cells (Fig. 7a and Extended Data Fig. 6a). This is consistent with the LZ preceding the GZ stage. Furthermore, the highest mRNA levels for ~90% of GZ abundant proteins were observed in the LZ or the GZ (Fig. 7b). Likewise, mRNAs for proteins most abundant in GZ and DZ B cells (cluster 3) were generally highest in the GZ (Fig. 7c, Extended Data Fig. 6b). For 78% of proteins in this cluster, the corresponding mRNA was most abundant in either the GZ and/or DZ stages (Fig. 7d).
Figure 7. Molecular regulation of GCBC progression.
a, Heatmap of gene expression (left) and protein expression (right) for the indicated genes representing LZ to GZ program. b, Pie chart displaying the cell types with highest corresponding mRNA expression for the proteins that make up GZ protein cluster 4. c, Heatmap of gene expression (left) and protein expression (right) for the indicated genes representing the GZ to DZ program. d, Pie chart displaying the cell types with highest corresponding mRNA expression for the proteins that make up DZ/GZ protein cluster 3. e, Heatmap of gene expression (left) and protein expression (right) for the indicated genes representing the DZ to LZ program. f and g, Pie charts displaying the cell types with the highest corresponding mRNA expression for the proteins that make up LZ protein cluster 1 (f) and cluster 2 (g). h, Genome accessibility and enhancer tracks aligned at the Myc locus and downstream regulatory region. i, Relative Myc mRNA expression. j, Relative MYC protein expression. k, Relative phosphorylated-MYC levels. l, Relative activation or the downstream MYC program as determined by IPA upstream regulator analysis. In i-l, increased color intensity equals increased expression. m, mRNA expression for the indicated genes. n, Protein and phosphoprotein levels for the indicated proteins. o, Gene Set Enrichment (GSEA) for MTORC1 SIGNALING for the indicated comparisons. P values determined using GSEA program which implements Signal2Noise test coupled to Benjamini-Hochberg p-value correction algorithm (n=2 per cell type). p, Phosphoprotein levels for the indicated proteins. For m,n each dot corresponds to an independent biological sample. See also Extended Data Fig. 6.
During affinity maturation, B cells can cycle through GC subsets multiple times27. Therefore, we expected to observe a DZ to LZ transition (Fig. 7e, Extended Data Fig. 6c). Abundant LZ proteins were found in both cluster 1 and 2. For the LZ proteins in cluster 1, the corresponding mRNAs were most abundant in the LZ and DZ (Fig. 7f). For cluster 2 LZ proteins, the encoding mRNAs were mostly also in the LZ with none abundant in the GZ (Fig. 7g). Together, these data support our pseudotime analysis, which identified a LZ to GZ to DZ progression. Further, they indicate a DZ to LZ transition completing a cycle of GCBC selection.
Successful selection of LZ B cells is associated with MYC upregulation which prepares cells for proliferation8, 9, 29. Examination of the Myc gene (Fig. 7h) revealed that both the gene body and several downstream active enhancers were most open in LZ cells. Myc mRNA was expressed highest in the LZ (Fig. 7i). MYC protein was not captured by our total proteome analysis (Fig. 7j). However, MYC protein is stabilized by phosphorylation30. Indeed, phosphorylated-MYC was highest in the LZ, with moderate levels in the GZ (Fig. 7k). Analysis of known MYC targets in both the proteomic and phosphoproteomic data sets, indicated that the MYC-dependent program was most active in the GZ, where cell division occurs (Fig. 7l and Extended Data Fig. 6d–j).
Analysis of Tcf3 (E2A) also suggested molecular priming for the activation of E2A targets in the next GCBC subset. Tcf3 mRNA expression and E2A binding motif enrichment was found in DZ and GZ B cells, followed by activation of the downstream E2A program in the LZ (Fig. 2h, Extended Data Fig. 2d, 6d–j). Further, the programs for differentiative TF FOXO331, and proliferative TF FOXM1 were active in LZ and GZ B cells, respectively.
Transition from LZ to DZ relies on activation of the metabolic and nutrient sensing mTORC1 pathway32. LZ, GZ, and DZ B cells expressed similar levels of mRNAs encoding mTOR and RHEB. Furthermore, all had similar levels of MTOR protein and phosphopeptides (Fig. 7m,n). However, by Gene Set Enrichment Analysis (GSEA) GZ B cells had the highest enrichment for mTORC1 pathway activity (Fig. 7o). GZ B cells also exhibited higher levels of S6 protein phosphorylated at residues S235 and S236 (Fig. 7p). These data suggest GZ B cells undergo anabolic growth prior to division.
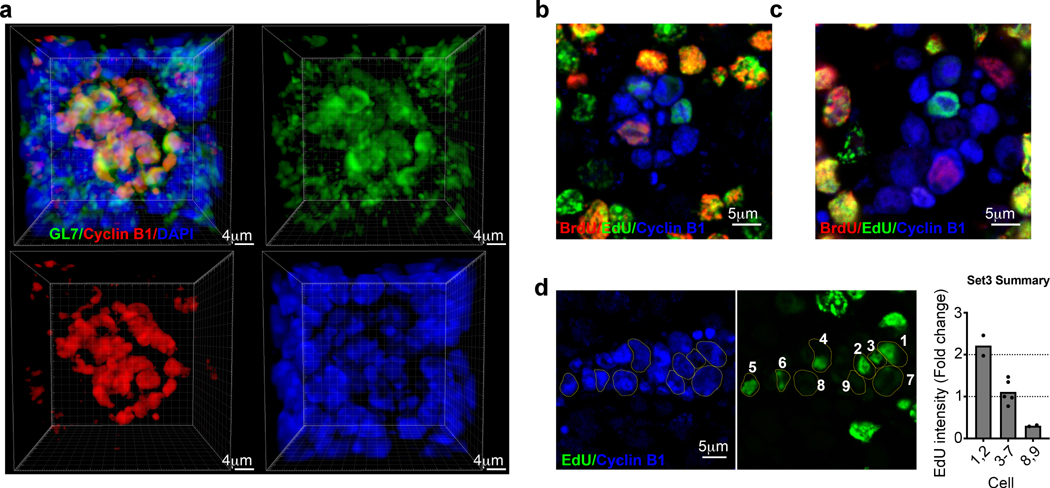
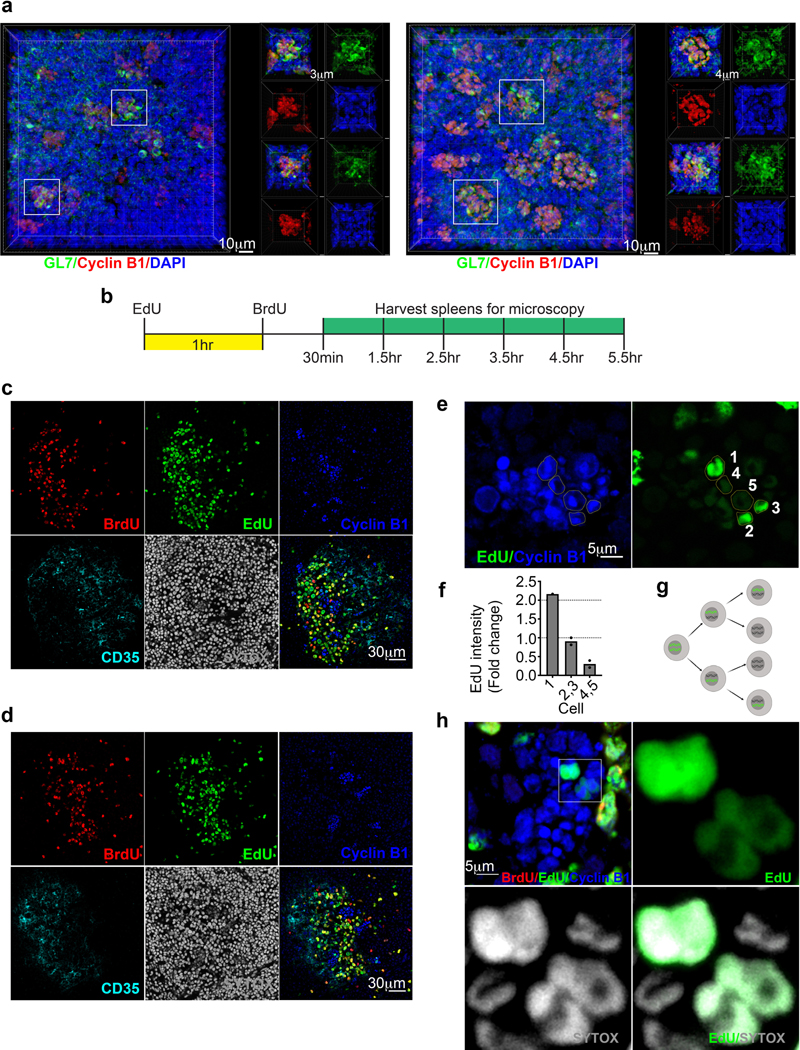
On average GC cells divide once or twice before re-entry into the LZ28, 33. To assess the size of GZ cell clusters, spleens from immunized mice were stained and imaged by three dimensional (3D) confocal microscopy. Approximate spheres of Cyclin B1 cells were visualized in the GC (Fig. 8a and Extended Data Fig. 7a). Counting cells revealed that each GZ cluster contained 31 ± 8 cells (mean ± SD, range: 18–47; n = 32 clusters from 3 mice). Therefore, GZ clusters are unlikely to arise from the expansion of a single clone.
Figure 8. GZ clusters are sites of ongoing cell division.
a, Immunofluorescence microscopy 3D z-stacks displaying a GZ cluster within the GC. GL7 (green), Cyclin B1 (red), DAPI (blue). n=4. b and c, Immunofluorescence microscopy of GCs from EdU and BrdU injected mice. Each image is focused on an individual GZ cluster at (b) 2.5hr (n=4 mice) and (c) 5.5hr (n=4 mice) post BrdU injection. Markers as indicated. d, Immunofluorescence microscopy of GCs for the indicated markers and quantification of EdU intensity within the GZ 5.5hr post BrdU injection. Each dot represents a cell. See also Extended Data Fig. 7.
These observations suggest that multiple cells migrate to GZ clusters to divide. To test this, immunized mice were injected i.v. with 5-ethynyl-2’-deoxyuridine (EdU), followed by Bromodeoxyuridine (BrdU) 1 h later. We then isolated spleens for confocal imaging 30 min to 5.5 h after BrdU injection (Extended Data Fig. 7b). EdU and BrdU labeling occurs in S phase, with EdU+ cells in late S phase at time of labeling, EdU+BrdU+ cells in mid S phase, and BrdU+ cells in early S phase. As expected28, BrdU+, EdU+BrdU+, and EdU+ cells were found in the canonical LZ and DZ at all time points (Extended Data Fig. 7c, d). This suggests that S phase is initiated in multiple GC compartments. In contrast, reliable appearance of BrdU+ cells in the GZ was not until approximately 2.5 h post BrdU injection (data not shown). The delayed appearance of BrdU+ cells in the GZ, suggests that most cells do not initiate S phase there. Rather, they move to the GZ for mitosis.
We asked if individual GZ clusters contained cells with different labeling profiles (either EdU+, BrdU+, or EdU+BrdU+). Indeed, cells that were labeled at different times were present within the same GZ foci (Fig. 8b,c). Furthermore, within each GZ cluster multiple cells with similar labeling profiles and intensities were observed. These data suggest that multiple cells migrate to the GZ within a narrow timeframe and accumulate there over time. Within a particular GZ cluster there were three different observable intensities of EdU staining (Fig. 8d, Extended Data Fig. 7e,f). These data are consistent with the dilution of labeled DNA during division (Extended Data Fig. 7g), which can be observed in the GZ by immunofluorescence (Extended Data Fig. 7h). These data suggest that once in GZ clusters, cells can undergo at least an additional round of division before migration to DZ. Overall, our data demonstrate that GZ clusters are sites where B cells both complete cell division programs initiated in the LZ and where they can undergo at least one additional cell division.
DISCUSSION
Division of GCBCs into DZ and LZ subsets dates to 193021 and is based on simple histological stains. Remarkably, this basic framework has largely survived intact. In contrast, genetic studies in mice have revealed great complexity not consistent with a two-cell population GC model. Herein, we demonstrate that the DZ contains two very different molecular B cell populations or compartments that reside in different areas and in which different functions are performed. We propose that these two distinct cell populations be named the dark zone proliferation (DZp, formerly GZ) and the dark zone differentiation (DZd) compartments. This new three-cell population model of the GC both resolves current contradictions in the literature and provides a new framework for understanding GCBC biology and mechanisms of peripheral humoral immunity.
Remarkably, within the conventional DZ, DZp cells were in clusters specialized for completing cell division identified by several markers including Cyclin B1 and LARS2. Proliferation in the DZ is limited to one or two cell divisions and is, by necessity, tightly linked to selection in the LZ28, 33. Without any higher organization, one might expect to see Cyclin B1 expressing cells diffusely through the DZ. However, we observed DZp foci containing multiple cells at different stages of cell division. This is consistent with ongoing migration of DZp cells to defined clusters where they undergo limited cell division.
The DZp clusters usually contained at least one TBM and this was associated with apoptosis of some DZp cells. These and other data suggest a checkpoint in which cells that are not positively selected in the LZ are deleted before completing mitosis24, 27. We propose that the DZp clusters allow for coordination of negative selection and cell removal with subsequent cell division. This precise staging is predicted to both favor efficient removal of apoptotic cells and to prevent mitotic catastrophe with necrosis34. Therefore, our data provides a rationale for why DZp cells might reside within distinct anatomical locations within the GC.
Aberrant SHM underlies many GC-derived B cell lymphomas35. Therefore, separation of proliferation from mechanisms of DNA mutation is critical for genomic stability and safe-guarding against neoplastic transformation36, 37. SHM is restricted to G1 thereby providing one mechanism to mitigate the genotoxic risk associated with AID activity38, 39, 40, 41, 42. However, segregating proliferation to a specific cell state allows coordination of a multiplicity of protective mechanisms. For example, Ig transcription, which is required for AID targeting43, was strongly downregulated in DZp cells. Furthermore, the prevalence of Aicda mRNA was relatively low in DZp cells compared to DZd cells. This was associated with increased activation of Aicda transcriptional repressors E2A and MYB44. Coordinating proliferation in DZp cells with downregulation of Ig transcription and Aicda expression is predicted to mitigate genotoxic stress in dividing cells.
Conversely, in DZd cells there was a coordinated induction of Aicda and AID-targeting mechanisms. Increased Aicda expression was associated with increased activation of two inducers of Aicda, CEBP and E2A44, and repression of both E2F and MYB activity. The Ig genes were also re-expressed in DZd cells 45. Finally, consistent with enhanced AID activity, analysis of phosphopeptides indicate that cellular responses to stress and DNA damage were upregulated in DZd cells. Therefore, separation of DZ B cells into two discrete subpopulations provides a framework for ordering principal GC functions.
The three GC population model revealed radical differences in genomic accessibility between each GC compartment. For example, the epigenetic landscape in DZp cells is consistent with their proliferative function. Sites for OCT2 binding, which is a TF required for mature GC cell proliferation, were enriched46. Conversely, DLBCL cell lines require OCT2 and its coactivator OCA-B (Pou2af1)46 which was also upregulated in DZp cells. EBF1 binding motifs were enriched in DZp cell accessible regions and this TF is required for GC cell proliferation47. E2A binding motifs, another TF important in GC responses48, were also enriched in DZp cells. These data reveal concordance between TF binding motif accessibility and function completely obscured in the canonical GC DZ/LZ model.
By integrating phosphoproteome, proteome, transcriptome and genomic accessibility data, we definitively split DZ B cells into two very functionally distinct populations. In contrast, while suggestive, analysis of our scRNA-Seq data did not reveal discrete populations. Similar inconclusive results have been obtained by others49. Furthermore, observing increases in specific mRNAs in one population, and corresponding increases in the encoded protein in the next population, provided the most compelling picture of temporal relationships between the three GC populations. Our results illustrate the value of a holistic and integrated approach to resolving important immune cells subsets.
Furthermore, an integrated approach allowed tracking of the molecular dynamics of critical regulators through GC subsets. MYC provides an example. In LZ B cells, Myc locus specific enhancers were open and this correlated with deposition of active enhancer epigenetic marks (H3K4me1+H3K27Ac+). Consistent with this, Myc mRNA abundance was highest in LZ B cells. While our proteomic analysis did not capture MYC protein, phosphorylation stabilizes MYC30 and phospho-MYC was detected in both the LZ and DZp populations. Furthermore, through analysis of the GCBC proteome and phosphoproteome, we found that the MYC-dependent downstream program was most active in DZp cells. These data provide a model in which Myc transcriptional activation in LZ B cells is followed by phosphorylation and stabilization of MYC in DZp cells and execution of the MYC-dependent program1.
In summary, our results provide a new three cell population GC model that segregates both essential functions and molecular programs into distinct compartments. This framework rectifies existing diverse studies to provide a cohesive understanding of GC function. Furthermore, the three cell population model will greatly facilitate future mechanistic studies. Most notably, our results will allow discovery of the epigenetic mechanisms regulating specific GC functions. Such knowledge is critical for developing targeted therapies to modulate adaptive humoral immunity in autoimmunity, cancer and infection.
METHODS
Mice
Wild-type (WT) C57BL/6J mice were purchased from Jackson laboratories and housed in the University of Chicago animal facilities. Female and male mice were used at 7–12 weeks of age, and studies carried out in accordance with the guidelines of the Institutional Animal Care and Use Committee at the University of Chicago.
Immunizations, Infections, and treatments
Mice were immunized intraperitoneally with 109 sheep red blood cells (SRBCs) (Lampire Biological Laboratories) in PBS, then boosted with 109 SRBC 5 days later. On day 14, GCBCs were either isolated in RPMI (ThermoFisher) with 10% FBS or spleens were preserved in OCT (TissueTek) at −80oC for downstream applications. For influenza infections, mice were infected by intranasal instillation with 50 PFU of Influenza strain PR8 as done previously50. On day 27 post infection spleens were collected, frozen in O.C.T. medium and analyzed by confocal microscopy. For EdU and BrdU labeling experiments, immunized mice were intravenously injected with 1 mg of EdU (ThermoFisher), followed by BrdU (BioLegend) injection (2 mg) 1 h later as done before28. Spleens were isolated and embedded in OCT for downstream analysis at 1-h intervals, starting 30 min after BrdU injection and ending with the last timepoint at 5.5 h post BrdU injection.
Isolation of GC subsets and flow cytometry
Spleens were collected from WT mice and cells were resuspended in staining buffer (5% FBS in PBS). Red blood cells (RBC) were lysed using ACK lysis buffer (Lonza). To isolate GCBCs, single-cell suspensions from the spleens of immunized mice were labeled with biotinylated antibodies specific for CD43, CD11c and IgD followed by depletion using standard magnetic bead technology (Miltenyi magnetic columns). The resulting unlabeled cells were enriched for GCBCs. Enriched cells were then stained with anti-B220, anti-GL7, anti-CD95, anti-CXCR4, anti-CD83, and viability dye eFluor 506 (eBioscience). GCBC subsets were then isolated by fluorescence activated cell sorting (FACS). For cell cycle analysis cells were stained with FxCycle Violet (ThermoFisher). Cell sorting was performed on a FACSAria II (BD) and flow cytometry was performed on an LSR Fortessa X20 (BD). Flow cryometric analysis was performed using FlowJo (BD).
RNA-Seq, QC and quantification
Total RNA was isolated using a RNeasy kit (Qiagen). For RNA-Sequencing oligo-dT beads were used to isolate mRNA. Libraries were prepared using the standard Illumina library protocol (Kit: RS-122–2101 TruSeq® Stranded mRNA LT-SetA) prior to sequencing on the Illumina Hiseq2500. Raw reads were aligned to reference genome mm9 in a splice-aware manner using STAR51. Gene expression was quantified using FeatureCounts52 against UCSC genes, with Ensembl IG genes from mm10 converted to mm9 coordinates with UCSC liftOver.
Assay for Transposase-Accessible Chromatin using Sequencing (ATAC-Seq)
ATAC-Seq was performed as described53. Cells were washed with PBS, then lysed with ATAC lysis buffer (10 mM Tris-HCl, pH 7.4, 10 mM NaCl, 3 mM MgCl2, 0.1% IGEPAL CA-630). Resulting nuclei were then incubated with tagmentation enzyme (Illumina). Libraries from purified samples were made with the Nextera Indexing kit (Illumina).
ChIP-Tagmentation-Sequencing (ChIP-Tag-Seq)
1–2 × 10⁶ isolated cells were fixed and nuclei prepared for sonication. Sonication was performed using a Bioruptor sonication water bath. ChIP was performed with anti-H3K4me1 (Millipore) and anti-H3K27Ac (Abcam) using the Millipore ChIP Kit (17–295). ChIP and input sample libraries were prepared by tagmentation coupled to indexing with Illumina Nextera barcodes described above. Samples were analyzed for quality, then sequenced on a HiSeq 4000 (Illumina).
ChIP-Seq and ATAC-Seq alignment
Raw reads were aligned to reference genome mm9 using BWA MEM54. Apparent PCR duplicates were removed using Picard MarkDuplicates (https://github.com/broadinstitute/picard/releases/tag/2.11.0).
ChIP-Seq and ATAC-Seq peak calling and peak quantification
For ChIP-Seq, peaks were called against inputs using Macs255; normalized bedgraph tracks were generated using the --SPMR flag, and converted to bigWig using UCSC tool bedGraphToBigWig. Peaks with a score >5 were retained. High-confidence peaks between biological replicate pairs for ChIP-Seq data were obtained using Irreproducible Discovery Rate (IDR) analysis56. For these analyses, peaks were called at a threshold of q<0.5 to ensure sufficient seeding of noisy peaks. Peaks with IDR<0.2 were retained for downstream analysis. For ATAC-Seq, read alignments were first adjusted to account for TAC transposon binding: +4bp for + strand alignments, −5bp for - strand alignments. The open chromatin enrichment track was generated by first creating a bedGraph from the raw reads using bedtools genomcov57, then converted to bigWig using UCSC tool bedGraphToBigWig; tracks were normalized by the sum of alignment lengths over 1 billion. Open chromatin peaks were called using Macs255 with --no model set and no background provided; peaks with a score >5 were retained.
To quantitatively measure changes in epigenetic enrichment, we first identified empirical regulatory elements (REs) based on the peak calls obtained from each sample in the study. Peaks were merged into a uniform set of REs using bedtools merge57. Enrichment levels for each RE were then quantified with featureCounts52. Counts for input control samples will also be quantified on the same REs and subtracted from ChIP-Seq counts after accounting for sequencing depth differences, giving an input-controlled quantification suitable for differential analysis.
Gene annotation and enhancer identification
Enhancer sites were determined based on the presence of H3K4me1 peaks, and active enhancers were further defined based on an overlap with H3K27Ac peaks. ATAC peaks were then classified as (1) promoter, based on +/− 1 kb from a gene TSS; (2) active enhancer, based on overlap with H3K27Ac-containing enhancer and not in TSS; (3) primed enhancer, based on overlap with non-H3K27Ac-containing enhancer and not in TSS; (4) gene body, if between TSS and TSE for a gene but not in a promoter or enhancer region; or (5) intergenic (other), if none of the above.
Differential expression (RNA-Seq and ATAC-Seq)
Differential expression statistics (fold-change and p-value) were computed using edgeR58, on raw expression counts obtained from quantification (either genes or peaks). Pairwise comparisons were computed using exactTest, and multi-group comparisons using the generalized linear modeling (GLM) capability in edgeR. In all cases P-values were adjusted for multiple testing using the false discovery rate (FDR) correction of Benjamini and Hochberg. Significant genes will be determined based on an FDR threshold of 5% (0.05) in the multi-group comparison.
Clustering and heatmaps
We performed complete linkage hierarchical clustering of the gene and peak expression levels and plotted the data in a heatmap using the “hclust” and “heatmap.2” functions in R.
Pathway analysis and motif analysis
Metascape data portal59 was used for pathway analyses. Hypergeometric Optimization of Motif EnRichment (HOMER)60 was used to perform de novo and known transcription factor binding motif analyses using the FindMotifsGenome function to generate enrichment and statistical significance (P values).
Whole and phosphoproteome profiling by multiplex TMT-LC/LC-MS/MS
Protein extraction, digestion, labelling and pooling
To identify changes in protein expression in GC subsets, we used multiplexed tandem mass tag (TMT) labeling and two-dimensional liquid chromatography-tandem mass spectrometry (LC/LC-MS/MS) to quantify the proteome and phosphoproteome in LZ, GZ, and DZ B cells. Whole proteome and phosphoproteome profiling were performed as described61. B cell subsets from a total of 120 mice isolated over 5 independent immunizations were sorted as described above and subjected to protein extraction, digestion, labelling and pooling. Cells were washed twice with ice-cold PBS and cell pellets from ten samples were lysed in fresh lysis buffer (50 mM HEPES, pH 8.5, 8 M urea and 0.5% sodium deoxycholate). The protein concentration of lysate was quantified by BCA protein assay (Thermo Fisher Scientific), and further confirmed by SDS–PAGE with titrated BSA, followed by Coomassie staining. Fifty μg proteins from each sample were first digested with Lys-C (Wako, 1:50 w/w) for 2 h, diluted 4-fold with 50 mM HEPES, pH 8.5, and then further digested with trypsin (Promega, 1:50 w/w) at 25°C for overnight. Resulting peptides were acidified and desalted with a Sep-Pak C18 cartridge (Waters), eluted with 60% acetonitrile, 0.1% trifluoroacetic acid, and dried by SpeedVac. Each sample was then resuspended in 50 mM HEPES, pH 8.5, and labelled with 10-plex tandem mass tag (TMT) reagents (Thermo Fisher Scientific) following the manufacturer’s instructions. Finally, the TMT-labelled samples were equally mixed, desalted, and dried by SpeedVac.
Phosphopeptide enrichment by TiO2
Phosphopeptide enrichment was done by TiO2 beads (GL Sciences) as previously reported62. Briefly, the TMT-labelled peptide mixture was dissolved in 150 μl of binding buffer (65% acetonitrile, 2% TFA, and 1 mM KH2PO4). TiO2 beads were washed twice with washing buffer (65% acetonitrile, 0.1% TFA), mixed with the peptide solution with a peptide–to–bead weight ratio of 1:3, and incubated at 25oC or 20 min. The phosphopeptide-bound beads were collected by briefly centrifugation, and then washed twice with 750 μl washing buffer and eluted under basic pH condition (20 μl, 15% NH4OH, 40% acetonitrile). This process was repeated 6 times to deplete the peptide mixture of phosphorylated species. The eluent was dried and stored in −80 °C freezer before LC-MS/MS analysis. The phosphopeptide-depleted flow-through were used for whole proteome analysis.
Offline basic pH reverse phase liquid chromatography
The phosphopeptide-depleted flow-through was desalted, dried, and solubilized in 60 μl buffer A (10 mM ammonium formate, pH 8) and separated on an XBridge C18 column (3.5-μm particle size, 4.6 mm × 25 cm, Waters) into multiple fractions with a 2 h gradient from 15% to 45% buffer B (95% acetonitrile, 10 mM ammonium formate, pH 8, flow rate of 0.4 ml/min). Each fraction was dried for whole proteome analysis.
Acidic pH reverse phase liquid chromatography coupled with tandem mass spectrometry
The analysis was performed based on the optimized platform63, with extensive fractionation by high resolution LC/LC-MS/MS used to achieve deep proteome coverage and decrease ratio suppression during quantification64. Briefly, the dried peptides were reconstituted in 5% formic acid, loaded on a reverse phase column (75 μm × 30 cm, 1.9 μm C18 resin) interfaced with a Q-Exactive HF mass spectrometer (ThermoFisher Scientific). Peptides were eluted by 12–36% buffer B gradient in 2.5 h (buffer A: 0.2% formic acid, 3% DMSO; buffer B: buffer A plus 67% acetonitrile, flow rate of 0.25 μl/min). The column was heated at 65°C by a butterfly portfolio heater (Phoenix S&T) to reduce back pressure. The mass spectrometer was operated in data-dependent mode with a survey scan in Orbitrap (60,000 resolution, 1 × 10⁶ AGC target and 50 ms maximal ion time) and 20 tandem mass spectrometry (MS/MS) high-resolution scans (60,000 resolution, 1 × 10⁵ AGC target, 105 ms maximal ion time, HCD, 35 normalized collision energy, 1.0 m/z isolation window, and 20 s dynamic exclusion).
Proteomics data analysis
The analysis was performed by the JUMP program, a hybrid search engine that combines tag scoring and pattern match scoring to improve sensitivity and specificity, and has been used in data processing previously61. In brief, acquired MS/MS raw files were converted into mzXML format and searched by the JUMP algorithm against a composite target/decoy database to estimate FDR. The target protein database was downloaded from the Uniprot mouse database (52,490 protein entries) and the decoy protein database was generated by reversing all target protein sequences. Searches were performed with 10 ppm mass tolerance for both precursor ions and product ions, fully tryptic restriction, two maximal missed cleavages and the assignment of a, b and y ions. TMT tags on lysine residues and peptide N termini (+229.16293 Da) and carbamidomethylation of cysteine residues (+57.02146 Da) were used for static modifications and oxidation of methionine residues (+15.99492 Da) were used for dynamic modification. The phosphoproteomic analysis were carried out by further adding Ser, Thr, Tyr phosphorylation (+79.96633 Da) as dynamic modifications same as previously described65. The assigned peptides were filtered by mass accuracy, minimal peptide length, matching scores, charge state and trypticity to reduce protein false discovery rate (FDR) or phosphopeptide FDR to below 1%.
TMT-based protein quantification
The analysis was performed using JUMP software suite as previously reported61. In brief, TMT reporter ion intensities of each peptide spectrum match (PSM) were extracted and PSMs with very low intensity were removed. The raw intensities were then corrected based on isotopic distribution of each labelling reagent and loading bias. The mean-centred intensities across samples were calculated and protein relative intensities were derived by averaging related PSMs. Finally, protein absolute intensities were determined by multiplying the relative intensities by the grand-mean of three most highly abundant PSMs.
Differential expression analysis and proteome and phosphoproteome
Differential expression of GCBCs (LZ, GZ and DZ) were defined linear model implemented in R package limma v. 3.34.9 after log2 transformation of TMT signals. We used Benjamini-Hochberg (BH) method to correct for multiple testing and used BH FDR cutoff < 0.1 and |log2 FC| > 0.5 (sd of null log2 FC calculated using replicates for each cell type was 0.2) in at least 1 out of 3 cell types to define differentially expressed (DE) proteins in GCBCs. We got 415 DE proteins and 586 DE phosphoproteins.
Weighted gene co-expression network analysis (WGCNA) clustering analysis
The analysis was performed using WGCNA R package v. 1.6666. We defined whole proteome co-expression clusters using 415 DE proteins and phosphoprotein co-expression cluster using 586 DE phosphoproteins. Pearson correlation matrix was calculated using the 6 samples from GCBCs followed by an adjacency matrix calculation by raising the correlation matrix to a power of 18 for both proteome and phosphoproteome using scale-free topology criterion. Co-expression clusters were defined by hybrid dynamic tree cutting method with minimum height for merging module set at 0.2. A consensus trend for each co-expression cluster was defined based on the first principal component (eigengene) and cluster membership was defined as Pearson correlation between individual protein or phosphoprotein and the consensus trend of the co-expression cluster. Proteins or phosphoproteins were assigned to the most correlated co-expression cluster with cutoff of r ≥ 0.7. Each co-expression cluster was annotated using either Canonical or Hallmark pathways downloaded from MsigDB by right tailed Fisher’s exact test.
IPA upstream regulator analysis
Ingenuity Pathway core analysis was performed using Ingenuity Pathway Analysis software (IPA, Ingenuity Systems).
Single cell RNA-Seq
GCBCs were isolated by FACS, then subjected to Drop-Seq to co-encapsulate individual cells in reverse emulsion droplets in oil together with one uniquely barcoded mRNA-capture bead. Libraries were derived from single B cells, then subjected to Next-Generation-Sequencing. Drop-Seq data was preprocessed using the alignment and QC pipeline available at http://mccarrolllab.com/dropseq/ 67, in conjunction with STAR aligner, and Picard tools (Broad Institute). This pipeline produced a single cell Digital Gene Expression (DGE) matrix that was used for downstream analysis. Additional QC and analysis was performed in the Monocle 2 and Seurat packages in R68. Low-quality cells were removed by excluding cells with <500 genes/cell. A total of 5,159 GCBCs were suitable for analysis. We further analyzed this dataset for mitochondrial gene expression which suggested that our dataset had good overall quality. Average mitochondrial gene expression per cell was approximately 12% (median 11%, mode 11%). Genes were excluded from pseudotime analysis based on an expression threshold of <0.1 and if expressed in <5% of cells. Pseudotime analysis (Monocle2) was performed according to the “dpFeature” described in69. Briefly, clusters were determined by selecting genes expressed in at least 5% of all cells. After PCA to identify high loading PCs, TSNE reduced dimension equal to 4 was performed. Clusters were identified using the densityPeak algorithm with a rho_theshold = 4 and delta_threshold= 17. Finally, differential expression analysis was performed between the clusters (“~Cluster”) and the top 1,200 differential expressed genes were used for ordering cells in pseudotime. The DDRTree function was used at reduced dimensions equal to 3. Default values were used for all other options. Analysis of pseudotime clusters for enriched GCBC subset genes was performed by comparing genes with significant gene expression changes over pseudotime (q<0.05 scRNA-seq dataset) to bulk RNA-Seq differentially expressed genes. Differentially expressed genes from the bulk RNA-Seq dataset were narrowed down to only consider the highest expressed genes by setting a log2CPM threshold of >7 (Supplementary Table 1 bottom). For the gene signature analysis, scRNA-seq counts were processed through normalization and scaling steps in Seurat. The top 6,000 most variable genes in the scRNA-Seq data set were selected for gene signature analysis. Gene signatures were generated for each of the eight bulk RNA-Seq clusters (Supplementary Data 2). The top 6,000 scRNA-Seq variable genes were intersected with each bulk gene list, then the gene signature with respect to each cluster was determined by computing the average scaled expression value across all genes in a signature for each cell. The averaged value was then plotted against the UMAP. UMAP plots were generated with Monocle3.
GC microscopy
Tissue staining and microscopy. Spleens from immunized mice were harvested, rinsed with PBS and transferred into a mold containing OCT and frozen in 2-methylbutane in dry ice immediately. Frozen spleens were sectioned (5–7 μm) serially. For tissue staining of gray zone, the sections were fixed in 4% paraformaldehyde, blocked with 10% normal donkey serum and stained with primary antibodies to CD35, GL7, CXCR4, B220, Cyclin B1, CD83, LARS2, and CD68 in various combinations, and thereafter incubated with fluorochrome-conjugated secondary antibodies specific to the primary species and isotypes. DAPI was applied for nucleus identification. For Edu/BrdU staining, spleen sections were fixed and blocked, then incubated with BrdU antibody and Cyclin B1 antibody, followed by EdU staining using Click-it EdU Alexa Fluor 488 imaging kit (ThermoFisher). Sytox blue was used to stain the nucleus. TUNNEL Kit (Abcam) was used to stain apoptotic cells. Images were acquired at 12-bit depth, 1,024 × 1,024 pixel size, utilizing SP8 laser scanning confocal microscope (Leica). ImageJ software was used for analysis. 30 μm spleen sections were used for 3D imaging. Images were taken by SP8 microscope with a z step of 0.5 μm, and then processed by Imaris software.
Gene Set Enrichment Analysis
GSEA was performed with default settings as previously described70.
Life Sciences Reporting Summary
Additional information can be found in the Life Sciences Reporting Summary.
Statistical Analysis
Statistical analyses were performed with GraphPad Prism. For analyses with multiple comparisons, data were analyzed by ANOVA in combination with Tukey’s Multiple Comparisons Test. Bar graphs are displayed as the mean ± standard deviation (SD). Significance as defined by P value or FDR (q value) are defined in the figures, figure legends, corresponding text, or in tables. Additional quantitative methods and statistical criteria are mentioned above based on their respective technologies and analysis approaches.
Data Availability
The data that support the findings of this study are available from the corresponding author upon reasonable request. Bulk RNA-Seq, scRNA-Seq, ATAC-Seq, and ChIP-Seq data have been deposited in the Gene Expression Omnibus database. Accession code GSE133743. Reviewers may access these data through a private link: https://www.ncbi.nlm.nih.gov/geo/query/acc.cgi?acc=GSE133743 with the password wrudceucnpirtep. Proteome and phosphoproteome data have been uploaded to ProteomeXchange via the PRIDE database. Project Name: Proteome profiling of mouse germinal center B cells, Project accession: PXD015524. Reviewers may access these data through a private login: Username: reviewer47001@ebi.ac.uk, Password: 3SndljK1. Data from GSE100738 were also analyzed.
Extended Data
Extended Data Fig. 1. Transcriptional analysis of GCBC subsets in support of Figure 1.
a, Schematic of immunization strategy. Mice were immunized intraperitoneally with sheep red blood cells (SRBCs), boosted on day 5, followed by isolation of GCBC subsets from spleens. b, RNA-Seq volcano plot displaying the -Log10 FDR vs Log2 fold-change of genes differentially expressed between DZ and LZ cells isolated by the Classical GC strategy. c, RNA-Seq heatmap and volcano plot displaying head-to-head differentially expressed genes between DZ vs LZ B cells isolated using the New Strategy in Figure 1c. d and e, RNA-Seq heatmaps and volcano plots displaying head-to-head differentially expressed genes between GZ vs LZ (d) and DZ vs GZ (e) B cells isolated using the New Strategy in Figure 1c. For RNA-Seq, n=2 per cell type. Each n represents cells pooled from 20 mice. q values were generated with edgeR (see methods).
Extended Data Fig. 2. Epigenetic differences between GCBC subsets in support of Figure 2.
a, Genome accessibility and enhancer tracks aligned at the Otub2 locus. b, mRNA expression of Otub2. c, mRNA expression of the indicated TF in LZ, GZ and DZ B cells. d, TF motifs enriched in accessible regions for the indicated genome accessibility cluster and associated GCBC subset. p values were generated using HOMER (see methods). For each cluster, n= the number of accessibility peaks indicated in Figure 2f. e and f, Genome accessibility and enhancer tracks aligned at the Foxn2 (e) and Ccnb1 (f) locus for GCBCs isolated by the Classic GC method. For ATAC-Seq data, n=2 per cell type. Each n represents cells pooled from 20 mice. (b,c) Each dot corresponds to an independent biological sample.
Extended Data Fig. 3. Phosphoproteomic analysis of GCBC subsets in support of Figure 3.
a, Schematic of phosphoproteome differential expression analysis on GC populations isolated with the New gating strategy. b, Phosphoproteome cell distance plot of the indicated cell populations. Scale represents Euclidian distance. c, Box plots of phosphoproteomic clustering analysis (left). Boxes represent interquartile ranges (IQRs; Q1–Q3 percentile) and black vertical lines represent median values. Maximum and minimum values (ends of whiskers) are defined as Q3 + 1.5× the IQR and Q1 − 1.5× the IQR, respectively. Pathway analysis associated with the indicated cluster (right). Numbers correspond to -log10 p value. For each cluster, n= the number of phosphoproteins indicated above boxplot. P values were generated by Metascape using an established hypergeometric test coupled with Benjamini-Hochberg p-value correction algorithm. Light blue, gray, and dark blue (left side of heatmap) correspond to the LZ, GZ, or DZ subsets respectively. d, Total protein expression of Ki67. e, Relative levels of the indicated Ki67 phosphopeptides from cluster 1. f, List of GZ upregulated phosphopeptides for Ki67 from cluster 1. For phosphoproteome data, n=2 per cell type. Cells were isolated from a total of 120 mice. Each n was generated from 5–6 million purified B cell subsets. See also Supplementary Data 5.
Extended Data Fig. 4. Histological analysis of the GZ in support of Figure 4.
a and b, Immunofluorescence microscopy of GCs 14 days post SRBC immunization. Single panels and merged image displaying GL7, CD35, and Cyclin B1 in two distinct GCs. (n>7 mice) c, Expression of Lars2 (mitochondrial leucyl-tRNA synthetase) in LZ, GZ and DZ. Each dot corresponds to an independent biological sample. d, Immunofluorescence microscopy of GC 14 days post SRBC immunization examining colocalization of Cyclin B1 and LARS2. (a) is related to Figure 4 panel a.
Extended Data Fig. 5. Analysis of single GCBC transcription in support of Figure 6.
scRNA-Seq UMAP plots generated with Monocle3 displaying the enrichment for gene expression signatures derived from bulk RNA-Seq clusters 1–8. Bulk RNA-Seq gene expression trend is displayed to the side of each scRNA-Seq UMAP plot. Boxes represent interquartile ranges (IQRs; Q1–Q3 percentile) and black vertical lines represent median values. Maximum and minimum values (ends of whiskers) are defined as Q3 + 1.5× the IQR and Q1 − 1.5× the IQR, respectively.
Extended Data Fig. 6. Integration of transcriptional and proteomic analysis in support of Figure 7.
a-c, Heatmap of gene expressions (left) and protein expressions (right) for the indicated genes. Full lists related to Figure 7a, c, e. d-i, Heatmaps of head-to-head GCBC subset comparisons for IPA upstream regulator analysis. For factors indicated. d-f, Analysis of total proteome dataset. g-i, Analysis of phosphoproteome dataset. j, Summary of relative activation status for panels (d-i), for the indicated activated factors and cell types. For head-to-head comparisons, increased activation for the indicated factors corresponds to increased color intensity GZ (green), DZ (red), and LZ (blue).
Extended Data Fig. 7. Visualization of GZ proliferative clusters in support of Figure 8.
a, Immunofluorescence microscopy 3D z-stacks displaying a whole GCs and focusing on GZ clusters within the GC. GL7 (green), Cyclin B1 (red), DAPI (blue). (n=4) Right panel is related to GZ displayed in Figure 7m. b, Schematic of EdU and BrdU injection experimental design. c and d, Immunofluorescence microscopy of whole GCs for the indicated markers 5.5hr post BrdU injection (n≥3 mice per timepoint indicated in panel b). e and f, Immunofluorescent microscopy of GCs for the indicated markers (e) and quantification of EdU intensity within the GZ (f) 5.5hr post BrdU injection. Each dot represents a cell. g, Schematic representing dilution of EdU during cell division (5.5hr). h, Immunofluorescent microscopy of GCs for the indicated markers visualizing cells in multiple stages of active cell division within a GZ cluster 5.5hr post BrdU injection (n>3 mice).
Supplementary Material
ACKNOWLEDGEMENTS
We would like to thank D. Leclerc and the UChicago flow cytometry core for providing the latest flow cytometry technologies. We also thank Y. Wang for assistance in proteomics experiments. This work is supported by the US National Institutes of Health Grants RO1AI143778 and R21AI128785 (to M.R.C), T32 HL007605 and F32AI143120 (to D.E.K.), T32HD007009 (M.K.O.), R01AG047928 (J.P.), and the Cancer Center Support Grant (P30CA014599) for the Uchicago flow cytometry core.
Footnotes
COMPETING FINANCIAL INTERESTS
The authors declare no competing financial interests.
REFERENCES
- 1.De Silva NS & Klein U Dynamics of B cells in germinal centres. Nat Rev Immunol 15, 137–148 (2015). [DOI] [PMC free article] [PubMed] [Google Scholar]
- 2.MacLennan IC Germinal centers. Annu Rev Immunol 12, 117–139 (1994). [DOI] [PubMed] [Google Scholar]
- 3.Bannard O et al. Germinal center centroblasts transition to a centrocyte phenotype according to a timed program and depend on the dark zone for effective selection. Immunity 39, 912–924 (2013). [DOI] [PMC free article] [PubMed] [Google Scholar]
- 4.Victora GD & Nussenzweig MC Germinal centers. Ann Rev Immunol 30, 429–457 (2012). [DOI] [PubMed] [Google Scholar]
- 5.Victora GD et al. Germinal center dynamics revealed by multiphoton microscopy with a photoactivatable fluorescent reporter. Cell 143, 592–605 (2010). [DOI] [PMC free article] [PubMed] [Google Scholar]
- 6.Shulman Z et al. Dynamic signaling by T follicular helper cells during germinal center B cell selection. Science 345, 1058–1062 (2014). [DOI] [PMC free article] [PubMed] [Google Scholar]
- 7.Khalil AM, Cambier JC & Shlomchik MJ B cell receptor signal transduction in the GC is short-circuited by high phosphatase activity. Science 336, 1178–1181 (2012). [DOI] [PMC free article] [PubMed] [Google Scholar]
- 8.Calado DP et al. The cell-cycle regulator c-Myc is essential for the formation and maintenance of germinal centers. Nat Immunol 13, 1092–1100 (2012). [DOI] [PMC free article] [PubMed] [Google Scholar]
- 9.Dominguez-Sola D et al. The proto-oncogene MYC is required for selection in the germinal center and cyclic reentry. Nat Immunol 13, 1083–1091 (2012). [DOI] [PMC free article] [PubMed] [Google Scholar]
- 10.Allen CD et al. Germinal center dark and light zone organization is mediated by CXCR4 and CXCR5. Nat Immunol 5, 943–952 (2004). [DOI] [PubMed] [Google Scholar]
- 11.Song S & Matthias PD The Transcriptional Regulation of Germinal Center Formation. Front Immunol 9, 2026 (2018). [DOI] [PMC free article] [PubMed] [Google Scholar]
- 12.Tunyaplin C et al. Direct repression of prdm1 by Bcl-6 inhibits plasmacytic differentiation. J Immunol 173, 1158–1165 (2004). [DOI] [PubMed] [Google Scholar]
- 13.Ochiai K et al. Transcriptional regulation of germinal center B and plasma cell fates by dynamical control of IRF4. Immunity 38, 918–929 (2013). [DOI] [PMC free article] [PubMed] [Google Scholar]
- 14.Recaldin T & Fear DJ Transcription factors regulating B cell fate in the germinal centre. Clin Exp Immunol 183, 65–75 (2016). [DOI] [PMC free article] [PubMed] [Google Scholar]
- 15.Dominguez-Sola D et al. The FOXO1 Transcription Factor Instructs the Germinal Center Dark Zone Program. Immunity 43, 1064–1074 (2015). [DOI] [PubMed] [Google Scholar]
- 16.Trabucco SE, Gerstein RM & Zhang H YY1 Regulates the Germinal Center Reaction by Inhibiting Apoptosis. J Immunol 197, 1699–1707 (2016). [DOI] [PMC free article] [PubMed] [Google Scholar]
- 17.Perez-Garcia A et al. CTCF orchestrates the germinal centre transcriptional program and prevents premature plasma cell differentiation. Nat Commun 8, 16067 (2017). [DOI] [PMC free article] [PubMed] [Google Scholar]
- 18.Caganova M et al. Germinal center dysregulation by histone methyltransferase EZH2 promotes lymphomagenesis. J Clin Invest 123, 5009–5022 (2013). [DOI] [PMC free article] [PubMed] [Google Scholar]
- 19.Beguelin W et al. EZH2 is required for germinal center formation and somatic EZH2 mutations promote lymphoid transformation. Cancer Cell 23, 677–692 (2013). [DOI] [PMC free article] [PubMed] [Google Scholar]
- 20.Yoshida H et al. The cis-Regulatory Atlas of the Mouse Immune System. Cell 176, 897–912 e820 (2019). [DOI] [PMC free article] [PubMed] [Google Scholar]
- 21.Röhlich K Beitrag zur Cytologie der Keimzentren der Lymphknoten. Z. Mikrosk. Anat. Forsch, 1930. [Google Scholar]
- 22.Endl E & Gerdes J Posttranslational modifications of the KI-67 protein coincide with two major checkpoints during mitosis. J Cell Physiol 182, 371–380 (2000). [DOI] [PubMed] [Google Scholar]
- 23.Chistiakov DA, Killingsworth MC, Myasoedova VA, Orekhov AN & Bobryshev YV CD68/macrosialin: not just a histochemical marker. Lab Invest 97, 4–13 (2017). [DOI] [PubMed] [Google Scholar]
- 24.Brink R & Phan TG Self-Reactive B Cells in the Germinal Center Reaction. Annu Rev Immunol 36, 339–357 (2018). [DOI] [PubMed] [Google Scholar]
- 25.Weber TS Cell Cycle-Associated CXCR4 Expression in Germinal Center B Cells and Its Implications on Affinity Maturation. Front Immunol 9, 1313 (2018). [DOI] [PMC free article] [PubMed] [Google Scholar]
- 26.Allen CD, Okada T, Tang HL & Cyster JG Imaging of germinal center selection events during affinity maturation. Science 315, 528–531 (2007). [DOI] [PubMed] [Google Scholar]
- 27.Mesin L, Ersching J & Victora GD Germinal Center B Cell Dynamics. Immunity 45, 471–482 (2016). [DOI] [PMC free article] [PubMed] [Google Scholar]
- 28.Gitlin AD, Shulman Z & Nussenzweig MC Clonal selection in the germinal centre by regulated proliferation and hypermutation. Nature 509, 637–640 (2014). [DOI] [PMC free article] [PubMed] [Google Scholar]
- 29.Finkin S, Hartweger H, Oliveira TY, Kara EE & Nussenzweig MC Protein Amounts of the MYC Transcription Factor Determine Germinal Center B Cell Division Capacity. Immunity 51, 324–336 e325 (2019). [DOI] [PMC free article] [PubMed] [Google Scholar]
- 30.Vervoorts J, Luscher-Firzlaff J & Luscher B The ins and outs of MYC regulation by posttranslational mechanisms. J Biol Chem 281, 34725–34729 (2006). [DOI] [PubMed] [Google Scholar]
- 31.Yao S, Fan LY & Lam EW The FOXO3-FOXM1 axis: A key cancer drug target and a modulator of cancer drug resistance. Semin Cancer Biol 50, 77–89 (2018). [DOI] [PMC free article] [PubMed] [Google Scholar]
- 32.Ersching J et al. Germinal Center Selection and Affinity Maturation Require Dynamic Regulation of mTORC1 Kinase. Immunity 46, 1045–1058 e1046 (2017). [DOI] [PMC free article] [PubMed] [Google Scholar]
- 33.Gitlin AD et al. HUMORAL IMMUNITY. T cell help controls the speed of the cell cycle in germinal center B cells. Science 349, 643–646 (2015). [DOI] [PMC free article] [PubMed] [Google Scholar]
- 34.Vitale I, Galluzzi L, Castedo M & Kroemer G Mitotic catastrophe: a mechanism for avoiding genomic instability. Nat Rev Mol Cell Biol 12, 385–392 (2011). [DOI] [PubMed] [Google Scholar]
- 35.Kuppers R & Dalla-Favera R Mechanisms of chromosomal translocations in B cell lymphomas. Oncogene 20, 5580–5594 (2001). [DOI] [PubMed] [Google Scholar]
- 36.Clark MR, Mandal M, Ochiai K & Singh H Orchestrating B cell lymphopoiesis through interplay of IL-7 receptor and pre-B cell receptor signalling. Nat Rev Immunol 14, 69–80 (2014). [DOI] [PMC free article] [PubMed] [Google Scholar]
- 37.Zhang L, Reynolds TL, Shan X & Desiderio S Coupling of V(D)J recombination to the cell cycle suppresses genomic instability and lymphoid tumorigenesis. Immunity 34, 163–174 (2011). [DOI] [PMC free article] [PubMed] [Google Scholar]
- 38.Khair L et al. ATM increases activation-induced cytidine deaminase activity at downstream S regions during class-switch recombination. J Immunol 192, 4887–4896 (2014). [DOI] [PMC free article] [PubMed] [Google Scholar]
- 39.Schrader CE, Guikema JE, Linehan EK, Selsing E & Stavnezer J Activation-induced cytidine deaminase-dependent DNA breaks in class switch recombination occur during G1 phase of the cell cycle and depend upon mismatch repair. J Immunol 179, 6064–6071 (2007). [DOI] [PubMed] [Google Scholar]
- 40.Petersen S et al. AID is required to initiate Nbs1/gamma-H2AX focus formation and mutations at sites of class switching. Nature 414, 660–665 (2001). [DOI] [PMC free article] [PubMed] [Google Scholar]
- 41.Sharbeen G, Yee CW, Smith AL & Jolly CJ Ectopic restriction of DNA repair reveals that UNG2 excises AID-induced uracils predominantly or exclusively during G1 phase. J Exp Med 209, 965–974 (2012). [DOI] [PMC free article] [PubMed] [Google Scholar]
- 42.Wang Q et al. The cell cycle restricts activation-induced cytidine deaminase activity to early G1. J Exp Med 214, 49–58 (2017). [DOI] [PMC free article] [PubMed] [Google Scholar]
- 43.Storb U Why does somatic hypermutation by AID require transcription of its target genes? Adv Immunol 122, 253–277 (2014). [DOI] [PubMed] [Google Scholar]
- 44.Zan H & Casali P Regulation of Aicda expression and AID activity. Autoimmunity 46, 83–101 (2013). [DOI] [PMC free article] [PubMed] [Google Scholar]
- 45.Stewart I, Radtke D, Phillips B, McGowan SJ & Bannard O Germinal Center B Cells Replace Their Antigen Receptors in Dark Zones and Fail Light Zone Entry when Immunoglobulin Gene Mutations are Damaging. Immunity 49, 477–489 e477 (2018). [DOI] [PMC free article] [PubMed] [Google Scholar]
- 46.Hodson DJ et al. Regulation of normal B-cell differentiation and malignant B-cell survival by OCT2. Proc Natl Acad Sci U S A 113, E2039–2046 (2016). [DOI] [PMC free article] [PubMed] [Google Scholar]
- 47.Vilagos B et al. Essential role of EBF1 in the generation and function of distinct mature B cell types. J Exp Med 209, 775–792 (2012). [DOI] [PMC free article] [PubMed] [Google Scholar]
- 48.Kwon K et al. Instructive role of the transcription factor E2A in early B lymphopoiesis and germinal center B cell development. Immunity 28, 751–762 (2008). [DOI] [PubMed] [Google Scholar]
- 49.Milpied P et al. Human germinal center transcriptional programs are de-synchronized in B cell lymphoma. Nat Immunol 19, 1013–1024 (2018). [DOI] [PubMed] [Google Scholar]
METHODS REFERENCES
- 50.Veselits M et al. Igbeta ubiquitination activates PI3K signals required for endosomal sorting. J Exp Med 214, 3775–3790 (2017). [DOI] [PMC free article] [PubMed] [Google Scholar]
- 51.Dobin A et al. STAR: ultrafast universal RNA-seq aligner. Bioinformatics (Oxford, England) 29, 15–21 (2013). [DOI] [PMC free article] [PubMed] [Google Scholar]
- 52.Liao Y, Smyth GK & Shi W featureCounts: an efficient general purpose program for assigning sequence reads to genomic features. Bioinformatics (Oxford, England) 30, 923–930 (2014). [DOI] [PubMed] [Google Scholar]
- 53.Mandal M et al. CXCR4 signaling directs Igk recombination and the molecular mechanisms of late B lymphopoiesis. Nat Immunol 20, 1393–1403 (2019). [DOI] [PMC free article] [PubMed] [Google Scholar]
- 54.Li H Aligning sequence reads, clone sequences and assembly contigs with BWA-MEM. ArXiv 1303 (2013). [Google Scholar]
- 55.Zhang Y et al. Model-based analysis of ChIP-Seq (MACS). Genome Biol 9, R137 (2008). [DOI] [PMC free article] [PubMed] [Google Scholar]
- 56.Li Q, Brown J, Huang H & Bickel P Measuring reproducibility of high-throughput experiments. Ann Appl Stat 5, 1752–1779 (2011). [Google Scholar]
- 57.Quinlan AR & Hall IM BEDTools: a flexible suite of utilities for comparing genomic features. Bioinformatics (Oxford, England) 26, 841–842 (2010). [DOI] [PMC free article] [PubMed] [Google Scholar]
- 58.Robinson MD, McCarthy DJ & Smyth GK edgeR: a Bioconductor package for differential expression analysis of digital gene expression data. Bioinformatics 26, 139–140 (2010). [DOI] [PMC free article] [PubMed] [Google Scholar]
- 59.Zhou Y et al. Metascape provides a biologist-oriented resource for the analysis of systems-level datasets. Nat Commun 10, 1523 (2019). [DOI] [PMC free article] [PubMed] [Google Scholar]
- 60.Heinz S et al. Simple combinations of lineage-determining transcription factors prime cis-regulatory elements required for macrophage and B cell identities. Mol Cell 38, 576–589 (2010). [DOI] [PMC free article] [PubMed] [Google Scholar]
- 61.Tan H et al. Integrative Proteomics and Phosphoproteomics Profiling Reveals Dynamic Signaling Networks and Bioenergetics Pathways Underlying T Cell Activation. Immunity 46, 488–503 (2017). [DOI] [PMC free article] [PubMed] [Google Scholar]
- 62.Tan H et al. Refined phosphopeptide enrichment by phosphate additive and the analysis of human brain phosphoproteome. Proteomics 15, 500–507 (2015). [DOI] [PMC free article] [PubMed] [Google Scholar]
- 63.Wang H et al. Systematic optimization of long gradient chromatography mass spectrometry for deep analysis of brain proteome. Journal of proteome research 14, 829–838 (2015). [DOI] [PMC free article] [PubMed] [Google Scholar]
- 64.Niu M et al. Extensive Peptide Fractionation and y1 Ion-Based Interference Detection Method for Enabling Accurate Quantification by Isobaric Labeling and Mass Spectrometry. Anal Chem 89, 2956–2963 (2017). [DOI] [PMC free article] [PubMed] [Google Scholar]
- 65.Stewart E et al. Identification of Therapeutic Targets in Rhabdomyosarcoma through Integrated Genomic, Epigenomic, and Proteomic Analyses. Cancer cell 34, 411–426 e419 (2018). [DOI] [PMC free article] [PubMed] [Google Scholar]
- 66.Langfelder P & Horvath S WGCNA: an R package for weighted correlation network analysis. BMC Bioinformatics 9, 559 (2008). [DOI] [PMC free article] [PubMed] [Google Scholar]
- 67.Macosko EZ et al. Highly Parallel Genome-wide Expression Profiling of Individual Cells Using Nanoliter Droplets. Cell 161, 1202–1214 (2015). [DOI] [PMC free article] [PubMed] [Google Scholar]
- 68.Qiu X et al. Single-cell mRNA quantification and differential analysis with Census. Nat Methods 14, 309–315 (2017). [DOI] [PMC free article] [PubMed] [Google Scholar]
- 69.Qiu X et al. Reversed graph embedding resolves complex single-cell trajectories. Nat Methods 14, 979–982 (2017). [DOI] [PMC free article] [PubMed] [Google Scholar]
- 70.Subramanian A et al. Gene set enrichment analysis: a knowledge-based approach for interpreting genome-wide expression profiles. Proc Natl Acad Sci U S A 102, 15545–15550 (2005). [DOI] [PMC free article] [PubMed] [Google Scholar]
Associated Data
This section collects any data citations, data availability statements, or supplementary materials included in this article.
Supplementary Materials
Data Availability Statement
The data that support the findings of this study are available from the corresponding author upon reasonable request. Bulk RNA-Seq, scRNA-Seq, ATAC-Seq, and ChIP-Seq data have been deposited in the Gene Expression Omnibus database. Accession code GSE133743. Reviewers may access these data through a private link: https://www.ncbi.nlm.nih.gov/geo/query/acc.cgi?acc=GSE133743 with the password wrudceucnpirtep. Proteome and phosphoproteome data have been uploaded to ProteomeXchange via the PRIDE database. Project Name: Proteome profiling of mouse germinal center B cells, Project accession: PXD015524. Reviewers may access these data through a private login: Username: reviewer47001@ebi.ac.uk, Password: 3SndljK1. Data from GSE100738 were also analyzed.


