Abstract
Background:
Chemicals found in personal care products and plastics have been associated with asthma, allergies, and lung function, but methods to address real life exposure to mixtures of these chemicals have not been applied to these associations.
Methods:
We quantified urinary concentrations of eleven phthalate metabolites, four parabens, and five other phenols in mothers twice during pregnancy and assessed probable asthma, aeroallergies, and lung function in their age seven children. We implemented Bayesian Profile Regression (BPR) to cluster women by their exposures to these chemicals and tested the clusters for differences in outcome measurements. We used Bayesian Kernel Machine Regression (BKMR) to fit biomarkers into one model as joint independent variables.
Results:
BPR clustered women into seven groups characterized by patterns of personal care product and plastic use, though there were no significant differences in outcomes across clusters. BKMR showed that monocarboxyisooctyl phthalate and 2,4-dichlorophenol were associated with probable asthma (predicted probability of probable asthma per IQR of biomarker z-score (standard deviation) = 0.08 (0.09) and 0.11 (0.12), respectively) and poorer lung function (predicted probability per IQR = −0.07 (0.05) and −0.07 (0.06), respectively), and that mono(3-carboxypropyl) phthalate and bisphenol A were associated with aeroallergies (predicted probability per IQR = 0.13 (0.09) and 0.11 (0.08), respectively). Several biomarkers demonstrated positive additive effects on other associations.
Conclusions:
BPR and BKMR are useful tools to evaluate associations of biomarker concentrations within a mixture of exposure and should supplement single-chemical regression models when data allow.
Keywords: Bayesian Kernel Machine Regression, Bayesian Profile Regression
Graphical Abstract

1. Introduction
Prenatal exposure to some phthalates, parabens, and phenols (or their precursors) has been associated with increased risk of adverse childhood atopic and respiratory outcomes, including asthma (Buckley et al., 2018; Gascon et al., 2015; Jerschow et al., 2014; Larsson et al., 2010; Savage et al., 2014; Spanier et al., 2012; Spanier et al., 2014c; Vernet et al., 2017; Whyatt et al., 2014a; Whyatt et al., 2014b; Zhou et al., 2017), aeroallergies (Clayton et al., 2011; Larsson et al., 2010; Savage et al., 2012; Spanier et al., 2014a), and spirometry (Cakmak et al., 2014; Spanier et al., 2014b; Spanier et al., 2014c). These chemicals are widely used in consumer products, with several of these compounds occurring in the same or similar products, often causing exposures to be correlated. For example, low molecular weight phthalates, parabens, and other phenols are used in personal care products: diethyl phthalate (DEP) and di-isobutyl phthalate (DiBP) have been used in fragrance and scented products (Kelley et al., 2011; Koniecki et al., 2011), dibutyl phthalate (DBP) in nail polish and other cosmetics (Kelley et al., 2011; Koniecki et al., 2011), and parabens as preservatives in cosmetics (Guo and Kannan, 2013; Liao and Kannan, 2014), while triclosan is an antibacterial agent formerly used in soap (Dann and Hontela, 2011) and benzophenone-3 is a sunscreen agent used in many personal care products (Han et al., 2016). 2,4-dichlorophenol is a photo-degradation product of triclosan and an intermediate in pesticide manufacturing (Latch et al., 2005), and 2,5-dichlorophenol the main hydroxylated metabolite of 1,4-dichlorobenzene, which is used in moth balls and room and toilet deodorizers (Wei et al., 2014). Thus, individuals may be exposed to mixtures of several of these compounds based on their personal care product use. High molecular weight phthalates and bisphenol A (BPA) are used in the production of plastics, among other products. High molecular weight phthalates such as di(2-ethylhexyl) phthalate (DEHP) and benzylbutyl phthalate (BBzP) are used to soften plastic products, particularly polychlorinated vinyl, and are used in building materials (Fierens et al., 2012; Kawakami et al., 2011), while BPA is used in the manufacture of hard polycarbonates (Vandenberg et al., 2007). Phthalates, parabens, and other phenols (or their precursors) devolve quickly in the body and are excreted as urinary metabolites.
We previously found that urinary metabolites of several of these chemicals were associated with atopic and respiratory outcomes in children. Maternal prenatal urinary concentrations of monocarboxyisooctyl phthalate (MCOP), a metabolite of di-isononyl phthalate (DiNP), and monocarboxyisononyl phthalate (MCNP), a metabolite of di-isodecyl phthalate (DiDP), were associated with poorer lung function and increased odds of having probable asthma and aeroallergies in children at age seven (Berger et al., 2019), and monoethyl phthalate (MEP), a metabolite of DEP, was associated with poorer lung function (Berger et al., 2018a). Prenatal urinary concentrations of propyl paraben were unexpectedly associated with lower odds of probable asthma.
Although most people are routinely exposed to complex chemical mixtures, few studies have examined health outcomes associated with such exposures. There is currently a recognition that while we are exposed to many chemicals on a daily basis, epidemiologic research has not adequately explored the statistical methods needed to assess chemical mixtures (NIEHS, 2018). In our previous papers, we included several phthalates, parabens, and other phenols as covariates in logistic and linear regressions to control for confounding by multiple exposure biomarkers. However, methods are needed that explore exposure to multiple chemicals together, in addition to simply controlling for them as confounders (Carpenter et al., 2002). The present paper addresses this gap in two ways: the first method groups individuals into clusters based on the urinary concentrations of multiple biomarkers, and the second computes risk for a health outcome as a nonlinear function of urinary concentrations of multiple biomarkers.
Bayesian Profile Regression (BPR) clusters participants into groups based on profiles of joint concentrations of urinary biomarkers of phthalates, parabens, and other phenols (Molitor et al., 2010). For example, some clusters may include people with relatively high concentrations of several biomarkers, while other clusters include those with relatively low concentrations. We can then evaluate how risk of a health outcome varies for individuals in different data-driven clusters.
Bayesian Kernel Machine Regression (BKMR) fits multiple biomarker concentrations into one model as joint independent variables into a nonlinear, flexible kernel function in relation to a health outcome (Bobb JF, 2015). It models each biomarker’s association with the health outcome in the context of the concentrations of all other biomarkers in the model.
BPR has been used in the current study population to examine the associations between exposure to pesticides and childhood neurodevelopment (Coker et al., 2017) and adult obesity (Warner et al., 2018). Several recent studies have applied BKMR methods to phthalates, parabens, or phenols (Bellavia et al., 2019; Hou et al., 2019; Mínguez-Alarcón et al., 2019; Zhang et al., 2019), but this is the first study to use BPR or BKMR to analyze atopic and respiratory outcomes in association with any type of biomarker. To assess the relationship of prenatal exposures to all of these chemicals with childhood atopy, we measured maternal urinary concentrations of eleven phthalate metabolites, four parabens, and five other phenols at two time points during pregnancy and used BPR and BKMR to analyze associations with probable asthma, aeroallergies, and lung function when children were seven.
2. Methods
2.1. CHAMACOS Study.
Participants were mothers and their children in the Center for the Health Assessment of Mothers and Children of Salinas (CHAMACOS) study, a longitudinal study investigating early life exposures to environmental chemicals and a wide range of health outcomes across childhood. Mothers in the Salinas Valley of California, a largely Latino agricultural community, were recruited from participating prenatal clinics in 1999–2000. Women were eligible to participate if they qualified for MediCal (low income health insurance) and were at least 18 years old, less than 20 weeks’ gestation, and planning to deliver at the county hospital. Research protocols were approved by the University of California, Berkeley Office for the Protection of Human Subjects (OPHS). The Centers for Disease Control and Prevention (CDC) deferred to OPHS. Written informed consent was obtained from mothers and verbal assent was obtained from children at age seven. Mothers were interviewed twice during pregnancy (mean ± SD: 14.0 ± 5.0 and 26.9 ± 2.5 weeks gestation), at delivery, and when their child was six months, one year, two years, three and a half years, five years, and seven years old. Urine was collected from mothers at the two prenatal interviews. Of 531 infants born into the study, 392 children had information on both prenatal urinary biomarker concentrations and either probable asthma, aeroallergies, or forced expiratory volume in one second (FEV1) at age seven. However, because BPR and BKMR only analyze complete cases, including covariate data, 319 children were ultimately included in the analyses.
2.2. Outcome definitions.
Outcomes of interest for this analysis were lung function, probable asthma, and aeroallergy when the children were seven years old. Outcome assessment methods are described elsewhere in detail (Berger et al., 2018a; Berger et al., 2019). Briefly, trained research assistants conducted lung function tests on the children at age seven, using EasyOne dry-seal spirometers. Children performed up to eight expiratory maneuvers and the spirometric software kept up to three best acceptable tests. All maneuvers were reviewed and verified by two physicians specializing in pediatric spirometry. FEV1 was measured from each maneuver and the highest measure was used in analysis. For a subset of children with reported respiratory symptoms, a bronchodilator was administered and the child repeated the spirometry 20 minutes later.
At the age seven visit, mothers also answered a detailed questionnaire about their child’s health and respiratory symptoms. We defined “probable asthma” at age seven as currently taking asthma medication or having two or more of the following criteria: any current respiratory symptom, doctor diagnosis of asthma at any age, or a positive bronchodilator test. Cases of aeroallergies were defined as maternal report of any of the following in the last year: 1) a diagnosis of hay fever/rhinitis, 2) runny or itchy eyes apart from colds, or 3) sneezing or a runny nose apart from colds.
2.3. Exposure assessment.
Urine samples were collected from mothers at two interviews during pregnancy (mean ± SD: 14.0 ± 5.0 and 26.9 ± 2.5 weeks gestation). Samples were collected in polypropylene urine cups, aliquoted into glass vials, and stored at −80°C until shipment to the CDC for analysis.
Solid phase extraction coupled with isotope dilution high performance liquid chromatography-electrospray ionization-tandem mass spectrometry was used to quantify concentrations of eleven phthalate metabolites of eight parent compounds: MEP, a metabolite of DEP; mono-n-butyl phthalate [MBP, a metabolite of DBP]; mono-isobutyl phthalate [MiBP, a metabolite of DiBP]; monobenzyl phthalate [MBzP, a metabolite of BBzP]; four metabolites of DEHP [mono-2-ethylhexyl phthalate (MEHP), mono-(2-ethyl-5-hydroxyhexyl) phthalate (MEHHP), mono-(2-ethyl-5-oxohexyl) phthalate (MEOHP), and mono-(2-ethyl-5-carboxypentyl) phthalate (MECCP)]; MCOP, a metabolite of DiNP; MCNP, a metabolite of DiDP; and mono(3-carboxypropyl) phthalate [MCPP, a metabolite of several high molecular weight phthalates and a minor metabolite of dibutyl phthalate]; and nine phenols: methylparaben, butylparaben, propylparaben, triclosan, 2,4-dichlorophenol, 2,5-dichlorophenol, benzophenone-3, and BPA. We dropped butylparaben from the analyses due to low detection frequency. Analytic methods have been published previously for both phthalates (Silva MJ, 2007) and phenols (Ye et al., 2005). Concentrations were reported in ng/mL of urine. Limits of detection (LOD) ranged from 0.2 ng/mL – 2.3 ng/mL. Concentrations below the LOD were assigned the instrumental reading values, if available, or an imputed value below the LOD selected randomly from the log-normal distribution using maximum likelihood estimation(Lubin et al., 2004).
Urinary specific gravity was measured using a hand-held refractometer (National Instrument Company Inc., Baltimore, MD). We corrected for urinary dilution using the formula: (analyte concentration * 0.24)/(sample specific gravity – 1) (Cone et al., 2009). We imputed urinary specific gravity based on urinary creatinine concentrations for 77 women missing specific gravity measurements.
2.4. Statistical analysis.
We used the log2 of the average of the two pregnancy biomarker measurements in all analyses. We examined DEHP as the sum of the four DEHP metabolites: MEHP, MEHHP, MEOHP, and MECPP (∑DEHP)(Berger et al., 2019). We conducted BPR to assign participants into clusters based on their joint biomarker concentration patterns, controlling for maternal age, parity, poverty at baseline, and family history of asthma. BPR clusters individual observations using model averaging with Markov chain Monte Carlo estimation and is based on Dirichlet Process mixture modeling (Molitor et al., 2010). The number of clusters is data-driven, not chosen by the researcher, and is allowed to vary across iterations of the model. We used Analysis of Variance (ANOVA) tests to assess if clusters had significantly different mean biomarker concentrations. We then conducted chi squared tests and ANOVAs to evaluate if clusters differed significantly on frequency of probable asthma and aeroallergy cases, or the mean of FEV1. We also conducted logistic regressions for probable asthma and aeroallergies and a linear regression for FEV1 with cluster assignment as a categorical predictor and with no other variables in the models.
We used BKMR (Bobb JF, 2015) to separately model probable asthma, aeroallergies, and FEV1 as flexible kernel functions of urinary phthalates, parabens, and other phenols, also adjusted for maternal age, parity, poverty at baseline, and family history of asthma. BKMR reduces dimensionality by selecting variables into the model only if they show evidence of an association with the outcome, while penalizing the complexity of the multivariate surface. We used BKMR’s hierarchal variable selection option, which first selects at the group level (group one: phthalates, group two: parabens, group three: other phenols; groups determined by the authors) where each of the three groups is evaluated for its importance in the model; next, biomarkers are selected within their groups. We used this option because a few of our biomarkers were highly correlated within these groups. In sensitivity analyses, we used BKMR’s component-wise variable selection, which does not group biomarkers and performs selection only at the individual level. After variable selection, BKMR outputs Posterior Inclusion Probabilities (PIPs), which rank each group by importance in the model, and each biomarker by importance within its group. As they are probabilities, group PIPs sum to 100, and within each group the individual PIPs sum to 100. A biomarker with high individual and group PIPs can be interpreted as important in the model, while a biomarker with a high individual PIP but a low group PIP is relatively less important. Uncertainty in the variable selection process is then applied to the function estimation. The functions modeled with the selected variables are nonlinear and nonadditive, encapsulating many possible underlying functional forms.
For biomarkers that demonstrated multiplicative interaction in BKMR bivariate plots, we conducted regressions with interaction terms for the two biomarkers, controlling for the same covariates as in BKMR. We did not include other biomarkers in the model.
In further sensitivity analyses, we conducted BKMR for the first and second pregnancy measurements separately.
Both Bayesian analyses were conducted in R (Team, 2013) (Vienna, Austria): BPR with the PReMiuM package (Liverani et al., 2013) (version 3.1.4) and BKMR with the bkmr package (Bobb, 2017) (version 0.2.0). Details on BPR (Hastie et al., 2013; Liverani et al., 2013; Papathomas et al., 2011) and BKMR (Bobb JF, 2015; Coull et al., 2015) have been published previously. ANOVAs, chi squared tests, and regressions were conducted in Stata 14 (College Station, TX).
3. Results
Table 1 shows the characteristics of the study population. Mothers tended to be young (42% were <25 years old), low income (62% were below 100% federal poverty), and already had two or more children (39%). Ten percent of children had a family history of asthma. We classified 33 children (10%) as having probable asthma and 81 (25%) as having aeroallergies at age seven. FEV1 data were available for 282 children at age seven (Mean=1.8 liters (SD=0.5)). The 212 people removed due to missing data tended to be younger and to have lived in the US for less time.
Table 1.
Demographic characteristics of the study population, CHAMACOS Study, Salinas, CA
| Characteristics at time of pregnancy | N (%) |
|
|---|---|---|
| Included in BKMR | Excluded from BKMR | |
| Age | ||
| 18–24 | 135 (42) | 124 (58) |
| 25–29 | 106 (33) | 52 (25) |
| 30–34 | 51 (16) | 27 (13) |
| 35+ | 27 (8) | 9 (4) |
| Household income as a proportion of poverty | ||
| <100% | 198 (62) | 131 (62) |
| 100–200% | 109 (34) | 74 (35) |
| >200% | 12 (4) | 7 (3) |
| Maternal education | ||
| 6th grade or less | 141 (44) | 90 (42) |
| 7th-12th grade | 107 (34) | 85 (40) |
| High school graduate or greater | 71 (22) | 37 (17) |
| Maternal country of birth | ||
| United States | 41 (13) | 30 (14) |
| Mexico | 275 (86) | 173 (82) |
| Other | 3 (1) | 9 (4) |
| Years mother has lived in the United States | ||
| Five or fewer | 148 (46) | 123 (58) |
| Six to ten | 85 (27) | 31 (15) |
| Eleven or more | 86 (27) | 58 (27) |
| Parity | ||
| First child | 102 (32) | 79 (37) |
| Second child | 92 (29) | 71 (33) |
| Third child or greater | 125 (39) | 62 (29) |
| Child’s mother, father, or siblings have asthma history | ||
| No | 288 (90) | 189 (89) |
| Yes | 31 (10) | 23 (11) |
Most biomarkers were detected in over 90% of samples, as shown in Supplemental Table S1. Figure 1 shows correlations for all biomarkers included in these analyses. The most highly correlated biomarkers were 2,4-dichlorophenol and 2,5-dichlorophenol (0.85, P<0.01). Remaining significantly correlated biomarkers ranged from 0.65 (MCNP and MCOP, P<0.01) to 0.11 (propylparaben and MCPP, P=0.05). Most moderate and high correlations were within chemical groups (phthalates, parabens, other phenols), but there were some moderate intergroup correlations as well. Most phthalates, with the exception of MEP, showed moderate correlation with each other and with BPA. The phenols were less strongly correlated, with a moderate correlation between methylparaben and propylparaben, and a strong correlation between the dichlorophenols.
Figure 1.
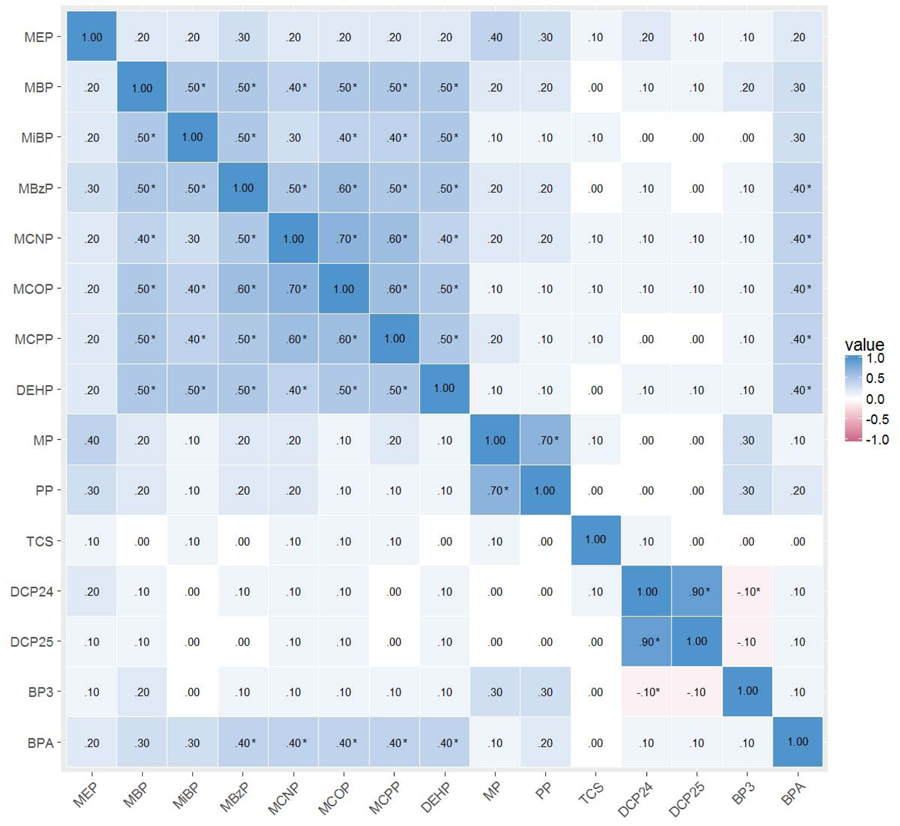
Correlations of log2 specific gravity corrected phthalate, paraben, and other phenol urinary concentrations of CHAMACOS mothers during pregnancy
*P<0.05
3.1. BPR results
The BPR analysis yielded seven clusters, biomarker concentrations for which are shown in Figures 2 (phthalates) and 3 (parabens and other phenols). Cluster three (68 people) was characterized by high concentrations of most phthalates, parabens, and other phenols and the absence of low concentrations, relative to other clusters. Cluster five (45 people) was characterized by the inverse pattern: low concentrations of most biomarkers with no high concentrations, relative to other clusters. Clusters two (26 people) and seven (52 people) were characterized by high concentrations of personal care product biomarkers (low molecular weight phthalates, parabens, and other phenols) and low concentrations of biomarkers of chemicals used to manufacture plastics (high molecular weight phthalates and BPA), relative to other clusters, and cluster six (31 people) was characterized by the inverse pattern: high concentrations of biomarkers of chemicals used in plastics manufacture and low concentrations of personal care product biomarkers, relative to other clusters. Cluster four (51 people) was characterized by low concentrations of all biomarkers except the dichlorophenols and cluster one (46 people) was characterized by high concentrations of all biomarkers except the dichlorophenols, relative to other clusters. ANOVA p-values indicated mean concentrations of all biomarkers except triclosan differed significantly by cluster (Figures 2 and 3).
Figure 2.
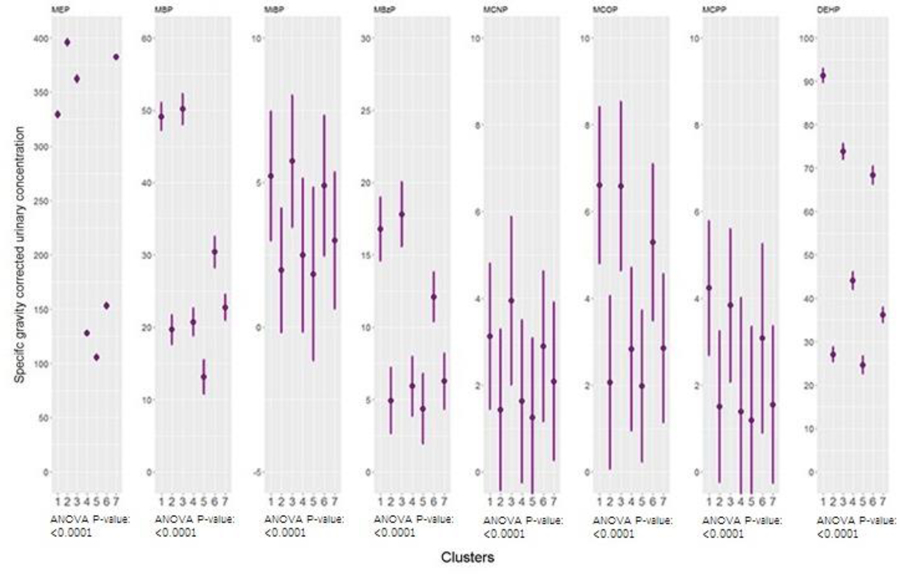
Geometric means and geometric standard deviations of phthalate concentrations across clusters generated by Bayesian Profile Regression
Figure 3.
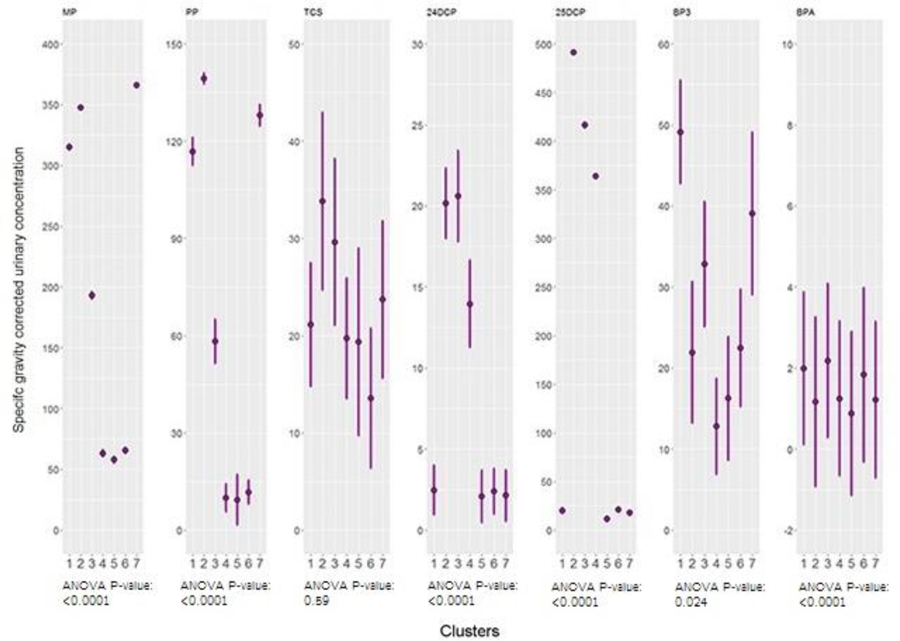
Geometric means and geometric standard deviations of paraben and other phenol concentrations across clusters generated by Bayesian Profile Regression
Table 2 shows summary statistics for each outcome across clusters and associations between cluster membership and each outcome. Chi squared tests indicated that cluster membership was not related to odds of having probable asthma, to FEV1, or aeroallergies. However, cluster three, characterized by relatively high concentrations of all biomarkers, exhibited the lowest average FEV1 volume when compared to the reference group of cluster five with the lowest exposure. Cluster five was chosen as the reference cluster because it was categorized by low concentrations of chemicals relative to other clusters. Regressing probable asthma, aeroallergies, and FEV1 on cluster assignment as a categorical predictor yielded no significant associations.
Table 2.
Frequency of probable asthma and aeroallergy cases and mean FEV1 volume by cluster, and associations of BPR cluster assignment with each outcome
| Probable asthma | Allergy | FEV1 | |||||||
|---|---|---|---|---|---|---|---|---|---|
| Clusters | N | Frequency of cases (% of cluster) | OR (95% CI) | Frequency of cases (% of cluster) | OR (95% CI) | Clusters | N | Mean (standard deviation) | OR (95% CI) |
| 1 | 46 | 4 (9%) | 0.62 (0.16, 2.36) | 12 (46%) | 1.41 (0.53, 3.77) | 1 | 43 | 1.75 (0.46) | 0.00 (−0.21, 0.21) |
| 2 | 26 | 1 (4%) | 0.26 (0.03, 2.29) | 3 (12%) | 0.52 (0.13, 2.13) | 2 | 21 | 1.86 (0.44) | 0.12 (−0.14, 0.38) |
| 3 | 68 | 9 (13%) | 0.99 (0.33, 3.01) | 22 (32%) | 1.91 (0.79, 4.66) | 3 | 57 | 1.73 (0.53) | −0.02 (−0.21, 0.18) |
| 4 | 51 | 6 (12%) | 0.87 (0.26, 2.91) | 11 (22%) | 1.10 (0.41, 2.96) | 4 | 47 | 1.88 (0.45) | 0.14 (−0.07, 0.34) |
| 5 | 45 | 6 (13%) | Ref | 9 (20%) | Ref | 5 | 42 | 1.74 (0.51) | Ref |
| 6 | 31 | 3 (10%) | 0.70 (0.16, 3.02) | 10 (32%) | 1.90 (0.67, 5.44) | 6 | 27 | 1.81 (0.51) | 0.07 (−0.17, 0.31) |
| 7 | 52 | 4 (8%) | 0.54 (0.14, 2.06) | 14 (27%) | 1.47 (0.57, 3.82) | 7 | 46 | 1.96 (0.49) | 0.22 (0.01, 0.42) |
| Total | 319 | Chi2=2.88, P=0.82 | Chi2=6.30, P=0.39 | Total | 283 | ANOVA P=0.19 | |||
p<0.1
p<0.05
p<0.01
OR models control for maternal age, parity, poverty index at baseline, and child’s family history of asthma
3.2. BKMR results
The BKMR program determined that all 15 biomarkers were to be included in models for each outcome. Overall, PIPs from the BKMR models indicated that the phthalate group was most influential for probable asthma and FEV1, but that the other phenols group was most influential for aeroallergies (Table 3).
Table 3.
Posterior Inclusion Probabilities (PIP) for all phthalate biomarkers, parabens, other phenols, included in Bayesian Kernel Machine Regression
| Probable asthma |
FEV1 |
Aeroallergy |
|||||||||
|---|---|---|---|---|---|---|---|---|---|---|---|
| Group PIP | Individual PIP | Group PIP | Individual PIP | Group PIP | Individual PIP | ||||||
| Phthalates | 0.54188 | MCOP | 0.47427 | Phthalates | 0.45288 | MCOP | 0.55379 | Other phenols | 0.5176 | BPA | 0.69181 |
| MCNP | 0.30915 | MBzP | 0.13752 | BP3 | 0.09915 | ||||||
| MCPP | 0.0871 | MCNP | 0.09468 | TCS | 0.08006 | ||||||
| MEP | 0.03816 | MEP | 0.08055 | 2,5-DCP | 0.06801 | ||||||
| MBzP | 0.03624 | MCPP | 0.06068 | 2,4-DCP | 0.06097 | ||||||
| MiBP | 0.02443 | MBP | 0.02826 | Phthalates | 0.50164 | MCPP | 0.43896 | ||||
| ∑DEHP | 0.01558 | MiBP | 0.02226 | MCOP | 0.13803 | ||||||
| MBP | 0.01506 | ∑DEHP | 0.02226 | MCNP | 0.13077 | ||||||
| Parabens | 0.49968 | PP | 0.82213 | Other phenols | 0.18932 | 2,4-DCP | 0.29411 | MEP | 0.11722 | ||
| MP | 0.17787 | TCS | 0.27699 | ∑DEHP | 0.05303 | ||||||
| Other phenols | 0.42688 | TCS | 0.44584 | 2,5-DCP | 0.25121 | MBP | 0.04665 | ||||
| 2,5-DCP | 0.2038 | BPA | 0.09085 | MBzP | 0.03859 | ||||||
| BP3 | 0.16763 | BP3 | 0.08684 | MiBP | 0.03676 | ||||||
| 2,4-DCP | 0.12369 | Parabens | 0.0842 | PP | 0.54632 | Parabens | 0.25888 | MP | 0.56505 | ||
| BPA | 0.05903 | MP | 0.45368 | PP | 0.43495 | ||||||
BKMR outputs univariate plots, bivariate plots, and cumulative plots. The univariate plots (Figures 4, 7, and 9) represent the predicted probability of a health outcome as a function of exposures to all included biomarkers, with each subplot focusing on the association of a particular biomarker with others held at their medians. The x-axis of each univariate plot represents the z-score of the biomarker’s concentration and the y-axis of each univariate plot represents the predicted probability of the health outcome. While the main advantage to these plots is their visualization of nonparametric overall trends, Table 4 attempts to summarize them for those more familiar with point estimates. It shows the predicted probability of each outcome associated with an IQR increase in each biomarker z-score, with all other biomarkers held at their medians. The data points in Table 4 come from the same data frame that generates the univariate plots. BKMR’s bivariate plots (Supplemental Figures 1–3) use the function of predicted probability to examine the relationship between each biomarker and an outcome as the concentration of a second biomarker increases in quantiles, while holding all additional biomarkers at their medians. These plots can show additive or multiplicative effects of mixtures of biomarkers. Biomarkers listed along the right side of the bivariate figures are represented in rows as the plots of their associations with the health outcome. Biomarkers listed at the top of the bivariate figures are represented in columns as five colored lines, each a different quantile of its concentration. Thus, within each bivariate plot, one can see the association between one biomarker and the outcome at different concentrations of a second biomarker. Cumulative plots (Figures 6, 8, and 11) show the predicted probability of the outcome associated with increasing quantiles of the total concentration of all biomarkers.
Figure 4.
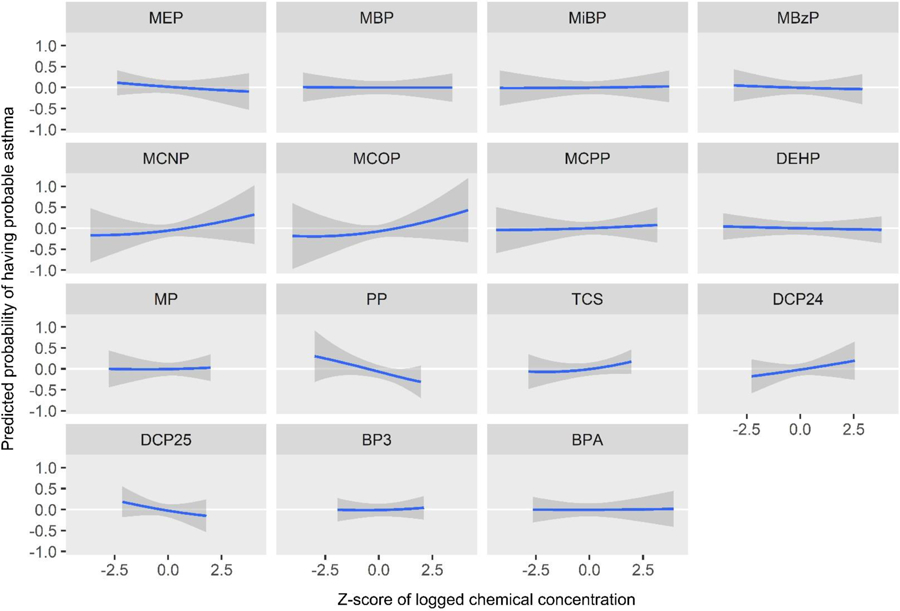
Predicted probability of having probable asthma by z-score of log2 biomarker concentrations, holding all other biomarkers at their medians
Figure 7.
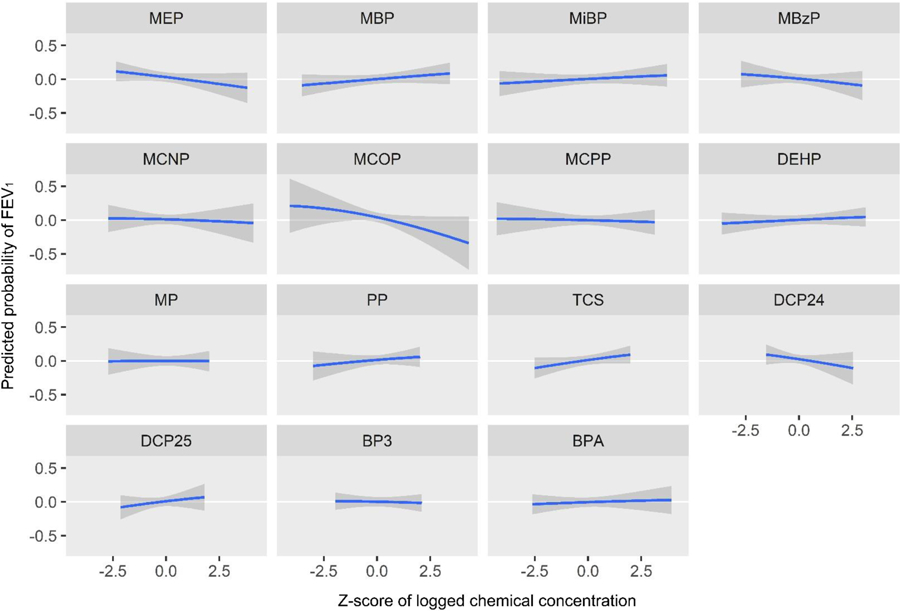
Predicted probability of FEV1 volume by z-score of log2 biomarker concentrations, holding all other biomarkers at their medians
Figure 9.
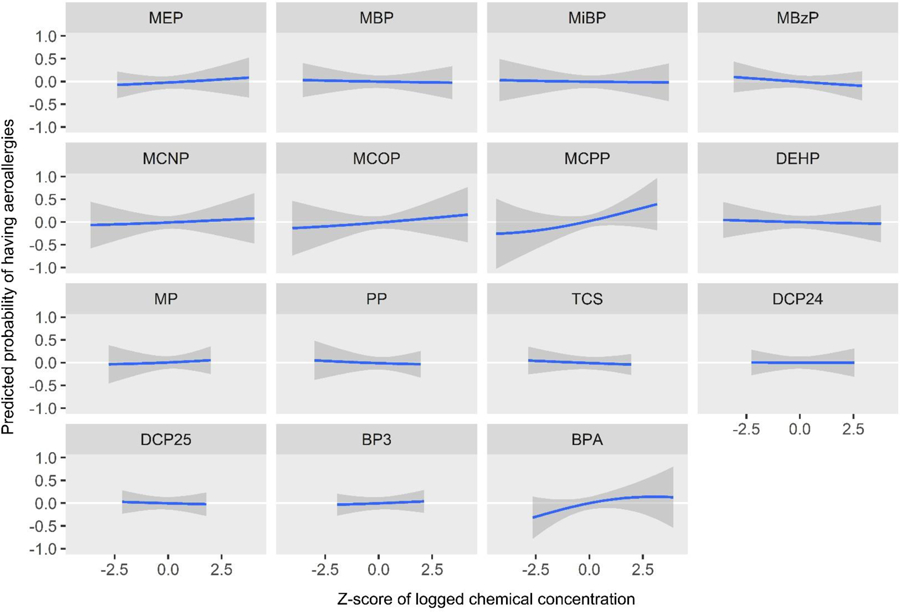
Predicted probability of having aeroallergies by z-score of log2 biomarker concentrations, holding all other biomarkers at their medians
Table 4.
Change in predicted probability of outcomes per Interquartile Range (IQR) of biomarker urinary concentration z-score, as reflected in univariate BKMR plots
| Probable asthma |
FEV1 |
Aeroallergies |
||||
|---|---|---|---|---|---|---|
| Predicted probability per IQR | (Standard deviation) | Predicted probability per IQR | (Standard deviation) | Predicted probability per IQR | (Standard deviation) | |
| MEP | −0.05 | (0.07) | −0.05 | (0.04) | 0.03 | (0.07) |
| MBP | 0.00 | (0.05) | 0.03 | (0.03) | −0.01 | (0.06) |
| MiBP | 0.01 | (0.06) | 0.02 | (0.03) | −0.01 | (0.07) |
| MBzP | −0.02 | (0.08) | −0.04 | (0.05) | −0.04 | (0.07) |
| MCNP | 0.07 | (0.09) | −0.01 | (0.04) | 0.02 | (0.08) |
| MCOP | 0.08 | (0.09) | −0.07 | (0.05) | 0.04 | (0.08) |
| MCPP | 0.02 | (0.08) | −0.01 | (0.03) | 0.13 | (0.09) |
| ∑DEHP | −0.01 | (0.05) | 0.02 | (0.03) | −0.01 | (0.06) |
| MP | 0.01 | (0.10) | 0.00 | (0.05) | 0.03 | (0.10) |
| PP | −0.18 | (0.11) | 0.03 | (0.05) | −0.02 | (0.09) |
| TCS | 0.10 | (0.09) | 0.06 | (0.04) | −0.03 | (0.07) |
| 2,4-DCP | 0.11 | (0.12) | −0.07 | (0.06) | 0.00 | (0.08) |
| 2,5-DCP | −0.15 | (0.16) | 0.07 | (0.08) | −0.02 | (0.10) |
| BP3 | 0.02 | (0.10) | −0.01 | (0.04) | 0.03 | (0.08) |
| BPA | 0.00 | (0.06) | 0.01 | (0.03) | 0.11 | (0.08) |
Abbreviations: BPA: Bisphenol A, 2,4-DCP: 2,4-dichlorophenol, 2,5-DCP: 2,5-dichlorophenol, BP3: benzophenone-3, DEHP: di(2-ethylhexyl) phthalate, FEV1: forced expiratory volume in one second, MBP: mono-n-butyl phthalate, MBzP: monobenzyl phthalate, MCNP: monocarboxyisononyl phthalate, MCOP: monocarboxyisooctyl phthalate, MCPP: mono(3-carboxypropyl) phthalate, MEP: monoethyl phthalate, MiBP: mono-isobutyl phthalate, MP: methylparaben, PP: propylparaben, TCS: triclosan
Figure 6.
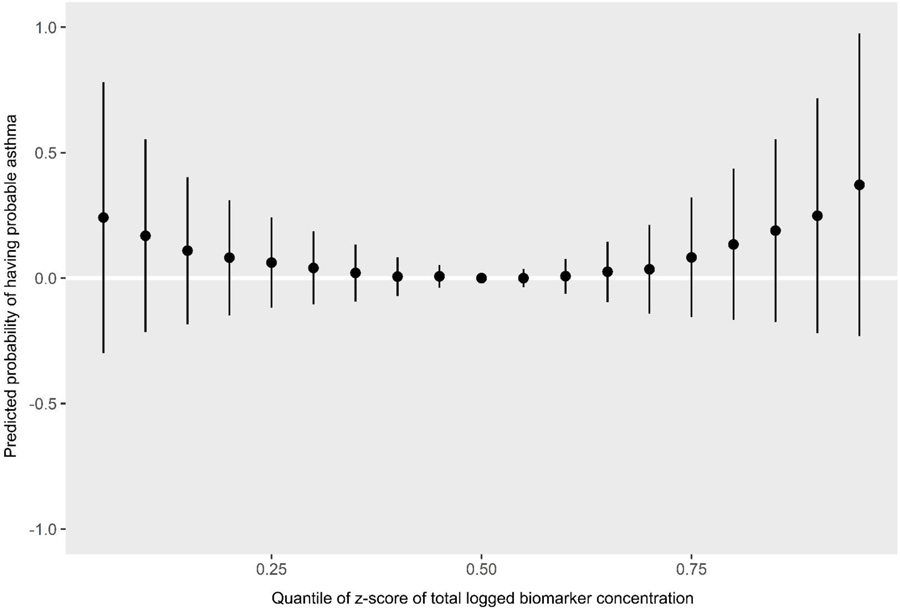
Predicted probability of having probable asthma by quantiles of total biomarker concentration z-scores
Figure 8.
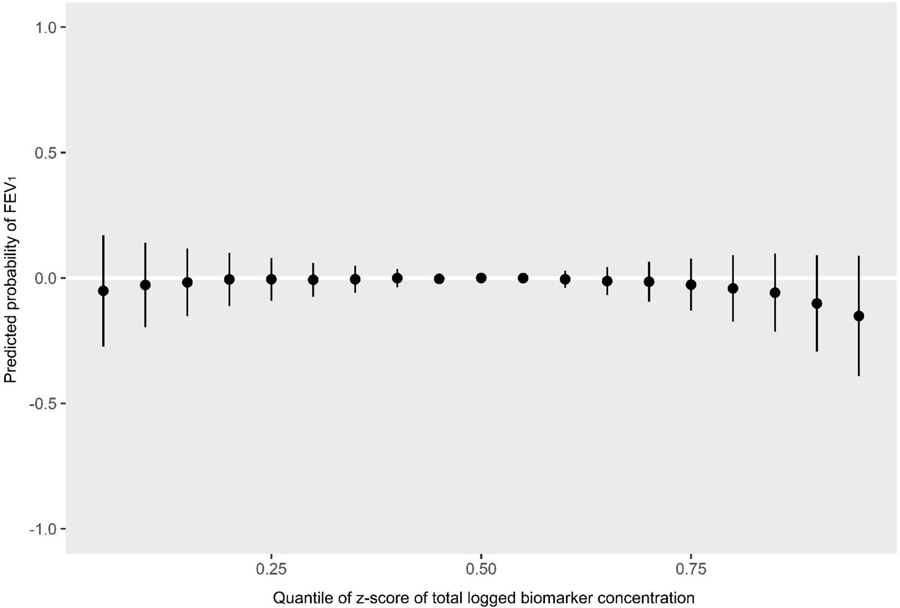
Predicted probability of FEV1 by quantiles of total biomarker concentration z-scores
Figure 11.
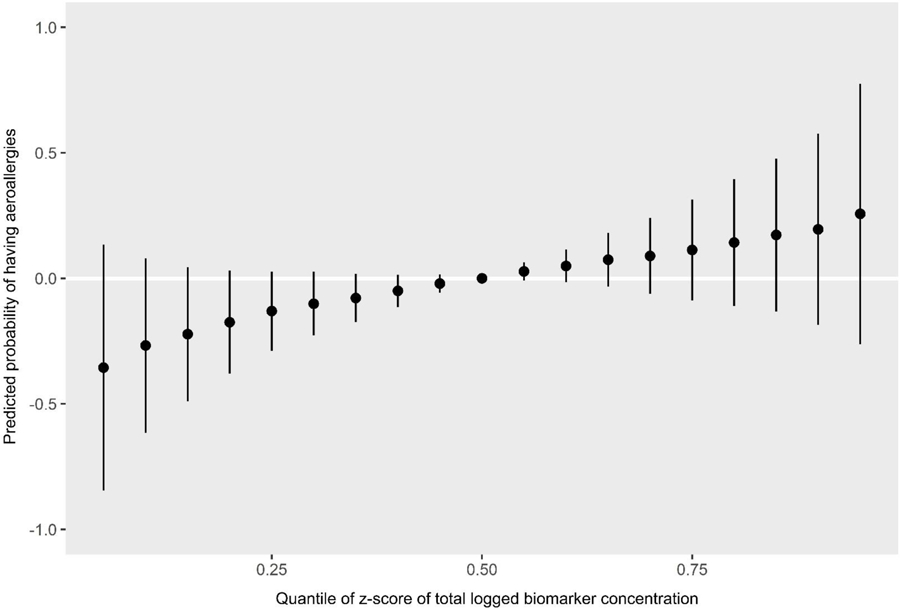
Predicted probability of having aeroallergies by quantiles of total biomarker concentration z-scores
The PIPs indicate that MCOP, MCNP, propylparaben, and triclosan were the most influential biomarkers for probable asthma (Table 3). The univariate plots for probable asthma show that propylparaben (predicted probability per IQR of biomarker z-score = −0.18 (standard deviation = 0.11)), along with 2,5-dichlorophenol (predicted probability per IQR = −0.15 (0.16)), appear to have strong negative (protective) relationships, while MCOP (predicted probability per IQR = 0.08 (0.09)), MCNP (predicted probability per IQR = 0.07 (0.09)) and 2,4-dichlorophenol (predicted probability per IQR = 0.11 (0.12)) appear to have strong positive relationships (Figure 4, Table 4). Although triclosan was ranked highly in the PIPs for probable asthma, it only shows a slight positive relationship in the univariate plot (predicted probability per IQR = 0.10 (0.09)). This may be because it has a positive slope relative to many other biomarkers in the plot (e.g. MEP and BPA), and has relatively narrow credible intervals, unlike MCNP. Bivariate plots, which allow investigation of additive and multiplicative interactions between pairs of biomarkers while holding all others constant, are shown in Supplemental Figure 1 for probable asthma. Propylparaben appears to have a negative additive effect on associations of all other biomarkers for probable asthma: as propylparaben increases in quantiles of concentration as seen in the colored lines, the intercepts of other biomarkers decrease while their slopes stay the same (propylparaben and ∑DEHP are included as an example in Figure 5). 2,5-Dichlorophenol also appears to have a negative additive effect, while MCOP, MCNP, triclosan, and 2,4-dichlorophenol appear to have slight positive additive effects. The cumulative plot reflects both the protective and harmful associations seen in the univariate plots. The elevated risk at the lower quantiles is likely due to the associations seen with propylparaben and 2,5-DCP, whereas the elevated risk at the higher quantiles is likely due to those seen with MCNP, MCOP, and 2,4-DCP (Figure 6).
Figure 5.
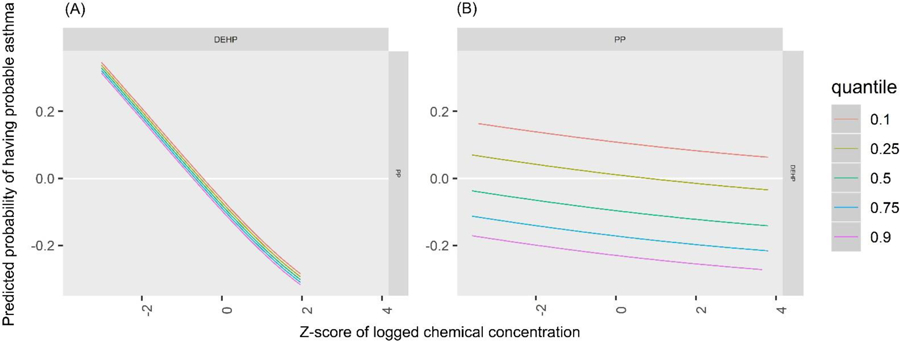
Predicted probability of having probable asthma by z-score of (A) ∑DEHP by quantiles of PP and (B) PP by quantiles of ∑DEHP
MCOP and 2,4-dichlorophenol had the highest PIPs for FEV1 (Table 3). Propylparaben and methylparaben both had high individual PIPs (which only indicates they were weighted relatively equally as there are only two biomarkers in the paraben group), however their group PIP was low which indicates relatively low importance in the model. The univariate BKMR plots for FEV1 volume show a strong negative association with MCOP (predicted probability per IQR = −0.07 (0.05)) (Figure 7, Table 4). The univariate plot also shows weaker negative associations with MEP (predicted probability per IQR = −0.05 (0.04)), MBzP (predicted probability per IQR = −0.04 (0.05))), and 2,4-dichlorophenol (predicted probability per IQR = −0.07 (0.06))), and a positive (protective) association with triclosan (predicted probability per IQR = 0.06 (0.04))). In bivariate plots, MCOP and 2,4-dichlorophenol show weak additive effects on the associations of other biomarkers (Supplemental Figure 2). Similar to probable asthma, the cumulative plot for FEV1 reflects both the harmful associations seen with higher concentrations of MCOP and 2,4-DCP and lower concentrations of several other chemicals (Figure 8).
BPA and MCPP were the most influential biomarkers for aeroallergies as shown with PIP rankings (Table 3). In the univariate plots for aeroallergy, MCPP (predicted probability per IQR = 0.13 (0.09)) and BPA (predicted probability per IQR = 0.11 (0.08)) show strong positive (harmful) associations (Figure 9, Table 4). In bivariate plots, MCPP and BPA appear to have positive additive effects on the associations of other biomarkers (Supplemental Figure 3). The plot also suggests an antagonistic interaction between MEP and BPA: each biomarker shows a positive association on its own, but increasing levels of one of these biomarkers appears to attenuate the association of the other. This interaction appears to occur mainly at a z-score of 2 or higher for either chemical, which represents 17 (5%) participants. An enhanced plot of this relationship is shown in Figure 10. To further explore this antagonistic relationship, we conducted a logistic regression model with interaction terms for MEP and BPA, controlling for the same covariates as in BKMR. Odds ratios and confidence intervals for both biomarker concentrations were above 1 (MEP: OR=1.21, 95% CI: 1.01, 1.47; BPA: OR=6.79, 95% CI: 1.84, 25.03), and the odds ratio and confidence interval for their interaction was below 1 (OR=0.82, 95% CI: 0.70, 0.96), again indicating the biomarkers interact antagonistically. The cumulative plot for aeroallergies shows an increasing risk with increasing quantiles of cumulative urinary concentrations of all biomarkers (Figure 11).
Figure 10.
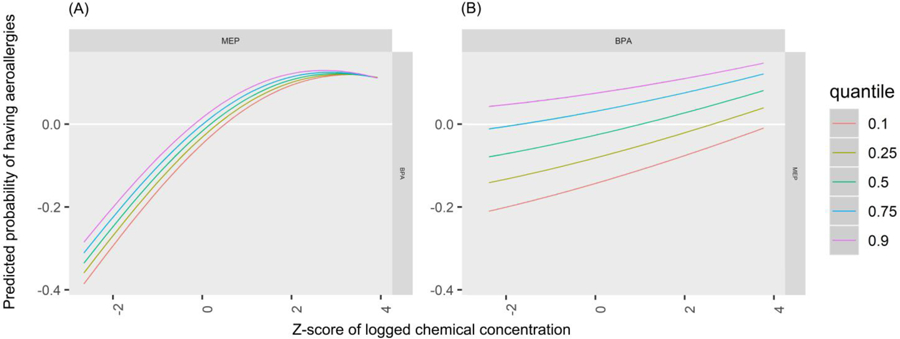
Predicted probability of having aeroallergies by z-score of (A) MEP by quantiles of BPA and (B) BPA by quantiles of MEP
In sensitivity analyses, we used the component-wise variable selection option in BKMR. Results in all plots were similar (not shown). We also examined BKMR associations using the first and second pregnancy measurements separately. Results were mostly similar to the pregnancy-averaged results (Supplementary Figures 4–6), but there are exceptions. MEP at 26 weeks showed a strong protective relationship with probable asthma (Supplementary Figure 4). The associations between FEV1 and PP and BPA are stronger with baseline data only, though the 2,4-DCP association was attenuated. With 26 week data, the association between 2,5-DCP became stronger (Supplemental Figure 5). The association between MCPP and allergy was attenuated with baseline only data, and the association between MBP and allergy at 26 weeks appears protective instead of null. (Supplemental Figure 6).
4. Discussion
We assessed urinary concentrations of multiple phthalate biomarkers, parabens, and other phenols often found in similar consumer products and their relationship to atopic and respiratory outcomes using two different methods: BPR and BKMR. We used BPR to cluster participants into groups based on their prenatal urinary concentrations of phthalates, parabens, and other phenols found in personal care products and plastics. We found that the seven clusters produced by BPR were characterized by patterns consistent with distinct personal care product and plastic use, but no cluster was significantly associated with probable asthma, aeroallergies, or FEV1. We also estimated a flexible kernel function of these biomarker concentrations with the same outcomes using BKMR. The BKMR analysis showed that, within the context of concentrations of all biomarkers, MCOP was associated with increased predicted probability of having probable asthma and with increased predicted probability of having a lower FEV1 volume, as was 2,4-dichlorophenol to a lesser extent. 2,5-dichlorophenol and propylparaben showed associations with a decreased predicted probability of having probable asthma, but did not show an association with FEV1 volume. We also found that MCPP and BPA were associated with increased predicted probability of having aeroallergies. Several biomarkers that showed associations in the univariate plots also showed positive additive effects in bivariate plots, such as 2,4-dichlorophenol with probable asthma and MCPP with aeroallergy, and MEP and BPA showed an antagonistic multiplicative interaction in their relationship to aeroallergy.
The clusters produced by BPR, as well as the relative biomarker concentrations seen within them, are consistent with expected patterns of coexposures. Clusters two and seven, which were higher than other clusters in MEP, methylparaben, and propylparaben, may represent women who use more cosmetics or artificially scented products, as these biomarkers have been associated with use of makeup, lotion, deodorant, and perfume (Berger et al., 2018b; Braun et al., 2014; Meeker et al., 2013; Parlett et al., 2013). Cluster six, higher than other clusters in high molecular weight phthalates and BPA, may represent women with high molecular weight phthalates present in building materials, more use of plastic products, or specific dietary patterns, because diet appears to be an important source of exposure to these compounds (Quiros-Alcala et al., 2013; Zota et al., 2016).
The lack of significant associations in regressions with cluster assignments may reflect limited power to detect relationships once the unit of analysis is the clusters. The number of cases once split across the seven clusters may have been too low to power detecting a relationship. Strong associations of one biomarker may also be diluted by null or negative associtions of other biomarkers that characterize a cluster. Additionally, although the ANOVA p-value indicated clusters did not differ significantly on outcomes, cluster three (characterized by higher concentrations of all biomarkers) had the lowest FEV1 volume, suggesting a possible relationship between respiratory health and high concentrations of many biomarkers.
The BKMR findings confirm the main results seen in our previous papers that looked at associations of these chemicals individually while controlling for additional biomarkers in the logistic and linear regressions (Berger et al., 2018a; Berger et al., 2019). Those analyses similarly found that MCOP, a metabolite of diisononyl phthalate, was associated with increased odds for probable asthma and with poorer lung function, and that propylparaben was associated with decreased odds for probable asthma. BKMR served as a useful tool alongside single-biomarker regression analyses to confirm if individual biomarker associations from traditional regression methods persist when accounting for joint exposure to other biomarkers.
There were several unexpected findings in this data set. The protective associations shown between propylparaben, 2,5-DCP and probable asthma have not been substantiated in previous longitudinal studies on asthma diagnoses (Buckley et al., 2018; Lee-Sarwar et al., 2018; Vernet et al., 2017), though harmful associations have been found between 2,5-DCP and wheezing (Vernet et al., 2017) and asthma attacks (Buckley et al., 2018). The only previous longitudinal study to evaluate triclosan and FEV1 did not find a relationship (Vernet et al., 2017). We are unaware of any biological mechanisms that might explain our findings.
Although the BKMR plots point to trends in how biomarker concentrations are related to atopic and respiratory outcomes, the posterior probability distributions (represented by credible intervals) indicate that these trends may take another form within the credible interval. However, the parameter estimate line provides a useful representation of the most probable overall trend. With 15 biomarkers and three outcomes in this study, these credible intervals should also be interpreted with multiple comparisons in mind.
In bivariate BKMR plots, several biomarkers showed evidence of a positive additive effect when in the presence of other biomarkers. For example, at higher quantiles of MCPP, MEP was associated with even higher probability of aeroallergies while maintaining the slope of its overall positive trend. The biomarkers that showed these additive effects usually also showed an association in univariate plots, suggesting that if a biomarker is strongly associated with an outcome, it may also exert a positive additive effect on the association of other biomarkers and that outcome. Multiplicative, antagonistic interaction was seen in the plots of MEP and BPA in relation to aeroallergy, to the effect that high concentrations of each biomarker appeared to diminish the associations of the other. This was supported by interaction terms in a logistic regression model. There are no other epidemiologic studies on the joint effects of these two biomarkers (or their precursor in the case of MEP) on aeroallergies to compare to, nor are there animal or in vitro studies of this chemical combination to our knowledge. Existing literature on possible immunologic mechanisms of these chemicals does not suggest a biologically antagonistic relationship (Herberth et al., 2017; Maruyama et al., 2007; Tian et al., 2003; Yan et al., 2008), but the interaction has not been specifically studied. It may also be a statistical interaction influenced by confounding present at the extreme concentrations of either biomarker, or it may reflect statistical imprecision at these concentrations as only 17 participants had z-scores in the range the interaction appeared to mainly occur. Multiplicative interactions were not seen between MEP and BPA for the other outcomes.
The cumulative BKMR plots can help describe associations with total exposure to all biomarkers measured in a sample. They can, however, be difficult to interpret if any of the included biomarkers are associated in opposing directions, as seen with MCOP and propylparaben with probable asthma. These plots should likely serve as a compliment to other analytic methods.
In our sensitivity analyses examining the first and second pregnancy measurements separately, several associations changed, but with no apparent consistency. Very few studies have compared multiple measures of these chemicals during pregnancy in relation to asthma, lung function, or aeroallergies. Similar to our analyses, two studies also found a stronger association between respiratory outcomes and BPA earlier in pregnancy rather than later (Spanier et al., 2012; Spanier et al., 2014c), however another study found the opposite trend (Gascon et al., 2015). Our biomarker measurements do demonstrate relatively high variability between pregnancy timepoints: calculated from this cohort, the phthalates have intraclass correlation coefficients ranging from 0.14 to 0.39, while parabens range from 0.41 to 0.46, and the other phenols range from 0.16 to 0.56. Therefore, results differing by timepoints could reflect either criticial susceptibility windows or variation in exposure over pregnancy. Due to the latter possibility, we have more confidence in the pregnancy-averaged results.
One statistical limitation of BKMR is that it holds additional biomarkers at a single level (typically at their medians). However, as evidenced by our BPR results, people may typically have relatively low exposure to some chemicals and high exposure to others simultaneously. Holding all additional biomarkers at one level, therefore, is not a natural simulation of exposures to multiple chemicals.
The concentrations of phthalates, parabens, and other phenols in our data were mostly moderately correlated and are thus more suited to these methods than to inclusion as confounders in traditional regression models, as both BPR and BKMR can better account for collinearity of data. However, moderate correlation between biomarkers could limit power to detect the effect of one biomarker in the context of exposure to others. For example, a subtle association between a biomarker and an outcome may not be apparent in a BKMR univariate plot, and BPR clusters do not allow us to discern the effects of any one biomarker within a cluster.
This study has several strengths. We measured urinary concentrations of biomarkers at two timepoints to help characterize more habitual exposure. Measuring the exposure during pregnancy is also an advantage as prenatal exposure may be more influential on the development of the respiratory system compared to later exposures. Another strength is our dynamic case definition of probable asthma, which was based on both clinical and participant data sources.
Our data show that participants cluster into seven groups based on prenatal urinary concentrations of phthalates, parabens, and other phenols, and that these groups are not significantly related to atopic and respiratory outcomes. Our data also show that MCOP is associated with higher predicted probability of having probable asthma and with lower FEV1 volume, when accounting for exposure to other biomarkers. Clinical implications include that children who were prenatally exposed to MCOP, MCPP, or BPA may be at higher risk of developing respiratory or atopic diseases. Results from the BKMR analysis are similar to those from traditional regression methods but can additionally evaluate how the presence of a mixture of biomarkers influences the associations of any given biomarker.
Supplementary Material
Highlights.
Multiple chemical exposures may interact in a way not shown by traditional analyses
We measured personal care product chemicals and plasticizers in 319 pregnant women
We measured respiratory and atopic outcomes in their children at age seven
Bayesian Profile Regression clustered women into groups consistent with product use
BKMR showed that monocarboxyisooctyl phthalate was related to probable asthma
Acknowledgements:
We would like to acknowledge Manori Silva, Tao Jia, and the late Xiaoyun Ye for their work on biomarker measurement.
This work was supported by the Environmental Protection Agency [grant numbers R82670901, RD83171001] and the National Institute for Environmental Health Sciences [grant numbers P01 ES009605, 1RC2 ES018792, R01 ES021369, R21 ES024909, R24 ES028529]. Funders played no role in study design; in the collection, analysis and interpretation of data; in the writing of the report; or in the decision to submit the article for publication
Disclaimer: The findings and conclusions in this report are those of the authors and do not necessarily represent the official position of the Centers for Disease Control and Prevention (CDC). Use of trade names is for identification only and does not imply endorsement by the CDC, the Public Health Service, or the US Department of Health and Human Services.
Abbreviations:
- DEP
diethyl phthalate
- DiBP
di-isobutyl phthalate
- DBP
dibutyl phthalate
- BPA
Bisphenol A
- DEHP
di(2-ethylhexyl) phthalate
- BBzP
benzylbutyl phthalate
- MCOP
monocarboxyisooctyl phthalate
- DiNP
di-isononyl phthalate
- MCNP
monocarboxyisononyl phthalate
- DiDP
di-isodecyl phthalate
- MEP
monoethyl phthalate
- MBP
mono-n-butyl phthalate
- MiBP
mono-isobutyl phthalate
- MBzP
monobenzyl phthalate
- BPR
Bayesian Profile Regression
- BKMR
Bayesian Kernel Machine Regression
- CHAMACOS
Center for the Health Assessment of Mothers and Children of Salinas
- OPHS
Office for the Protection of Human Subjects
- CDC
Centers for Disease Control and Prevention
- FEV1
forced expiratory volume in one second
- MEHP
mono-2-ethylhexyl phthalate
- MEHHP
mono-(2-ethyl-5-hydroxyhexyl) phthalate
- MEOHP
mono-(2-ethyl-5-oxohexyl) phthalate
- MECCP
mono-(2-ethyl-5-carboxypentyl) phthalate
- MCPP
mono(3-carboxypropyl) phthalate
- LOD
limit of detection
- ANOVA
Analysis of Variance
- PIP
Posterior Inclusion Probability
Footnotes
Publisher's Disclaimer: This is a PDF file of an unedited manuscript that has been accepted for publication. As a service to our customers we are providing this early version of the manuscript. The manuscript will undergo copyediting, typesetting, and review of the resulting proof before it is published in its final form. Please note that during the production process errors may be discovered which could affect the content, and all legal disclaimers that apply to the journal pertain.
Conflict of Interest: none declared.
Declaration of competing interest
The authors declare that they have no known competing financial interests or personal relationships that could have appeared to influence the work reported in this paper.
References
- Bellavia A, Chiu Y-H, Brown FM, Mínguez-Alarcón L, Ford JB, Keller M, et al. Urinary concentrations of parabens mixture and pregnancy glucose levels among women from a fertility clinic. Environmental research 2019; 168: 389–396. [DOI] [PMC free article] [PubMed] [Google Scholar]
- Berger K, Eskenazi B, Balmes J, Holland N, Calafat AM, Harley KG. Associations between prenatal maternal urinary concentrations of personal care product chemical biomarkers and childhood respiratory and allergic outcomes in the CHAMACOS study. Environment international 2018a; 121: 538–549. [DOI] [PMC free article] [PubMed] [Google Scholar]
- Berger K, Eskenazi B, Balmes J, Kogut K, Holland N, Calafat AM, et al. Prenatal high molecular weight phthalates and bisphenol A, and childhood respiratory and allergic outcomes. Pediatric Allergy and Immunology 2019; 30: 36–46. [DOI] [PMC free article] [PubMed] [Google Scholar]
- Berger K, Kogut K, Bradman A, She J, Qi G, Zahedi R, et al. Personal care product use as a predictor of urinary concentrations of certain phthalates, parabens, and phenols in the HERMOSA study. Journal of exposure science & environmental epidemiology 2018b. [DOI] [PMC free article] [PubMed] [Google Scholar]
- Bobb JF. bkmr: Bayesian Kernel Machine Regression. R package version 0.2.0. https://CRAN.R-project.org/package=bkmr 2017.
- Bobb JFVL, Claus Henn B, Christiani DC, Wright RO, Mazumdar M, Godleski JJ, Coull BA. Bayesian kernel machine regression for estimating the health effects of multi-pollutant mixtures. Biostatistics 2015; 16: 493–508. [DOI] [PMC free article] [PubMed] [Google Scholar]
- Braun JM, Just AC, Williams PL, Smith KW, Calafat AM, Hauser R. Personal care product use and urinary phthalate metabolite and paraben concentrations during pregnancy among women from a fertility clinic. Journal of Exposure Science and Environmental Epidemiology 2014; 24: 459–466. [DOI] [PMC free article] [PubMed] [Google Scholar]
- Buckley JP, Quirós-Alcalá L, Teitelbaum SL, Calafat AM, Wolff MS, Engel SM. Associations of prenatal environmental phenol and phthalate biomarkers with respiratory and allergic diseases among children aged 6 and 7 years. Environment international 2018; 115: 79–88. [DOI] [PMC free article] [PubMed] [Google Scholar]
- Cakmak S, Dales RE, Hebbern C, Saravanabhavan G. The association between urinary phthalates and lung function. Journal of occupational and environmental medicine 2014; 56: 376. [DOI] [PMC free article] [PubMed] [Google Scholar]
- Carpenter DO, Arcaro K, Spink DC. Understanding the human health effects of chemical mixtures. Environ Health Perspect 2002; 110 Suppl 1: 25–42. [DOI] [PMC free article] [PubMed] [Google Scholar]
- Clayton EM, Todd M, Dowd JB, Aiello AE. The impact of bisphenol A and triclosan on immune parameters in the U.S. population, NHANES 2003–2006. Environ Health Perspect 2011; 119: 390–6. [DOI] [PMC free article] [PubMed] [Google Scholar]
- Coker E, Gunier R, Bradman A, Harley K, Kogut K, Molitor J, et al. Association between Pesticide Profiles Used on Agricultural Fields near Maternal Residences during Pregnancy and IQ at Age 7 Years. International journal of environmental research and public health 2017; 14: 506. [DOI] [PMC free article] [PubMed] [Google Scholar]
- Cone EJ, Caplan YH, Moser F, Robert T, Shelby MK, Black DL. Normalization of urinary drug concentrations with specific gravity and creatinine. Journal of Analytical Toxicology 2009; 33: 1–7. [DOI] [PubMed] [Google Scholar]
- Coull B, Bobb J, Wellenius G, Kioumourtzoglou M, Mittleman M, Koutrakis P, et al. Part 1. Statistical Learning Methods for the Effects of Multiple Air Pollution Constituents. Research report (Health Effects Institute) 2015: 5–50. [PubMed]
- Dann AB, Hontela A. Triclosan: environmental exposure, toxicity and mechanisms of action. J Appl Toxicol 2011; 31: 285–311. [DOI] [PubMed] [Google Scholar]
- Fierens T, Servaes K, Van Holderbeke M, Geerts L, De Henauw S, Sioen I, et al. Analysis of phthalates in food products and packaging materials sold on the Belgian market. Food and Chemical Toxicology 2012; 50: 2575–2583. [DOI] [PubMed] [Google Scholar]
- Gascon M, Casas M, Morales E, Valvi D, Ballesteros-Gómez A, Luque N, et al. Prenatal exposure to bisphenol A and phthalates and childhood respiratory tract infections and allergy. Journal of Allergy and Clinical Immunology 2015; 135: 370–378. e7. [DOI] [PubMed] [Google Scholar]
- Guo Y, Kannan K. A survey of phthalates and parabens in personal care products from the United States and its implications for human exposure. Environmental science & technology 2013; 47: 14442–14449. [DOI] [PubMed] [Google Scholar]
- Han C, Lim Y-H, Hong Y-C. Ten-year trends in urinary concentrations of triclosan and benzophenone-3 in the general US population from 2003 to 2012. Environmental Pollution 2016; 208: 803–810. [DOI] [PubMed] [Google Scholar]
- Hastie DI, Liverani S, Azizi L, Richardson S, Stücker I. A semi-parametric approach to estimate risk functions associated with multi-dimensional exposure profiles: application to smoking and lung cancer. BMC medical research methodology 2013; 13: 129. [DOI] [PMC free article] [PubMed] [Google Scholar]
- Herberth G, Pierzchalski A, Feltens R, Bauer M, Röder S, Olek S, et al. Prenatal phthalate exposure associates with low regulatory T-cell numbers and atopic dermatitis in early childhood: Results from the LINA mother-child study. Journal of Allergy and Clinical Immunology 2017. [DOI] [PubMed] [Google Scholar]
- Hou J, Yin W, Li P, Huang Y, Wan Y, Hu C, et al. Effect of exposure to phthalates on association of polycyclic aromatic hydrocarbons with 8-hydroxy-2′-deoxyguanosine. Science of The Total Environment 2019; 691: 378–392. [DOI] [PubMed] [Google Scholar]
- Jerschow E, Parikh P, McGinn AP, De Vos G, Jariwala S, Hudes G, et al. Relationship between urine dichlorophenol levels and asthma morbidity. Annals of Allergy, Asthma & Immunology 2014; 112: 511–518. e1. [DOI] [PMC free article] [PubMed] [Google Scholar]
- Kawakami T, Isama K, Matsuoka A. Analysis of phthalic acid diesters, monoester, and other plasticizers in polyvinyl chloride household products in Japan. Journal of Environmental Science and Health, Part A 2011; 46: 855–864. [DOI] [PubMed] [Google Scholar]
- Kelley KE, Hernández-Díaz S, Chaplin EL, Hauser RB, Mitchell AA. Identification of phthalates in medications and dietary supplement formulations in the United States and Canada. 2011. [DOI] [PMC free article] [PubMed]
- Koniecki D, Wang R, Moody RP, Zhu J. Phthalates in cosmetic and personal care products: concentrations and possible dermal exposure. Environmental research 2011; 111: 329–336. [DOI] [PubMed] [Google Scholar]
- Larsson M, Hägerhed-Engman L, Kolarik B, James P, Lundin F, Janson S, et al. PVC–as flooring material–and its association with incident asthma in a Swedish child cohort study. Indoor Air 2010; 20: 494–501. [DOI] [PubMed] [Google Scholar]
- Latch DE, Packer JL, Stender BL, VanOverbeke J, Arnold WA, McNeill K. Aqueous photochemistry of triclosan: Formation of 2, 4-dichlorophenol, 2, 8-dichlorodibenzo-p-dioxin, and oligomerization products. Environmental Toxicology and Chemistry 2005; 24: 517–525. [DOI] [PubMed] [Google Scholar]
- Lee-Sarwar K, Hauser R, Calafat AM, Ye X, O’Connor GT, Sandel M, et al. Prenatal and early-life triclosan and paraben exposure and allergic outcomes. Journal of Allergy and Clinical Immunology 2018; 142: 269–278. e15. [DOI] [PMC free article] [PubMed] [Google Scholar]
- Liao C, Kannan K. Concentrations and composition profiles of parabens in currency bills and paper products including sanitary wipes. Science of The Total Environment 2014; 475: 8–15. [DOI] [PubMed] [Google Scholar]
- Liverani S, Hastie DI, Azizi L, Papathomas M, Richardson S. PReMiuM: an R package for profile regression mixture models using Dirichlet processes. arXiv preprint arXiv:1303.2836 2013. [DOI] [PMC free article] [PubMed]
- Lubin JH, Colt JS, Camann D, Davis S, Cerhan JR, Severson RK, et al. Epidemiologic evaluation of measurement data in the presence of detection limits. Environ Health Perspect 2004; 112: 1691–6. [DOI] [PMC free article] [PubMed] [Google Scholar]
- Maruyama T, Shiba T, Iizuka H, Matsuda T, Kurohane K, Imai Y. Effects of Phthalate Esters on Dendritic Cell Subsets and Interleukin-4 Production in Fluorescein Isothiocyanate-Induced Contact Hypersensitivity. Microbiology and immunology 2007; 51: 321–326. [DOI] [PubMed] [Google Scholar]
- Meeker JD, Cantonwine DE, Rivera-Gonzalez LO, Ferguson KK, Mukherjee B, Calafat AM, et al. Distribution, variability, and predictors of urinary concentrations of phenols and parabens among pregnant women in Puerto Rico. Environ Sci Technol 2013; 47: 3439–47. [DOI] [PMC free article] [PubMed] [Google Scholar]
- Mínguez-Alarcón L, Messerlian C, Bellavia A, Gaskins AJ, Chiu Y-H, Ford JB, et al. Urinary concentrations of bisphenol A, parabens and phthalate metabolite mixtures in relation to reproductive success among women undergoing in vitro fertilization. Environment international 2019; 126: 355–362. [DOI] [PMC free article] [PubMed] [Google Scholar]
- Molitor J, Papathomas M, Jerrett M, Richardson S. Bayesian profile regression with an application to the National Survey of Children’s Health. Biostatistics 2010; 11: 484–98. [DOI] [PubMed] [Google Scholar]
- NIEHS. NIEHS Strategic Plan 2018–2023: Advancing Environmental Health Science, Improving Health. 2018.
- Papathomas M, Molitor J, Richardson S, Riboli E, Vineis P. Examining the joint effect of multiple risk factors using exposure risk profiles: lung cancer in nonsmokers. Environmental health perspectives 2011; 119: 84. [DOI] [PMC free article] [PubMed] [Google Scholar]
- Parlett LE, Calafat AM, Swan SH. Women’s exposure to phthalates in relation to use of personal care products. Journal of Exposure Science and Environmental Epidemiology 2013; 23: 197–206. [DOI] [PMC free article] [PubMed] [Google Scholar]
- Quiros-Alcala L, Eskenazi B, Bradman A, Ye X, Calafat AM, Harley K. Determinants of urinary bisphenol A concentrations in Mexican/Mexican--American pregnant women. Environ Int 2013; 59: 152–60. [DOI] [PMC free article] [PubMed] [Google Scholar]
- Savage JH, Johns CB, Hauser R, Litonjua AA. Urinary triclosan levels and recent asthma exacerbations. Annals of Allergy, Asthma & Immunology 2014; 112: 179–181. e2. [DOI] [PubMed] [Google Scholar]
- Savage JH, Matsui EC, Wood RA, Keet CA. Urinary levels of triclosan and parabens are associated with aeroallergen and food sensitization. J Allergy Clin Immunol 2012; 130: 453–60 e7. [DOI] [PMC free article] [PubMed] [Google Scholar]
- Silva MJSE, Preau JL Jr, Reidy JA, Needham LL, Calafat AM. Quantification of 22 phthalate metabolites in human urine. Journal of Chromatography 2007: 106–112. [DOI] [PubMed] [Google Scholar]
- Spanier AJ, Fausnight T, Camacho TF, Braun JM. The associations of triclosan and paraben exposure with allergen sensitization and wheeze in children Allergy and Asthma Proceedings. 35 OceanSide Publications, Inc, 2014a, pp. 475–481. [DOI] [PMC free article] [PubMed] [Google Scholar]
- Spanier AJ, Fiorino EK, Trasande L. Bisphenol A exposure is associated with decreased lung function. The Journal of pediatrics 2014b; 164: 1403–1408. e1. [DOI] [PMC free article] [PubMed] [Google Scholar]
- Spanier AJ, Kahn RS, Kunselman AR, Hornung R, Xu Y, Calafat AM, et al. Prenatal exposure to bisphenol A and child wheeze from birth to 3 years of age. Environmental health perspectives 2012; 120: 916. [DOI] [PMC free article] [PubMed] [Google Scholar]
- Spanier AJ, Kahn RS, Kunselman AR, Schaefer EW, Hornung R, Xu Y, et al. Bisphenol a exposure and the development of wheeze and lung function in children through age 5 years. JAMA pediatrics 2014c; 168: 1131–1137. [DOI] [PMC free article] [PubMed] [Google Scholar]
- Team RC. R: A language and environment for statistical computing. 2013.
- Tian X, Takamoto M, Sugane K. Bisphenol A promotes IL-4 production by Th2 cells. International archives of allergy and immunology 2003; 132: 240–247. [DOI] [PubMed] [Google Scholar]
- Vandenberg LN, Hauser R, Marcus M, Olea N, Welshons WV. Human exposure to bisphenol A (BPA). Reprod Toxicol 2007; 24: 139–77. [DOI] [PubMed] [Google Scholar]
- Vernet C, Pin I, Giorgis-Allemand L, Philippat C, Benmerad M, Quentin J, et al. In Utero Exposure to Select Phenols and Phthalates and Respiratory Health in Five-Year-Old Boys: A Prospective Study. Environmental Health Perspectives 2017; 125: 097006. [DOI] [PMC free article] [PubMed] [Google Scholar]
- Warner M, Rauch S, Coker ES, Harley K, Kogut K, Sjödin A, et al. Obesity in relation to serum persistent organic pollutant concentrations in CHAMACOS women. Environmental Epidemiology 2018; 2: e032. [DOI] [PMC free article] [PubMed] [Google Scholar]
- Wei Y, Zhu J, Nguyen A. Urinary concentrations of dichlorophenol pesticides and obesity among adult participants in the US National Health and Nutrition Examination Survey (NHANES) 2005–2008. International journal of hygiene and environmental health 2014; 217: 294–299. [DOI] [PubMed] [Google Scholar]
- Whyatt RM, Perzanowski MS, Just AC, Rundle AG, Donohue KM, Calafat AM, et al. Asthma in inner-city children at 5–11 years of age and prenatal exposure to phthalates: the Columbia Center for Children’s Environmental Health Cohort. 2014a. [DOI] [PMC free article] [PubMed]
- Whyatt RM, Rundle AG, Perzanowski MS, Just AC, Donohue KM, Calafat AM, et al. Prenatal phthalate and early childhood bisphenol A exposures increase asthma risk in inner-city children. The Journal of allergy and clinical immunology 2014b; 134: 1195. [DOI] [PMC free article] [PubMed] [Google Scholar]
- Yan H, Takamoto M, Sugane K. Exposure to bisphenol A prenatally or in adulthood promotes TH2 cytokine production associated with reduction of CD4+ CD25+ regulatory T cells. Environmental health perspectives 2008; 116: 514. [DOI] [PMC free article] [PubMed] [Google Scholar]
- Ye X, Kuklenyik Z, Needham LL, Calafat AM. Automated on-line column-switching HPLC-MS/MS method with peak focusing for the determination of nine environmental phenols in urine. Anal Chem 2005; 77: 5407–13. [DOI] [PubMed] [Google Scholar]
- Zhang Y, Dong T, Hu W, Wang X, Xu B, Lin Z, et al. Association between exposure to a mixture of phenols, pesticides, and phthalates and obesity: Comparison of three statistical models. Environment international 2019; 123: 325–336. [DOI] [PubMed] [Google Scholar]
- Zhou A, Chang H, Huo W, Zhang B, Hu J, Xia W, et al. Prenatal exposure to bisphenol A and risk of allergic diseases in early life. Pediatric Research 2017; 81: 851–856. [DOI] [PubMed] [Google Scholar]
- Zota AR, Phillips CA, Mitro SD. Recent fast food consumption and bisphenol A and phthalates exposures among the US population in NHANES, 2003–2010. Environmental health perspectives 2016; 124: 1521. [DOI] [PMC free article] [PubMed] [Google Scholar]
Associated Data
This section collects any data citations, data availability statements, or supplementary materials included in this article.


