

Abstract
This study was carried out to investigate storage-associated changes in the fatty acid profile (with GC and 1H-NMR techniques) of oat-based gluten-free cookies prepared with different fats: margarine (MAR), butter (BUT), lard (LAR), refined palm oil (RPO), refined palm oil with stearin (RPOS), and hydrogenated palm oil (HPO). GC analysis indicated that palmitic and stearic acid were the predominant saturated fatty acids (SFAs), regardless of the type of fat used. cis-Oleic acid represented the major monounsaturated fatty acid (MUFA), while cis-linoleic acid was the most abundant polyunsaturated fatty acid (PUFA). After 6 months of storage, a significant decreasing trend in SFA concentration was observed for LAR and RPOS cookies, while a decrease in MUFA concentration was observed only for HPO cookies. In fresh cookies and in cookies stored for 6 months, the contents of SFA, MUFA, and PUFA determined by GC were positively correlated with those determined by 1H-NMR (r > 0.90).
Keywords: Fatty acids, GC, 1H-NMR, Oat-based gluten-free cookies, Storage
Introduction
Fat is considered to be one of the main components of a cookie recipe and includes both native lipids and those used for dough formulation (Caponio et al., 2009). Margarine, shortening, vegetable, and hydrogenated fats are widely used in cookie recipes. A particular type of fat in a cookie formulation should be chosen by taking into account technological and economical parameters, nutritional aspects, sensory profile and product shelf life (Caponio et al., 2009).
Cookies usually have a long storage period. During product storage, different chemical reactions take place within the cookie that cause product deterioration. Koczoń et al. (2016) proposed a scheme for the chemical reactions responsible for fat oxidation in biscuits during storage, and the main factors considered to influence oxidative stability were initial water content, initial fat content, and storage length.
Manufacturing, storage conditions, degree of saturation, content of unsaturated fatty acids and the number and position of double bonds in the molecules are factors that influence the rate of oxidation (Mildner-Szkudlarz et al., 2009; Wąsowicz et al., 2004).
A high variability in fatty acid composition and high amounts of trans isomers of unsaturated fatty acids were found in cookies and biscuits (Caponio et al., 2006; Costa et al., 2016).
Numerous methods have been developed to determine the fatty acid profile of fats and oils. Gas chromatography (GC) is the standard method used to determine the fatty acid composition of fats and oils. The method involves lipid extraction, saponification reactions and the conversion of fatty acids into the corresponding methyl esters (Petrović et al., 2010). Other methods for fatty acid analysis, such as high-performance liquid chromatography with UV detection (Carvalho et al., 2012), Fourier transform infrared spectroscopy (Al-Alawi et al., 2004), capillary zone electrophoresis (de Castro Barra et al., 2013) or nuclear magnetic resonance (NMR) spectroscopy (Castejón et al., 2014; Guillén and Ruiz, 2003; Knothe and Kenar, 2004; Miyake et al., 1998; Skiera et al., 2012), can be used.
To the best of our knowledge, no studies have evaluated the fatty acid profile of gluten-free cookies during storage.
The main objective of this study was to assess, over a 6 month period, the change in the fatty acid profile of oat-based gluten-free cookies prepared with 6 different kinds of fat. The fatty acid profile was evaluated every month for 6 months of storage at room temperature using NMR spectroscopy. Moreover, the fatty acid composition of in fresh cookies and cookies stored for 6 months was also established by GC.
Materials and methods
Materials
Emulsified margarine (which is a vegetable fat/shortening consisting of refined and partially hydrogenated palm, sunflower, and rape oils; MAR) from Puratos (Groot-Bijgaarden, Belgium), butter (BUT) and lard (LAR) from local retailers, refined palm oil (36–39 °C melting point range, RPO), refined palm oil with stearin (60:40, 45 °C melting point, RPOS) and hydrogenated palm oil (44–47 °C melting point range, HPO) from PrimFood Distribution (Romania) were used to prepare different oat cookie dough formulations.
Cookie preparation
Cookies were prepared by using the recipe shown in Table 1. First, fat, sugar, and egg were blended in a planetary mixer (FIMAR IP10F, Rimini, Italy) for 5 min. Then, whole oat flour (Glebe Farm Foods Ltd, Cambridgeshire, UK) and water containing dissolved baking powder were added and mixed for an additional 5 min. The cookie dough was sheeted to a thickness of 8 mm and cut into circular shapes using a 65 mm diameter cutter. The cookies were placed on baking trays and baked in an oven (Mondial Forni, Italy) at 210 °C for 15 min. One single batch of approximately 4 kg of each cookie sample was obtained. After reaching ambient temperature, the cookies were packed in polyethylene terephthalate boxes (160 mm × 95 mm × 50 mm, 0.132 mm thickness) and stored at room temperature (20 °C and 44% relative humidity), with a Philips TL-D 18 W lamp as the source of light to simulate the conditions of grocery stores. The fatty acid composition of fresh cookie samples and cookie samples stored for 6 months (M6) was analyzed by GC. At 1 month intervals up to 6 months of storage, one new box with 250 g of cookies was used to investigate the profile of fatty acids by NMR.
Table 1.
Recipe formulation for oat-based gluten-free cookies
| Ingredient | Weight (g) |
|---|---|
| Whole oat flour | 1000 |
| Fat | 270 |
| Sugar | 220 |
| Egg | 420 |
| Water | 12 |
| Sodium bicarbonate | 6 |
| Ammonium bicarbonate | 6 |
| Citric acid | 6 |
Fat extraction from cookies
Five grams of homogenized ground cookie samples was extracted by a standard Soxhlet procedure with 90 mL of petroleum ether for 6 h using a Soxtec System (Soxtec 2055, Foss Tecator, Höganäs, Sweden). Then, the distillate was dried at 105 °C for 1 h in an oven and cooled in a desiccator for 1 h.
Analysis of the fatty acid composition of cookie fat by GC
After the extraction of fat from the cookie samples, the fatty acids were converted into corresponding fatty acid methyl esters (FAME) through transmethylation according to the ISO 12966-2:2017 (ISO 12966-2, 2017). The method involved hydrolyzing esterified fatty acids to free fatty acids with methanolic sodium hydroxide (MeOH/NaOH). Free fatty acids were converted to methyl esters by an acid-catalyzed methanolysis procedure using boron trifluoride (BF3) in methanol. Briefly, in a test tube, the extracted fat (25 mg) was dissolved in 1.5 mL of 0.5 M MeOH/NaOH and then heated at 100 °C for 5 min in a water bath. After cooling, 2 mL of a 14% methanolic solution of BF3 was added, and the tube was heated again at 100 °C for 30 min. After cooling, 1 mL of isooctane was added, and the content of the tube was mixed on a vortex mixer (Vortex-Genie®2, Scientific Industries, Inc., USA). Then, 5 mL saturated NaCl solution was added; then, the sample was shaken, and after layer separation, the upper isooctane layer was introduced into a GC vial. The fatty acids in the FAME reaction vials were analyzed using a Perkin Elmer-Clarus 500 GC equipped with a flame ionization detector (FID). Separations were achieved in a BPX70 capillary column (60 m × 0.25 mm ID, 0.25 μm film thickness) from SGE Analytical Science (Victoria, Australia). Hydrogen was used as the carrier gas with a flow rate of 1 mL/min. The injection volume was 1 µL and the injection was performed in split mode (1:100). The temperatures in the injector and detector were 250 °C and 260 °C, respectively. The oven temperature was set to 180 °C and increased to 220 °C at the heating rate of 5 °C/min. FAMEs were identified by comparing the relative retention times of standards (Supelco 37 Component FAME Mix C4-C24, Sigma Aldrich, Bellefonte, PA, USA) and are reported as the relative percentages of individual fatty acids (expressed in g/100 g fat). The weight percentage of the components from the FAME mix was at 2% (for 11:0, 13:0, 14:1, 15:0, 15:1, 16:1, 17:0, 17:1, 18:1n9t, 18:2n6c, 18:2n6t, 18:3n6, 20:1, 18:3n3, 21:0, 20:2, 20:3n6, 22:1n9, 20:3n3, 20:4n6, 23:0, 22:2, 20:5n3, 24:1 and 22:6n3), 4% (for 4:0, 6:0, 8:0, 10:0, 12:0, 14:0, 18:0, 18:1n9c, 20:0, 22:0 and 24:0) and 6% (for 16:0). The analysis was carried out on fresh cookies and after 6 months of storage (at room temperature).
Analysis of the fatty acid profile of cookie fat by 1H-NMR
The fat extracted from the cookie (0.2 g) was diluted with 0.8 mL of CDCl3, mixed well and transferred to 5 mm NMR tubes. 1H-NMR spectra were recorded on a Bruker Avance III 400 Spectrometer (Bruker BioSpin, Karlsruhe, Germany) operating at 9.4 Tesla, corresponding to the resonance frequency of 400.13 MHz for the 1H nucleus and equipped with a direct detection of four nuclei probe head and field gradients on the z-axis. The typical parameters for 1H-NMR spectra were as follows: 45° pulse, 2.05 s acquisition time, 6.4 kHz spectral window, 16 scans, and 26 K data points. The average acquisition time of the 1H-NMR spectra was approximately 2 min. The spectral acquisition and processing were conducted with TopSpin 3.2 software (Bruker BioSpin).
Statistical analysis
The results are expressed as the mean ± standard deviation (SD). All samples were analyzed in triplicate. The data were statistically analyzed by one-way ANOVA followed by Tukey’s test to determine differences between means using Minitab®17 software (Minitab Ltd., UK). Differences were considered to be significant at p < 0.05.
Results and discussion
Fatty acid composition of oat-based gluten-free cookies as determined by GC analysis
The fatty acid composition of fresh cookie samples and cookie samples stored for 6 months as determined by GC is shown in Table 2. Moreover, Fig. 1 provides information on the changes in the total SFA, MUFA, and PUFA contents.
Table 2.
Variation in the fatty acid composition of oat-based gluten-free cookies during a 6 month storage period as determined by GC
| Fatty acid (g/100 g fat) | MAR | BUT | LAR | RPO | RPOS | HPO | ||||||
|---|---|---|---|---|---|---|---|---|---|---|---|---|
| M0 | M6 | M0 | M6 | M0 | M6 | M0 | M6 | M0 | M6 | M0 | M6 | |
| Butyric, C4:0 | – | – | – | 1.50 | – | – | – | – | – | – | – | – |
| Caproic, C6:0 | – | – | 0.93b | 1.33a | – | – | – | – | – | – | – | – |
| Caprylic, C8:0 | 0.03B | 0.03 | 1.17Ab | 3.02a | 0.05B | 0.12 | 0.04B | – | 0.05B | 0.04 | – | 0.13 |
| Capric, C10:0 | 0.04Bb | 0.28Ca | 2.89Ab | 3.50Aa | 0.21Ba | 0.12Ca | 0.05Bb | 0.35Ca | 0.1Bb | 0.44BCa | 0.1Bb | 0.73Ba |
| Undecanoic, C11:0 | – | – | 0.32 | – | – | – | – | – | – | – | – | – |
| Lauric, C12:0 | 0.3C | – | 3.41Aa | 0.12b | 0.21C | – | 0.37BC | – | 0.48BC | – | 0.7B | – |
| Tridecanoic, C13:0 | – | – | 0.12 | – | – | – | – | – | – | – | – | – |
| Myristic, C14:0 | 0.91B | 0.88B | 10.46A | 10.59A | 1.57B | 1.29B | 1.08B | 1.01B | 1.0B | 1.02B | 1.20B | 1.32B |
| Myristoleic, C14:1 | – | – | 1.17 | 0.96 | – | – | – | – | – | – | – | – |
| Pentadecanoic, C15:0 | – | – | 0.35 | 0.35 | – | – | – | – | – | – | – | – |
| Pentadecenoic, C15:1 | – | – | 0.92 | 0.93 | – | – | – | – | – | – | – | – |
| Palmitic, C16:0 | 34.41B | 33.92B | 31.99C | 31.99B | 23.35D | 22.96C | 37.29Aa | 36.52Ab | 38.83Aa | 38.33Ab | 34.27Ba | 33.44Bb |
| Palmitoleic, C16:1 | 0.40C | 0.47C | 1.77B | 1.79B | 2.44A | 2.34A | 0.43C | 0.30CD | 0.46C | 0.25D | 0.30C | 0.37CD |
| Heptadecanoic, C17:0 | – | 0.04 | 0.32 | 0.30 | 0.21 | 0.21 | 0.10 | – | 0.10 | – | – | – |
| Heptadecenoic, C17:1 | – | – | 0.41 | 0.41 | 0.18 | – | – | – | – | – | – | – |
| Stearic, C18:0 | 4.12DE | 4.0D | 7.08C | 6.80C | 9.23Ba | 8.39Bb | 3.77E | 3.80D | 4.32D | 4.05D | 10.74Ab | 11.42Aa |
| trans-Oleic, C18:1n9t | – | – | – | 1.17 | – | – | – | – | – | – | 10.89 | 11.00 |
| cis-Oleic, C18:1n9c | 35.64C | 35.97C | 23.97Ea | 21.63Fb | 39.09Aa | 38.55Ab | 37.31B | 37.82B | 34.94C | 35.19D | 28.53 Da | 26.38Eb |
| trans-Linoleic, C18:2n6t | – | – | 0.33 | – | – | – | – | – | – | – | 0.13 | – |
| cis-Linoleic, C18:2n6c | 22.88A | 22.95A | 10.11E | 10.33D | 20.66Bb | 23.21Aa | 18.43Cb | 19.62Ba | 18.33Cb | 19.53Ba | 12.13Db | 13.96Ca |
| Arachidic, C20:0 | – | – | 0.03 | – | – | – | – | – | – | – | – | – |
| Linolenic, C18:3n3 | 0.57B | 0.59B | 0.55B | 0.60B | 0.92A | 1.04A | 0.52B | 0.57B | 0.56B | 0.61B | 0.42B | 0.50B |
| Heneicosanoic, C21:0 | 0.14B | 0.10 | 0.31Ab | 0.11a | 0.10B | 0.13 | 0.18AB | – | 0.20ABa | 0.08b | 0.15B | 0.19 |
| Eicosadienoic, C20:2n6 | 0.19B | 0.23 | 0.08Bb | 0.17a | 0.58A | 0.58 | 0.17B | – | 0.20Ba | 0.10b | 0.14B | 0.19 |
| Eicosatrienoic, C20:3n6 | – | – | 0.14 | 0.07 | 0.36 | – | – | – | – | – | – | – |
| Eicosatrienoic, C20:3n3 | – | – | 0.06 | – | 0.07 | – | – | – | – | – | – | – |
| Arachidonic, C20:4n6 | 0.36AB | 0.32 | 0.30B | 0.33 | 0.49A | 0.56 | 0.28B | – | 0.35AB | 0.24 | 0.31B | 0.36 |
Values are the means of 3 determinations. Means with different uppercase letters in row are significantly different within samples in the same period of storage (p < 0.05). Means with different lowercase letters are significantly different within the same type of fat used in cookie production during storage (p < 0.05). A lack of lowercase letters indicates that there is no significant difference (p > 0.05)
Fig. 1.
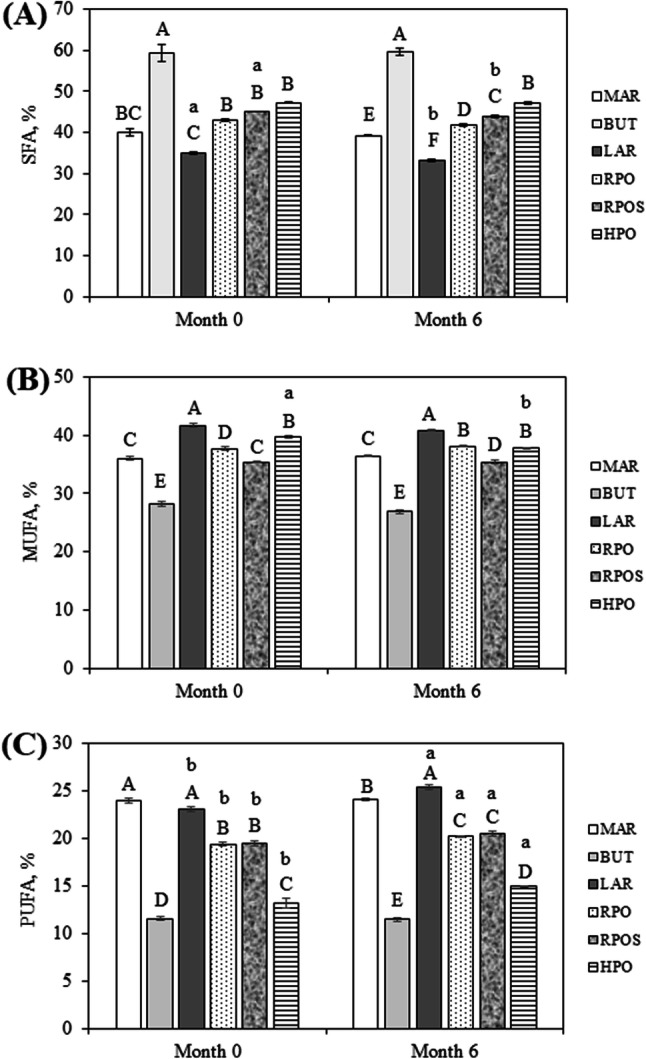
Changes in the saturated fatty acid (SFA) (A), monounsaturated fatty acid (MUFA) (B) and polyunsaturated fatty acid (PUFA) (C) content of the fat fraction of fresh (month 0) oat-based gluten-free cookies and cookies stored for 6 months (month 6) as determined by GC analysis. Values are the means of 3 determinations. Means with different uppercase letters are significantly different within samples during the same storage period (p < 0.05). Means with different lowercase letters are significantly different within the same type of fat used in cookie manufacturing over storage (p < 0.05). The lack of lowercase letter indicates that there is no significant difference (p > 0.05)
In fresh oat-based gluten-free cookies, regardless of the type of fat used in cookie production, the fatty acid composition revealed that the predominant SFAs were palmitic acid and stearic acid. The highest content of palmitic acid was identified in RPO and RPOS cookies, while HPO cookies contained the highest content of stearic acid (p < 0.05). cis-Oleic acid represented the major MUFA, while cis-linoleic acid was the most abundant PUFA. LAR cookies contained the highest content of cis-oleic acid, while MAR cookies contained the highest content of cis-linoleic acid (p < 0.05). Palmitic and oleic acid content were higher than stearic acid content. Among the PUFAs, linoleic acid content was the highest, and the linolenic acid content of cookies was very low. The same observation was also stated by Rajiv et al. (2012).
Regarding trans fatty acids, trans-linoleic acid was present in low quantities only in fresh BUT and HPO cookies, and after storage, it was no longer detected. trans-Oleic acid was found in high quantities only in fresh HPO cookies, and its content did not significantly change after storage (p > 0.05). The high content of trans fatty acids in HPO cookies is explained by the use of hydrogenated palm oil in cookie production. The presence of trans fatty acids is an indicator of hydrogenated fat (Ahmadi and Marangoni, 2009). A comparative study of fatty acid content in different foods showed that cookies contained higher levels of trans fatty acids because of the use of partially hydrogenated vegetable oil (Adhikari et al., 2010). The study by Amrutha Kala (2014) highlighted that a level of trans fatty acids up to 0.5 g/100 g of biscuits is insignificant, and accordingly, the products may be considered to contain zero trans fatty acids (Maggio and Orecchio, 2018). Although the high intake of trans fatty acids has been associated with an increased risk of several diseases, hydrogenated fats are widely used in the food industry due to their longer shelf life and oxidative stability (Mozaffarian et al., 2006).
Compared with other cookies, BUT cookies contained significantly increased (p < 0.05) amounts of caproic, caprylic, capric, lauric and myristic acids. After 6 months of storage, the contents of caproic, caprylic, and capric acids were significantly increased (p < 0.05), while the content of lauric acid was decreased in BUT cookies.
During storage, the content of palmitic acid significantly decreased (p < 0.05) in RPO, RPOS, and HPO cookies. The stearic acid content decreased in LAR cookies and increased in HPO cookies after 6 months of storage.
The storage of all types of cookies investigated did not significantly affect (p > 0.05) the content of myristic, palmitoleic, and linolenic acids.
The highest content (p < 0.05) of linolenic acid was found in LAR cookies, while the other cookies presented similar values (p > 0.05). No significant loss (p > 0.05) of linolenic acid was found in all types of cookies stored for 6 months compared with fresh cookies. Rajiv et al. (2012) showed that flaxseed-wheat cookies (with an average content of 5% linolenic acid) showed a significant decrease in linolenic acid during storage.
After 6 months, an increase (p < 0.05) in the content of cis-linoleic acid was observed in LAR, RPO, RPOS and HPO cookies compared with the corresponding fresh cookies. On the other hand, the content of cis-oleic acid was significantly decreased (p < 0.05) during the storage of BUT, LAR, and HPO cookies.
Butter cookies had the maximum SFA content and the lowest MUFA and PUFA contents (p < 0.05). Additionally, Vicario and Viviana (2003) reported a high content of saturated fatty acids in butter cookies. On the other hand, LAR cookies had the lowest SFA and the highest MUFA (p < 0.05).
After 6 months of storage, a significant decreasing trend (p < 0.05) in SFA concentration was observed in LAR and RPOS cookies, while a decrease in MUFA concentration was detected only for HPO cookies.
Fatty acid profile of oat-based gluten-free cookies during storage as determined by 1H-NMR spectra
1H-NMR spectra of the fat extracted from the oat-based gluten-free cookies were used to determine their fatty acid profiles. Figure 2A shows the 1H-NMR spectra of the fat extracted from the 6 types of cookies studied, while Fig. 2B presents for exemplification the 1H-NMR spectra of the fat extracted from LAR cookies during storage. The 1H-NMR spectra have the same profiles (except BUT cookies, which were the only samples with the signal B at 0.96 ppm), but they differ in peak intensities. Thus, all the samples contained similar fatty acids but in different amounts. To establish the fatty acid profile of the cookies, a system of equations based on the 1H-NMR spectral data was used (Chira et al., 2011; Tociu et al., 2018).
Fig. 2.

1H-NMR spectra of the fat extracted from the oat-based gluten-free cookies (A) and overlapped 1H-NMR spectra of the fat extracted from the LAR sample during storage (B) Chemical shifts (δ, ppm) in the 1H-NMR signals of the fat extracted from the oat-based gluten-free cookies: 0.85 (long chain saturated fatty acids: –CH2–CH2–CH2–CH3); 0.96 (short chain saturated fatty acids: –CH2–CH3); 1.20 (all acyl chains: –(CH2)n–); 1.60 (protons of the β position on the carbonyl group: –CH2–CH2–COO−); 2.02 (allyl protons: –CH2–CH=CH–); 2.20 (protons of the α position to the carbonyl group: –CH2–COO−); 2.76 (bis-allylic protons (linolenic and linoleic acids): –CH=CH–CH2–CH=CH–); 4.19 (sn-1 position of the glycerol backbone: –CH2OCOR); 5.15 (sn-2 position of the glycerol backbone: –CHOCOR); and 5.29 (all unsaturated fatty acids: –CH=CH–)
Figure 3 shows the SFA, MUFA, and PUFA results obtained from the 1H-NMR spectra. For fresh cookies, the relative SFA content was as follows: BUT > RPOS > RPO > HPO > MAR > LAR (Fig. 2A). As the length of storage increased, there were some small changes in SFA content. As a general trend, a significant increase (up to 5%) in SFA content was observed in MAR, BUT, RPO and RPOS cookies stored for 6 months compared with fresh cookies. Regarding RPO cookies, the SFA content was the highest after 3 months of storage and then significantly decreased up to 6 months.
Fig. 3.

Change in the saturated fatty acid (SFA) (A), monounsaturated fatty acid (MUFA) (B) and polyunsaturated fatty acid (PUFA) (C) content over 6 months of storage in oat-based gluten-free cookies as determined by 1H-NMR analysis. Values are the means of 3 determinations. For each sample, the different uppercase letters on the horizontal line are significantly different (p < 0.05)
There were some changes in the MUFA content of cookies during storage (Fig. 2B), but there was no specific trend. The exception was for BUT cookies, in which 1 month of storage caused a significant decrease of 16% (p < 0.05) in MUFA content, and up to 6 months, MUFA content remained at a similar level.
The relative PUFA content of fresh cookies was as follows: MAR > LAR > RPO > RPOS > HPO > BUT (Fig. 2C). After 6 months of storage, the relative order of the cookies was the same as that for fresh cookies, except that BUT cookies had a higher PUFA content than did HPO cookies. However, there were some variations among the different storage lengths. Compared with fresh cookies, cookies stored for 1 month showed a significant increase (p < 0.05) in PUFA content of approximately 3.4% in MAR cookies, 10% in LAR cookies, 14,4% in HPO cookies and 75% in BUT cookies. The PUFA content of RPO and RPOS cookies after 1 month of storage did not significantly (p > 0.05) differ from that of fresh cookies. After 1 month of storage, the increasing trend in PUFA content was maintained only for LAR (by 8.5%) and RPO (by 4%) cookies, and then, the content decreased. During the storage of RPOS cookies, PUFA content decreased by 18% after 6 months.
Generally, for the fatty acid profile, the 1H-NMR results were in good agreement with the GC analysis. The correlations between the fatty acid contents determined by GC and 1H-NMR techniques are presented in Table 3. In fresh cookies (month 0), the results for SFA, MUFA, and PUFA content determined by GC were highly positively correlated with those determined by 1H-NMR analysis (r > 0.92; p < 0.05). A similar finding was noted for cookies stored for 6 months (r > 0.90; p < 0.05).
Table 3.
Correlation analysis between the GC and 1H-NMR results for fatty acids in terms of saturated fatty acids (SFAs), monounsaturated fatty acids (MUFAs) and polyunsaturated fatty acids (PUFAs)
| SFA | MUFA | PUFA | |||
|---|---|---|---|---|---|
| Month 0 | Month 6 | Month 0 | Month 6 | Month 0 | Month 6 |
| r = 0.9469 | r = 0.9363 | r = 0.9237 | r = 0.9054 | r = 0.9807 | r = 0.9165 |
Regarding the comparison between the GC–MS and NMR techniques on analyzing the fatty acid content of vegetable oils/animal fats, Mihai et al. (2018) showed that the difference was not more than ± 15% for sunflower oil and lard and ± 6% for palm oil. Knothe and Kenar (2004) also concluded that the 1H-NMR spectroscopic method yields results that are generally in good agreement with GC in the determination of unsaturated fatty acids and total saturated fatty acids in vegetable oils.
1H-NMR spectroscopy is applied as a rapid and nondestructive method for the determination of fatty acid profiles (Yeboah et al., 2017; Zailer, 2018). The NMR technique has some advantages over the GC method, including the following: NMR requires small amounts of sample (0.2 g extracted fat) and solvent (0.8 mL); NMR is fast, with an average acquisition time of 2 min, compared with more than 50 min in the case of GC; and there is no need for sample preparation, such as derivatization, and thus, the sample can be recovered unmodified after the analysis. An additional advantage of NMR spectroscopy is that it does not require any internal standard or calibration, and operator errors are eliminated. A limitation of the NMR technique is that fatty acids cannot be identified. Regarding GC analysis, it is time, cost and solvent consuming. However, the GC analysis of FAMEs was used to determine the composition of individual fatty acids in the cookie samples. Thus, the GC method was used for the determination of fatty acid composition, whereas the NMR method provided fast information about fatty acid classes (total SFA, MUFA and PUFA).
This study was carried out to evaluate the changes during storage in the fatty acid profile of oat-based gluten-free cookies prepared with different types of fats by employing GC and 1H-NMR techniques. In fresh cookies and in cookies stored for 6 months, the 1H-NMR results were confirmed by GC analysis; the correlation between both analyses for SFA, MUFA, and PUFA was higher than 0.90.
Acknowledgements
This work was supported by a grant from the Romanian National Authority for Scientific Research (CNDI-UEFISCDI, Project Number 111/2012) and by a grant from the Ministry of Research and Innovation through Program 1—Development of the National R&D System, Subprogram 1.2—Institutional Performance—Projects for Excellence Financing in RDI (Project No. 26 PFE/17.10.2018).
Compliance with ethical standards
Conflict of interest
The authors declare no conflict of interest.
Footnotes
Publisher's Note
Springer Nature remains neutral with regard to jurisdictional claims in published maps and institutional affiliations.
Contributor Information
Alina Culetu, Email: alinaculetu@gmail.com.
Valentin Ionescu, Email: valentin.ionescu@bioresurse.ro.
Maria Cristina Todasca, Email: cristina.todasca@upb.ro.
Denisa Eglantina Duta, Email: denisa.duta@bioresurse.ro.
References
- Adhikari P, Yu F, Lee J-H, Park HK, Kim JW, Lee EJ, Lee K-T. Comparative Study of Trans Fatty Acid Content in 2005 and 2008 Processed Foods from Korean Market. Food Sci. Biotechnol. 2010;19:335–341. doi: 10.1007/s10068-010-0048-4. [DOI] [Google Scholar]
- Ahmadi L, Marangoni AG. Functionality and physical properties of interesterified high oleic shortening structured with stearic acid. Food Chem. 2009;117:668–673. doi: 10.1016/j.foodchem.2009.04.072. [DOI] [Google Scholar]
- Al-Alawi A, Voort FRV, Sedman J. New method for the quantitative determination of free fatty acids in oil by FTIR spectroscopy. J. Am. Oil Chem’. Soc. 2004;81:441–446. doi: 10.1007/s11746-004-0920-9. [DOI] [Google Scholar]
- Amrutha Kala AL. Studies on saturated and trans fatty acids composition of few commercial brands of biscuits sold in Indian market. J. Food Sci. Technol. 2014;51:3520–3526. doi: 10.1007/s13197-014-1421-8. [DOI] [PMC free article] [PubMed] [Google Scholar]
- Caponio F, Summo C, Delcuratolo D, Pasqualone A. Quality of the lipid fraction of Italian biscuits. J. Sci. Food Agr. 2006;86:356–361. doi: 10.1002/jsfa.2357. [DOI] [Google Scholar]
- Caponio F, Summo C, Paradiso VM, Pasqualone A, Gomes T. Evolution of the oxidative and hydrolytic degradation of biscuits’ fatty fraction during storage. J. Sci. Food Agr. 2009;89:1392–1396. doi: 10.1002/jsfa.3600. [DOI] [Google Scholar]
- Carvalho MS, Mendonça MA, Pinho DMM, Resck IS, Suarez PAZ. Chromatographic analyses of fatty acid methyl esters by HPLC-UV and GC-FID. J. Brazil Chem. Soc. 2012;23:763–769. doi: 10.1590/S0103-50532012000400023. [DOI] [Google Scholar]
- Castejón D, Mateos-Aparicio I, Molero MD, Cambero MI, Herrera A. Evaluation and optimization of the analysis of fatty acid types in edible oils by 1H-NMR. Food Anal. Methods. 2014;7:1285–1297. doi: 10.1007/s12161-013-9747-9. [DOI] [Google Scholar]
- Chira NA, Todasca MC, Nicolescu A, Rosu A, Nicolae M, Rosca SI. Evaluation of the computational methods for determining vegetable oils composition using 1H-NMR spectroscopy. Rev. Chim. 2011;62:42–46. [Google Scholar]
- Costa N, Cruz R, Graça P, Breda J, Casal S. Trans fatty acids in the Portuguese food market. Food Control. 2016;64:128–134. doi: 10.1016/j.foodcont.2015.12.010. [DOI] [PMC free article] [PubMed] [Google Scholar]
- de Castro Barra PM, de Jesus Coelho Castro R, de Oliveira, PL, Aued-Pimentel S, da Silva SA, de Oliveira MAL. An alternative method for rapid quantitative analysis of majority cis–trans fatty acids by CZE. Food Res. Int. 52: 33-41 (2013)
- Guillén M, Ruiz A. Edible oils: discrimination by 1H nuclear magnetic resonance. J. Sci. Food Agr. 2003;83:338–346. doi: 10.1002/jsfa.1317. [DOI] [Google Scholar]
- ISO 12966-2. Animal and vegetable fats and oils – Gas chromatography of fatty acid methyl esters – Part 2: Preparation of methyl esters of fatty acids. International Standard Organization, Geneva, Switzerland, Technical Committee, ISO/TC 34/SC 11 (2017)
- Koczoń P, Lipińska E, Czerniawska-Piątkowska E, Mikuła M, Bartyzel BZ. The change of fatty acids composition of Polish biscuits during storage. Food Chem. 2016;202:341–348. doi: 10.1016/j.foodchem.2016.02.019. [DOI] [PubMed] [Google Scholar]
- Knothe G, Kenar JA. Determination of the fatty acid profile by 1H-NMR spectroscopy. Eur J Lipid Sci Technol. 2004;106:88–96. doi: 10.1002/ejlt.200300880. [DOI] [Google Scholar]
- Maggio A, Orecchio S. Fatty acid composition of gluten-free food (bakery products) for celiac people. Foods. 2018;7:95. doi: 10.3390/foods7060095. [DOI] [PMC free article] [PubMed] [Google Scholar]
- Mihai AL, Negoita M, Adascalului AC, Ionescu V, Belc N. Evaluation of fatty acids composition of some food samples by using GC-MS and NMR techniques. pp. 548-554. In: “Agriculture for Life, Life for Agriculture” Conference Proceedings. June 30, Bucharest. De Gruyter, Poland (2018)
- Mildner-Szkudlarz S, Zawirska-Wojtasiak R, Obuchowski W, Gośliński M. Evaluation of antioxidant activity of green tea extract and its effect on the biscuits lipid fraction oxidative stability. J. Food Sci. 2009;74:S362–S370. doi: 10.1111/j.1750-3841.2009.01313.x. [DOI] [PubMed] [Google Scholar]
- Miyake Y, Yokomizo K, Matsuzaki N. Determination of unsaturated fatty acid composition by high-resolution nuclear magnetic resonance spectroscopy. J. Am. Oil Chem’. Soc. 1998;75:1091–1094. doi: 10.1007/s11746-998-0118-4. [DOI] [Google Scholar]
- Mozaffarian D, Katan MB, Ascherio A, Stampfer MJ, Willett WC. Trans fatty acids and cardiovascular disease. New Engl. J. Med. 2006;354:1601–1613. doi: 10.1056/NEJMra054035. [DOI] [PubMed] [Google Scholar]
- Petrović M, Kezić N, Bolanča V. Optimization of the GC method for routine analysis of the fatty acid profile in several food samples. Food Chem. 2010;122:285–291. doi: 10.1016/j.foodchem.2010.02.018. [DOI] [Google Scholar]
- Rajiv J, Indrani D, Prabhasankar P, Venkateswara Rao G. Rheology, fatty acid profile and storage characteristics of cookies as influenced by flax seed (Linum usitatissimum) J Food Sci Technol. 2012;49:587–593. doi: 10.1007/s13197-011-0307-2. [DOI] [PMC free article] [PubMed] [Google Scholar]
- Skiera C, Steliopoulos P, Kuballa T, Holzgrabe U, Diehl BWK. Determination of free fatty acids in edible oils by 1H NMR spectroscopy. Lipid Technol. 2012;24:279–281. doi: 10.1002/lite.201200241. [DOI] [Google Scholar]
- Tociu M, Todasca MC, Bratu A, Mihalache M, Manolache F. Fast approach for fatty acid profiling of dairy products fats using 1H-NMR spectroscopy. Int. Dairy J. 2018;83:52–57. doi: 10.1016/j.idairyj.2018.03.005. [DOI] [Google Scholar]
- Vicario I, Viviana G. Multivariate characterization of the fatty acid profile of Spanish cookies and bakery products. J. Agric. Food Chem. 2003;51:134–139. doi: 10.1021/jf0258297. [DOI] [PubMed] [Google Scholar]
- Wąsowicz E, Gramza A, Hęś M, Jeleń HH, Korczak J, Małecka M, Mildner-Szkudlarz S, Rudzińska M, Samotyja U, Zawirska-Wojtasiak R. Oxidation of lipids in food. Pol. J. Food Nutr. Sci. 2004;13:87–100. [Google Scholar]
- Yeboah EMO, Kobue-Lekalake RI, Jackson JC, Muriithi EN, Matenanga O, Yeboah SO. Application of high resolution NMR, FTIR, and GC–MS to a comparative study of some indigenous seed oils from Botswana. Innov. Food Sci. Emerg. Technol. 2017;44:181–190. doi: 10.1016/j.ifset.2017.05.004. [DOI] [Google Scholar]
- Zailer E. Holistic control of fats and oils by NMR spectroscopy. In: Smithers G, editor. Reference Module in Food Science. Oxford, UK: Elsevier; 2018. pp. 1–14. [Google Scholar]