

Abstract
Objective
To characterize patients with coronavirus disease 2019 (covid-19) in a large New York City medical center and describe their clinical course across the emergency department, hospital wards, and intensive care units.
Design
Retrospective manual medical record review.
Setting
NewYork-Presbyterian/Columbia University Irving Medical Center, a quaternary care academic medical center in New York City.
Participants
The first 1000 consecutive patients with a positive result on the reverse transcriptase polymerase chain reaction assay for severe acute respiratory syndrome coronavirus 2 (SARS-CoV-2) who presented to the emergency department or were admitted to hospital between 1 March and 5 April 2020. Patient data were manually abstracted from electronic medical records.
Main outcome measures
Characterization of patients, including demographics, presenting symptoms, comorbidities on presentation, hospital course, time to intubation, complications, mortality, and disposition.
Results
Of the first 1000 patients, 150 presented to the emergency department, 614 were admitted to hospital (not intensive care units), and 236 were admitted or transferred to intensive care units. The most common presenting symptoms were cough (732/1000), fever (728/1000), and dyspnea (631/1000). Patients in hospital, particularly those treated in intensive care units, often had baseline comorbidities including hypertension, diabetes, and obesity. Patients admitted to intensive care units were older, predominantly male (158/236, 66.9%), and had long lengths of stay (median 23 days, interquartile range 12-32 days); 78.0% (184/236) developed acute kidney injury and 35.2% (83/236) needed dialysis. Only 4.4% (6/136) of patients who required mechanical ventilation were first intubated more than 14 days after symptom onset. Time to intubation from symptom onset had a bimodal distribution, with modes at three to four days, and at nine days. As of 30 April, 90 patients remained in hospital and 211 had died in hospital.
Conclusions
Patients admitted to hospital with covid-19 at this medical center faced major morbidity and mortality, with high rates of acute kidney injury and inpatient dialysis, prolonged intubations, and a bimodal distribution of time to intubation from symptom onset.
Introduction
Coronavirus disease 2019 (covid-19) is a global pandemic and New York City is an epicenter of the disease. Since the first patient was confirmed to have covid-19 on 1 March 2020, there were 164 505 laboratory confirmed cases across the city, resulting in 42 417 hospital admissions and 13 000 confirmed deaths (as of 30 April).1 Internationally, the rapid spread of covid-19 has taxed hospital system resources, resulting in a shortage of ventilators and other medical equipment in many countries.2 Within New York City, the high burden of disease quickly exceeded the standard capacity of hospital systems. Massive expansion of inpatient and intensive care unit facilities was required, which raised concerns about optimal clinical management, safe maximization of hospital throughput, and resource allocation.3 4
Despite the pressing need for evidence to inform such key decisions, data remain limited on covid-19 in the United States, and comparisons with data from previously published international cohorts are lacking. Patient characteristics, illness course, practice patterns, resource utilization, morbidity, and mortality associated with covid-19 have been considered in only limited samples.5 6 7 8 9 The US effort at characterizing this disease began with two small case series from Seattle, while internationally, Wuhan, China10 11 12 and Lombardy, Italy13 have published more extensively about their experiences. Characteristics of patients from New York City are beginning to be enumerated with limited data on patients admitted to hospital, including the critically ill.14 However, much remains unknown about how these patients compare with previously described US and international cohorts and what implications these differences will have on clinical care, outcomes, and resources.6 15
Therefore, we sought to characterize the course of the first 1000 consecutive adult patients with covid-19 treated at NewYork-Presbyterian/Columbia University Irving Medical Center (NYP/CUIMC), a large quaternary care academic medical center. We provide a detailed description of demographic data, comorbidities, presenting symptoms, clinical course including time to intubation, hospital complications, patient outcomes, and mortality. Box 1 provides the overall clinical context driving care throughout the first months of the pandemic’s spread in New York City.
Box 1. Criteria for coronavirus disease 2019 (covid-19) testing and treatment .
Testing policies:
Early March—recommended testing only patients with symptoms in hospital.
Mid March—updated to include patients showing symptoms and who needed to be admitted to hospital, were at high risk, or were being discharged to congregate settings.
Early April—expanded to all patients being admitted to hospital.
Diagnosis:
A covid-19 diagnosis was defined as a positive result on the reverse transcriptase polymerase chain reaction assay for severe acute respiratory syndrome coronavirus 2.
Hospital admission:
Most common criterion for admission to hospital was room air hypoxemia.
Intensive care unit admission:
Usually reserved for patients with acute respiratory failure requiring mechanical ventilation.
Intubation:
Started for patients with hypoxemia on a non-rebreather face mask or high flow nasal cannula oxygen therapy (SpO2 88-92%) or substantial increased work of breathing, altered mental status, or arterial hypotension.
Self-proning was encouraged for patients requiring a non-rebreather face mask or high flow nasal cannula oxygen therapy who were alert and able to self-prone.
Extubation:
Extubation was sought for patients who:
had improving, mild hypoxemia (SpO2>90% with FiO2≤40%)
passed a spontaneous breathing trial using pressure support ventilation
were hemodynamically stable
had a Richmond Agitation Sedation Scale score16 of at least −2.
Methods
Data source and study sample
We used data from the NYP/CUIMC electronic health record and NYP clinical data warehouse to identify patients with laboratory confirmed covid-19 infection, as represented by a positive result on the reverse transcriptase polymerase chain reaction assay for severe acute respiratory syndrome coronavirus 2 (SARS-CoV-2). NYP/CUIMC Clinical Microbiology Laboratory began in-house testing on 11 March, with earlier tests sent out to the New York Department of Health, and the latest initial positive test for this cohort was on 6 April. Patients in this cohort with positive Department of Health tests all had repeat positive tests at NYP/CUIMC. This aligned with patients who initially presented between 1 March and 5 April 2020. We performed ongoing retrospective manual data abstraction from the electronic health records of all patients with covid-19 who received emergency department or inpatient care at NYP/CUIMC (excluding tests performed in the outpatient setting or at another hospital). We characterized the first 1000 consecutive patients with covid-19.
NYP/CUIMC is a quaternary care academic medical center with 765 adult beds serving a diverse, high acuity patient population in the Manhattan borough of New York City.17 NYP/CUIMC includes Milstein Hospital, which has six intensive care units, and Milstein Heart Center, which has an additional coronary and cardiothoracic intensive care unit, making a total of 117 adult intensive care unit beds. As patient volume increased, a further 160 surge intensive care unit beds were created to expand capacity in multiple locations throughout the hospital. The non-ICU general medicine bed capacity was expanded from 216 to 540. With the increase in capacity and resources, all necessary treatments and interventions remained available to patients throughout the study period. For the purpose of this paper, an intensive care unit bed is defined as one with the capability of providing mechanical ventilation and continuous vital sign monitoring, with staffing by critical care nurses and oversight by intensivists. The most common criterion for hospital admission for covid-19 patients was room air hypoxemia. Intensive care unit admissions were most commonly reserved for patients with acute respiratory failure that required mechanical ventilation.
Manual chart review
An abstraction team of 30 trained medical students from the Columbia University Vagelos College of Physicians and Surgeons who were supervised by multiple clinicians and informaticians manually abstracted data from electronic health records in chronological order by test date. Information from the charts was inputted directly into REDCap (research electronic data capture)18 by using an instrument previously designed and validated by the abstraction team at Weill Cornell Medicine, who identified a mean Cohen’s κ for categorical variables of 0.92 (interquartile range 0.86-0.97) and 0.94 (0.87-0.97) for continuous variables.6 The REDCap instrument collects 274 data fields, 90 of which are required. Our abstraction team was trained in multiple hour long sessions by the Weill Cornell team and instrument developers. Calibration of the data collection across both sites was achieved through biweekly meetings and use of remote communication platforms. Records with missing data or with inconsistent times were reviewed by a second, dedicated quality control abstractor. A random subsample of abstracted data was checked by a second abstractor, typically a clinician, for calibration and consistency. Any conflicting data were resolved by consensus.
Data collected were demographics, comorbidities, presenting symptoms, laboratory and radiographical findings, hospital course including admission, intensive care unit transfer, mechanical ventilation, complications (defined as those documented by clinicians in the electronic health record) such as acute respiratory distress syndrome or acute kidney injury, and disposition including discharge, transfer, or death. Supplemental table 1 lists the definitions used for specified complications. Time of first symptom was recorded based on the patient’s history; if patients did not or could not give a specific date of their first symptom, it was recorded that they could only give an approximate time. Data that were not present in the electronic health record were excluded from analysis; no imputation was performed. Laboratory test data and race or ethnicity data were extracted from the clinical data warehouse.
Data characterization and analysis
Individual records were labeled with the highest level of care a patient received as of 30 April: emergency department only, in hospital (not intensive care units), and admission to intensive care units. This paper covers patients still in hospital, those who have been discharged, and patients who died in the hospital. For patients with multiple covid-19 related visits recorded on the electronic health record, the visit with the highest level of care was selected. For patients with multiple visits with the same level of care, the most recent visit was selected. Characteristics were stratified by the highest level of care received to date, and 95% confidence intervals were recorded for each value. A multivariate Cox proportional hazards analysis was performed to predict death, intubation, and a composite of either death or intubation.
All analyses and visualizations were performed using R.19 Continuous variables were reported as medians and interquartile ranges. Relevant time differences were computed from documented dates and times on the electronic health record. Hartigan’s dip test was used to test for multimodality.20
Patient and public involvement statement
Given the urgency and rapid progression of the covid-19 pandemic, there was a need to disseminate information quickly and thus patients were not directly involved in the development, implementation, or interpretation of this research study. Furthermore, this study was based on chart reviews, which were not accessible to non-medical or non-research personnel, limiting patient and public involvement.
Results
Between 11 March and 6 April, a total of 2423 patients were tested for SARS-CoV-2 at NYP/CUIMC, with 1403 patients testing positive and 1020 negative (supplemental table 2). Of the patients with a positive test, 1132 received emergency department or hospital care. Our cohort includes the first 1000 of these consecutive patients. This sample consisted of 150 patients treated in the emergency department, 614 patients admitted to hospital who did not require intensive care, and 236 patients admitted to intensive care units; 90 patients remained in hospital as of 30 April.
Baseline characteristics
Table 1 presents a detailed breakdown of baseline characteristics, including demographics, comorbidities, and home drug treatments. The median age was 63.0 years (interquartile range 50.0-75.0). A male predominance was found in the overall sample (596/1000), which was more pronounced among patients in intensive care units (158/236, 66.9% male). The median body mass index for all patients was 28.6 (interquartile range 25.2-33.1) and 29.4 (25.7-34.2) for patients in intensive care units. Hypertension was the most common comorbidity, present in 601 of 1000 patients, followed by diabetes in 372 of 1000 (table 1). Only 82 of 1000 patients reported no major comorbidities. The most common home drug treatments were statins (361/1000) and angiotensin converting enzyme inhibitors or angiotensin receptor blockers (284/1000).
Table 1.
Baseline characteristics of patients who tested positive for coronavirus disease 2019 stratified by highest level of care.* Data are reported as frequencies (number) and column percentages (%; 95% confidence interval) unless stated otherwise
| Characteristics | Highest level of care | Overall (n=1000) | ||
|---|---|---|---|---|
| Emergency department (n=150) | In hospital (not intensive care units; n=614) | Intensive care units (n=236) | ||
| Age | ||||
| Median (IQR) | 55.0 (40.3-69.0) | 64.0 (51.0-77.0) | 62.0 (52.0-72.0) | 63.0 (50.0-75.0) |
| 18-34 | 24; 16 (11.0 to 22.7) | 50; 8.1 (6.2 to 10.6) | 13; 5.5 (3.2 to 9.2) | 87; 8.7 (7.1 to 10.6) |
| 35-54 | 48; 32 (25.1 to 39.8) | 139; 22.6 (19.5 to 26.1) | 56; 23.7 (18.7 to 29.5) | 243; 24.3 (21.7 to 27.1) |
| 55-64 | 31; 20.7 (15.0 to 27.8) | 138; 22.5 (19.4 to 25.9) | 66; 28 (22.6 to 34) | 235; 23.5 (21.0 to 26.2) |
| ≥65 | 47; 31.3 (24.5 to 39.1) | 287; 46.7 (42.8 to 50.7) | 101; 42.8 (36.6 to 49.2) | 435; 43.5 (40.5 to 46.6) |
| Sex | ||||
| Male | 85; 56.7 (48.7 to 64.3) | 353; 57.5 (53.5 to 61.3) | 158; 66.9 (60.7 to 72.6) | 596; 59.6 (56.5 to 62.6) |
| Female | 65; 43.3 (35.7 to 51.3) | 261; 42.5 (38.7 to 46.5) | 78; 33.1 (27.4 to 39.3) | 404; 40.4 (37.4 to 43.5) |
| Race or ethnicity | ||||
| Asian | 1; 0.7 (0.1 to 3.7) | 8; 1.3 (0.7 to 2.5) | 10; 4.2 (2.3 to 7.6) | 19; 1.9 (1.2 to 2.9) |
| Black or African American | 21; 14 (9.3 to 20.5) | 110; 17.9 (15.1 to 21.1) | 50; 21.2 (16.5 to 26.8) | 181; 18.1 (15.8 to 20.6) |
| Hispanic or Latino | 36; 24 (17.9 to 31.4) | 154; 25.1 (21.8 to 28.7) | 58; 24.6 (19.5 to 30.4) | 248; 24.8 (22.2 to 27.6) |
| Not specified | 41; 27.3 (20.8 to 35.0) | 104; 16.9 (14.2 to 20.1) | 47; 19.9 (15.3 to 25.5) | 192; 19.2 (16.9 to 21.8) |
| Other | 29; 19.3 (13.8 to 26.4) | 154; 25.1 (21.8 to 28.7) | 33; 14 (10.1 to 19) | 216; 21.6 (19.2 to 24.3) |
| White | 22; 14.7 (9.9 to 21.2) | 84; 13.7 (11.2 to 16.6) | 38; 16.1 (12.0 to 21.3) | 144; 14.4 (12.4 to 16.7) |
| Median body mass index (IQR) | 29.7 (26.0-32.9) | 28.3 (25.0-32.7) | 29.4 (25.7-34.2) | 28.6 (25.2-33.1) |
| Smoking status | ||||
| Active | 14; 9.3 (5.6 to 15.1) | 25; 4.1 (2.8 to 5.9) | 10; 4.2 (2.3 to 7.6) | 49; 4.9 (3.7 to 6.4) |
| Former | 18; 12 (7.7 to 18.2) | 114; 18.6 (15.7 to 21.8) | 49; 20.8 (16.1 to 26.4) | 181; 18.1 (15.8 to 20.6) |
| Multiple visits | 9; 6 (3.2 to 11.0) | 61; 9.9 (7.8 to 12.6) | 19; 8.1 (5.2 to 12.2) | 89; 8.9 (7.3 to 10.8) |
| Median No of home drug treatments (IQR) | 1 (0-6) | 5 (1-8) | 4 (1-7) | 4 (1-8) |
| Comorbidities | ||||
| Hypertension | 76; 50.7 (42.7 to 58.6) | 367; 59.8 (55.8 to 63.6) | 158; 66.9 (60.7 to 72.6) | 601; 60.1 (57.0 to 63.1) |
| Diabetes mellitus | 39; 26 (19.6 to 33.6) | 232; 37.8 (34.0 to41.7) | 101; 42.8 (36.6 to 49.2) | 372; 37.2 (34.3 to 40.2) |
| Coronary artery disease | 16; 10.7 (6.7 to 16.6) | 86; 14.0 (11.5 to 17) | 29; 12.3 (8.7 to 17.1) | 131; 13.1 (11.1 to 15.3) |
| Congestive heart failure | 11; 7.3 (4.1 to 12.7) | 67; 10.9 (8.7 to 13.6) | 24; 10.2 (6.9 to 14.7) | 102; 10.2 (8.5 to 12.2) |
| Pulmonary disease | 35; 23.3 (17.3 to 30.7) | 133; 21.7 (18.6 to 25.1) | 55; 23.3 (18.4 to 29.1) | 223; 22.3 (19.8 to 25.0) |
| Asthma | 25; 16.7 (116 to 23.4) | 59; 9.6 (7.5 to 12.2) | 29; 12.3 (8.7 to 17.1) | 113; 11.3 (9.5 to 13.4) |
| Chronic obstructive pulmonary disease | 10; 6.7 (3.7 to 11.8) | 42; 6.8 (5.1 to 9.1) | 14; 5.9 (3.6 to 9.7) | 66; 6.6 (5.2 to 8.3) |
| Obstructive sleep apnea | 1; 0.7 (0.1 to 3.7) | 16; 2.6 (1.6 to 4.2) | 7; 3.0 (1.4 to 6.0) | 24; 2.4 (1.6 to 3.5) |
| Interstitial lung disease | 1; 0.7 (0.1 to 3.7) | 10; 1.6 (0.9 to 3.0) | 2; 0.8 (0.2 to 3.0) | 13; 1.3 (0.8 to 2.2) |
| Renal disease | 12; 8 (4.6 to 13.5) | 98; 16 (13.3 to 19.1) | 27; 11.4 (8.0 to 16.1) | 137; 13.7 (11.7 to 16.0) |
| History of stroke | 7; 4.7 (2.3 to 9.3) | 53; 8.6 (6.7 to 11.1) | 19; 8.1 (5.2 to 12.2) | 79; 7.9 (6.4 to 9.7) |
| Active cancer | 4; 2.7 (1.0 to 6.7) | 46; 7.5 (5.7 to 9.8) | 17; 7.2 (4.5 to 11.2) | 67; 6.7 (5.3 to 8.4) |
| Transplant history | 5; 3.3 (1.4 to 7.6) | 27; 4.4 (3.0 to 6.3) | 12; 5.1 (2.9 to 8.7) | 44; 4.4 (3.3 to 5.9) |
| Rheumatological disease | 2; 1.3 (0.4 to 4.7) | 24; 3.9 (2.6 to 5.8) | 9; 3.8 (2.0 to 7.1) | 35; 3.5 (2.5 to 4.8) |
| HIV | 1; 0.7 (0.1 to 3.7) | 14; 2.3 (1.4 to 3.8) | 6; 2.5 (1.2 to 5.4) | 21; 2.1 (1.4 to 3.2) |
| Viral hepatitis | 2; 1.3 (0.4 to 4.7) | 12; 2 (1.1 to 3.4) | 5; 2.1 (0.9 to 4.9) | 19; 1.9 (1.2 to 2.9) |
| Cirrhosis | 0; 0 (0.0 to 2.5) | 10; 1.6 (0.9 to 3.0) | 5; 2.1 (0.9 to 4.9) | 15; 1.5 (0.9 to 2.5) |
| Obesity† (body mass index>30) | 29/60; 48.3 (36.2 to 60.7) | 216/547; 39.5 (35.5 to 43.6) | 107/234; 45.7 (39.5 to 52.1) | 352/841; 48.3 (36.2 to 60.7) |
| No comorbidities‡ | 5; 3.3 (1.4 to 7.6) | 57; 9.3 (7.2 to 11.8) | 20; 8.5 (5.6 to 12.7) | 82; 8.2 (6.7 to 10.1) |
| Home drug treatments | ||||
| Statins | 36; 24 (17.9 to 31.4) | 232; 37.8 (34.0 to 41.7) | 93; 39.4 (33.4 to 45.8) | 361; 36.1 (33.2 to 39.1) |
| ACEi/ARBs | 31; 20.7 (15.0 to 27.8) | 182; 29.6 (26.2 to 33.4) | 71; 30.1 (24.6 to 36.2) | 284; 28.4 (25.7 to 31.3) |
| NSAIDs | 29; 19.3 (13.8 to 26.4) | 170; 27.7 (24.3 to 31.4) | 51; 21.6 (16.8 to 27.3) | 250; 25 (22.4 to 27.8) |
| PPIs | 14; 9.3 (5.6 to 15.1) | 111; 18.1 (15.2 to 21.3) | 38; 16.1 (12.0 to 21.3) | 163; 16.3 (14.1 to 18.7) |
| Inhaled or nasal steroids | 12; 8 (4.6 to 13.5) | 39; 6.4 (4.7 to 8.6) | 17; 7.2 (4.5 to 11.2) | 68; 6.8 (5.4 to 8.5) |
| Oral steroids | 5; 3.3 (1.4 to 7.6) | 44; 7.2 (5.4 to 9.5) | 16; 6.8 (4.2 to 10.7) | 65; 6.5 (5.1 to 8.2) |
ACEi=angiotensin converting enzyme inhibitor; ARB=angiotensin receptor blocker; IQR=interquartile range; NSAID=non-steroidal anti-inflammatory drug; PPI=proton pump inhibitor.
When patients sought care multiple times, their highest level of care is reported.
Denominators are reported owing to incomplete reporting for body mass index.
No major comorbidities indicates patients had none of the listed comorbidities.
The most common presenting symptoms were cough (732/1000), fever (728/1000), and shortness of breath (631/1000; table 2). Dyspnea as a presenting symptom was considerably more common in patients who were admitted to intensive care units, while patients who did not need intensive care had the highest rates of nausea and vomiting. Important laboratory findings on presentation include progressively higher inflammatory markers (C reactive protein, erythrocyte sedimentation rate, ferritin, D dimer, lactate dehydrogenase) for patients who would ultimately require intensive care compared with those treated in hospital (not intensive care units) and the emergency department only (supplemental table 3).
Table 2.
Presenting symptoms of patients with coronavirus disease 2019 in order of overall prevalence. Data are reported as frequencies (number) and column percentages (%; 95% confidence interval)
| Symptoms | Highest level of care | Overall (n=1000) | ||
|---|---|---|---|---|
| Emergency department (n=150) | In hospital (not intensive cares units; n=614) | Intensive care units (n=236) | ||
| Cough | 116; 77.3 (70.0 to 83.3) | 447; 72.8 (69.1 to 76.2) | 169; 71.6 (65.5 to 77) | 732; 73.2 (70.4 to 75.9) |
| Fever | 110; 73.3 (65.7 to 79.8) | 447; 72.8 (69.1 to 76.2) | 171; 72.5 (66.4 to 77.8) | 728; 72.8 (70.0 to 75.5) |
| Dyspnea | 83; 55.3 (47.3 to 63.1) | 375; 61.1 (57.2 to 64.9) | 173; 73.3 (67.3 to 78.5) | 631; 63.1 (60.1 to 66) |
| Myalgia | 44; 29.3 (22.6 to 37.1) | 178; 29 (25.5 to 32.7) | 46; 19.5 (14.9 to 25.0) | 268; 26.8 (24.1 to 29.6) |
| Diarrhea | 29; 19.3 (13.8 to 26.4) | 157; 25.6 (22.3 to 29.2) | 50; 21.2 (16.5 to 26.8) | 236; 23.6 (21.1 to 26.3) |
| Chills | 25; 16.7 (11.6 to 23.4) | 122; 19.9 (16.9 to 23.2) | 40; 16.9 (12.7 to 22.3) | 187; 18.7 (16.4 to 21.2) |
| Nausea or vomiting | 15; 10 (6.2 to 15.8) | 139; 22.6 (19.5 to 26.1) | 24; 10.2 (6.9 to 14.7) | 178; 17.8 (15.6 to 20.3) |
| Headache | 21; 14 (9.3 to 20.5) | 65; 10.6 (8.4 to 13.3) | 15; 6.4 (3.9 to 10.2) | 101; 10.1 (8.4 to 12.1) |
| Sore throat | 17; 11.3 (7.2 to 17.4) | 48; 7.8 (5.9 to 10.2) | 19; 8.1 (5.2 to 12.2) | 84; 8.4 (6.8 to 10.3) |
| Rhinorrhea | 16; 10.7 (6.7 to 16.6) | 49; 8 (6.1 to 10.4) | 18; 7.6 (4.9 to 11.7) | 83; 8.3 (6.7 to 10.2) |
| Sputum | 9; 6 (3.2 to 11.0) | 57; 9.3 (7.2 to 11.8) | 15; 6.4 (3.9 to 10.2) | 81; 8.1 (6.6 to 10.0) |
| Syncope | 6; 4 (1.8 to 8.5) | 35; 5.7 (4.1 to 7.8) | 7; 3 (1.4 to 60) | 48; 4.8 (3.6 to 6.3) |
| Conjunctival congestion | 0; 0 (0.0 to 2.5) | 2; 0.3 (0.1 to 1.2) | 3; 1.3 (0.4 to 3.7) | 5; 0.5 (0.2 to 1.2) |
Hospital course and outcomes of inpatients
Table 3 provides an overview of the hospital course of the patients in our study. Of the 1000 patients, 910 patients reached a primary endpoint as of 30 April: 699 patients had been discharged, 211 had died in the hospital, and 90 were still in hospital. Of the 150 patients treated in the emergency department, 128 (85.3%) were discharged and 22 (14.7%) died before admission; 86 of the 614 patients (14.0%) treated in hospital (not intensive care units) died. Of 236 patients treated in intensive care units, 220 (93.2%) were intubated at least once, 74 (31.4%) were extubated at least once, and 46 (19.5%) were discharged; 103 (43.6%) died in the hospital and 87 (36.9%) remain in hospital. Most patients in intensive care units (174/236, 73.7%) required supplemental oxygen within three hours of arriving at the emergency department and received a nasal cannula (143/236, 60.6%) or a non-rebreather face mask (174/236, 73.7%). Less than 10% received high flow nasal cannula oxygen therapy (19/236) or non-invasive positive pressure ventilation (7/236) during their stay in hospital (supplemental table 4). In our multivariate Cox models, age, body mass index, and pre-existing HIV or renal disease were statistically significantly associated with death, while sex and hypertension were associated with intubation and the composite outcome of intubation or death (supplemental table 5).
Table 3.
Inpatient characteristics, drug treatments, and complications of patients with coronavirus disease 2019 stratified by highest level of care received during their hospital stay. Data are reported as frequencies (number) and column percentages (%; 95% confidence interval) unless stated otherwise
| Characteristics, treatments, and complications | Highest level of care | Overall | ||
|---|---|---|---|---|
| Emergency department (n=150) | In hospital (not intensive care units; n=614) | Intensive care units (n=236) | ||
| Currently in hospital | 0; 0 (0.0 to 2.5) | 3; 0.5 (0.2 to 1.4) | 87; 36.9 (31.0 to 43.2) | 90/1000; 9 (7.4 to 10.9) |
| Discharged | 128; 85.3 (78.8 to 90.1) | 525; 85.5 (82.5 to 88.1) | 46; 19.5 (14.9 to 25.0) | 699/1000; 69.9 (67.0 to 72.7) |
| Died in hospital | 22; 14.7 (9.9 to 21.2) | 86; 14 (11.5 to 17.0) | 103; 43.6 (37.5 to 50.0) | 211/1000; 21.1 (18.7 to 23.7) |
| Intubated (at least once) | 12; 8 (4.6 to 13.5) | 1; 0.2 (0.0 to 0.9) | 220; 93.2 (89.3 to 95.8) | 233/1000; 23.3 (20.8 to 26.0) |
| Extubated (at least once) | 1; 0.7 (0.1 to 3.7) | 0; 0 (0.0 to 0.6) | 74; 31.4 (25.8 to 37.5) | 75/1000; 7.5 (6.0 to 9.3) |
| Median length of stay in days (IQR)* | — | 4 (2-8) | 23 (12-32) | 6 (3-14) |
| Inpatient drug treatments | ||||
| ACEi/ARBs | — | 32; 5.2 (3.7 to 7.3) | 7; 3 (1.4 to 6.0) | 39/850; 4.6 (3.4 to 6.2) |
| NSAIDs | — | 89; 14.5 (11.9 to 17.5) | 30; 12.7 (9.1 to 17.6) | 119/850; 14 (11.8 to 16.5) |
| Statins | — | 156; 25.4 (22.1 to 29.0) | 62; 26.3 (21.1 to 32.2) | 218/850; 25.6 (22.8 to 28.7) |
| Diuretics | — | 73; 11.9 (9.6 to 14.7) | 178; 75.4 (69.6 to 80.5) | 251/850; 29.5 (26.6 to 32.7) |
| Inotropes | — | 0; 0 (0.0 to 0.6) | 30; 12.7 (9.1 to 17.6) | 30/850; 3.5 (2.5 to 5.0) |
| Vasopressors | — | 16; 2.6 (1.6 to 4.2) | 222; 94.1 (90.3 to 96.4) | 238/850; 28 (25.1 to 31.1) |
| Intravenous immunoglobulin | — | 2; 0.3 (0.1 to 1.2) | 5; 2.1 (0.9 to 4.9) | 7/850; 0.8 (0.4 to 1.7) |
| Steroids | — | 60; 9.8 (7.7 to 12.4) | 118; 50 (43.7 to 56.3) | 178/850; 20.9 (18.3 to 23.8) |
| Hydroxychloroquine | — | 331; 53.9 (50.0 to 57.8) | 212; 89.8 (85.3 to 93.1) | 543/850; 63.9 (60.6 to 67.0) |
| Tocilizumab | — | 13; 2.1 (1.2 to 3.6) | 38; 16.1 (12 to 21.3) | 51/850; 6 (4.6 to 7.8) |
| Remdesivir | — | 7; 1.1 (0.6 to 2.3) | 11; 4.7 (2.6 to 8.2) | 18/850; 2.1 (1.3 to 3.3) |
| Lopinavir/ritonavir | — | 1; 0.2 (0.0 to 0.9) | 1; 0.4 (0.1 to 2.4) | 2/850; 0.2 (0.1 to 0.9) |
| Any antibiotics | — | 328; 53.4 (49.5 to 57.3) | 224; 94.9 (91.3 to 97.1) | 552/850; 64.9 (61.7 to 68.1) |
| Azithromycin | — | 235; 38.3 (34.5 to 42.2) | 170; 72 (66.0 to 77.4) | 405/850; 47.6 (44.3 to 51.0) |
| Ceftriaxone | — | 117; 19.1 (16.1 to 22.4) | 84; 35.6 (29.8 to 41.9) | 201/850; 23.6 (20.9 to 26.6) |
| Doxycycline | — | 31; 5 (3.6 to 7.1) | 19; 8.1 (5.2 to 12.2) | 50/850; 5.9 (4.5 to 7.7) |
| Levofloxacin | — | 7; 1.1 (0.6 to 2.3) | 14; 5.9 (3.6 to 9.7) | 21/850; 2.5 (1.6 to 3.7) |
| Meropenem | — | 8; 1.3 (0.7 to 2.5) | 72; 30.5 (25.0 to 36.7) | 80/850; 9.4 (7.6 to 11.6) |
| Piperacillin-tazobactam | — | 66; 10.7 (8.5 to 13.4) | 184; 78 (72.3 to 82.8) | 250/850; 29.4 (26.4 to 32.6) |
| Vancomycin | — | 28; 4.6 (3.2 to 6.5) | 139; 58.9 (52.5 to 65.0) | 167/850; 19.6 (17.1 to 22.5) |
| Other antibiotics | — | 49; 8 (6.1 to 10.4) | 96; 40.7 (34.6 to 47.0) | 145/850; 17.1 (14.7 to 19.7) |
| Hospital complications | ||||
| Acute respiratory distress syndrome | — | 87; 14.2 (11.6 to 17.2) | 212; 89.8 (85.3 to 93.1) | 299/850; 35.2 (32.0 to 38.4) |
| Acute kidney injury | — | 104; 16.9 (14.2 to 20.1) | 184; 78 (72.3 to 82.8) | 288/850; 33.9 (30.8 to 37.1) |
| Inpatient dialysis | — | 34; 5.5 (4.0 to 7.6) | 83; 35.2 (29.4 to 41.5) | 117/850; 13.8 (11.6 to 16.2) |
| New onset arrhythmia | — | 17; 2.8 (1.7 to 4.4) | 62; 26.3 (21.1 to 32.2) | 79/850; 9.3 (7.5 to 11.4) |
| Ventilator associated pneumonia | — | 0; 0 (0.0 to 0.6) | 58; 24.6 (19.5 to 30.4) | 58/850; 6.8 (5.3 to 8.7) |
| New onset heart failure | — | 6; 1 (0.4 to 2.1) | 18; 7.6 (4.9 to 11.7) | 24/850; 2.8 (1.9 to 4.2) |
| Myocardial infarction | — | 1; 0.2 (0.0 to 0.9) | 7; 3 (1.4 to 6.0) | 8/850; 0.9 (0.5 to 1.8) |
| Mechanical circulatory support (ECMO) | — | 0; 0 (0.0 to 0.6) | 5; 2.1 (0.9 to 4.9) | 5/850; 0.6 (0.3 to 1.4) |
ACEi=angiotensin converting enzyme inhibitor; ARB=angiotensin receptor blocker; ECMO=extra corporeal membrane oxygenation; IQR=interquartile range; NSAID=non-steroidal anti-inflammatory drug.
The intubated patient row includes all patients who were intubated at least once—they might be intubated, extubated, reintubated, or have died. Patients who were extubated are only those who were successfully extubated, including patients who died later in hospital. Ninety patients have not reached the end of their hospital stay and their charts continue to be reviewed. For inpatient drug treatments and complications, overall column includes patients in hospital only (n=850). These are the outcomes reviewed as of 30 April 2020.
Median length of stay is calculated as days from admission to either discharge, death, or last chart review.
Overall, 64.9% (552/850) of patients in hospital received over 48 hours of antibiotic treatment during their stay (most commonly azithromycin) and 63.9% (543/850) received hydroxychloroquine (table 3). Both treatments were more prevalent in patients in intensive care units, with 94.9% (224/236) on antibiotics and 89.8% (212/236) on hydroxychloroquine; 94.1% (222/236) of patients in intensive care units received vasopressors at some point during their hospital stay.
Across all patients in hospital with covid-19, 33.9% (288/850) developed acute kidney injury and 13.8% (117/850) required inpatient dialysis (table 3). In intensive care units, acute kidney injury and dialysis were even more common at 78.0% (184/236) and 35.2% (83/236), respectively. Acute respiratory distress syndrome was diagnosed in 35.2% (299/850) of all patients in hospital and in 89.8% (212/850) of patients in intensive care units.
Time course of patients who were intubated
The time from the first reported symptoms to initial intubation (for the 136 patients who were intubated and had exact date of first symptom recorded) appears bimodal (P=0.004 for multimodality), with modes at three to four days and at nine days after symptom onset (fig 1). For patients who had exact date of first symptom recorded and ultimately required mechanical ventilation, 95.6% (130/136) were first intubated within 14 days after symptom onset. Additionally, 71.6% (161/225) were intubated within the first three days after arrival at the emergency department (supplemental fig 1).
Fig 1.
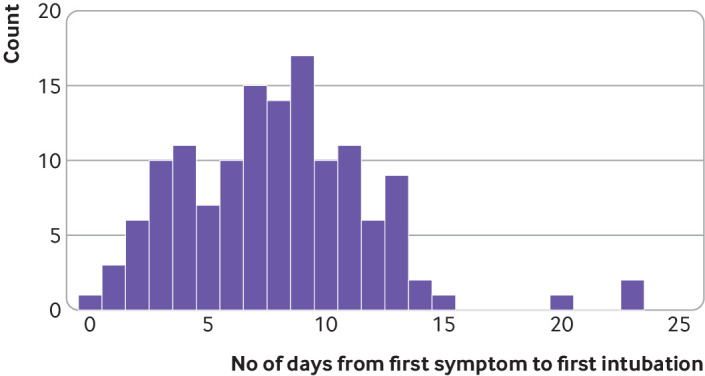
Distribution of time from first symptom to intubation for 136 patients who had exact date of first symptom recorded. The time from first symptom to first intubation follows a bimodal distribution (P=0.004 for Hartigan’s dip test18), with modes at three to four days and at nine days
Of patients who were intubated, 32.2% (75/233) were extubated at least once, 47.6% (111/233) died in hospital, 15.5% (36/233) were discharged from hospital, and 36.9% (86/233) were still in hospital at the time of reporting. Figure 2 shows the hospital timeline for each patient who was intubated (exact time of intubation recorded), starting from presentation at the emergency department, and stratified by clinical status (death, discharge, or still in hospital). Median time of invasive mechanical ventilation (for first intubation) was 6.0 days (interquartile range 2.0-13.0) in patients who died, 9.0 (6.5-12.0) in those who were discharged, and 28.5 (22.25-31.75) in patients who were still in hospital.
Fig 2.

Timeline of patients with coronavirus disease 2019 who were intubated. Exact times of intubation were documented in electronic health records (n=224) at Columbia University Irving Medical Center. Patients are stratified by endpoints: death, discharge, or still in hospital as of 30 April 2020. ED=emergency department; IQR=interquartile range
Discussion
Principal findings
In our characterization of the first 1000 consecutive patients with covid-19 who received care in the emergency department or in hospital at NYP/CUIMC, we found a bimodal distribution for time to intubation from symptom onset. Our cohort had high rates of baseline comorbidities and a substantial proportion developed acute kidney injury, required inpatient dialysis, had prolonged intubation time and length of stay. Through manually abstracted data, this retrospective study provides an in-depth description of patients with covid-19 at a more granular level than previous literature. We found a bimodal distribution for time to intubation, which could suggest a biphasic nature to the covid-19 disease process. We hope a better understanding of our patient population, baseline characteristics, hospital course, and clinical outcomes can provide valuable guidance to clinicians who are working in a time of unparalleled volume and uncertainty.
Comparison with other studies
We found higher rates of renal complications in our patient sample compared with previous research. Studies from China reported 15% of all patients with covid-19 developed acute kidney injury,11 while a case series in Seattle found 19.1% developed this condition.5 However, we found 33.9% of all patients with covid-19 and 78.0% of patients in intensive care units developed acute kidney injury, a striking increase compared with previous reports. Concomitantly, 13.8% of all patients and 35.2% of patients in intensive care units required inpatient dialysis, leading to a shortage of equipment needed for dialysis and continuous renal replacement therapy. Similar experiences with slightly lower rates of acute kidney injury and continuous renal replacement therapy have been reported in other hospitals in New York City,6 resulting in the shared allocation of dialysis machines across patients, including those in intensive care units. Several explanations can be suggested for these higher rates of renal complications. When treating patients with acute respiratory distress syndrome, providers often limit use of intravenous fluids, and this lung protective fluid management strategy might have incidentally led to higher rates of acute kidney injury. Alternatively, there might be inherent renal toxicity associated with the pathophysiology of covid-19 given that the rates of acute kidney injury are high even in patients not receiving intensive care or in those without acute respiratory distress syndrome. These rates might also be relatively higher than previous studies because of the high acuity and increased comorbidities of our patient population.
Our patients had a higher average body mass index, greater prevalence of hypertension, diabetes, and chronic pulmonary disease than those characterized in Italian and Chinese cohorts10 11 12 13; however fewer patients had no major comorbidity (8.2% v 32% and 52%, respectively). During the study period, New York City encouraged patients with mild symptoms to stay at home, and NYP/CUIMC implemented triaging practices (including cough, cold, and fever clinics, initial evaluation in tents outside the emergency department, and telemedicine follow-up) to manage patients without severe dyspnea at home. Therefore, the patients who tested positive at NYP/CUIMC probably represented a higher acuity subset of patients with symptoms. However, patients with covid-19 in this sample have so far had similar mortality rates to patients in the epicenters of other countries. Across all levels of care, 21.1% of patients died, which is similar to other mortality rates in the New York region (18.5-21%),9 15 and lies between estimates from China (1.4-28%).11 12 21 In our sample, the mortality rate of patients in intensive care units is 43.6%, while previous reports have suggested highly variable mortality rates in Italy (26%), China (38% and 78%), and Seattle (50% and 67%).5 7 10 11 13 However, because 36.9% of patients treated in intensive care units are still in hospital, the mortality will probably continue to rise.
Implications for clinical practice
The characterizations of prolonged intubation time and a bimodal distribution in time to intubation from symptom onset could help clinicians identify when patients are at high risk and anticipate disease progression. Of the 233 patients intubated at least once, 95.6% were intubated within the first 14 days of symptom onset, with bimodal peaks at three to four days and at nine days after symptom onset. Patients often undergo rapid respiratory decompensation, which leads to increased clinician uncertainty. These findings might encourage plans for continued monitoring and vigilance despite clinical stability or improvement if patients are between the peaks at three to four days, and at nine days. However, providers could be reassured to de-escalate or discharge when patients are on a stable or improving trajectory after 14 days of symptoms, thereby optimizing hospital beds and resource utilization. This pattern might be because of the underlying pathophysiology, different response groups, or phenotypes of patients who develop critical illness at different times or changing practice patterns. However, supplemental figure 2 shows that this distribution has not clearly varied over the course of this study, which suggests that practice patterns over time are less likely to be the primary factor behind this finding. In previous reports from China, patients tended to develop acute respiratory distress syndrome around day 12.11 Another paper from Italy hypothesized that older patients with covid-19 tend to develop dyspnea five to seven days after symptom onset, whereas younger patients tend to develop dyspnea later.8 Further work is necessary to understand the mechanisms driving this distribution of intubation times because it could dictate the timing of interventions and treatments.
Length of stay and total time on mechanical ventilation remain high for patients with covid-19, with major implications for post recovery needs and sequelae. To date, our total cohort had a median length of stay of six days, which increased to 23 days for patients in intensive care units. The overall length of stay was comparable to two cohorts in China, with median length of stay of 11 and 12 days, respectively.11 12 However, length of stay for our patients in intensive care units is considerably longer than that for one of the Chinese studies, which reports a length of study of only eight days.11 In addition, our median length of stay will continue to rise given that 36.9% of patients in intensive care units were still in hospital at last review. Median time on mechanical ventilation for our patients who are still in hospital was over 28 days and rising, which dramatically exceeds the total length of hospital stay for most patients in China. While the overall hospital course is comparable to previous influenza cohorts, the length of stay of patients who are critically ill exceeds those of patients with influenza who have reported median intubation durations of 10-12 days.21 22 Understanding and anticipating this prolonged intubation course might help provide guidance on resource utilization and hospital capacity. Aftercare planning for patients after discharge from intensive care units will also be critically important. Lengthy intubations and hospital admissions have profound implications for rehabilitation, critical illness neuropathy, discharge planning, physical therapy,23 24 25 increased home needs during a time of social distancing, and potential difficulties in returning to baseline functional status.
As the covid-19 pandemic progresses, the characterization of these patients and outcomes might be more representative of the evolving clinical presentation and course that hospitals around the world could expect to see. These results might help guide the development of patient protocols (such as safe discharge guidelines and follow-up practices), inform emergency medical system responses, and drive the continued growth of telemedicine and remote monitoring.26 While an understanding of our experience might be helpful to hospitals and healthcare workers as they prepare to triage patients, we recognize that patients with covid-19 who require hospital admission will have high morbidity and mortality rates, and a substantial proportion will require beds in intensive care units, ventilators, or dialysis. These sobering facts should motivate efforts to further investigate a potential biphasic disease course suggested by the distribution of intubations, model the resource needs across hospitals and countries based on these rising rates of complications, and continue to develop interventions to change the course of the disease.
Limitations of this study
This study has several limitations. Firstly, data collection is limited to what is documented in the electronic health records. Errors could exist in both patient recall and clinician documentation. Secondly, accuracy of data is limited by the accuracy of the data abstraction itself. We attempt to mitigate potential errors with manual quality control and by implementing a series of checks in the data after export from the REDCap database. Thirdly, not all patients included in this study have completed their hospital admission and might have evolving outcomes or levels of care, although we now have a minimum follow-up of 24 days. Data were collected from a single, urban academic medical center and might not be generalizable to all other regions. Finally, multivariate modeling on this population might be limited by residual confounding and bias. However, the urgency for data to inform clinicians has motivated us to provide this snapshot of patients at the point of last data abstraction on 30 April 2020. We deliberately focused on characterizing the data in this paper to provide descriptive statistics and figures rather than hypothesis driven statistical inference.
Conclusion
Our study found that patients in hospital with covid-19 in New York City had high rates of baseline comorbidities and a substantial proportion developed complications compared with previously studied US and international cohorts. These patients faced major morbidity and mortality, with high rates of acute kidney injury and inpatient dialysis, prolonged intubations, and a bimodal distribution of time to intubation from symptom onset. Our characterization of patients could provide anticipatory guidance as the pandemic continues around the world.
What is already known on this topic
Coronavirus disease 2019 (covid-19) is a global pandemic, with New York City a new epicenter of the disease
The high burden of disease has quickly exceeded the standard capacity of hospital systems and has raised concerns about optimal clinical management, safe maximization of hospital throughput, and resource allocation
Frontline healthcare providers have limited data to help anticipate the clinical course of these patients and how they compare with previous international cohorts
What this study adds
Patients with covid-19 who required mechanical ventilation had a bimodal distribution in time to intubation from symptom onset, with most first intubated within 14 days
Patients in hospital, particularly those in intensive care units, had more comorbidities, longer intubations, and higher rates of acute kidney injury and inpatient dialysis than previous international cohorts
These findings might help inform frontline providers and provide anticipatory guidance for the international community during this pandemic
Acknowledgments
We wish to acknowledge the dedication, commitment, and sacrifice of the staff, providers and personnel at our institutions through the local covid-19 crisis and express our profound sadness about the suffering and loss of our patients, their families, and our community. We would also like to express our gratitude to the patients whose records were used in this study, without whom this research would not be possible. Finally, we would like to acknowledge the Weill Cornell Medicine COVID-19 Registry Team, which developed the chart abstraction tool used in this study and assisted with training of the VP&S medical students in the chart abstraction process.
Web extra.
Extra material supplied by authors
Web appendix: Supplementary appendix
Contributors: MGA, SLB, CLS, and JRT contributed equally and share first authorship. Study conception and design: MGA, SLB, CLS, JRT, GH, RC, KN, PG, MMS, JJC, FMB, LAC, KAE, ZPG, NH, SH, JHdJ, LEK, HL, AL, RL, and ACS. Acquisition, analysis, or interpretation of data: MGA, SLB, CLS, JRT, GH, RC, KHC, KN, PAA, FMB, RB, MFC, MIC, LAC, JHdJ, LBD, SAD, KAE, ZPG, DTG, AAH, NH, SH, LEK, HL, EL, AL, RL, AYS, ACS, ZES, CPS, YX, and HWZ. Drafting of the manuscript: MGA, SLB, CLS, and JRT. Critical revision of the manuscript for important intellectual content: MGA, SLB, CLS, JRT, GH, RC, MRB, BPC, NG, PG, AMM, AAP, MSR, NWS, SS, MES, RGB, KHC, JJC, MMS, and JEZ. Statistical analysis: MGA, SLB, CLS, and JRT. Administrative, technical, or material support: MGA, SLB, CLS, JRT, SS, GH, RC, and KN. Study supervision: GH, RC, and KN. GH and RC are the guarantors of the study. The corresponding author attests that all listed authors meet authorship criteria and that no others meeting the criteria have been omitted.
Funding: This study received no specific funding or grant from any agency in the public, commercial, or not-for-profit sectors. MRB is supported by UL1 TR001873. RGB is supported by grant R01HL077612 and R01HL093081 from the US National Institute of Health. BPC is supported by grants R01 HL141811 and R01 HL146911 from the National Heart Lung and Blood Institute. KHC is supported by grant T32HL007854 from US National Institutes of Health/National Heart, Lung, and Blood Institute. JJC is supported by grants from the US National Institute of Health/National Center for Advancing Translational Science. GH is supported by grant R01 LM006910 from the US National Institute of Health/National Library of Medicine. RC is supported by grant T15 LM007079 from the US National Institute of Health/National Library of Medicine. No funding organization or sponsor was involved in the design and conduct of the study; collection, management, analysis, and interpretation of the data; preparation, review, or approval of the manuscript; and decision to submit the manuscript for publication.
Competing interests: All authors have completed the ICMJE uniform disclosure form at www.icmje.org/coi_disclosure.pdf and declare: no support from any organization for the submitted work; no competing interests with regards to the submitted work; MMS reports grants from Amgen, outside the submitted work; JJC reports personal fees from Allergan, outside the submitted work; RGB reports grants from Alpha1 Foundation and COPD Foundation, outside the submitted work; GH reports grants from Janssen Research, outside the submitted work; the remaining authors have nothing to disclose.
Ethical approval: This study was approved by the Columbia University institutional review board under protocol AAAS9834. Patient consent was not applicable to this study as per Columbia IRB protocol.
Data sharing: Requests for the statistical code and dataset can be made to the corresponding author.
The corresponding author affirms that the manuscript is an honest, accurate, and transparent account of the study being reported. No important aspects of the study have been omitted, and all discrepancies from the study as planned have been explained.
Dissemination to participants and related patient and public communities: We disseminated the findings of this study to all clinical departments caring for patients with covid-19 at author-affiliated institutions. In addition, our media relations departments will plan to further disseminate through press releases, social media, and on institutional web sites upon publication.
References
- 1. NYC Department of Health COVID-19. Data (Basel) 2020. [Google Scholar]
- 2. Ranney ML, Griffeth V, Jha AK. Critical supply shortages - The need for ventilators and personal protective equipment during the covid-19 pandemic. N Engl J Med 2020;382:e41. 10.1056/NEJMp2006141 [DOI] [PubMed] [Google Scholar]
- 3. Prin M, Wunsch H. International comparisons of intensive care: informing outcomes and improving standards. Curr Opin Crit Care 2012;18:700-6. 10.1097/MCC.0b013e32835914d5 [DOI] [PMC free article] [PubMed] [Google Scholar]
- 4. Emanuel EJ, Persad G, Upshur R, et al. Fair allocation of scarce medical resources in the time of covid-19. N Engl J Med 2020. 10.1056/NEJMsb2005114 [DOI] [PubMed] [Google Scholar]
- 5. Arentz M, Yim E, Klaff L, et al. Characteristics and outcomes of 21 critically ill patients with covid-19 in Washington State. JAMA 2020. 10.1001/jama.2020.4326 [DOI] [PMC free article] [PubMed] [Google Scholar]
- 6. Goyal P, Choi JJ, Pinheiro LC, et al. Clinical characteristics of covid-19 in New York City. N Engl J Med 2020. 10.1056/NEJMc2010419 [DOI] [PMC free article] [PubMed] [Google Scholar]
- 7. Bhatraju PK, Ghassemieh BJ, Nichols M, et al. Covid-19 in critically ill patients in the Seattle region - case series. N Engl J Med 2020. 10.1056/NEJMoa2004500 [DOI] [PMC free article] [PubMed] [Google Scholar]
- 8. Cascella M, Rajnik M, Cuomo A, Dulebohn SC, Di Napoli R. Features, evaluation and treatment coronavirus (covid-19). StatPearls, 2020. [PubMed] [Google Scholar]
- 9. Richardson S, Hirsch JS, Narasimhan M, et al. and the Northwell COVID-19 Research Consortium Presenting characteristics, comorbidities, and outcomes among 5700 patients hospitalized with covid-19 in the New York City area. JAMA 2020. 10.1001/jama.2020.6775 [DOI] [PMC free article] [PubMed] [Google Scholar]
- 10. Huang C, Wang Y, Li X, et al. Clinical features of patients infected with 2019 novel coronavirus in Wuhan, China. Lancet 2020;395:497-506. 10.1016/S0140-6736(20)30183-5 [DOI] [PMC free article] [PubMed] [Google Scholar]
- 11. Zhou F, Yu T, Du R, et al. Clinical course and risk factors for mortality of adult inpatients with COVID-19 in Wuhan, China: a retrospective cohort study. Lancet 2020;395:1054-62. 10.1016/S0140-6736(20)30566-3 [DOI] [PMC free article] [PubMed] [Google Scholar]
- 12. Guan WJ, Ni ZY, Hu Y, et al. China Medical Treatment Expert Group for Covid-19 Clinical characteristics of coronavirus disease 2019 in China. N Engl J Med 2020;382:1708-20. 10.1056/NEJMoa2002032 [DOI] [PMC free article] [PubMed] [Google Scholar]
- 13. Grasselli G, Zangrillo A, Zanella A, et al. Baseline characteristics and outcomes of 1591 patients infected with SARS-CoV-2 admitted to ICUs of the Lombardy region. JAMA 2020. [DOI] [PMC free article] [PubMed] [Google Scholar]
- 14. Cummings MJ, Baldwin MR, Abrams D, et al. Epidemiology, clinical course, and outcomes of critically ill adults with COVID-19 in New York City: a prospective cohort study. Lancet 2020. 10.1016/S0140-6736(20)31189-2 [DOI] [PMC free article] [PubMed] [Google Scholar]
- 15.Petrilli CM, Jones SA, Yang J, et al. Factors associated with hospitalization and critical illness among 4,103 patients with COVID-19 disease in New York City. medRxiv. 2020.
- 16. Sessler CN, Gosnell MS, Grap MJ, et al. The Richmond Agitation-Sedation Scale: validity and reliability in adult intensive care unit patients. Am J Respir Crit Care Med 2002;166:1338-44. 10.1164/rccm.2107138 [DOI] [PubMed] [Google Scholar]
- 17.NYS Department of Health. NYS Health Profiles - New York Presbyterian - Columbia Presbyterian Center 2020.
- 18. Harris PA, Taylor R, Thielke R, Payne J, Gonzalez N, Conde JG. Research electronic data capture (REDCap)--a metadata-driven methodology and workflow process for providing translational research informatics support. J Biomed Inform 2009;42:377-81. 10.1016/j.jbi.2008.08.010 [DOI] [PMC free article] [PubMed] [Google Scholar]
- 19. R Development Core Team R: A language and environment for statistical computing. R Foundation for Statistical Computing, 2010. [Google Scholar]
- 20. Hartigan PM. Algorithm AS 217: Computation of the dip statistic to test for unimodality. J R Stat Soc Ser C Appl Stat 1985;34:320-5. [Google Scholar]
- 21. Beumer MC, Koch RM, van Beuningen D, et al. Influenza virus and factors that are associated with ICU admission, pulmonary co-infections and ICU mortality. J Crit Care 2019;50:59-65. 10.1016/j.jcrc.2018.11.013 [DOI] [PMC free article] [PubMed] [Google Scholar]
- 22. Rello J, Rodríguez A, Ibañez P, et al. H1N1 SEMICYUC Working Group Intensive care adult patients with severe respiratory failure caused by Influenza A (H1N1)v in Spain. Crit Care 2009;13:R148. 10.1186/cc8044 [DOI] [PMC free article] [PubMed] [Google Scholar]
- 23. Fletcher SN, Kennedy DD, Ghosh IR, et al. Persistent neuromuscular and neurophysiologic abnormalities in long-term survivors of prolonged critical illness. Crit Care Med 2003;31:1012-6. 10.1097/01.CCM.0000053651.38421.D9 [DOI] [PubMed] [Google Scholar]
- 24. Kim MJ, Park YH, Park YS, Song YH. Associations between prolonged intubation and developing post-extubation dysphagia and aspiration pneumonia in non-neurologic critically ill patients. Ann Rehabil Med 2015;39:763-71. 10.5535/arm.2015.39.5.763 [DOI] [PMC free article] [PubMed] [Google Scholar]
- 25. Helms J, Kremer S, Merdji H, et al. Neurologic features in severe SARS-CoV-2 Infection. N Engl J Med 2020. 10.1056/NEJMc2008597 [DOI] [PMC free article] [PubMed] [Google Scholar]
- 26. Hollander JE, Carr BG. Virtually perfect? Telemedicine for covid-19. N Engl J Med 2020;382:1679-81. 10.1056/NEJMp2003539 [DOI] [PubMed] [Google Scholar]
Associated Data
This section collects any data citations, data availability statements, or supplementary materials included in this article.
Supplementary Materials
Web appendix: Supplementary appendix