

Abstract
The inflammatory proliferation of fibroblast-like synoviocytes (FLSs) and functional imbalances in T lymphocytes play critical roles in the pathogenesis of rheumatoid arthritis (RA). The clinical efficacy of Huayu Tongbi Fang (HYTB, a traditional herbal formula) in RA treatment has been validated. In this study, we aimed to explore the regulatory mechanisms of HYTB on the proliferation and differentiation of T lymphocytes, and the inhibitory effect of HYTB on inflammatory proliferation of FLSs. The RCS-364 (Rat FLSs) cells were cocultured with rat splenic lymphocytes that were induced by interleukin-1β in Transwell chambers. After freeze-dried HYTB powder treatment, the percentage of T-cell subset and apoptosis rates of FLSs were measured using flow cytometry. Furthermore, protein expression of key molecules of NF-κB and JAK/STAT signaling pathways was quantified using Western blot. The granulocyte-macrophage colony-stimulating factor (GM-CSF) was measured using enzyme-linked immunosorbent assay. The results showed that HYTB could inhibit the inflammatory proliferation of FLSs through inducing cell apoptosis. Additionally, HYTB treatment could intervene in the proliferation and differentiation of T lymphocytes and regulate protein expression of key molecules in NF-κB and JAK/STAT cell signaling pathways. Moreover, it could inhibit FLS activation by suppressing GM-CSF production by T cells and FLSs. Therefore, the HYTB formula should be used as a traditional medicine against RA in modern complementary and alternative therapies.
1. Introduction
Rheumatoid arthritis (RA) is a chronic inflammatory disease that affects 0.5%–1.0% of adults worldwide. RA joint inflammation is associated with immune cell infiltration, synovial inflammatory hyperplasia, and excessive proinflammatory mediator production, eventually resulting in articular cartilage injury [1, 2]. Although the detailed etiology and pathogenesis of RA remain uncertain, recent studies have demonstrated that inflammatory proliferation and activation of fibroblast-like synoviocytes (FLSs) and abnormal T-cell subset differentiation play critical roles in RA pathogenesis [3, 4]. T-cell activation also contributes to RA pathogenesis. Abnormal balance of T helper cells, Th1/Th2, and Treg/Th17 induces the inflammatory immune response and FLS activation. FLSs produce proinflammatory cytokines and chemokines, recruit effective T cells to synovial tissue in the joint, and initiate autoimmune arthritis. The proinflammatory cytokine secretion, including granulocyte-macrophage colony-stimulating factor (GM-CSF), initiates and augments autoimmune arthritis [5–8]. Effective Th cells and activating FLSs participate in autoimmune responses and aggravate bone and cartilage degradation [9, 10].
The nuclear factor-κB (NF-κB) signaling pathway is related to several pathophysiological changes including inflammation, cell survival, proliferation, and differentiation. Activation of this pathway regulates proinflammatory cytokine production and accelerates the RA pathological progression. Moreover, inflammatory cytokines activate the Janus kinase/signal transducers and activators of transcription (JAK/STAT) signaling pathway (also known as IL-6 signal pathway) and elevate the matrix metalloproteinase gene expression, resulting in apoptosis resistance in FLSs [11]. The proinflammatory cytokines activate Th17 and FLSs to secrete GM-CSF. GM-CSF stimulates monocytes, dendritic cells (DCs), and Th17 cells and augments innate and adaptive immune cell activation and the synovitis in joints [10].
Huayu Tongbi Fang (HYTB), a Chinese herbal formula, is considered to improve the RA pathological microenvironment by activating blood circulation, dissipating blood stasis, and dredging meridians and collaterals. Its curative effect and drug safety have been established through long clinical practice in RA treatment. Despite the good curative effect of HYTB in RA treatment [12], the mechanisms for inhibiting abnormal T-cell differentiation and inflammatory proliferation of FLSs are not clear. In this study, RSC-364 cells (Rat FLSs cell line) [4, 13] cocultured with rat lymphocytes that were induced by IL-1β in Transwell chambers were used as cell models. Following freeze-dried HYTB powder treatment, the rates of T-cell subsets and FLSs apoptosis were measured. The expression of key molecules in NF-κB and JAK/STAT signaling pathways and GM-CSF level were also studied. We wanted to explore the possible mechanisms by which HYTB regulates T-cell proliferation and differentiation, thus inhibiting the FLSs activation and inflammatory proliferation.
2. Materials and Methods
2.1. Preparation of the Freeze-Dried HYTB Powder
The modified HYTB formula was composed of six medicinal herbs. The constitution ratio of the six herbs was composed of Ligusticum chuanxiong Hort [4], Dioscorea nipponica Makino [4], Radix Aconiti Lateralis Preparata [2], Astragalus membranaceus [4], Radix Paeoniae Alba [3], and Corydalis yanhusuo [3]. The herbal mixture was soaked in deionized water for 20 min and extracted with boiling water at 10 : 1 (v/w) for 2.5 h. The extracted liquid was collected, and the herb residue was then added with deionized water and boiled for another 1 h. The extracted liquid was collected and combined with the first one. After the water extract was concentrated by heating the mixture at 75°C for 2.5 h. The herbal extract was filtered using a standard test sieve of 150 μm, freeze-dried, and maintained in desiccators at 4°C until use.
2.2. High-Performance Liquid Chromatography-Electrospray Ionization/Mass Spectrometer (HPLC-ESI/MSn) Analysis
The constituents of the freeze-dried HYTB powder were measured using HPLC-ESI/MSn. The specific measuring procedures were based on our previously described method [14]. The PeakView™ 2.2 software was used to analyze the data including retention time, accurate mass, and MS/MS spectrum comparison.
2.3. Cell Viability Assay
Cell viability assay was performed using the cell counting kit-8 (CCK8) method. In brief, RSC-364 cells were seeded into a 96-well plate at a density of 4,000 cells/well for 24 h at 37°C and 5% CO2 in a cell incubator. Following treatment with various HYTB concentrations (0, 10, 50, 100, 250, 500, 750, and 1000 µg/mL, six repetitions) for 24 h at 37°C, cells were added to wells with 10 µL CCK8 (Beyotime, Nanjing, China) per well and incubated for 4 h. Subsequently, optical density (OD) was measured at 450 nm using a Varioskan Flash microplate reader (Thermo Fisher Scientific, Inc.). According to the experimental results, we used the 100 and 250 µg/mL concentrations as cell stimulation concentrations in this study (Figure S1).
2.4. Preparation of Rat Lymphocytes
Sprague Dawley rats (weighing 180–220 g) were obtained from the Beijing Vital River Laboratory Animal Technology Co. Ltd, Beijing, China (certificate number SCXK: 2012-0001). This study was approved by the Institutional Ethics Committee of the Beijing University of Chinese Medicine (No. 17-02, Beijing, China), and all animal protocols complied with the National Institutes of Health Guide for the Care and Use of Laboratory Animals (revised 2011). After intraperitoneal injection (50 mg/kg) of pentobarbital sodium anesthesia, the spleen was isolated under sterile conditions. The rats were sacrificed by intravenous pentobarbital sodium anesthesia (150 mg/kg) administration, and the death of rats after cardiac arrest was confirmed for 30 min. Single-cell suspensions from rat spleens were collected with gentle MACS Dissociator (Macs Miltenyi, Teterow, Germany). The spleens were placed in a homogenate pipe with phosphate-buffered saline (PBS). The suspension was filtered through a 70 μm nylon cell strainer. After centrifugation (1000 rpm, 5 min), cells were resuspended in 5 mL of Red Blood Cell Lysis Buffer for 5 min and centrifuged at 2000 rpm for 5 minutes. The splenic lymphocytes were cultured in 2 mL RPMI-1640 medium supplemented with 3% fetal bovine serum (FBS).
2.5. Cell Culture and Treatment
RSC-364 cells were collected and seeded into six-well culture plates (1 × 10⁶ cells/per well). After synchronization, cells were washed three times with PBS. Transwell inserts were placed onto culture plates. The lymphocytes (1 × 10⁶ cells/per well) were then seeded into the upper chambers. The freeze-dried HYTB powder was dissolved in RPMI-1640 medium. Afterward, cells were stimulated for 12 h and 24 h in RPMI-1640 medium containing 5%. FBS, with 25 ng/mL IL-β alone or together with 25 ng/mL IL-1 receptor antagonist (IL-1RA) or the freeze-dried HYTB powder, at a final concentration of 100 or 250 μg/mL.
2.6. Hematoxylin-Eosin (HE) Staining
RSC-364 cells (1.5 × 10⁵ cells/per well) were seeded into 24-well plates with preplaced coverslips. Lymphocytes (1.5 × 10⁶ cells/per well) were seeded into Transwell upper chambers in separate wells. After 12 or 24 h of treatment, RSC-364 cells were fixed with 95% alcohol for 15 min. Next, cells were stained with hematoxylin and eosin. The stained cells were observed and photographed using a light microscope (DM RAS2, Leica, Solms, Germany).
2.7. Flow Cytometry Analysis
RSC-364 cells were stained using an Annexin V/propidium iodide (PI) apoptosis detection kit (BD Biosciences, MA, USA). After 12 or 24 h of treatment, cells were harvested, washed three times with PBS, and incubated with 5 μL Annexin V-FITC and 10 μL PI for 20 min at room temperature. To measure the Th1, Th2, or Th17 cell percentages, lymphocytes were harvested and stimulated with phorbol 12-myristate 13-acetate (PMA) (50 ng/mL) and ionomycin (Ion) (1 μg/mL) (Sigma, San Francisco, CA, USA) in the presence of GolgiPlug (BD Bioscience) for 5 h at 37°C and 5% CO2 in a cell incubator. After being surface-labeled with anti-rat CD4 PE-Cyanine5 antibody (eBioscience), lymphocytes were blocked, fixed, permeabilized using Fixation/Permeabilization kit (BD Bioscience), and stained with anti-rat IFNγ PE, IL-4 PE-Cyanine7, or IL-17A FITC antibodies (BD Bioscience). The stained apoptotic cells and Th cells were measured using a FACS Calibur cytometer, and data were analyzed using CellQuest software (Beckman Coulter, Brea, CA, USA).
2.8. Enzyme-Linked Immunosorbent Assay (ELISA)
After 12 or 24 h of treatment, the supernatant of the culture solution was collected. The GM-CSF concentrations were measured using ELISA kit (eBioscience), according to the instructions provided by the manufacturer. The optical density of each sample was measured with a plate reader at 450 nm. Subsequently, the GM-CSF levels were quantified using standard curves and shown as the number of picograms per milliliter.
2.9. Western Blot Analysis
After 12 or 24 h of treatment, RSC-364 cells and lymphocytes were harvested. Cells were lysed using RIPA Lysis Buffer containing protease inhibitor cocktail (Sigma, St. Louis, MO, USA). Protein samples (2 mg/ml) were separated by 10% sodium dodecyl sulfate polyacrylamide gel electrophoresis (SDS-PAGE) and electrotransferred onto the polyvinylidene difluoride membranes (Sigma, St. Louis, MO, USA). The membranes were blocked with 5% skim milk and incubated overnight with the following primary antibodies at 4°C: T-bet, GATA-3, RORγt, TRAF2, IKKα/β, phospho-IKKα/β, and NF-κB p50 for lymphocytes; TRAF2, MyD88, IKKα/β, phospho-IKKα/β, NF-κB p50, JAK1, STAT3, and phospho-STAT3 for RSC-364 cells (1 : 1000, Cell Signaling Technology, MA, USA). The membranes were then incubated with horseradish peroxidase- (HRP-) conjugated IgG secondary antibody (1 : 3000, Abcam, Cambridge, MA, USA) at room temperature for 2 h. All immunoreactive proteins were visualized using SuperSignal West Pico Chemiluminescent Substrate (Thermo Scientific, Rockford, IL, USA). Three replicates of each experiment were performed. The densitometry values were normalized to GAPDH and quantified using Image-Pro Plus version 4.0 (Media Cybernetics Inc., Rockville, MD, USA).
2.10. Statistical Analysis
All data are presented as mean ± standard deviation (SD). The SPSS version 13.0 was used for statistical analyses. A P < 0.05 was considered statistically significant.
3. Results
3.1. Identification of Chemical Constituents in HYTB by HPLC-ESI/MSn
Representative liquid chromatography-mass spectrometry chromatograms are shown in Figure 1. Negative (Figure 1(a)) and positive (Figure 1(b)) modes were operated in the HPLC-ESI/MSn experiment. Twenty-five constituents were identified by comparing the retention time with the IDA method. The identified compounds are shown in Table 1.
Figure 1.

HPLC-ESI/MSn total ion chromatograms of HYTB processed by different methods. (a) Negative base peak of MS spectrum. (b) Positive base peak of MS spectrum.
Table 1.
Chemical components identified from HYTB by HPLC-ESI/MSn.
| Peak | Ionization mode | TR (min) | Formula | Identification | Peak area | Area (%) |
|---|---|---|---|---|---|---|
| 1 | + | 1.46 | C5H9NO2 | Proline | 1642000 | 1.8 |
| 2 | − | 1.73 | C7H10O5 | Shikimic acid | 690900 | 1.3 |
| 3 | + | 1.79 | C5H11NO2 | L-Valine | 76360 | 0.1 |
| 4 | + | 12.3 | C23H28O11 | Albiflorin | 3810000 | 4.2 |
| 5 | − | 12.84 | C26H28O14 | Isoschaftoside | 177500 | 0.3 |
| 6 | + | 12.93 | C23H28O11 | Paeoniflorin | 4280000 | 4.7 |
| 7 | − | 13.27 | C9H8O3 | p-Coumaric acid | 140300 | 0.3 |
| 8 | + | 14.21 | C22H22O10 | Calycosin-7-O-glucoside | 2572000 | 2.8 |
| 9 | + | 15.21 | C20H23NO4 | Tetrahydrojatrorrhizine | 7699000 | 8.4 |
| 10 | + | 16.24 | C20H19NO5 | Protopine | 7553000 | 8.3 |
| 11 | − | 16.5 | C7H6O3 | 4-Hydroxybenzoic acid | 813700 | 1.5 |
| 12 | − | 16.88 | C18H16O8 | Rosmarinic acid | 13000000 | 23.7 |
| 13 | + | 17.52 | C20H20NO4 | Jatrorrhizine | 7553000 | 8.3 |
| 14 | + | 17.6 | C20H18NO4 | Epiberberine | 5307000 | 5.8 |
| 15 | + | 17.71 | C19H14NO4 | Coptisine | 11150000 | 12.2 |
| 16 | + | 18 | C21H22O9 | Liquiritin | 906500 | 1.0 |
| 17 | + | 18.72 | C22H27NO4 | Corydaline | 11150000 | 12.2 |
| 18 | − | 19.25 | C26H22O10 | Salvianolic acid A | 2482000 | 4.5 |
| 19 | + | 19.95 | C23H28O10 | Isomucronulatol-7-O-glucoside | 636600 | 1.2 |
| 20 | + | 20.88 | C22H24NO4 | Dehydrocorydaline | 3605000 | 4.0 |
| 21 | + | 25.34 | C16H12O4 | Formononetin | 2911000 | 3.2 |
| 22 | + | 33.75 | C18H14O3 | Dihydrotanshinone I | 2155000 | 2.4 |
| 23 | + | 37.86 | C19H20O3 | Cryptotanshinone | 5041000 | 5.5 |
| 24 | + | 37.89 | C18H12O3 | Tanshinone I | 1663000 | 1.8 |
| 25 | + | 40.2 | C19H18O3 | IIA Tanshinone | 5269000 | 5.8 |
3.2. HYTB Regulated the Differentiation of Th and Treg Cells of Lymphocytes in the Coculture System Induced by IL-1β
The percentages of Th1, Th2, Th17, and Treg cells in lymphocytes were measured by flow cytometry. The Th1 (IFN+CD4+, Figure 2(a)) and Th17 (IL-17+CD4+, Figure 3(a)) cell percentages were significantly increased compared with those of the model group after 12 and 24 h of IL-1β induction. After 12 or 24 h of HYTB treatment, the abnormal differentiation of Th1 and Th17 cells was suppressed. However, the percentages of Th2 (IL-4+CD4+, Figure 4(a)) cells were significantly decreased by IL-1β. After 12 h of HYTB treatment, the number of Th2 cells was significantly increased. The percentages of Treg (CD4+CD25+, Figure 5) cells in the HYTB group (250 μg/mL) were significantly increased compared to those induced by IL-1β alone at these two-time nodes of treatment. These results indicated that HYTB treatment could interfere with the proliferation and differentiation of Th and Treg cells induced by IL-1β, and the regulatory effects were time- and dose-dependent.
Figure 2.
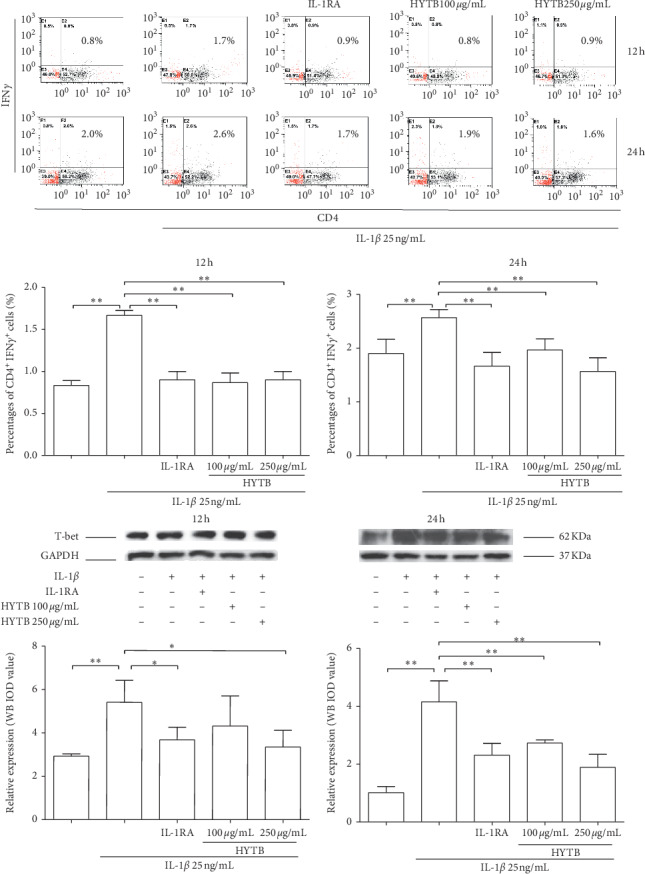
Percentages of CD4+IFNγ+ cells and protein expression of T-bet in lymphocytes after treatment. (a) Flow cytometry histogram. The results are presented in bar charts. (b) T-bet was detected in lymphocytes by Western blot analysis. The quantified results are presented in bar charts. GAPDH is used as an internal control. Data are presented as the mean ± SD (n = 3). ∗P < 0.05 and ∗∗P < 0.01.
Figure 3.

Percentages of CD4+IL-17+ cells and protein expression of RORγt in lymphocytes after treatment. (a) Flow cytometry histogram. The results are presented in bar charts. (b) RORγt was detected in lymphocytes by Western blot analysis. The quantified results are presented in bar charts. GAPDH is used as an internal control. Data are presented as the mean ± SD (n = 3). ∗P < 0.05 and ∗∗P < 0.01.
Figure 4.
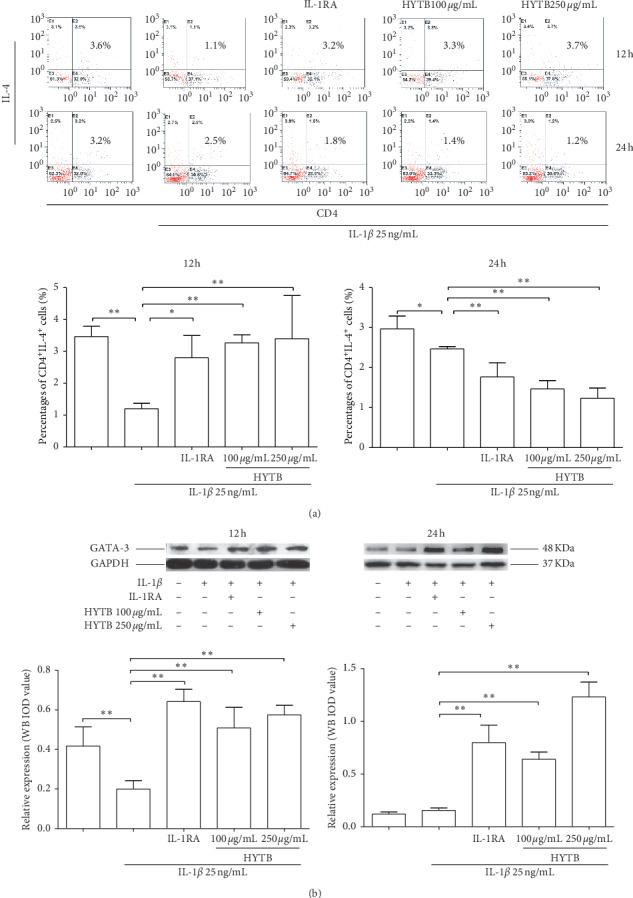
Percentages of CD4+IL-4+ cells and protein expression of GATA-3 in lymphocytes after treatment. (a) Flow cytometry histogram. The results are presented in bar charts. (b) GATA-3 was detected by Western blot analysis. The quantified results are presented in bar charts. GAPDH is used as an internal control. Data are presented as the mean ± SD (n = 3). ∗∗P < 0.01.
Figure 5.

Percentages of CD4+CD25+ cells after treatment. Flow cytometry histogram. The results are presented in bar charts. Data are presented as the mean ± SD (n = 3). ∗P < 0.05 and ∗∗P < 0.01.
To explore HYTB treatment mechanisms on intervening in the proliferation and differentiation of Th cells, the protein expression of specific transcription factors in Th cells was measured using Western blot analysis. As shown in Figures 2(b), 3(b), and 4(b), the T-bet protein levels (the specific transcription factor of Th1) and RORγt (that of Th17) were significantly decreased, and GATA-3 (that of Th2) was remarkably increased in lymphocytes after HYTB treatment at two-time nodes. The regulatory effects of HYTB treatment, especially of 250 μg/mL HYTB treatment groups, were equal or superior to those of IL-1RA groups.
3.3. HYTB Inhibited the Activation of the NF-κB Signaling Pathway in Lymphocytes Induced by IL-1β
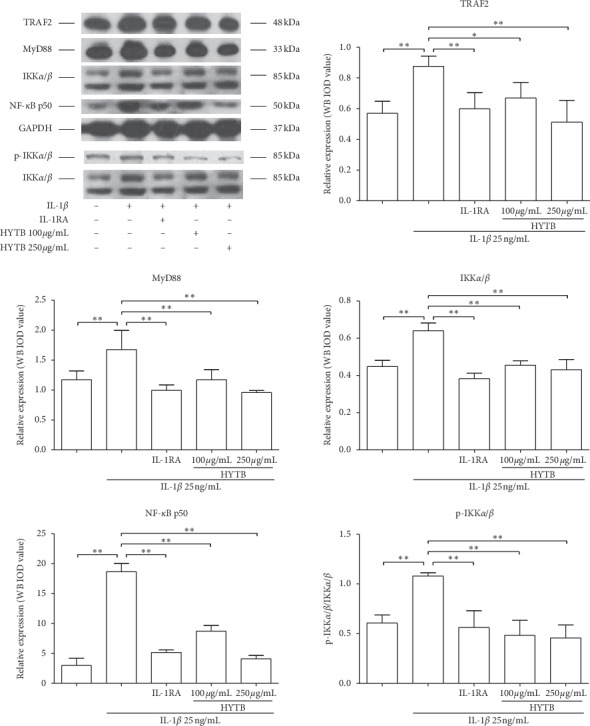
IL-1β can activate the NF-κB signaling pathway and contribute to the inflammatory immune response [15]. We measured the protein levels of key molecules in the NF-κB signaling pathway of lymphocytes after HYTB treatment. As shown in Figures 6 and 7, the protein levels of TRAF2, IKKα/β, and NF-κB p50 were significantly downregulated after 12 and 24 h of HYTB treatment. Phospho-IKKα/β also significantly decreased. The HYTB inhibitory effects (250 μg/mL) of the treatment groups were better than those of the other groups after 24 h of treatment.
Figure 6.

Effect of HYTB on inhibiting the NF-κB signaling pathway activation in lymphocytes after 12 h of treatment. The expression levels of TRAF2, IKKα/β, p-KKα/β, and NF-κB p50 in lymphocytes were measured using the Western blot analysis. The quantified results are presented in bar charts. GAPDH is used as an internal control. Data are presented as the mean ± SD (n = 3). ∗P < 0.05 and ∗∗P < 0.01.
Figure 7.

Effect of HYTB on inhibiting the NF-κB signaling pathway activation in lymphocytes after 24 h of treatment. The expression levels of TRAF2, IKKα/β, p-KKα/β, and NF-κB p50 in lymphocytes were measured using Western blot analysis. The quantified results are presented in bar charts. GAPDH is used as an internal control. Data are presented as the mean ± SD (n = 3). ∗∗P < 0.01.
3.4. HYTB Suppressed the Inflammatory Proliferation of FLSs by Inducing Cell Apoptosis
The HE staining analysis showed that RSC-364 cells appeared regular with large and spindle-shaped nuclei in normal group, and cells induced by IL-1β exhibited irregular spindle shape and various degrees of damage in the cytoplasm. The inflammatory proliferation of RSC-364 cells also appeared. HYTB treatment significantly inhibited FLSs proliferation and repaired the cell damage (Figure 8(a)).
Figure 8.

HYTB treatment attenuated the FLSs inflammatory proliferation induced by IL-1β. (a) Morphology analysis (hematoxylin and eosin-stained section) of RSC-364 cells (200x). (b) Proapoptotic effect of HYTB on IL-1β-stimulated RSC-364 cells. Flow cytometric analysis demonstrating the effect of HYTB apoptosis induction. The results are presented in bar charts. Data are presented as the mean ± SD (n = 3). ∗P < 0.05 and ∗∗P < 0.01.
In addition, we also measured apoptotic cell percentage in RSC-364 cells after treatment. As shown in Figure 8(b), the apoptotic cell percentage in the HYTB treatment groups significantly increased compared with that induced by IL-1β alone after 12 h of treatment. The inducing effect of HYTB treatment was superior to that of IL-1RA.
3.5. HYTB Treatment Inhibited GM-CSF Production in the Coculture System of Lymphocytes and FLSs Induced by IL-1β
IL-1β signaling drives Th17 cells and FLSs to produce GM-CSF, active DCs, and macrophages, contributing to perpetuate autoimmune inflammation [16, 17]. We measured the GM-CSF levels in the supernatant of the coculture solution after treatment by ELISA. As shown in Figure 9, the GM-CSF levels in a coculture system of lymphocytes and FLSs significantly increased after IL-1β stimulation. HYTB treatment downregulated the GM-CSF secretion. The HYTB treatment inhibitory effect at 250 μg/mL concentration was equal or superior to that of IL-RA.
Figure 9.
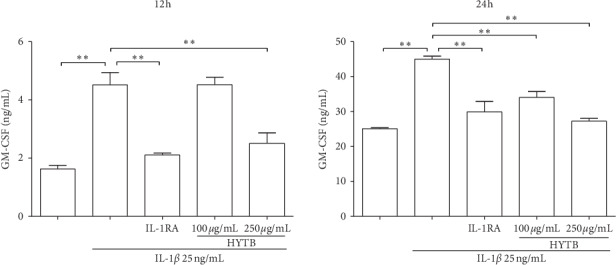
The GM-CSF levels in the coculture supernatant were quantified by ELISA. Data are presented as the mean ± SD (n = 3). ∗∗P < 0.01.
3.6. Inhibitory Effects of HYTB on the Activation of NF-κB and JAK/STAT Signaling Pathways of RSC-364 Cells in the Transwell System
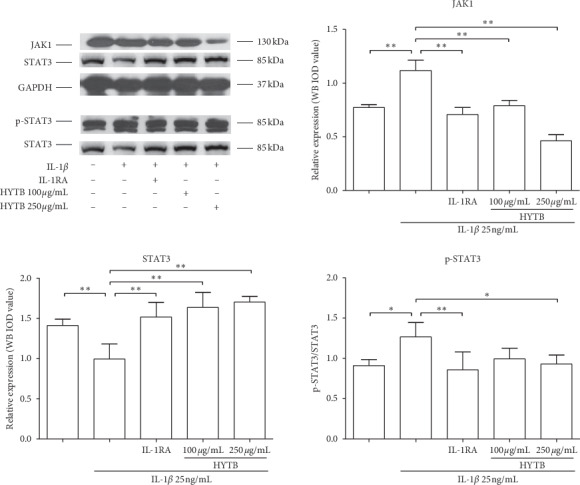
Activation of NF-κB and JAK/STAT signaling pathways plays key roles in the RA pathogenesis [18]. For these reasons, we measured the protein levels of key molecules in NF-κB and JAK/STAT signaling pathways in RSC-364 cells after treatment. As shown in Figures 10 and 11, the protein expression of MyD88, TRAF2, IKKα/β, and NF-κB p50 in RSC-364 cells of HYTB treatment groups was significantly lower than those induced by IL-1β alone at two time nodes. Furthermore, IKKα/β protein phosphorylation was inhibited by HYTB treatment. The phospho-STAT3 and JAK1 protein levels in RSC-364 cells also significantly decreased after HYTB treatment (Figures 12 and 13). The inhibitory effects of 250 μg/mL HYTB were better than those of IL-1RA groups.
Figure 10.
The key molecules protein levels of the NF-κB signaling pathway in RSC-364 cells after 12 h of treatment. TRAF2, MyD88, IKKα/β, p-IKKα/β, and NF-κB p50 were quantified using Western blot analysis. The quantified results are presented in bar charts. GAPDH is used as an internal control. Data are presented as the mean ± SD (n = 3). ∗P < 0.05 and ∗∗P < 0.01.
Figure 11.

The key molecules protein levels of the NF-κB signaling pathway in RSC-364 cells after 24 h of treatment. TRAF2, MyD88, IKKα/β, p-IKKα/β, and NF-κB p50 were detected using Western blot analysis. The quantified results are presented in bar charts. GAPDH was used as an internal control. Data are presented as the mean ± SD (n = 3). ∗P < 0.05 and ∗∗P < 0.01.
Figure 12.

The key molecules protein levels of JAK/STAT signal pathway in RSC-364 cells after 12 h of treatment. JAK1, STAT3, and p-STAT3 were detected using Western blot analysis. The quantified results are presented in bar charts. GAPDH is used as an internal control. Data are presented as the mean ± SD (n = 3). ∗P < 0.05 and ∗∗P < 0.01.
Figure 13.
The key molecules protein levels of JAK/STAT signal pathway in RSC-364 cells after 24 h of treatment. JAK1, STAT3, and p-STAT3 were detected using Western blot analysis. The quantified results are presented in bar charts. GAPDH is used as an internal control. Data are presented as the mean ± SD (n = 3). ∗P < 0.05 and ∗∗P < 0.01.
4. Discussion
In traditional Chinese medicine, multiple agents contained in one formula will synergistically work as medical treatment. Twenty-five chemical constituents of HYTB formula were identified by HPLC-ESI/MSn analysis. Pharmacological research demonstrated that paeoniflorin can inhibit lipopolysaccharide-induced production of tumor necrosis factor-α (TNF-α) and IL-1β, thereby increasing IL-10 production [19]. Coptisine can inhibit IL-1β-induced inflammatory response by suppressing NF-κB signaling pathway [20]. Moreover, isoschaftoside and jatrorrhizine have been shown to inhibit proliferation, migration, and production of inflammatory mediators [21, 22]. Epiberberine, coptisine, and p-coumaric acid have antibacterial, anti-inflammatory, and antioxidative effects [23–26]. Pharmacological studies have also shown that calycosin-7-O-glucoside could reduce the expression of platelet-derived growth factor, fibroblast growth factor, and toll-like receptor [27]. Tanshinone IIA could upregulate lncRNA GAS5 and block cell cycle in the G2/M phase, inducing FLSs apoptosis [28, 29]. Therefore, we suggest that these HYTB constituents could be contributed by interacting with multiple targets and exerting synergistic therapeutic effects on regulating proliferation and differentiation of Th and Treg cells, thereby inhibiting inflammatory FLSs proliferation by inducing apoptosis, and attenuating proinflammatory cytokine production for the suppression and resolution of inflammation in RA.
T-cell infiltration and inflammatory cytokine imbalance in the joint lumen could induce an abnormal anti-immune response and initiate inflammatory proliferation of synovial tissue and the autoimmune arthritis, resulting in articular cartilage injury [30]. The imbalances in the differentiation and function of Th1 and Th2/Th17 cells influence RA pathogenesis [3, 31, 32]. Naïve CD4+ T cells differentiate into either type of Th cell subset depending on the stimulation of specific transcription factors. Th1 cell differentiation depends on expression of transcription factor T-bet through the IL-12/STAT-4 signaling pathway and the interferon-γ (IFN-γ)/STAT-1 signaling pathway [33]. GATA-3 induces Th2 cell differentiation by the IL-4/STAT-6 pathway [34]. Th17 cell differentiation induces the expression of the transcription factor RORγt by TGFβ and IL-6/STAT3 pathways [35].
Th1 cells play a predominant role in the RA pathology. Synovium-infiltrating Th1 cells secrete IFN-γ and activate macrophages and TNF production [36]. However, several studies have demonstrated that Th1 phenotype does not explain all mechanisms involved in RA. IL-17-producing Th17 cells were found in peripheral blood monocytes in a large proportion of RA patients. The Th17 cell proportion is related to disease activity during RA progression [36]. IL-17 secreted by Th17 cells activates osteoblasts and FLSs and induces osteoclastogenesis [37]. IL-17 also induces production of TNF and IL-6 from FLSs and macrophages and augments recruitment of inflammatory cells into the synovial tissue. CD4+ T cells overexpressing RORγt induce the CCR6 production and promote the CD4+ T-cell migration into inflamed joints [38]. Th2 cells coordinating with IL-4 and IL-10 suppress Th1 cell differentiation. In addition, IL-4R controls IL-17 production. GATA-3 overexpression reduces Th17 cell differentiation [39]. Treg cells have regulatory roles in the development of autoimmune arthritis. Depletion of CD25+ T cells augments the severity of collagen-induced arthritis in a murine model. CD4+CD25+ Treg cell transplantation suppresses the progression of arthritis [40]. In this study, our results indicated that HYTB treatment has a regulatory effect on Th cells differentiation. HYTB could downregulate Th1 and Th17 cell proportions and induce Th2 and Treg cell differentiation after IL-1β stimulation. One possible mechanism is interfering with protein expression of Th specific transcription factors.
Synovial hyperplasia and infiltration of immune cells lead to excessive expansion and destruction of articular cartilage in RA [41]. Activated FLSs have resistance to cell apoptosis. Small molecule inflammatory mediators and proteolytic enzymes produced by FLSs can degrade the extracellular matrix in RA [42]. Our results showed that HYTB treatment could inhibit FLSs inflammatory proliferation induced by IL-1β by promoting apoptosis.
GM-CSF, a key proinflammatory cytokine, activates dendritic cells and macrophages. Th17 cells induced by IL-1 and IL-23 signaling secrete GM-CSF and initiate autoimmune inflammation [43]. FLSs are important effector cells that produce large amounts of inflammatory cytokines, contributing to cartilage and bone degradation in RA. IL-17 combined with IL-1 increases GM-CSF production by FLSs. Loss of GM-CSF production by Th17 cells and FLSs could inhibit progression of autoimmune arthritis [44]. HYTB treatment decreased GM-CSF production in the coculture system of lymphocytes and FLSs induced by IL-1β.
The NF-κB signaling pathway plays a key role in the pathogenesis of RA. NF-κB signaling pathway activation stimulates proinflammatory cytokines expression, leading to the inflammatory response of RA [45]. It can also induce expression of antiapoptotic cytokines, inhibit apoptosis of FLSs, and contribute to the synoviocyte hyperplasia stimulated by proinflammatory cytokines [46]. The JAK/STAT3 signaling pathway also plays a key role in the RA pathological progression. The cell cycle and apoptosis of FLSs in RA are regulated by activation of JAK/STAT3 signaling pathway [47]. The results of present study showed that HYTB treatment could intervene in the protein expression of key molecules of NF-κB and JAK/STAT3 signaling pathways, inhibit activation of these pathways, induce FLSs apoptosis, and contribute toward inhibiting inflammatory proliferation of FLSs induced by proinflammatory cytokines.
Our study demonstrated that the HYTB formula could regulate proliferation and differentiation of Th cells, suppress NF-κB and JAK/STAT signaling pathways activation, induce apoptosis in FLSs, and decrease GM-CSF production, resulting in the suppression of inflammatory proliferation of FLSs stimulated by proinflammatory cytokines. HYTB can restore homeostasis in the tissue microenvironment of RA. These in vitro experimental results and preliminary clinical observation results provide supporting supplements for HYTB formula in the treatment of autoimmune arthritis, including RA. However, in vivo experiments and clinical trials are necessary to confirm the anti-inflammatory activities of HYTB. This is also a key point in our follow-up research work. Taken together, this Chinese medical formula, HYTB, should be used as a complementary or alternative traditional medicine for RA treatment.
Acknowledgments
The authors thank Ms. Bin Dong and Xiying LV, for technical assistance. This work was supported by the State Administration of Traditional Chinese Medicine, Special Project of the National Chinese Medicine Clinical Research Base (JDZX2015191), and Beijing University of Chinese Medicine (2019-JYB-XS-177).
Contributor Information
Jingwei Zhou, Email: 13910634708@163.com.
Limin Chai, Email: liminchai@hotmail.com.
Data Availability
The data used to support the findings of this study are included within the article and the Supplementary Materials.
Conflicts of Interest
The authors declare that there are no conflicts of interest regarding the publication of this paper.
Authors' Contributions
Hening Chen, Changzhi Wang, Jinyu Li, and Meiyier Huandike contributed equally to this work.
Supplementary Materials
Figure S1: cell viability of RSC-364 cells treated with HYTB. The results were presented in a bar chart. Data were presented as mean ± SD, n = 6.
References
- 1.Roberts C. A., Dickinson A. K., Taams L. S. The interplay between monocytes/macrophages and CD4+ T cell subsets in rheumatoid arthritis. Frontiers in Immunology. 2015;6:p. 571. doi: 10.3389/fimmu.2015.00571. [DOI] [PMC free article] [PubMed] [Google Scholar]
- 2.Scott D. L., Wolfe F., Huizinga T. W. Rheumatoid arthritis. The Lancet. 2010;376(9746):1094–1108. doi: 10.1016/S0140-6736(10)60826-4. [DOI] [PubMed] [Google Scholar]
- 3.Kondo Y., Yokosawa M., Kaneko S., et al. Review: transcriptional regulation of CD4+ T cell differentiation in experimentally induced arthritis and rheumatoid arthritis. Arthritis & Rheumatology. 2018;70(5):653–661. doi: 10.1002/art.40398. [DOI] [PMC free article] [PubMed] [Google Scholar]
- 4.Lou L., Zhou J., Liu Y., et al. Chlorogenic acid induces apoptosis to inhibit inflammatory proliferation of IL-6-induced fibroblast-like synoviocytes through modulating the activation of JAK/STAT and NF-κB signaling pathways. Experimental and Therapeutic Medicine. 2016;11(5):2054–2060. doi: 10.3892/etm.2016.3136. [DOI] [PMC free article] [PubMed] [Google Scholar]
- 5.Hirota K., Hashimoto M., Yoshitomi H., et al. T cell self-reactivity forms a cytokine milieu for spontaneous development of IL-17+ Th cells that cause autoimmune arthritis. Journal of Experimental Medicine. 2007;204(1):41–47. doi: 10.1084/jem.20062259. [DOI] [PMC free article] [PubMed] [Google Scholar]
- 6.Yao R., Fu Y., Li S., Tu L., Zeng X., Kuang N. Regulatory effect of daphnetin, a coumarin extracted from Daphne odora, on the balance of Treg and Th17 in collagen-induced arthritis. European Journal of Pharmacology. 2011;670(1):286–294. doi: 10.1016/j.ejphar.2011.08.019. [DOI] [PubMed] [Google Scholar]
- 7.Cao D., Vollenhoven R. v., Klareskog L., Trollmo C., Malmström V. CD25 bright CD4+ regulatory T cells are enriched in inflamed joints of patients with chronic rheumatic disease. Arthritis Research & Therapy. 2004;6(4):R335–R346. doi: 10.1186/ar1192. [DOI] [PMC free article] [PubMed] [Google Scholar]
- 8.Shen H., Goodall J. C., Hill Gaston J. S. Frequency and phenotype of peripheral blood Th17 cells in ankylosing spondylitis and rheumatoid arthritis. Arthritis & Rheumatism. 2009;60(6):1647–1656. doi: 10.1002/art.24568. [DOI] [PubMed] [Google Scholar]
- 9.McInnes I. B., Schett G. Pathogenetic insights from the treatment of rheumatoid arthritis. The Lancet. 2017;389(10086):2328–2337. doi: 10.1016/S0140-6736(17)31472-1. [DOI] [PubMed] [Google Scholar]
- 10.Hirota K., Hashimoto M., Ito Y., et al. Autoimmune Th17 cells induced synovial stromal and innate lymphoid cell secretion of the cytokine GM-CSF to initiate and augment autoimmune arthritis. Immunity. 2018;48(6):1220–1232. doi: 10.1016/j.immuni.2018.04.009. [DOI] [PMC free article] [PubMed] [Google Scholar]
- 11.Malemud C. J. The role of the JAK/STAT signal pathway in rheumatoid arthritis. Therapeutic Advances in Musculoskeletal Disease. 2018;10(5-6):117–127. doi: 10.1177/1759720x18776224. [DOI] [PMC free article] [PubMed] [Google Scholar]
- 12.Chen X. M., Huang R. Y., Yan J. Y., et al. Treatment of refractory rheumatoid arthritis by huayu tongbi recipe combined methotrexate. Chinese Journal of Integrated Traditional and Western Medicine. 2015;35(11):1326–1330. [PubMed] [Google Scholar]
- 13.Wang J., Ma J., Dong L., et al. Effect of anatase TiO2 nanoparticles on the growth of RSC-364 rat synovial cell. Journal of Nanoscience and Nanotechnology. 2013;13(6):3874–3879. doi: 10.1166/jnn.2013.7145. [DOI] [PubMed] [Google Scholar]
- 14.Li J., Wei Y., Li X., et al. Herbal formula Xian-Fang-Huo-Ming-Yin regulates differentiation of lymphocytes and production of pro-inflammatory cytokines in collagen-induced arthritis mice. BMC Complementary and Alternative Medicine. 2017;17(1):p. 12. doi: 10.1186/s12906-016-1526-x. [DOI] [PMC free article] [PubMed] [Google Scholar]
- 15.Chen J., Chen Z. J. Regulation of NF-κB by ubiquitination. Current Opinion in Immunology. 2013;25(1):4–12. doi: 10.1016/j.coi.2012.12.005. [DOI] [PMC free article] [PubMed] [Google Scholar]
- 16.Codarri L., Gyülvészi G., Tosevski V., et al. RORγt drives production of the cytokine GM-CSF in helper T cells, which is essential for the effector phase of autoimmune neuroinflammation. Nature Immunology. 2011;12(6):560–567. doi: 10.1038/ni.2027. [DOI] [PubMed] [Google Scholar]
- 17.Croxford A. L., Lanzinger M., Hartmann F. J., et al. The cytokine GM-CSF drives the inflammatory signature of CCR2+ monocytes and licenses autoimmunity. Immunity. 2015;43(3):502–514. doi: 10.1016/j.immuni.2015.08.010. [DOI] [PubMed] [Google Scholar]
- 18.Malemud C. Negative regulators of JAK/STAT signaling in rheumatoid arthritis and osteoarthritis. International Journal of Molecular Sciences. 2017;18(3):p. 484. doi: 10.3390/ijms18030484. [DOI] [PMC free article] [PubMed] [Google Scholar]
- 19.Cao W., Zhang W., Liu J., et al. Paeoniflorin improves survival in LPS-challenged mice through the suppression of TNF-α and IL-1β release and augmentation of IL-10 production. International Immunopharmacology. 2011;11(2):172–178. doi: 10.1016/j.intimp.2010.11.012. [DOI] [PubMed] [Google Scholar]
- 20.Pietras E. M., Lakshminarasimhan R., Techner J.-M., et al. Re-entry into quiescence protects hematopoietic stem cells from the killing effect of chronic exposure to type I interferons. The Journal of Experimental Medicine. 2014;211(2):245–262. doi: 10.1084/jem.20131043. [DOI] [PMC free article] [PubMed] [Google Scholar]
- 21.Qiu H., Sun S., Ma X., et al. Jatrorrhizine hydrochloride suppresses proliferation, migration, and secretion of synoviocytes in vitro and ameliorates rat models of rheumatoid arthritis in vivo. International Journal of Molecular Sciences. 2018;19(5):p. 1514. doi: 10.3390/ijms19051514. [DOI] [PMC free article] [PubMed] [Google Scholar]
- 22.Gomes J. A. d. S., Félix-Silva J., Morais Fernandes J., et al. Aqueous leaf extract of Jatropha mollissima(pohl) bail decreases local effects induced by bothropic venom. Biomed Research International. 2016;2016:13. doi: 10.1155/2016/6101742.6101742 [DOI] [PMC free article] [PubMed] [Google Scholar]
- 23.Meng F.-C., Wu Z.-F., Yin Z.-Q., Lin L.-G., Wang R., Zhang Q.-W. Coptidis rhizoma and its main bioactive components: recent advances in chemical investigation, quality evaluation and pharmacological activity. Chinese Medicine. 2018;13(1):p. 13. doi: 10.1186/s13020-018-0171-3. [DOI] [PMC free article] [PubMed] [Google Scholar]
- 24.Zielinska S., Jezierska-Domaradzka A., Wojciak-Kosior M., et al. Greater celandine’s ups and downs-21 centuries of medicinal uses of chelidonium majus from the viewpoint of today’s pharmacology. Frontiers in Pharmacology. 2018;9:p. 299. doi: 10.3389/fphar.2018.00299. [DOI] [PMC free article] [PubMed] [Google Scholar]
- 25.An S. M., Koh J.-S., Boo Y. C. p-Coumaric acid not only inhibits human tyrosinase activity in vitro but also melanogenesis in cells exposed to UVB. Phytotherapy Research. 2010;24(8):1175–1180. doi: 10.1002/ptr.3095. [DOI] [PubMed] [Google Scholar]
- 26.Pragasam S. J., Venkatesan V., Rasool M. Immunomodulatory and anti-inflammatory effect of p-coumaric acid, a common dietary polyphenol on experimental inflammation in rats. Inflammation. 2013;36(1):169–176. doi: 10.1007/s10753-012-9532-8. [DOI] [PubMed] [Google Scholar]
- 27.Zhao J., Ren Y., Qu Y., Jiang W., Lv C. Pharmacodynamic and pharmacokinetic assessment of pulmonary rehabilitation mixture for the treatment of pulmonary fibrosis. Scientific Reports. 2017;7(1):p. 3458. doi: 10.1038/s41598-017-02774-1. [DOI] [PMC free article] [PubMed] [Google Scholar]
- 28.Li G., Liu Y., Meng F., et al. Tanshinone IIA promotes the apoptosis of fibroblast-like synoviocytes in rheumatoid arthritis by up-regulating lncRNA GAS5. Bioscience Reports. 2018;38(5) doi: 10.1042/BSR20180626. [DOI] [PMC free article] [PubMed] [Google Scholar]
- 29.Jie L., Du H., Huang Q., Wei S., Huang R., Sun W. Tanshinone IIA induces apoptosis in fibroblast-like synoviocytes in rheumatoid arthritis via blockade of the cell cycle in the G2/M phase and a mitochondrial pathway. Biological and Pharmaceutical Bulletin. 2014;37(8):1366–1372. doi: 10.1248/bpb.b14-00301. [DOI] [PubMed] [Google Scholar]
- 30.Mellado M., Martinez-Munoz L., Cascio G., et al. T cell migration in rheumatoid arthritis. Frontiers in Immunology. 2015;6:p. 384. doi: 10.3389/fimmu.2015.00384. [DOI] [PMC free article] [PubMed] [Google Scholar]
- 31.Alzabin S., Williams R. O. Effector T cells in rheumatoid arthritis: lessons from animal models. FEBS Letters. 2011;585(23):3649–3659. doi: 10.1016/j.febslet.2011.04.034. [DOI] [PubMed] [Google Scholar]
- 32.Bevaart L., Vervoordeldonk M. J., Tak P. P. Evaluation of therapeutic targets in animal models of arthritis: how does it relate to rheumatoid arthritis? Arthritis & Rheumatism. 2010;62(8):2192–2205. doi: 10.1002/art.27503. [DOI] [PubMed] [Google Scholar]
- 33.Szabo S. J., Kim S. T., Costa G. L., Zhang X., Fathman C. G., Glimcher L. H. A novel transcription factor, T-bet, directs Th1 lineage commitment. Cell. 2000;100(6):655–669. doi: 10.1016/s0092-8674(00)80702-3. [DOI] [PubMed] [Google Scholar]
- 34.Skapenko A., Leipe J., Niesner U., et al. GATA-3 in human T cell helper type 2 development. Journal of Experimental Medicine. 2004;199(3):423–428. doi: 10.1084/jem.20031323. [DOI] [PMC free article] [PubMed] [Google Scholar]
- 35.Yang X. O., Pappu B. P., Nurieva R., et al. T helper 17 lineage differentiation is programmed by orphan nuclear receptors RORα and RORγ. Immunity. 2008;28(1):29–39. doi: 10.1016/j.immuni.2007.11.016. [DOI] [PMC free article] [PubMed] [Google Scholar]
- 36.Furst D. E., Emery P. Rheumatoid arthritis pathophysiology: update on emerging cytokine and cytokine-associated cell targets. Rheumatology. 2014;53(9):1560–1569. doi: 10.1093/rheumatology/ket414. [DOI] [PMC free article] [PubMed] [Google Scholar]
- 37.Kikuta J., Wada Y., Kowada T., et al. Dynamic visualization of RANKL and Th17-mediated osteoclast function. Journal of Clinical Investigation. 2013;123(2):866–873. doi: 10.1172/JCI65054. [DOI] [PMC free article] [PubMed] [Google Scholar]
- 38.Nguyen N. T., Nakahama T., Nguyen C. H., et al. Aryl hydrocarbon receptor antagonism and its role in rheumatoid arthritis. Journal of Experimental Pharmacology. 2015;7:29–35. doi: 10.2147/JEP.S63549. [DOI] [PMC free article] [PubMed] [Google Scholar]
- 39.van Hamburg J. P., Mus A.-M., de Bruijn M. J. W., et al. GATA-3 protects against severe joint inflammation and bone erosion and reduces differentiation of Th17 cells during experimental arthritis. Arthritis & Rheumatism. 2009;60(3):750–759. doi: 10.1002/art.24329. [DOI] [PubMed] [Google Scholar]
- 40.Morgan M. E., Flierman R., van Duivenvoorde L. M., et al. Effective treatment of collagen-induced arthritis by adoptive transfer of CD25+ regulatory T cells. Arthritis & Rheumatism. 2005;52(7):2212–2221. doi: 10.1002/art.21195. [DOI] [PubMed] [Google Scholar]
- 41.Fan L., Wang Q., Liu R., et al. Citrullinated fibronectin inhibits apoptosis and promotes the secretion of pro-inflammatory cytokines in fibroblast-like synoviocytes in rheumatoid arthritis. Arthritis Research & Therapy. 2012;14(6):p. R266. doi: 10.1186/ar4112. [DOI] [PMC free article] [PubMed] [Google Scholar]
- 42.Huber L. C., Distler O., Tarner I., Gay R. E., Gay S., Pap T. Synovial fibroblasts: key players in rheumatoid arthritis. Rheumatology. 2006;45(6):669–675. doi: 10.1093/rheumatology/kel065. [DOI] [PubMed] [Google Scholar]
- 43.El-Behi M., Ciric B., Dai H., et al. The encephalitogenicity of TH17 cells is dependent on IL-1- and IL-23-induced production of the cytokine GM-CSF. Nature Immunology. 2011;12(6):568–575. doi: 10.1038/ni.2031. [DOI] [PMC free article] [PubMed] [Google Scholar]
- 44.Varas A., Valencia J., Lavocat F., et al. Blockade of bone morphogenetic protein signaling potentiates the pro-inflammatory phenotype induced by interleukin-17 and tumor necrosis factor-alpha combination in rheumatoid synoviocytes. Arthritis Research and Therapy. 2015;17(1):p. 192. doi: 10.1186/s13075-015-0710-6. [DOI] [PMC free article] [PubMed] [Google Scholar]
- 45.Wang W., Sun W., Jin L. Caffeic acid alleviates inflammatory response in rheumatoid arthritis fibroblast-like synoviocytes by inhibiting phosphorylation of IκB kinase α/β and IκBα. International Immunopharmacology. 2017;48:61–66. doi: 10.1016/j.intimp.2017.04.025. [DOI] [PubMed] [Google Scholar]
- 46.Kim S.-K., Park K.-Y., Yoon W.-C., et al. Melittin enhances apoptosis through suppression of IL-6/sIL-6R complex-induced NF-κB and STAT3 activation and Bcl-2 expression for human fibroblast-like synoviocytes in rheumatoid arthritis. Joint Bone Spine. 2011;78(5):471–477. doi: 10.1016/j.jbspin.2011.01.004. [DOI] [PubMed] [Google Scholar]
- 47.Liu J., Fei D., Xing J., Du J. MicroRNA-29a inhibits proliferation and induces apoptosis in rheumatoid arthritis fibroblast-like synoviocytes by repressing STAT3. Biomedicine & Pharmacotherapy. 2017;96:173–181. doi: 10.1016/j.biopha.2017.09.120. [DOI] [PubMed] [Google Scholar]
Associated Data
This section collects any data citations, data availability statements, or supplementary materials included in this article.
Supplementary Materials
Figure S1: cell viability of RSC-364 cells treated with HYTB. The results were presented in a bar chart. Data were presented as mean ± SD, n = 6.
Data Availability Statement
The data used to support the findings of this study are included within the article and the Supplementary Materials.