

Abstract
In this work, we brought together two existing clinical techniques used in cancer treatment—X-ray radiation and photodynamic therapy (PDT), whose combination termed X-PDT uniquely allows PDT to be therapeutically effective in deep tissue. To this end, we developed mitochondrially targeted biodegradable polymer poly(lactic-co-glycolic acid) nanocarriers incorporating a photosensitizer verteporfin, ultrasmall (2–5 nm) gold nanoparticles as radiation enhancers, and triphenylphosphonium acting as the mitochondrial targeting moiety. The average size of the nanocarriers was about 160 nm. Upon X-ray radiation our nanocarriers generated cytotoxic amounts of singlet oxygen within the mitochondria, triggering the loss of membrane potential and mitochondria-related apoptosis of cancer cells. Our X-PDT strategy effectively controlled tumor growth with only a fraction of radiotherapy dose (4 Gy) and improved the survival rate of a mouse model bearing colorectal cancer cells. In vivo data indicate that our X-PDT treatment is cytoreductive, antiproliferative, and profibrotic. The nanocarriers induce radiosensitization effectively, which makes it possible to amplify the effects of radiation. A radiation dose of 4 Gy combined with our nanocarriers allows equivalent control of tumor growth as 12 Gy of radiation, but with greatly reduced radiation side effects (significant weight loss and resultant death).
Short abstract
We developed a novel strategy named X-ray-induced photodynamic therapy (X-PDT) which enables chemotherapy-free treatment of deep cancer with a low dose of X-ray radiation.
Introduction
Rectal cancer accounts for approximately 30% of colorectal cancers and is one of the most frequent cancers in industrialized countries.1,2 Surgical resection remains the mainstay treatment in patients with rectal cancer. However, some Stage II and a significant proportion of Stage III rectal cancer patients undergo neoadjuvant radiotherapy or chemo-radiotherapy to downsize the primary tumor and lymph nodes and to reduce rates of local recurrence after surgery.3 Unfortunately, the side effect of this standard of care treatment is progressive late morbidity due to high doses (45 Gy) in long-course radiotherapy4 and systematic toxicity of chemodrugs used in chemo-radiotherapy. Therefore, it is important to find new methods for downsizing tumors, using lower radiation levels, and, potentially, obviating the use of chemotherapy as a radiosensitizer.
In this work, we test novel mitochondrially targeted nanoparticles, designed to have cytostatic/cytoreductive effects, applied to the neoadjuvant treatment of rectal cancer. Our approach is based on X-ray-induced photodynamic therapy (X-PDT).5 Conventional PDT is a clinically approved therapeutic procedure that is used for the treatment of superficial lesions.6 In PDT, visible light is combined with photosensitizers (Photofrin, Levulan, Visudyne, or alternatives) causing the generation of cytotoxic singlet oxygen or other reactive oxygen species (ROS) that lead to cell death and vascular shutdown.6−8 The PDT agents can also be effectively stimulated by limited, clinically safe doses of radiation (X-rays).9,10 These X-rays easily penetrate through body tissues, allowing X-PDT to overcome the ∼1 cm tissue depth limitation of the conventional PDT.11,12 Both PDT and radiotherapy have been independently applied in clinical practice, paving the way for the accelerated medical translation of X-PDT.
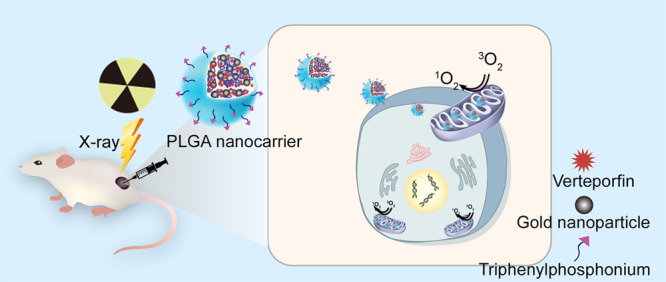
Intracellular localization of photosensitizer molecules is of crucial importance for the effectiveness of PDT.13,14 Specifically, mitochondria have been found to be suitable subcellular targets for ROS generated by PDT.15,16 The ROS-induced effects are capable of disrupting cellular function such as proliferation,17 while mitochondrial DNA damage initiates diverse cell death mechanisms.18 Consequently, mitochondria-targeted PDT has proven to be more effective than a nontargeted alternative, allowing greater specificity and potentially smaller effective drug doses. We therefore explored the efficacy of X-PDT with mitochondrially targeted nanoconstructs based on biodegradable poly(lactic-co-glycolic acid) (PLGA) polymer. PLGA is approved by the US FDA and European Medicines Agency as a drug delivery system for different medical applications such as carrying photosensitizers to tumor cells.4,19,20 Verteporfin (VP), a photosensitizer, and ultrasmall (2–5 nm) colloidal gold nanoparticles were incorporated into this polymer nanocarrier platform (Figure 1A). VP is an efficient photosensitizer which has been clinically approved for PDT in neovascular macular degeneration.21,22 It has been demonstrated to generate ROS at low doses of X-ray radiation.10,23 Gold nanoparticles were chosen to increase X-ray-induced ROS generation as they strongly interact with X-ray radiation due to their radiation enhancement property,24−26 and because of our earlier finding of increased singlet oxygen (1O2) generation from VP in the presence of gold nanoparticles.23 The nanocarrier surface was modified with triphenylphosphonium (TPP), a molecule able to target the inner mitochondrial membrane attributed to its strong lipophilic and cationic nature.27,28 This effect is expected to be stronger in cancer cells due to their lower mitochondrial membrane potential compared to normal cells (∼−220 mV vs ∼−140 mV).29 We tested our nanocarriers in in vitro settings and a preclinical xenograft model of colorectal cancer. The in vitro cytotoxicity effect of X-PDT was demonstrated by assessing the viability and apoptosis in colorectal cancer cells. The signaling mechanisms underlying the anticancer effect were investigated via Western blot analyses. Additionally, the tumor control effect was investigated by monitoring tumor development in mice bearing colorectal cancer xenografts and via histological and biochemical analyses of tumor tissues after treatment.
Figure 1.

(A) Schematic illustration of X-ray-induced PDT via PLGA nanocarriers incorporating verteporfin (VP) and gold nanoparticles. (B) SEM image of PLGA nanocarriers; inset is a TEM image of the same sample under high magnification. The gold nanoparticles were clearly observed under TEM with high magnification. (C) ζ potential of PLGA–VP and PLGA–TPP. (D) Absorption spectra of PLGA samples with and without TPP conjugation. (E) Percentage increase of SOSG fluorescence intensities in PLGA samples with different molar ratios of gold and VP under X-ray radiation at different doses. ** p < 0.01, *** p < 0.001 determined by Student t-test, n = 3.
Results and Discussion
Characterization of PLGA Nanocarriers and PLGA–TPP Conjugates
A typical scanning electron microscope (SEM) image was taken of PLGA nanoparticles loaded with VP and gold nanoparticles (Figure 1B), with the average size of ∼160 nm determined by dynamic light scattering (DLS, Figure S4). The gold nanoparticles loaded inside PLGA were clearly observed under transmission electron microscopy (TEM) with high magnification (Figure 1B). TPP conjugation on the surface of PLGA nanocarriers was confirmed by different ζ potentials of PLGA–VP and PLGA–TPP in water (Figure 1C) and ultraviolet–visible (UV–vis) absorption spectra containing the typical peaks of TPP at 250 and 278 nm (Figure 1D). We calculated the amount of gold loaded inside PLGA nanoparticles by measuring the concentration of the gold ion based on inductively coupled plasma mass spectrometry (ICP-MS) data and comparing this to a standard curve of a gold ion solution with a known concentration. We also determined the average number of gold nanoparticles per PLGA nanoparticle based on the total number of gold nanoparticles and PLGA in the same sample, which is estimated to be approximately 244 (in the case of gold: VP = 5:1). The average number of TPP conjugated to each nanocarrier surface was also calculated based on absorbance of TPP attached to the PLGA nanocarriers and a standard curve of absorbance versus concentration of carboxyl–TPP solution (Figure S5), which was approximately 176.
The generation of 1O2 is a key factor in X-ray-induced PDT. 1O2 generation was confirmed by using singlet oxygen sensor green (SOSG) and monitoring the enhancement of fluorescence intensity at 488 nm excitation. In this study, we varied the amount of gold nanoparticles loaded inside PLGA and checked the 1O2 production under these conditions. As shown in Figure 1E, the 1O2 enhancement was similar in these PLGA samples with and without gold nanoparticles at 1 and 2 Gy radiation. At 4 Gy radiation, PLGA loaded with gold nanoparticles and VP (molar ratio of gold and VP was 5:1 and 10:1) demonstrated a higher ability to generate 1O2, compared to PLGA nanocarrier-loaded VP alone, with respective 126% and 95% increases in SOSG fluorescence intensity. For comparison purposes, we also checked if pure PLGA alone and PLGA loaded with gold nanoparticles alone can generate the sufficient amount of 1O2 under the same conditions. Our findings indicated that PLGA alone did not affect 1O2 generation, compared with other PLGA samples. Taken together, we chose PLGA nanocarriers with a molar ratio of gold and VP of 5:1 for further cell and animal experimentation.
To increase the stability of the PLGA nanocarrier in the physiological environment, we used PLGA–polyethylene glycol (PEG) polymer for nanocarrier fabrication. The serum stability of PLGA nanocarriers was assessed based on the total amount of VP released from the nanocarriers (Figure S6). Different amounts of VP were released from non-PEGylated PLGA nanocarriers during incubation, with the total amount being 27% at 48 h when incubated in phosphate-buffered saline (PBS) with 10% (v/v) fetal bovine serum (FBS). By contrast, in the case of PEGylated PLGA nanocarriers, the VP release profile was obviously reduced, with 10% and 15% of VP released from PLGA at 48 h, suspended in PBS containing 10% FBS and 50% FBS, respectively. These findings imply that PEGylation of the PLGA could maintain the amount of loaded VP and ensure the maximal ROS generated from VP predominantly located within the nanocarriers.
Assessment of Mitochondria-Targeting Capability of PLGA–TPP Conjugates, Intracellular 1O2 Generation, and Mitochondria Membrane Potential (ΔΨm)
The mitochondria-targeting capabilities of the PLGA–TPP conjugates incorporating VP (TPP–PLGA–VP) were investigated by incubating the nanocarriers with HCT116 cells using nontargeted PLGA as a control. The confocal microscopy analysis of the cells treated with TPP–PLGA–VP showed greater uptake activity than nonconjugated ones in the mitochondria of the cells (Figure S7). Quantitative analysis using the ImageJ/Fiji “colocalization analysis” function revealed greater colocalization of the PLGA–TPP with MitoTracker Green in the mitochondria of the cells (Pearson’s correlation coefficient, PCC = 0.76). For the nonconjugated PLGA nanocarriers, a lower value (PCC = 0.40) was obtained as demonstrated by the different position of the red signals of VP and the mitochondrial green staining. We also assessed the colocalization between TPP-conjugated nanoparticles and lysosomes and found a PCC of 0.31. Such improved mitochondrial uptake of PLGA–TPP nanocarriers is attributed to the high lipophilicity of the TPP targeting ligand30 and the positive charge induced by TPP, which was also apparent from the ζ potential values.
We further assessed intracellular 1O2 generation using the SOSG probe whose fluorescent signal can be observed after treatment.31 As shown in Figure 2A, a weakly fluorescent SOSG signal was observed immediately after the treatments. Among these treatment conditions, the cells treated with X-ray-triggered PLGA–TPP conjugates and PLGA nanocarriers demonstrated similarity in SOSG fluorescence intensity, indicating that a similar amount of 1O2 was generated under these two conditions. However, SOSG fluorescence observed under these two conditions showed a significantly higher signal (higher amount of intracellular 1O2 generation) compared with other treatments including PLGA nanocarriers, PLGA–TPP nanocarriers, and X-ray radiation at 4 Gy. At 24 h, the SOSG signal from the cells treated with PLGA–TPP nanocarriers in combination with 4 Gy was significantly elevated (4.8-fold) compared to the control group, indicating the sufficient amount of singlet oxygen induced by X-ray-triggered PLGA–TPP (Figure 2B and Figure S8 at 2 and 4 h). We also noticed that the SOSG signal in the cells treated with X-ray-triggered PLGA was lower than that with the X-ray-triggered PLGA–TPP. Such difference in the capacity to generate singlet oxygen between X-ray-triggered PLGA and PLGA–TPP may have its root in the fact that mitochondria require higher oxygen levels for production of ATP used to provide the cell’s energy.32,33 The higher oxygen environment in mitochondria enabled enhanced 1O2 production from VP molecules once they were delivered to the mitochondria by TPP–PLGA nanocarriers.
Figure 2.

Intracellular 1O2 generation indicated by SOSG fluorescence signal in HCT116 cells obtained (A) immediately and (B) 24 h after the treatments indicated in the images. (C) Real-time detection of ΔΨm in HCT116 cells after treatment with PLGA–TPP in combination with 4 Gy radiation at the time points indicated in the images. The membrane potential differences are indicated by the ratio of red versus green fluorescence intensities in the cells. Scale bar is 50 μm. *** indicates a significant difference between groups (p < 0.001) as determined by Student t-test, n = 4.
The loss of ΔΨm is commonly observed after toxicant exposure (such as singlet oxygen), leading to cell death by apoptosis and necrosis. Herein, we investigated whether mitochondria were affected by the treatments describe above. JC-1 staining (a mitochondrial membrane potential dye) was used to evaluate the alterations in ΔΨm in HCT116 cells after the treatments. Time-dependent reduction of the JC-1 red/green fluorescence ratio was observed (Figure 2C), with a significantly lower ratio observed at 1 h after treatment and over the next 24 h compared with immediate detection. We also analyzed the ΔΨm at 24 h after other treatment conditions. The results shown in Figure S9 revealed that these experimental conditions had a smaller effect on ΔΨm, compared to mitochondria-targeted X-ray-induced PDT (p < 0.001). Taken together, the PLGA–TPP nanocarriers that previously showed the highest localization in the mitochondria and the greatest 1O2 production under 4 Gy radiation also exhibited the largest ΔΨm toxicity in HCT116 cells in combination with 4 Gy, compared to other treatment modalities.
Evaluation of Cell Viability and Apoptosis after X-PDT
To assess cell viability following the treatments, cytotoxic effects were tested by MTS assay. The toxicity of PLGA–TPP alone and X-ray radiation alone on HCT 116 and normal colon CCD 841 cells was low, with about 90% viability compared to the control groups. However, when these two treatments were combined, a significant decrease in cancer cell survival was observed (Figure S10). To assess the proapoptotic effect of X-PDT, an Annexin V assay was performed in HCT116 cells. The representative flow cytometry plots show proportions of four groups HCT116 cells after different treatments (Figure 3A–D). A significant increase in the number of apoptotic cells from 5.3 ± 1.8% to 37.4 ± 4.7% after treatment with X-PDT was observed compared with the control group. By contrast, only 8.9 ± 2.9% and 7.8 ± 3.5% rates of apoptosis were, respectively, detected after treatments with nanoparticles and X-rays alone (Figure 3E). These findings indicate that most of the antiproliferative activity of X-PDT in cell cultures is mediated by apoptosis.
Figure 3.

(A–D) Flow cytometry plots showing distribution of annexin-V vs 7-AAD staining after different treatments on HCT 116 cells using the Muse Annexin V and Dead Cell Assay. (E) % of cells and the mean percentages ± SD of apoptosis (early and late apoptosis) of three independent experiments. (F) Western blotting analyses of the expressions of proteins involved in the cell proliferation and apoptosis in HCT 116 cells that received different treatments as indicated. (G–J) Densitometric analysis of the protein bands shown in part F. Values represent the means ± standard deviation of three experiments. * p < 0.05, *** p < 0.001 as determined by Student t-test.
To elucidate the mechanism of X-PDT-mediated apoptosis, we investigated the expression of proteins involved in cell growth and apoptosis in HCT116 cells using Western blot analyses. We first checked the effect of X-PDT in the Akt/ERK signaling pathway, which plays an important role in the proliferation of many types of cancer cells, including colorectal cancer cells.34,35 As shown in Figure 3G,H, the phosphorylation levels of both Akt (P-Akt) and ERK (P-ERK) proteins were decreased in the cells treated with the PLGA–TPP in combination with 4 Gy, compared to other conditions. We also measured the apoptosis-related protein (BAX, BAD, Bcl-2 and caspase-3) expression levels after the treatments (Figure 3F). BAX and BAD regulate apoptosis mainly at the level of the mitochondria.36 Caspase is also an important apoptosis inducer that exists on the outer membranes of mitochondria.37 As shown in Figure 3J, X-PDT promotes the expression of BAX and BAD and reduced antiapoptotic protein (Bcl-2) expression. It also significantly activates caspase-3 compared with other treatment conditions (Figure 3I). In combination with our findings on ΔΨm, these data support that cell apoptosis triggered by X-PDT could involve the mitochondrial signaling pathway in our study.
Anticancer Effect of X-ray-Induced PDT in Vivo
Having confirmed that X-PDT induced cellular cytotoxicity in HCT116 cells, we hypothesized that mitochondria-targeted PLGA–TPP nanocarriers would reduce tumor growth when combined with low-dose X-ray radiation. Accordingly, we treated a subcutaneous mouse model bearing human HCT116 colorectal cells with PLGA–TPP nanocarrier alone, X-ray alone, and X-PDT. As displayed in Figure 4A, although the group treated with X-PDT (4 Gy and PLGA–TPP) did not show significant differences in the tumor size, compared with the control group, the survival curve demonstrated a significant difference between these two groups (log-rank test, p = 0.013, Figure 4B). The X-PDT group shows evidence of a significant control of tumor growth, compared with other treatment conditions (X-PDT vs 4 Gy, p = 0.031; X-PDT vs PLGA–TPP, p = 0.042, Tukey’s test). Furthermore, the mice exposed to this combined treatment had a significantly increased survival (Figure 4B), compared with other treatment conditions (log-rank test, p = 0.0019, control; p = 0.0018, 4 Gy; p = 0.0027, PLGA–TPP; p = 0.049, 8 Gy). In contrast, mice treated with either 4 Gy (p = 0.79) or PLGA–TPP alone (p = 0.55) did not have a survival difference compared with the control group. This shows that individual treatment modalities (4 Gy alone and nanocarriers alone) did not have measurable impacts on tumor growth in vivo.
Figure 4.

Tumor control of X-PDT in a xenograft model of colorectal cancer. (A) Changes in tumor volume after various treatments as indicated; repeated measures two-way ANOVA statistical analysis with Tukey multiple comparison test was used to determine differences between treatment groups, * p < 0.05 indicates significant difference between the groups (4 Gy vs 4 Gy and PLGA–TPP; PLGA–TPP vs 4 Gy and PLGA–TPP). (B) A Kaplan–Meier curve reveals that treatment with X-PDT extended the survival of mice bearing colorectal cancer. Black arrow indicates the time of treatment administration. (C) Photographs of tumors isolated at the end point. Tumor size and survival data were plotted using GraphPad prism v7.0.
We also assessed tumor response to a high radiation dose, with two groups treated with 8 and 12 Gy radiation. In the case of animals treated with 8 Gy radiation, 2 out of 5 animals died within 2 weeks due to tumor overgrowth, while all 5 animals in the X-PDT group survived over the same period. The mice treated with a single 12 Gy radiation dose did not show significant differences in the tumor growth compared with X-PDT during the experimental period (Figure 4A); however, they experienced significant weight loss after irradiation (Figure S12), leading to the death of 2 out of 4 animals within 2 weeks. Taken together, these results suggest that our X-PDT at 4 Gy treatment has a broadly similar therapeutic effect as 12 Gy of radiation. The tumor size data in mice exposed to different treatments are presented in Figure 4C.
Evaluation of Histological Outcomes of Anticancer Therapy
Effect of X-PDT on Volume of Tumor Tissue
We carried out a quantitative analysis of the relative amount of live and dead tissue in the tumors, calculated as a product of live/dead tumor tissue area percentage and the total volume of the tumor at the end point (Figure 5A and Figure S13). The results indicate that the relative average area of live tumor tissue seen in the histological sections was similar across the studied groups (55–65%, Figure 5C). Interestingly, in the X-PDT group the volume of live tumor tissue was only about a factor 2 higher than the initial grafting volume (100 mm3), while in other groups the volume of live tissue in the tumors during the experimental period increased by a factor of between 4.7 and 6 (Figure 5D). This indicates that the X-PDT treatment was cytoreductive. No statistically significant increase in the dead tumor tissue volume was observed in any group (Figure S14). Considering a relative decrease of the overall tumor volume in the X-PDT group vs other groups, we attribute the tumor shrinking to cytostatic or profibrotic effects of X-PDT or accelerated tumor growth/edema in control groups.
Figure 5.

(A) Left image: example of a scanned image of a whole-sample section applied for further color segmentation. The image demonstrates two halves of the same tumor and the areas of different tissue structure. T, live tumor tissue featuring intensive staining with hematoxylin; N, necrotic and paranecrotic areas in the central part of the tumors notable by enhanced eosinophilic and reduced basophilic staining; C, artificial cavities in the tumors reflecting the areas with mucous content; F, peritumoral fibrotic capsule. Right image: example of automated classification of the live tumor tissue in the samples (shown in white color). (B) Average number of Ki-67-positive cells per field of view in the histological specimens of the tumors. Error bars represent lower and upper boundaries of CI 95% for the mean. (C) Relative amount of live tumor tissue on the histological sections in the studied groups. (D) Calculated volume of live tumor tissue in the tumor samples from studied groups, n = 5 in each group.
Investigation of Cellular Origins of Tissue Effects in X-PDT
We carried out an analysis of mitotic activity and fibrotic changes to shed light on the origin of the observed decrease in tumor volume and the relative volume of live tumor tissue in the X-PDT group. We found that X-PDT induced a statistically significant decrease in mitotic activity (lower expression of Ki-67) in the tumor tissue, in comparison to controls. Treatment with X-rays and nanocarriers alone also induced a moderate cytostatic effect; however, there was no statistical difference between treatments (Figure 5B and Figure S15). The degree of fibrotic reaction in the tumors in different groups was evaluated by Masson’s trichrome method. We observed signs of fibrotic transformation of the peritumoral tissue in the X-PDT group, and accumulation of collagen in the central necrotic area was more pronounced in X-PDT than in other groups (Figure 6A). The results of the Kruskall–Wallis test show that the volume of the peritumoral fibrotic capsule and collagen accumulation in the capsule and in the central necrotic area were different between the studied groups (Figure 6B–D). The relative areas of fibrotic and cancer tissue were evaluated semiquantitatively (Table S1). Treatment with PLGA–TPP contributed to an increase of the volume of the peritumoral fibrotic capsule and accumulation of collagen in the central necrotic area, in comparison to the control group (p = 0.006 and p = 0.034, respectively; Mann–Whitney test). Treatment with X-PDT enhanced all examined signs of fibrosis in comparison to controls, with high statistical significance (p < 0.001 in all the cases). The profibrotic effect of PLGA–TPP was stronger than the effect of the X-ray treatment alone, but less pronounced than the effect of X-PDT (p < 0.001 for all examined cases). Although fibrotic changes were observed most frequently in the X-PDT group, such fibrotic transformation of the tumor in a short time (less than 8 weeks) after X-ray radiation was not considered as a side effect, but as a therapeutic effect and a sign of tumor regression.38 This is in the agreement with the significant reduction of the tumor volume revealed in the X-PDT group (Figure 4) which cannot be explained completely by the cytostatic effect of the treatment only due to the absence of statistically significant difference in Ki-67 staining between the PLGA-TPP, 4 Gy, and X-PDT groups (Figure 5B). These findings collectively imply that the therapeutic benefit of the X-PDT treatment is a combinatorial effect of cytoreductive and profibrotic action, where tumor fibrosis contributes to shrinkage of the damaged tumor tissue.
Figure 6.

(A) Top image: peritumoral capsule and periphery of the tumor with visible accumulation of aligned collagen fibers (blue staining). Bottom image: accumulation of nonorganized collagen in the central necrotic area of the tumor. The histograms for fibrotic feature distributions based on (B) fibrotic capsule volume, (C) fibrotic capsule collagen staining intensity, and (D) collagen staining intensity in the central necrotic area. “0” indicates the absence of fibrotic signs, and “3” indicates obvious fibrotic transformation.
Conclusion
In this work we applied a novel X-PDT treatment to colorectal cancer cells and a mouse model of colorectal cancer using a nanocarrier delivery platform based on the clinically approved PLGA polymer, the photosensitizer VP, and ultrasmall gold nanoparticles (sized below the renal clearance threshold (2–5 nm)). This represents an advance as earlier studies in the area of X-PDT employed poorly biocompatible scintillating nanomaterials. These nanomaterials convert X-ray photons to visible photons further activating a nearby photosensitizer to produce ROS.39−41 In contrast, we established that visible photons are not necessary because a clinically approved photosensitizer, VP, can be directly activated by low-dose X-ray radiation. To optimize the effectiveness of nanocarriers against the vulnerable organelle, we used mitochondrial targeting of nanocarriers with a TPP molecule. The cellular mitochondria were damaged by 1O2 generated in X-PDT, as shown through their loss of mitochondrial membrane potential. Singlet oxygen also initiated apoptosis, leading to rapid damage to cancer cells. The ΔΨm loss (Figure 2C), in vitro cytotoxicity (Figure 3), and the induction of apoptosis pathways (Figure 3) were clear indicators of the cellular effects of 1O2. We further validated the in vivo antitumor effect of X-PDT by testing it in a subcutaneous mouse xenograft model bearing colorectal cancer cells. The tumor response was evaluated by comparing tumor growth in mice treated with X-PDT, nanocarriers alone, and X-rays at 4 Gy alone. Significantly inhibited tumor growth was observed in the group treated with the combined treatment compared with other groups (Figure 4). Such tumor control is consistent with decreased proliferation, as indicated by the reduced phosphorylation of Akt and ERK (Figure 3F), reduced expression of Ki67 protein (Figure 5B), and enhanced fibrosis (Figure 6) observed in the mouse group treated with X-PDT. We found evidence of apoptotic pathways contributing to cell death in X-PDT as apparent from increased levels of BAX and BAD and reduced level of Bcl-2 in cells (Figure 3F).
Cytotoxicity of X-PDT attainable through a synergistic action of X-ray radiation and PDT represents a radiosensitization mechanism which makes it possible to amplify the effects of radiation. We found that the radiation dose of 4 Gy combined with TPP–PLGA nanocarriers allows equivalent control of tumor growth as 12 Gy, but with much reduced side effects of radiation. Mice treated with a high radiation dose of 12 Gy had larger changes of body weight than those treated with X-PDT at 4 Gy. It is also worth emphasizing that the X-PDT exerted a notable profibrotic effect in the tumors, which presented as the thickening of the peritumoral capsule and accumulation of collagen in this capsule, as well as in the central necrotic areas, which were more pronounced than in other treatment groups.
In summary, our strategy may offer a paradigm-shifting treatment alternative for patients who need neoadjuvant radiotherapy but wish to avoid the long-term detrimental effect on functional outcome by undergoing X-PDT technique which used only a fraction of the conventional radiotherapy. Our engineered nanocarriers are made from clinically approved components using a simple synthesis method. Their rational design avoids the need for numerous manufacturing steps in future scaling-up processes. This formulation will also enable rapid translation to the clinic.
Materials and Methods
Materials
Dichloromethane (DCM), VP, dodecanethiol-stabilized gold nanospheres (2% (w/v) in toluene), poly(vinyl alcohol) (PVA, MW: 31 000–50 000), (4-carboxybutyl)triphenylphosphonium bromide (TPP–COOH), N-hydroxysuccinimide (NHS), 1-ethyl-3-(3-(dimethylamino)propyl)carbodiimide (EDC), and Triton X-100 were purchased from Sigma-Aldrich Australia. NH2–PEG–PLGA (MW: 12 000:5000 Da) was purchased from Akina, Inc. Singlet oxygen sensor green (SOSG) was obtained from Thermo Fisher Scientific Inc. CellTiter 96 AQueous One Solution Cell Proliferation Assay was purchased from Promega. Muse Annexin V and Dead Cell Assay was purchased from Merck Millipore. Primary antibodies (against ERK, p-ERK, Akt, p-Akt, BAX, BAD, Bcl-2, and cleaved caspase-3) and HRP-conjugated secondary antibody were purchased from Cell Signaling Technology. Enhanced chemiluminescence reagents were obtained from Thermo Fisher Scientific.
Synthesis of PLGA Nanocarriers and PLGA–TPP Conjugates
PLGA nanocarriers with varying amounts of gold nanoparticles and a fixed amount of VP were synthesized via a solvent evaporation single-emulsion method.42 Briefly, 300 μL of DCM solution containing VP (2.3 mg/mL) was added to 2.5 mL of DCM solution containing 15 mg of PLGA and mixed with the gold nanoparticle suspension (molar ratio of gold to VP from 0:1 to 10:1). The mixture was added dropwise to an aqueous PVA (1%, w/w) solution and sonicated for 1.5 min at 200 W using a microtip probe sonicator (Branson Digital Sonifier, S-250D, Emerson Industrial Automation). The solvent was evaporated overnight at room temperature, under moderate magnetic stirring. PLGA nanocomposites were purified by centrifugation (10 min, 7500 rpm) and washed 3× with distilled water. The final product was suspended in 1 mL of distilled water as stock solution for further use. For nanocarrier conjugation with TPP–COOH, we used a well-established NHS-EDC method.43 Briefly, 10 mg of TPP–COOH was dissolved with 1 mL of MES buffer (pH = 5–6), followed by the addition of 21 mg of NHS and 36 mg of EDC as covalent coupling reagents. The solution was kept for 30 min at room temperature under stirring. After raising the pH to 7.0–7.4, 200 μL of prepared NH2–PEG–PLGA was added into the activated TPP solution. The mixture was allowed to react for 4 h at room temperature under stirring. Afterward, the PLGA–TPP conjugates were purified by centrifugation (10 min, 7500 rpm) and washed with PBS three times. No unusually high safety hazards were encountered in the synthesis process.
Characterization
The extinction spectra of PLGA conjugates containing VP were measured using a spectrophotometer (Cary 5000 UV–vis–NIR, Varian Inc.). The size distribution and ζ potentials of the PLGA samples were measured with a Zetasizer Nano Series instrument (Malvern Instruments). The morphology of PLGA nanocarriers was determined using transmission electron microscopy (TEM, Philips CM10) and scanning electron microscopy (SEM, JEOL JSM 7100F FESEM).
Singlet Oxygen Generation Test in the Solution and VP Release from PLGA Nanocarriers
To quantify the amount of 1O2 generated from PLGA samples containing gold nanoparticles and VP with different molar ratios, 16 μL of SOSG (0.5 mM) was mixed with 3 mL of PLGA suspension. The mixture was then placed in a Petri dish and irradiated with X-rays. A linear accelerator (6 MeV LINAC, Elekta AB) was used to deliver different doses (1–4 Gy) to the samples. After irradiation, the SOSG fluorescence at 525 at 488 nm excitation was recorded using a Fluorolog-Tau-3 system. The increase of SOSG fluorescence after irradiation was calculated as follows:
where Fd and F0 are, respectively, the SOSG fluorescence intensities at various X-ray irradiation doses and without irradiation.
All PEGylated PLGA samples were dialyzed in Slide-A-Lyzer MINI dialysis devices (Thermo Fisher Scientific). These devices were then kept in 50 mL centrifuge tubes with 10 mL of PBS supplied with 10% (v/v) FBS at 37 °C for 24 h. An aliquot of PBS was taken for fluorescence characterization of the released VP at various time points. The total VP fluorescence was measured by disrupting PLGA with DCM. VP fluorescence (Ex/Em: 425 nm/690 nm) was recorded on a Fluorolog-Tau-3 system. The percentage of VP release (RVP(%)) at various time points was calculated as follows:
where Ft and F0, respectively, indicate the fluorescence intensity of VP at various incubation time points and before incubation. Fmax refers to the total fluorescence intensity of VP after the disruption of PLGA samples by adding DCM.
Cell Preparation
Human colon adenocarcinoma HCT 116 cells and normal human colon epithelial cells (CCD 841 CoN) were purchased from the American Type Culture Collection. HCT 116 cells were cultured in McCoy’s 5A (modified) medium; CCD 841 CoN cells were cultured in Eagle’s minimum essential medium (EMEM). All culture media were supplemented with 10% (v/v) FBS and 1% (v/v) antibiotic–antimycotic. The flasks were maintained in a 37 °C incubator with 5% (v/v) CO2 humidified air. The cells were detached with trypsin and transferred at appropriate dilutions into 96-well plates for cell viability assays or glass-bottom Petri dishes for cell imaging. For X-ray radiation experiments, the cells were radiated by using the same accelerator as described in the singlet oxygen generation section.
Colocalization of PLGA–TPP Conjugates with Mitochondria
HCT116 cells were seeded on a glass-bottom Petri dish at a concentration of 1 × 10⁵ cells/mL for 48 h. After that, the cells were incubated with PLGA–TPP suspension (100 μg/mL) for 4 h. After three washes with PBS, the cells were costained with MitoTracker Red (200 nM, Thermo Fisher Scientific) and NucBlue Live ReadyProbes reagent (Thermo Fisher Scientific) in live cell imaging solution at 37 °C for 30 min. The cells were then washed three times with PBS and kept in the live cell imaging solution for confocal imaging using a Leica SP2 confocal laser scanning microscopy system. Laser sources at 405 and 488 nm were used for the excitation of VP, NuBlue, and MitoTracker, respectively. Colocalization between TPP-conjugated nanocarriers and lysosomes was determined by using LysoTracker Red DND-99 (200 nM, Thermo Fisher Scientific) under the same experimental conditions. The Lysotracker was excited at 580 nm.
Intracellular Singlet Oxygen Detection
HCT116 cells were cultured in glass-bottom Petri dishes at 1 × 10⁵ cells/mL. When the cells reached 70–80% confluency, they were treated in different conditions, including incubation with the PLGA nanocarriers alone (50 μg/mL), TPP–PLGA nanocarriers alone (50 μg/mL) for 4 h at 37 °C, radiation with 4 Gy alone, PLGA + 4Gy, and PLGA–TPP + 4 Gy. In the cell groups incubated with nanoparticles, the SOSG solution (5 μM) was subsequently added to the cell medium at 3 h incubation time point. For the cell group treated with X-ray alone, SOSG solution was added to the cell medium for 1 h incubation and washed out, followed by X-ray radiation. After the cells were washed with fresh medium, the SOSG fluorescence signal excited at 488 nm was imaged under a FV3000 confocal laser scanning microscope at different time points. Quantitative analysis of the SOSG signal was conducted by using ImageJ software, which indicated the intracellular 1O2 level generated under different experimental conditions.
Assessment on Mitochondria Membrane Potential (ΔΨm)
The HCT116 cells were, respectively, incubated with PLGA–TPP (50 μg/mL) and nontargeted PLGA (50 μg/mL) in the cell medium for 4 h, followed by X-ray radiation at 4 Gy. The cells were then stained with 5 μM JC-1 dye (Thermo Fisher Scientific) at 37 °C for 10 min per manufacturer’s instructions and analyzed under a FV3000 confocal laser scanning microscope at different time points. The ΔΨm analysis was conducted using ImageJ software to calculate the ratio of red-to-green channel intensity.
In Vitro Cytotoxicity Assays and Annexin V Assay
The in vitro toxicity of X-PDT was evaluated using the MTS test. Before MTS treatment, HCT 116 cells and CCD 841 CoN cells (2 × 10⁴ mL–1) were grown on 96-well plates in the culture medium with 10% FBS for 24 h. After removing the old media, the cells were incubated with PLGA–TPP samples diluted in the culture medium for 4 h. After incubation, the old medium was removed, and fresh medium was added, followed by X-ray radiation at 4 Gy. The cytotoxicity of X-ray-induced PDT on HCT 116 cells at 24 h was determined by the MTS test (Promega Co., Fitchburg, WI) according to the manufacturer’s instructions and compared with control cells without any treatment. Cell viability was then calculated as a percentage of the absorbance of the untreated control sample. For a comparison, the viability of cells treated with PLGA–TPP alone and X-ray at 4 Gy alone was also evaluated in the same experimental conditions. HCT116 cells (1 × 10⁵ cells/well) were seeded in 25 cm2 cell culture flasks and treated with X-ray alone, PLGA–TPP nanoparticles alone, and X-PDT. At 24 h after treatments, the cells were harvested from the culture medium and washed with 1 mL of PBS, followed by the addition of 100 μL of Muse Annexin V Dead Cell reagent. Next, cells were incubated at room temperature for 20 min without light. Apoptosis was then analyzed with Muse Cell Analyzer and Muse analysis software (EMD Millipore).
Western Blotting Analysis
HCT116 cells were treated with PLGA–TPP nanocarriers for 4 h alone, X-ray alone, or X-PDT. After treatments, the cells were washed twice with PBS and lysed with RIPA buffer (Thermo Fisher Scientific) supplemented with a protease inhibitor cocktail (Thermo Fisher Scientific) according to the protocol by the manufacturer. Total protein was extracted and loaded in the wells of Bis-Tris protein gel (Thermo Fisher Scientific). After separation, the protein was transferred to PVDF membranes (Thermo Fisher Scientific). The membranes were blocked with a blocking buffer (Thermo Fisher Scientific) at 4 °C overnight and and incubated with primary antibodies (against ERK, p-ERK, Akt, p-Akt, BAX, BAD, Bcl-2, and cleaved caspase-3) for 1 h at room temperature. All primary antibodies were diluted 1:1000. After washing with blocker buffer three times (Thermo Fisher Scientific), the membranes were incubated with corresponding HRP-conjugated secondary antibody for 1 h at room temperature. All secondary antibodies were diluted 1:1000. After washing with blocker buffer three times, the membranes were visualized using enhanced chemiluminescence reagents on a ChemiDoc MP Imaging System (Bio-Rad Laboratories, Inc.).
In Vivo Antitumor Effect Assessment of X-PDT
All procedures were carried out in accordance with the guidelines and approval of the Northern Sydney Local Heath District Animal Ethics Committee (approval RESP/18/40). 6–7 week old NOD scid gamma mice (The Animal Resources Centre, Perth, Australia) were injected subcutaneously into the right flank with 5 × 10⁶ HCT 116 cells, suspended in a 100 μL mixture of 50 μL of McCoy’s 5A (modified) medium and 50 μL of Matrigel. Tumors were measured regularly with a digital calliper, and volume (V) was calculated by using the following formula:
where L and W are the length (large diameter) and width (short diameter) of the tumor. When tumor volume reached approximately 100 mm3, mice were randomly divided into 6 groups (4−5): Control without any treatment; PLGA–TPP, 4 Gy, and PLGA–TPP + 4, 8, and 12 Gy. PLGA–TPP nanocarriers were given via intratumor injection at a dose of 10 mg/kg based on body weight. Under isoflurane anesthetic, CT images were acquired at 60 kV, 0.8 mA, 1 mm aluminum filtration using a small animal radiation research platform (SARRP, Xstrahl, Inc., Suwanee, GA) and the subcutaneous tumor selectively targeted for X-ray photon irradiation using the MuriPlan Treatment Planning software (Xstrahl, Inc., Suwanee, GA). Radiation was stereotactically delivered using a two beam anterior-posterior/posterior-anterior arrangement (i.e., 0° and 180°) with a 10 × 10 mm collimator at 220 kV, 13 mA, 0.16 mm copper filtration, and dose rate 3.71 Gy/min (Figure S11). CT imaging was conducted at every time point the tumor measurements were recorded. The CT images were analyzed using the Preclinical Imalytics software to display the tumor morphology (Figure S11b). After completion of the treatment, mice were observed for a further 2 weeks or until the humane end point was reached. Body weight and tumor volume were measured every 3 days. At the humane end point, mice were sacrificed, and tumors were removed, photographed, and fixed with 10% (v/v) neutral-buffered formalin for histological analysis.
Histopathological Preparation of the Tumor Samples
Tumors were dissected together with adjacent normal tissues and studied by histological, immunohistochemical, and morphometrical methods. The samples were fixed in 10% neutral buffered formalin, divided into two halves along the long axis of the tumor, and embedded in paraffin blocks with the internal tumor surface exposed. The samples were cut into serial sections of 6 μm in thickness, deparaffinized, and stained with hematoxylin and eosin (H&E) and by Masson’s trichrome method (to reveal fibrotic reaction by blue collagen staining) following conventional protocols. In order to examine the mitotic activity indicative of proliferation in the tumors, the sections were stained by immunohistochemical protocol (IHC) for Ki-67 antigen expression using mouse–antihuman monoclonal primary antibodies (MAB-4190, Sigma-Aldrich, Australia; 1:200). IHC was performed using a heat-induced epitope retrieval procedure in citrate buffer (pH 6.0) for 30 min in a water bath at 80 °C. The secondary HRP-conjugated goat anti-Mouse IgG (H+L) cross-adsorbed antibody (G-21040; Invitrogen, Australia; 1:1000) and DAB chromogen were applied to detect the IHC staining.
Sample Slide Imaging and Data Analysis
The histological preparations were examined by two trained pathologists blinded to animal treatment. The H&E images were obtained using an Aperio XT slide scanner (Leica, Germany) equipped with dry-air objective 20×/N.A. 0.75 objective with a 2× magnification changer and a CCD digital 8/10-bit monochrome TDI line-image capture camera (resolution of 0.25 μm/pixel.) For the classification of live tumor and necrotic areas, the scanned images of H&E-stained samples were segmented by using K-means clustering.44 K means clustering is an unsupervised machine learning approach which can identify different colors in an image while ignoring variation in their brightness.45 The areas dominated by purple color (hematoxylin staining of cellular nuclei) were identified as live tumor; the areas with prevailing pink color (eosin staining of cytoplasm of nuclei-free dead cells) were classified as the nonviable parts. The combination of the live and necrotic tumor areas was defined as the whole area of the sample section. The relative area of live tumor on the sections, ω, was measured as a part of the whole tumor section which was accepted equal as 1. The measurements of ω were averaged across each tumor sample. The estimated volume of live tumor in each sample was calculated by using the following formula:
where Vl is an estimated volume of live tumor, V is a tumor volume obtained by calliper measurements as described above, and ω is a relative area classified as live tumor.
The single-frame/field of view images of H&E, Masson’s trichrome, and IHC-stained samples were obtained with the use of an upright research BX53 microscope (Olympus) equipped with Plan Apochromat 4×/NA 0.16, 20×/NA0.75, 40×/NA0.95, and oil-immersion 100×/NA1.4 objectives (Olympus). Images were recorded using a digital DP80 camera (1360 × 1024 pixels, Olympus). The relative areas of the viable and nonviable (paranecrotic and necrotic) tumor tissues were measured using ImageJ open source software, and the obtained morphometry results were statistically analyzed with nonparametric tests (Kruskall–Wallis H test, followed by Mann–Whitney U test) by SPSS 13.0 for Windows.
Statistical Analysis of Other Data (Excluding Histological Analysis)
Data represent at least three independent experiments and are presented as the mean ± SD. Statistical analyses were performed using GraphPad Prism 7.0 software, and comparisons were made by the two-way ANOVA test for tumor size and log-rank test for survival curve. P-values of less than 0.05 were considered statistically significant.
Acknowledgments
TEM and SEM images in this work were performed in the Microscopy Unit, Faculty of Science and Engineering at Macquarie University. Histological and imaging work was supported by the Laboratory Facilities of the Faculty of Medicine and Health Sciences, Macquarie University and the Biomedical Imaging Facility (BMIF) in the Mark Wainwright Analytical Centre, UNSW. We thank Mr. Vaughan Moutrie and Mr. Daniel Santos from Genesis Care, Macquarie University Hospital, for helping us with in vitro X-ray radiation experiments. We acknowledge partial funding from the Australian Research Council Centre of Excellence Scheme CE140100003 and from the UNSW SHARP scheme. We also acknowledge that the SARRP was funded by a grant from Cancer Institute NSW (2016/REG007).This work is support by Colorectal Surgical Society of Australia and New Zealand Foundation research grant, Ramsay Research and Teaching grant from Northern Sydney Local Health District and Sydney Vital Translational Cancer Research Centre. K.M. is supported by a HMRI Fellowship funded by the Mark Hughes Foundation.
Supporting Information Available
The Supporting Information is available free of charge at https://pubs.acs.org/doi/10.1021/acscentsci.9b01121.
Additional data and figures including quantification of singlet oxygen generation, size distribution, standard curve of absorbance versus concentration, percentage of released VP from PLGA nanocarriers, confocal images, MTS assay, in vivo experimental setup, changes of mouse body weight, tumor volume, histological structure of the tumors, IHC staining images, and the Kruskall–Wallis test (PDF)
Author Contributions
○ K.M. and A.G. contributed equally to this work
The authors declare no competing financial interest.
Supplementary Material
References
- Ciombor K. K.; Wu C.; Goldberg R. M. Recent therapeutic advances in the treatment of colorectal cancer. Annu. Rev. Med. 2015, 66, 83–83. 10.1146/annurev-med-051513-102539. [DOI] [PubMed] [Google Scholar]
- Kolligs F. T. Diagnostics and epidemiology of colorectal cancer. Visceral medicine 2016, 32 (3), 158–164. 10.1159/000446488. [DOI] [PMC free article] [PubMed] [Google Scholar]
- Werner J.; Heinemann V. Standards and Challenges of Care for Colorectal Cancer Today. Visceral medicine 2016, 32 (3), 156–157. 10.1159/000447070. [DOI] [PMC free article] [PubMed] [Google Scholar]
- Kye B.-H.; Cho H.-M. Overview of radiation therapy for treating rectal cancer. Annals of coloproctology 2014, 30 (4), 165–174. 10.3393/ac.2014.30.4.165. [DOI] [PMC free article] [PubMed] [Google Scholar]
- Wang G. D.; et al. Theranostics 2016, 6 (13), 2295. 10.7150/thno.16141. [DOI] [PMC free article] [PubMed] [Google Scholar]
- Dolmans D. E.; Fukumura D.; Jain R. K. Photodynamic therapy for cancer. Nat. Rev. Cancer 2003, 3 (5), 380. 10.1038/nrc1071. [DOI] [PubMed] [Google Scholar]
- DeRosa M. C.; Crutchley R. J. Photosensitized singlet oxygen and its applications. Coord. Chem. Rev. 2002, 233, 351. 10.1016/S0010-8545(02)00034-6. [DOI] [Google Scholar]
- Agostinis P.; et al. Photodynamic therapy of cancer: an update. Ca-Cancer J. Clin. 2011, 61 (4), 250–281. 10.3322/caac.20114. [DOI] [PMC free article] [PubMed] [Google Scholar]
- Sazgarnia A.; et al. In vitro survival of MCF-7 breast cancer cells following combined treatment with ionizing radiation and mitoxantrone-mediated photodynamic therapy. Photodiagn. Photodyn. Ther. 2013, 10 (1), 72–78. 10.1016/j.pdpdt.2012.06.001. [DOI] [PubMed] [Google Scholar]
- Clement S.; et al. Int. J. Nanomed. 2018, 13, 3553. 10.2147/IJN.S164967. [DOI] [PMC free article] [PubMed] [Google Scholar]
- Master A.; Livingston M.; Gupta A. S. Photodynamic nanomedicine in the treatment of solid tumors: perspectives and challenges. J. Controlled Release 2013, 168 (1), 88–102. 10.1016/j.jconrel.2013.02.020. [DOI] [PMC free article] [PubMed] [Google Scholar]
- Avci P.; et al. Low-level laser (light) therapy (LLLT) in skin: stimulating, healing, restoring. In Seminars in cutaneous medicine and surgery; NIH Public Access, 2013. [PMC free article] [PubMed] [Google Scholar]
- Zhou Z.; et al. Chem. Soc. Rev. 2016, 45 (23), 6597–6626. 10.1039/C6CS00271D. [DOI] [PMC free article] [PubMed] [Google Scholar]
- Halliwell B.; Gutteridge J.M.. Free radicals in biology and medicine; Oxford University Press, 2015. [Google Scholar]
- Zhang S.; et al. Tumor mitochondria-targeted photodynamic therapy with a translocator protein (TSPO)-specific photosensitizer. Acta Biomater. 2015, 28, 160–160. 10.1016/j.actbio.2015.09.033. [DOI] [PMC free article] [PubMed] [Google Scholar]
- Lv W.; et al. A Mitochondria-Targeted Photosensitizer Showing Improved Photodynamic Therapy Effects Under Hypoxia. Angew. Chem. 2016, 128 (34), 10101–10105. 10.1002/ange.201604130. [DOI] [PubMed] [Google Scholar]
- Gong N.; et al. Nat. Nanotechnol. 2019, 14 (4), 379. 10.1038/s41565-019-0373-6. [DOI] [PubMed] [Google Scholar]
- Martin L. J. J. P. Pharmaceuticals 2010, 3 (4), 839–915. 10.3390/ph3040839. [DOI] [PMC free article] [PubMed] [Google Scholar]
- Danhier F.; et al. PLGA-based nanoparticles: an overview of biomedical applications. J. Controlled Release 2012, 161 (2), 505–522. 10.1016/j.jconrel.2012.01.043. [DOI] [PubMed] [Google Scholar]
- Lü J.-M. Current advances in research and clinical applications of PLGA-based nanotechnology. Expert Rev. Mol. Diagn. 2009, 9, 325. 10.1586/erm.09.15. [DOI] [PMC free article] [PubMed] [Google Scholar]
- Brodowska K.; et al. The clinically used photosensitizer Verteporfin (VP) inhibits YAP-TEAD and human retinoblastoma cell growth in vitro without light activation. Exp. Eye Res. 2014, 124, 67–67. 10.1016/j.exer.2014.04.011. [DOI] [PMC free article] [PubMed] [Google Scholar]
- Liu-Chittenden Y.; et al. Genetic and pharmacological disruption of the TEAD–YAP complex suppresses the oncogenic activity of YAP. Genes Dev. 2012, 26 (12), 1300–1305. 10.1101/gad.192856.112. [DOI] [PMC free article] [PubMed] [Google Scholar]
- Deng W.; et al. Controlled gene and drug release from a liposomal delivery platform triggered by X-ray radiation. Nat. Commun. 2018, 9 (1), 2713. 10.1038/s41467-018-05118-3. [DOI] [PMC free article] [PubMed] [Google Scholar]
- Kwatra D.; Venugopal A.; Anant S. Nanoparticles in radiation therapy: a summary of various approaches to enhance radiosensitization in cancer. Transl. Cancer Res 2013, 2 (4), 330–342. [Google Scholar]
- Jain S.; Hirst D.; O’sullivan J. Gold nanoparticles as novel agents for cancer therapy. Br. J. Radiol. 2014, 85, 101. 10.1259/bjr/59448833. [DOI] [PMC free article] [PubMed] [Google Scholar]
- Apanasevich V.; et al. Enhance the Absorption of Gamma-ray Energy Inside the Tumor Using Gold Nanoparticles and Iodine Particles. Cancer and Oncology Research 2014, 2 (2), 17–20. [Google Scholar]
- Zielonka J.; et al. Mitochondria-targeted triphenylphosphonium-based compounds: syntheses, mechanisms of action, and therapeutic and diagnostic applications. Chem. Rev. 2017, 117 (15), 10043–10120. 10.1021/acs.chemrev.7b00042. [DOI] [PMC free article] [PubMed] [Google Scholar]
- Murphy M. P. Targeting lipophilic cations to mitochondria. Biochim. Biophys. Acta, Bioenerg. 2008, 1777 (7–8), 1028–1031. 10.1016/j.bbabio.2008.03.029. [DOI] [PubMed] [Google Scholar]
- Modica-Napolitano J. S; Aprille J. R Delocalized lipophilic cations selectively target the mitochondria of carcinoma cells. Adv. Drug Delivery Rev. 2001, 49 (1–2), 63–70. 10.1016/S0169-409X(01)00125-9. [DOI] [PubMed] [Google Scholar]
- Pathak R. K.; Kolishetti N.; Dhar S. Targeted nanoparticles in mitochondrial medicine. Wiley Interdiscip. Rev.: Nanomed. Nanobiotechnol. 2015, 7 (3), 315–329. 10.1002/wnan.1305. [DOI] [PMC free article] [PubMed] [Google Scholar]
- Gollmer A.; et al. Singlet Oxygen Sensor Green®: photochemical behavior in solution and in a mammalian cell. Photochem. Photobiol. 2011, 87 (3), 671–679. 10.1111/j.1751-1097.2011.00900.x. [DOI] [PubMed] [Google Scholar]
- Wilson D. F.; et al. The oxygen dependence of mitochondrial oxidative phosphorylation measured by a new optical method for measuring oxygen concentration. J. Biol. Chem. 1988, 263 (6), 2712–2718. [PubMed] [Google Scholar]
- Marchi S. Mitochondria-ros crosstalk in the control of cell death and aging. J. Signal Transduction 2012, 2012, 1. 10.1155/2012/329635. [DOI] [PMC free article] [PubMed] [Google Scholar]
- Ye Q.; et al. ERK and AKT signaling cooperate to translationally regulate survivin expression for metastatic progression of colorectal cancer. Oncogene 2014, 33 (14), 1828. 10.1038/onc.2013.122. [DOI] [PMC free article] [PubMed] [Google Scholar]
- Brand S.; et al. J. Cell. Biochem. 2006, 97 (4), 709–723. 10.1002/jcb.20672. [DOI] [PubMed] [Google Scholar]
- Cory S.; Adams J. M. The Bcl2 family: regulators of the cellular life-or-death switch. Nat. Rev. Cancer 2002, 2 (9), 647. 10.1038/nrc883. [DOI] [PubMed] [Google Scholar]
- Lakhani S. A.; et al. Caspases 3 and 7: key mediators of mitochondrial events of apoptosis. Science 2006, 311 (5762), 847–851. 10.1126/science.1115035. [DOI] [PMC free article] [PubMed] [Google Scholar]
- Dworak O.; Keilholz L.; Hoffmann A. Pathological features of rectal cancer after preoperative radiochemotherapy. International Journal of Colorectal Disease 1997, 12 (1), 19–23. 10.1007/s003840050072. [DOI] [PubMed] [Google Scholar]
- Kamkaew A.; et al. Scintillating nanoparticles as energy mediators for enhanced photodynamic therapy. ACS Nano 2016, 10 (4), 3918–3935. 10.1021/acsnano.6b01401. [DOI] [PMC free article] [PubMed] [Google Scholar]
- Hu J.; et al. Nanocomposite-based photodynamic therapy strategies for deep tumor treatment. Small 2015, 11 (44), 5860–5887. 10.1002/smll.201501923. [DOI] [PubMed] [Google Scholar]
- Wang G. D.; et al. X-Ray induced photodynamic therapy: a combination of radiotherapy and photodynamic therapy. Theranostics 2016, 6 (13), 2295. 10.7150/thno.16141. [DOI] [PMC free article] [PubMed] [Google Scholar]
- Deng W.; et al. PLGA nanocomposites loaded with verteporfin and gold nanoparticles for enhanced photodynamic therapy of cancer cells. RSC Adv. 2016, 6 (113), 112393–112402. 10.1039/C6RA21997G. [DOI] [Google Scholar]
- Fischer M. J.Amine coupling through EDC/NHS: a practical approach. In Surface plasmon resonance; Springer, 2010; pp 55–73. [Google Scholar]
- Likas A.; Vlassis N.; Verbeek J.J.J.P.r. The global k-means clustering algorithm. Pattern Recognition 2003, 36 (2), 451–461. 10.1016/S0031-3203(02)00060-2. [DOI] [Google Scholar]
- Habibalahi A. Novel automated non invasive detection of ocular surface squamous neoplasia using multispectral autofluorescence imaging. The Ocular Surface 2019, 17, 540. 10.1016/j.jtos.2019.03.003. [DOI] [PubMed] [Google Scholar]
Associated Data
This section collects any data citations, data availability statements, or supplementary materials included in this article.