

Abstract
Introduction:
School violence has a far-reaching effect, impacting the entire school population including staff, students and their families. Among youth attending the most violent schools, studies have reported higher dropout rates, poor school attendance, and poor scholastic achievement. It was noted that the largest crime-prevention results occurred when youth at elevated risk were given an individualized prevention program. However, much work is needed to establish an effective approach to identify at-risk subjects.
Objective:
In our earlier research, we developed a risk assessment program to interview subjects, identify risk and protective factors, and evaluate risk for school violence. This study focused on developing natural language processing (NLP) and machine learning technologies to automate the risk assessment process.
Material and Methods:
We prospectively recruited 131 students with or without behavioral concerns from 89 schools between 05/01/2015 and 04/30/2018. The subjects were interviewed with two risk assessment scales and a questionnaire, and their risk of violence were determined by pediatric psychiatrists based on clinical judgment. Using NLP technologies, different types of linguistic features were extracted from the interview content. Machine learning classifiers were then applied to predict risk of school violence for individual subjects. A two-stage feature selection was implemented to identify violence-related predictors. The performance was validated on the psychiatrist-generated reference standard of risk levels, where positive predictive value (PPV), sensitivity (SEN), negative predictive value (NPV), specificity (SPEC) and area under the ROC curve (AUC) were assessed.
Results:
Compared to subjects’ sociodemographic information, use of linguistic features significantly improved classifiers’ predictive performance (P<0.01). The best-performing classifier with n-gram features achieved 86.5%/86.5%/85.7%/85.7%/94.0% (PPV/SEN/NPV/SPEC/AUC) on the cross-validation set and 83.3%/93.8%/91.7%/78.6%/94.6% (PPV/SEN/NPV/SPEC/AUC) on the test data. The feature selection process identified a set of predictors covering the discussion of subjects’ thoughts, perspectives, behaviors, individual characteristics, peers and family dynamics, and protective factors.
Conclusions:
By analyzing the content from subject interviews, the NLP and machine learning algorithms showed good capacity for detecting risk of school violence. The feature selection uncovered multiple warning markers that could deliver useful clinical insights to assist personalizing intervention. Consequently, the developed approach offered the promise of an accurate and scalable computerized screening service for preventing school violence.
Keywords: Automated risk assessment, School violence, Machine learning, Natural language processing
1. INTRODUCTION
School violence is youth violence that occurs on school property, on the way to or from school, or during a school-sponsored event. The most recent statistics provided by the Centers for Disease Control and Prevention shows that acts of school violence have increased over the past decade.[1] Rates of violent activities are higher at school than away from school, and over 20% of adolescent students report being bullied on school property.[2] School violence has a far reaching effect, impacting the entire school population including staff, students and their families. Among youth attending the most violent schools, studies have reported higher dropout rates, lower school attendance, and poor scholastic achievement.[3] In recent years progress has been made in areas of school-based crime prevention with improved understanding of effective prevention programs.[4,5] It was noted that the largest crime-prevention results occurred when youth at elevated risk were given timely intervention.[4] As such, establishing an effective approach to identify at-risk subjects and provide recommendations for personalizing intervention promises great benefits for improving school safety.
Current possible solutions for school violence prevention are school-based threat assessments, preventive programs, and best practices.[4,5] Despite these efforts, much work is needed to improve school violence risk assessment.[6,7] Several risk assessment scales, ranging from simple clinical impression to structured professional judgment, have been applied to identify youth violence.[8–14] Clinical professionals perform interviews with the questionnaires in busy clinical settings (e.g., emergency rooms) to evaluate students and determine their potential for violent behaviors. Given the large volume of information in the questionnaires, it is labor-intensive for clinicians to identify risk factors and make timely judgment. The average cost per assessment ranges between $1000 and $2500 for interviewing subjects, collecting collateral information, writing reports, and discussing findings and recommendations with schools and guardians. In addition, the scales heavily rely on clinicians’ subjective impression in determining subjects’ risk levels and the success rates for detecting violence incidents remain an issue.[12,13] Indeed, none of the current risk assessments include direct analysis of the words (linguistic patterns) used by subjects and hence, provide few recommendations to personalize intervention. These limitations hinder the dissemination of precise, scalable mechanism for screening and preventing school violence.
Our work is specifically directed at developing an efficient and effective approach to facilitate school violence risk assessment. In our earlier research, we developed a risk assessment program to interview subjects, gather background information from parents, identify risk and protective factors, and evaluate risk for school violence.[15,16] Students with behavioral concerns were recruited by our risk assessment team that consisted of a forensic psychiatrist and mental health professionals. The students were interviewed with two risk assessment scales that were developed in-house for detecting violent behaviors.[15,16] By evaluating their characteristics from the interviews, the team determined the students’ risk of violence towards others and provided recommendations for subsequent interventions. Our analysis of the interviews revealed a variety of linguistic patterns that were significantly associated with students’ risk of school violence. The high-risk students talked more about violent acts or thoughts (P<0.001), violent media (P<0.001), negative acts or feelings (P<0.001), and illegal acts or contact with judicial system (P=0.001). The linguistic patterns covered a subject’s perceptions, intentions, and actions of others.
To take the next step, this study focused on developing natural language processing (NLP) and machine learning technologies to automate the risk assessment process. NLP and machine learning are two powerful technologies that, when combined, have shown to significantly improve predictive performance in detecting clinical conditions such as diseases and adverse events from unstructured narratives.[17–21] The algorithms operate by formatting a model that incorporates linguistic knowledge (e.g., pre-defined clinical terminologies) to analyze human language inputs and make data-driven predictions for target conditions. Literature research has shown that using NLP and machine learning techniques improves risk prediction of mental health problems such as suicide and conflict.[20,21] Nevertheless, no solutions have been developed to predict risk of violent behaviors at school.
1.1. Objective
To fill this gap in the body of knowledge, our specific aims were: 1) to develop a computerized approach to analyze interview content, identify risk characteristics, and predict risk of school violence for individual subjects, 2) to evaluate the effectiveness of NLP and machine learning technologies on a psychiatrist-generated reference standard of risk assessment data, and 3) to identify directions for future development of violence-related warning markers. Our long-term objective is to develop an accurate and scalable automated risk assessment system to screen and prevent school violence.
2. MATERIAL AND METHODS
Figure 1 depicts the overall study design and the details of each process are provided below.
Figure 1.
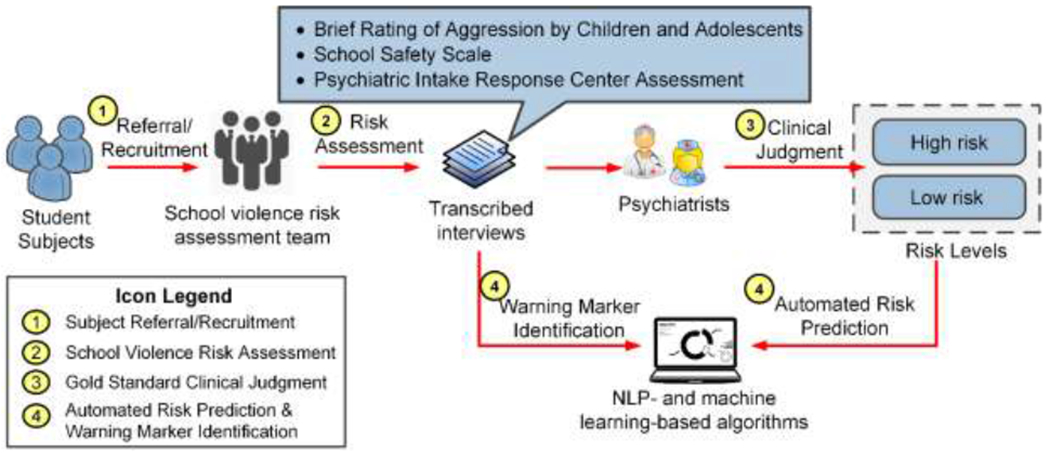
The overall processes of the study.
2.1. Setting and participants
Our school violence risk assessment program was embedded as a clinical service in the Division of Child and Adolescent Psychiatry at Cincinnati Children’s Hospital Medical Center (CCHMC). The Division has 102 licensed beds, 30 residential beds, and 30 patient partial day hospitalization programs. The Division’s inpatient units receive approximately 30,000 psychiatric admissions annually, and its outpatient clinic has over 52,000 patient visits every year.
The study period was between May 1, 2015 and April 30, 2018. The ethics approval was provided by the CCHMC institutional review board (study ID: 2014-5033). During the study period we prospectively recruited students from middle and high schools in Ohio, Kentucky, Indiana, and Tennessee. The students were referred to our risk assessment team directly from schools. We also recruited subjects meeting inclusion criteria randomly from the Division’s inpatient and outpatient units (process 1 in Figure 1). The students’ legal guardians provided written informed consent in person for the risk assessment. They were also asked to give permission for collecting collateral information and disclosing information to schools. Prior to enrollment assent was obtained from the students.
Participants of the study were between 10 and 18 years old, were enrolled in school (excluding homeschool and online school), and were not in state custody. We recruited an equal number of males and females with no exclusion of race, ethnicity or socioeconomic standings. We included students who 1) had any severity of behavioral change, verbal or physical aggression, or threats toward others or property, 2) had self-harm thoughts and behaviors, 3) had subtle and insignificant behavioral changes such as becoming odd, quiet, withdrawn, or isolative, or 4) had no behavioral concerns or changes. The study population represented a large spectrum of severities of behavioral concerns or behavioral changes. It also covered subjects without behavioral changes to simulate the real-life school population.
2.2. School violence risk assessment
For each student a risk assessment was completed as soon as possible from the initial recruitment (process 2 in Figure 1). If approved, collateral information was first collected from parents and/or schools to understand concerns about the subject’s behaviors to better frame assessment questions. The research team then interviewed the student with two scales and one questionnaire: 1) Brief Rating of Aggression by Children and Adolescents (BRACHA) that assesses levels of aggression by children and adolescents, 2) School Safety Scale (SSS) that evaluates risk and protective factors for school violence behaviors, and 3) Psychiatric Intake Response Center (PIRC) questionnaire that collects background information including the subject’s personality, school, social and family dynamics.[8,16,22] The scales and questionnaire captured information about the subject’s individual, peer, family, community, and school characteristics, and they over-lapped in the areas that were previously identified as important correlates to youth violence.[11] Most questions were asked in an open-ended format so that the student would provide more detailed answers than “Yes/No”. The wording of the questions was dependent on the subject’s age and cognitive level. After the risk assessment, our forensic psychiatrist (Dr. Barzman) and his team assessed the student’s behaviors, attitudes, feelings, and technology use (e.g., social media), and shared their clinical impressions, safety concerns, and recommendations with the legal guardians and school professionals (when given permission). The interview was audio recorded and transcribed thereafter. Household information including demographics (sex, race, ethnicity) and socioeconomic status (education, public assistance, household income) was also collected from the subject’s legal guardians.
2.3. Reference standard risk levels
By reviewing their interview and collateral information, the forensic psychiatrist (Dr. Barzman) determined the subjects’ risk levels (low or high) based on clinical judgment (process 3 in Figure 1). It is worth noting that the risk levels were used solely for algorithm development and evaluation. The risk levels were not shared with parents or schools to avoid the stigma based on discrimination of risk. To assess reliability, a child and adolescent psychiatry resident (Dr. Tanguay) independently reviewed the transcribed interviews, re-assessed the scales, and determined the individual risks. Differences between the clinicians’ decisions were resolved during adjudication sessions, where inter-rater reliability was calculated using overall agreement, F-measure, and Cohen’s kappa.[23,24] The adjudicated risk levels do not build a gold standard because they do not represent actual violent behaviors in the future. However, the set forms a useful reference standard to evaluate automated algorithms in replicating psychiatrists’ decisions in a clinical practice setting.
2.4. Automated risk prediction and warning marker identification
In the study, we sought to predict subjects’ risk levels based on their interview content and household information, and to identify warning markers that significantly associated with the risk of school violence (process 4 in Figure 1). The risk levels determined by clinical judgment served as a reference standard to train and evaluate risk prediction models, compare effectiveness of linguistic features, and help identify violence-related markers.
2.4.1. Linguistic feature extraction
We implemented a NLP pipeline in our earlier studies to extract information from clinical narratives.[25–27] Using the pipeline, the transcribed interviews were first tokenized and lemmatized, where the punctuations were removed.[28] A negation detector was applied to identify and convert negated terms. For example, the word “fight” in “I never fight with my classmates” was converted to “NEG_fight”. We then extracted three levels of features from the processed interviews. The first set of features was created to capture conversation dynamics during an interview. We calculated the number of questions asked, total and unique word lengths in questions and responses, response-to-question word ratios, the number of common words, and the Jaccard similarity.[29] The second feature set was created with word categories that summarized semantic meaning in an interview. The Linguistic Inquiry and Word Count dictionary was applied to identify words associated with 51 pre-defined categories such as positive emotion, negative attitude, perception, personal concern, and cognitive process (denoted by LIWC).[30] To identify semantically related terms, word embedding technologies were also implemented to cluster all words into 100 textual categories in an unsupervised manner (denoted by TC).[31] Finally, we extracted n-gram features (<5) that captured both semantic and context information (defined by n-gram). To prevent overfitting, features that occurred less than five times and that appeared only in one transcript were excluded. The rest of n-grams were weighted with term frequency-inverse document frequency weighting and used as the third feature set.[32] By using the NLP technologies, we transformed each student interview to an array of conversational, semantic and contextual features.
2.4.2. School violence risk prediction
We formatted risk prediction as a binary-class classification and implemented four machine learning classifiers: 1) logistic regression (LR) with L1/L2 normalization that measures the linear relationship between linguistic features and risk assessment outcomes;[33] 2) support vector machines with polynomial (SVM-P) and radial basis function (SVM-R) kernels, which construct hyperplanes in linear and non-linear feature spaces to distinguish high-risk and low-risk subjects;34] 3) random forest (RF) that uses a multitude of decision trees to learn a highly irregular combination of features to predict risk levels,[35] and 4) artificial neural networks (ANNs) that comprise three layers of LR models to learn non-linear patterns among features.[33] As the best-performing models could not be determined a priori, we chose these standard classifiers to allow for the possibility of linear and non-linear relationships between features and risk assessment outcomes.
2.4.3. Comparison of linguistic patterns
The baseline feature set included subjects’ household information (demographics, socioeconomic status) that was shown to correlate with youth behavioral problems.[15,36,37] We then compared the baseline with the three levels of linguistic features. In addition, we tested n-gram features extracted from the risk assessments (BRACHA, SSS, PIRC) individually and in combination to assess their respective contributions.
2.4.4. Warning marker identification
To deliver useful insights into potential causes of school violence, warning markers must be identified from the interviews. We implemented a two-stage feature selection process to identify conversational and linguistic patterns that significantly associated with the risk of school violence. Features having potential clinical insights, including conversation dynamics, LIWC categories, and n-grams were used. An unpaired t-test was first performed to excluded features that were not significantly associated with the outcome (P>0.1).[38] An iterative step-forward approach with “best first” search was then applied identify key warning markers.[39] In each iteration a feature was added to the LR classifier for training and testing, where the top-performing one was chosen. The process was repeated until all features were added, and thereafter the top candidates were analyzed.
2.5. Experiments
2.5.1. Evaluation metrics
We adopted four customary evaluation metrics to assess model performance, including positive predictive value (PPV), sensitivity (SEN), negative predictive value (NPV), and specificity (SPEC).[40,41] We also measured the area under the ROC curve (AUC) to assess balance between sensitivity and specificity.[42] The AUC was used as the primary measure for evaluation.
2.5.2. Experiment setup
We divided the data into two sets based on enrollment time: all subjects enrolled before 2018 (approximately 75% of the data) were used for training and development, while the subjects enrolled afterwards were used for testing and error analysis. Ten-fold cross-validation was applied on the training set to tune model parameters. The predictive models with optimal parameters were applied to the test data for performance comparison and error analysis. The feature selection was performed on the training set to identify violence-related warning markers using the tenfold cross-validation setting. A parsimonious model was then developed with the selected warning markers and evaluated on the test data to assess their effectiveness.
3. RESULTS
3.1. Descriptive statistics of the dataset
During the study period we recruited 131 subjects from 89 schools. All legal guardians consented and all students assented for the study (consent/assent rate=100%). Table 1 presents the sociodemographic information and recruitment sources of the study population. Based on clinical judgment, 68 students (52%) were considered high risk towards others. The overall inter-rater reliability was 84.0%/84.2%/0.681 (overall agreement, F-measure, Cohen’s kappa), indicating substantial agreement on the risk level decisions.[24] The training set contained 101 subjects (52/49 high-/low-risk) and the test set had 30 subjects (16/14 high-/low-risk). Table 2 shows the descriptive statistics of the risk assessments and transcripts.
Table 1.
Sociodemographic information of the study population (N=131).
| Variable | Low-risk Population (N=63) | High-risk Population (N=68) |
|---|---|---|
| Age mean (SD) | 15.1 (1.6) | 14.8 (1.5) |
| Sex n (%) | ||
| Male | 28 (21.4) | 39 (29.8) |
| Female | 35 (26.7) | 29 (22.1) |
| Race n (%) | ||
| White | 44 (33.6) | 52 (39.7) |
| African American | 10 (7.6) | 10 (7.6) |
| Other or unknown | 9 (6.9) | 6 (4.6) |
| Ethnicity n (%) | ||
| Hispanic | 7 (5.3) | 1 (0.8) |
| Non-Hispanic | 56 (42.7) | 67 (51.2) |
| Education n (%) | ||
| Less than high school | 5 (3.8) | 5 (3.8) |
| High school | 13 (9.9) | 14 (10.7) |
| Some college | 12 (9.2) | 31 (23.7) |
| College graduate | 20 (15.3) | 14 (10.7) |
| Post-graduate | 13 (9.9) | 4 (3.1) |
| Public Assistance n (%) | ||
| Yes | 9 (6.9) | 24 (18.3) |
| No | 54 (41.2) | 43 (32.8) |
| Unknown | 0 (0.0) | 1 (0.8) |
| Household Income n (%) | ||
| Less than $20,000 | 8 (6.1) | 21 (16.0) |
| $20,001-$40,000 | 20 (15.3) | 27 (20.6) |
| $40,001-$60,000 | 10 (7.6) | 5 (3.8) |
| $60,001-$90,000 | 6 (4.6) | 9 (6.9) |
| More than $90,000 | 19 (14.5) | 6 (4.6) |
| Recruitment Source n (%) | ||
| School referral | 8 (6.1) | 3 (2.3) |
| Outpatient | 7 (5.3) | 10 (7.6) |
| Inpatient | 48 (36.6) | 55 (42.0) |
Table 2.
Descriptive statistics of the risk assessment questionnaires and transcripts.
| Assessment | Topics | Average Number Across all Interviews | n-gram Features | |||
|---|---|---|---|---|---|---|
| Questions | Words | Words per Question | Words per Answer | |||
| BRACHA | 14 | 28±14 | 562±332 | 12±3 | 9±8 | 5270 |
| SSS | 14 | 66±29 | 1339±642 | 10±2 | 11±7 | 11450 |
| PIRC | 22 | 24±12 | 508±304 | 9±2 | 12±9 | 4455 |
BRACHA: Brief Rating of Aggression by Children and Adolescents.
SSS: School Safety Scale.
PIRC: Psychiatric Intake Response Center assessment.
3.2. Performance of school violence risk prediction
Tables 3 presents the AUCs of the machine learning algorithms with different feature sets. The classifiers achieved similar performances when using the same feature set, where LR and SVM-P (with linear kernels) generally performed better. On the ten-fold cross validation set (Table 3.a), all linguistic features except n-grams from PIRC outperformed the baseline across classifiers (P<0.01 under paired t-test). For word category features, combining LIWC and TC yielded better performance than using them individually. By comparing n-grams from individual assessments, the features from BRACHA achieved the best AUC (93.6% with LR). The performance was significantly better than that of SSS (84.0% with LR; P<0.001) and PIRC (65.78% with LR, P<0.001). On the cross validation set n-gram features from BRACHA and SSS achieved the best AUC (94.0% with LR), where the improvements over the other features were statistically significant (Table 3.a). A similar trend was observed on the test set, where n-grams from BRACHA and SSS yielded the best AUC (94.6% with LR; Table 3.b). Because the LR classifier achieved the top performances on most feature sets, Figure 2 presents the evaluation metrics for LR with using baseline, conversation dynamics, the best word category (LIWC+TC) and the best n-gram (BRACHA+SSS) features.
Table 3.
Classification performance (AUC) of the machine learning algorithms on ten-fold cross validation (a) and the test data (b).
| Features | Ten-fold Cross Validation Performance [%] | ||||||||
|---|---|---|---|---|---|---|---|---|---|
| LR | SVM-P | SVM-R | RF | ANN | P* | ||||
| Demographics + socioeconomic status | 68.5 | 68.7 | 64.5 | 59.4 | 63.4 | 1.08E-14 | |||
| Conversation dynamics | 78.1 | 77.8 | 76.3 | 73.3 | 72.3 | 1.91E-6 | |||
| Word category | LIWC | TC | LR | SVM-P | SVM-R | RF | ANN | P* | |
| √ | × | 84.8 | 84.3 | 79.6 | 81.9 | 81.0 | 2.99E-5 | ||
| × | √ | 84.8 | 85.9 | 82.2 | 78.1 | 85.5 | 2.98E-5 | ||
| √ | √ | 89.6 | 90.9 | 84.3 | 84.0 | 85.6 | 1.20E-3 | ||
| n-gram | BRACHA | SSS | PIRC | LR | SVM-P | SVM-R | RF | ANN | P* |
| √ | × | × | 93.6 | 92.3 | 87.1 | 85.9 | 83.0 | 4.20E-2 | |
| × | √ | × | 84.0 | 82.8 | 77.4 | 77.3 | 70.3 | 8.41E-8 | |
| × | × | √ | 65.8 | 59.3 | 53.8 | 61.4 | 58.5 | 4.97E-20 | |
| √ | √ | × | 94.0 | 92.7 | 89.4 | 90.6 | 85.8 | N/A | |
| √ | × | √ | 89.0 | 89.1 | 84.3 | 86.1 | 84.7 | 2.66E-4 | |
| × | √ | √ | 85.4 | 84.1 | 74.5 | 76.3 | 66.6 | 2.70E-10 | |
| √ | √ | √ | 90.8 | 90.9 | 83.6 | 87.2 | 71.5 | 6.51E-5 | |
| (a) | |||||||||
| Features | Test Set Performance [%] | ||||||||
| LR | SVM-P | SVM-R | RF | ANN | |||||
| Demographics + socioeconomic status | 70.5 | 71.9 | 66.7 | 72.1 | 69.0 | ||||
| Conversation dynamics | 79.9 | 81.7 | 79.9 | 79.0 | 80.0 | ||||
| Word category | LIWC | WEC | LR | SVM-P | SVM-R | RF | ANN | ||
| √ | × | 84.4 | 84.8 | 77.2 | 79.5 | 58.0 | |||
| × | √ | 85.7 | 82.6 | 85.7 | 81.9 | 85.7 | |||
| √ | √ | 87.1 | 85.3 | 86.2 | 86.2 | 87.6 | |||
| n-gram | BRACHA | SSS | PIRC | LR | SVM-P | SVM-R | RF | ANN | |
| √ | × | × | 87.1 | 89.0 | 88.8 | 88.4 | 84.8 | ||
| × | √ | × | 85.7 | 85.3 | 88.0 | 80.8 | 71.9 | ||
| × | × | √ | 67.2 | 69.6 | 65.2 | 70.1 | 60.7 | ||
| √ | √ | × | 94.6 | 94.2 | 89.3 | 88.8 | 83.0 | ||
| √ | × | √ | 91.5 | 93.3 | 90.2 | 88.0 | 80.4 | ||
| × | √ | √ | 86.6 | 87.1 | 83.9 | 81.3 | 67.0 | ||
| √ | √ | √ | 93.3 | 93.8 | 86.6 | 85.9 | 74.6 | ||
| (b) | |||||||||
Paired T-test of the performance difference between n-gram features on BRACHA+SSS with the other feature sets across classifiers. N/A indicates that the performances between the two feature sets are identical and no p-value is returned.
Figure 2.
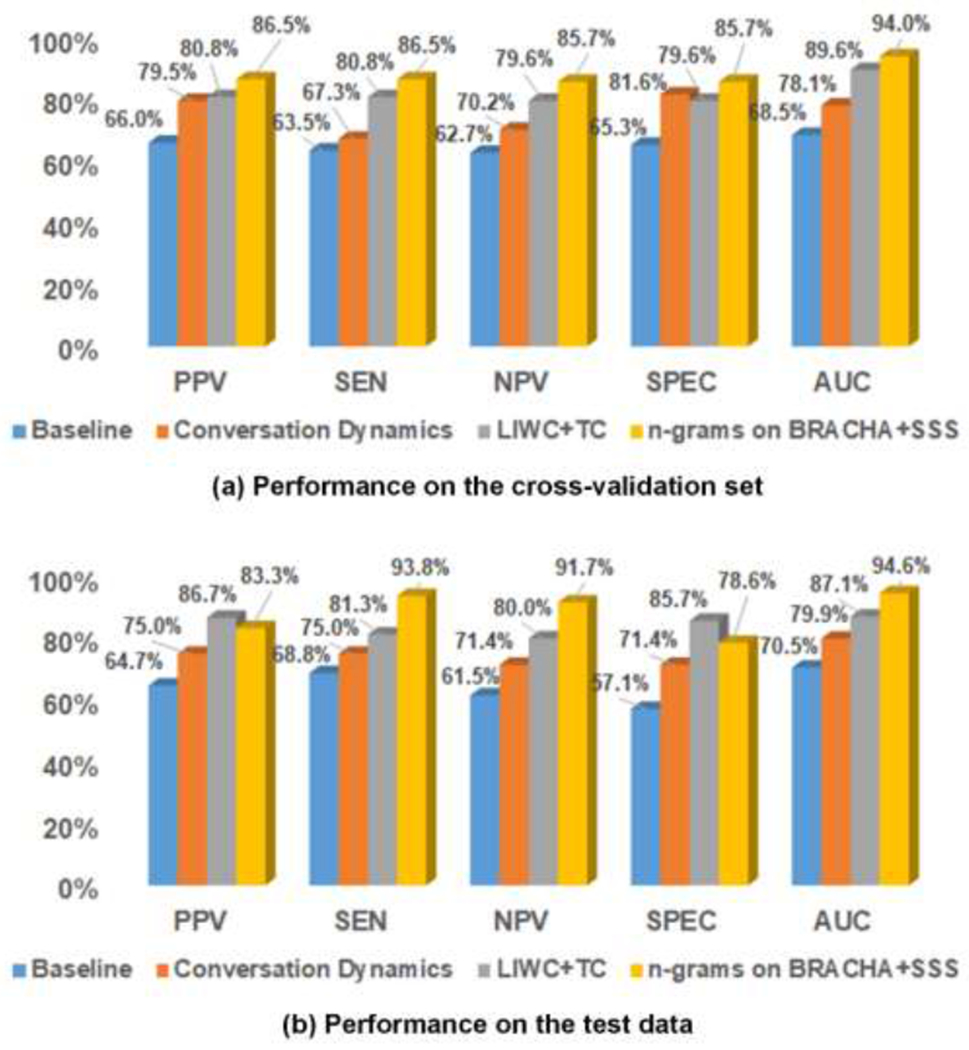
Classification performance of logistic regression with different feature sets.
3.3. Findings of warning markers
Figure 3 illustrates the AUC curves when incrementally adding the top 500 features during feature selection. All features selected were n-grams, of which 95.5% was presented in the test data. The testing AUC increased consistently and was stabilized at 94.1% after adding 400 features. By reviewing their content and context, we grouped the features into 16 categories. Table 4 shows the categories, their frequencies, and example features.
Figure 3.
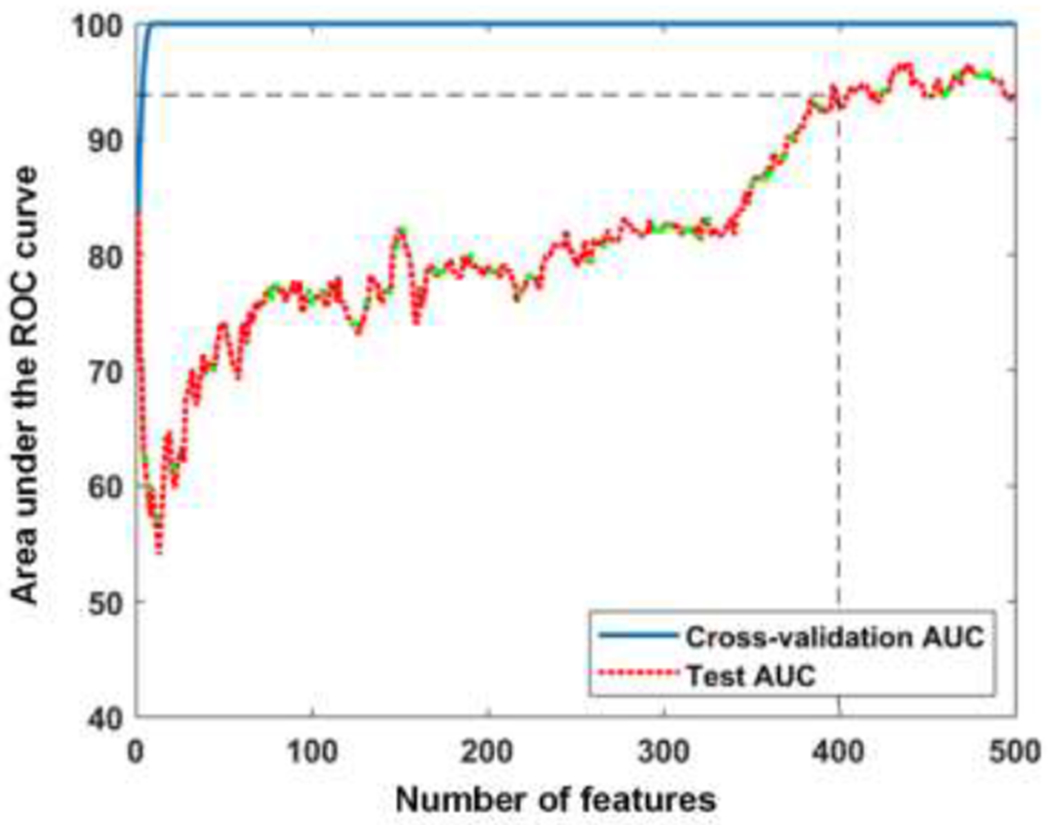
The AUC curves when incrementally adding features during feature selection.
Table 4.
Category description and examples of the selected features.
| Belonging | Category Description | Number of Features (%) | Example Features* |
|---|---|---|---|
| Subject | Violent thoughts or acts of subject/others | 51 (12.8%) | shoot, kill someone, murder, to harm, really want to hurt, gonna hit, fight, another fight, get in fight, threat, knock, aggressive towards anyone, hurt anyone when, affiliate (with a gang) |
| Negative feelings, thoughts or acts of subject/others | 41 (10.3%) | adrenaline rush, be awful, not really care, angry, angry with, my anger, get agitate, (I) get mad, mad, do not believe, not want to take (medication), do not listen, lie, or tease anyone | |
| Confirming thoughts or acts | 23 (5.7%) | it happen, yeah I would, always like, I wanna, I would try to, yeah when, yeah with (somebody), yes | |
| Denying thoughts or acts | 18 (4.5%) | do not know, do not know I just, not feel that way, no but, not wanna, but I do not want, not want to do that, I be not, do not feel, (not) need, (not) do something | |
| Frequency of violent/negative/self-harm thoughts or acts | 18 (4.5%) | like once a week, once in a (week/month), many times, (number) times, not so often, (not) that often, not often, more than once, just a few, that happen a (lot/few times) | |
| Illegal acts (e.g., substance use) or contact with judicial system | 11 (2.8%) | expulsion, school suspension, suspend, be suspend, what be you suspend for, (get) my hand on (drug), drink alcohol, use any drug, (I) get caught, call the police, a police | |
| Technology use by subject | 11 (2.8%) | internet, TV show, movie, I like to play (video game), video (game), call for duty, social media, facebook, heavy metal, youtube | |
| Positive feelings, thoughts, or acts of subject | 9 (2.2%) | be smarter, think thing through, not be aggressive, be great, look forward to, calm, I love (animals), (guns should) be control, look out for (safety) | |
| Self-perception of subject | 6(1.5%) | feel like if, kind of a, you describe yourself as, be you smarter, inside of me, male (answer to “would you describe your mentality more like a female or a male”) | |
| Self-harm thoughts of subject | 1 (0.2%) | to harm myself | |
| Interviewer | Questions about subject thoughts, acts, and causes of incidents | 91 (22.7%) | you tend to think, (you) ever want to, (you) desire to harm, do you feel like, you feel badly when you, last time you think, you ever break, how often do you have (fights), can you give me/us an example, what cause that |
| Recommendation for treatments | 3 (0.8%) | go to treatment, okay with treatment, with go to therapy | |
| Both subject and interviewer | Discussion of peer and family dynamics | 34 (8.5%) | many kid, kid at school, child, the kid, other kid, people, they always, parent would, mom about, and my mom say, she like, he like, she say, with her, she be always |
| Discussion of protective factors | 10 (2.5%) | I do not use (guns/drugs), quit (smoking/substance use), to continue take (medication), take care, (not) be in a fight, (not) hurt myself, (not) be bully, be support at home | |
| Discussion of weapon use | 8 (2.0%) | weapon, you feel about weapon, about gun, gun, any gun or knife, (I) would use (a weapon/any knife), they lock up (guns), (weapons are) put in a safe | |
| Context | 65 (16.2%) | at that point, at the same time, and then we, and then I, and then that, property wise, room, medication, get out of, to do it |
All words have been converted to their canonical forms during feature extraction. Words in parentheses show common context around the features.
4. DISCUSSION
4.1. Principal findings
Our early study suggested that risk of school violence increased significantly with a lower socioeconomic status (e.g., public assistance, household income).[15] However, without using the interview information its AUC plateaued at 70% for predicting subjects’ risk levels (baseline in Table 3). The conversation dynamics reflected subjects’ engagement in interview, and it outperformed the baseline significantly on risk discrimination. Similar findings have been discussed in the literature that analyze relationships between conversation dynamics and subject mental health.[43,44] By extracting semantic information from interviews, the word category features further improved the predictive power. Using n-gram features additionally captured contextual information, and it achieved the best AUC of 94.0% on the cross-validation set and 94.6% on the test data (Table 3). Consistent improvements were observed on the other evaluation metrics when more linguistic features were included (Figure 2). As reported by a recent systematic review of 68 studies, the AUCs achieved by the most widely used violence risk assessments ranged from 0.54 to 0.83 with median AUCs ranging between 0.66 and 0.78.[45] More specifically, the internationally-recognized risk assessment scale for adults (HCR-20) had a median AUC of 0.70 with 8 studies, while the most predictive risk assessment tool for adolescent (Structured Assessment of Violence Risk in Youth) achieved a median AUC of 0.71.[46,47] Both tools utilize structured clinical judgement, where clinicians apply empirically-based risk factors to guide their violence assessment. In contrast, our promising results suggest the power of linguistic patterns in capturing violence signals. The findings also confirm the effectiveness of NLP and machine learning technologies in detecting mental health problems as per earlier studies.[20,21,48,49]
Considering the contribution of individual assessments, BRACHA was shown to be the most predictive. Indeed, the scale was developed to measure levels of aggression by pediatric patients on psychiatry inpatient units, which is highly correlated with violent behaviors. The SSS scale was used to identify risk and protective factors, of which the wording was more diversified (as evidenced by the larger n-gram size in Table 2). The diversity decreased the scale’s predictive power when a limited set of training data was available. Nevertheless, the scale did contribute unique information (e.g., protective factors) such that including it in the classifiers significantly improved the performance (Table 3). Finally, the PIRC questionnaire was mainly used for collecting background information (e.g., school and family dynamics). The content was helpful for understanding the subjects, but it was least informative for assessing risk of school violence.
The feature selection process identified a set of warning markers that help synthesize a human-oriented conceptualization of school violence (Table 4). All features selected were n-grams that captured both semantic and context information. A large portion of features were related to discussion of subjects’ violent thoughts or acts (12.8%; e.g., fight, threat to others), negative feelings or behaviors (10.3%; e.g., anger, lie), self-harm thoughts (0.2%; e.g., to harm myself), illegal acts (2.8%; e.g., school suspension, substance use), frequencies of activities (4.5%; e.g., once in a week, many times), and perspectives of weapon use (2.0%; e.g., gun, knife). These predictors could be warning signs of future violence. The selected features also covered discussion of subjects’ individual characteristics (technology use, 2.8%; self-perception, 1.5%), peer and family dynamics (8.5%), and protective factors (2.5%), which could deliver useful insights into potential causes of school violence. Finally, approximately 23% of the features were related to questions about subjects’ thoughts, previous acts, and causes of incidents, and over 10% of the features were related to subjects’ responses.
The developed algorithms provide two outcomes to assist with school violence risk assessment. A risk score generated by the classifiers will inform if clinical intervention is required. In practice, the alerting risk score for a subject could be enumerated with an empirical value to balance classification sensitivity and specificity. If the subject is deemed to be in elevated risk, warning markers and the context will provide useful insights to inform subsequent personalized intervention. For instance, the algorithms could discover a risk factor “hurt (someone)” from the subject’s response “I have a serious plan to hurt my grandma and my sister”. By understanding the risk factor and its context (grandma, sister), the research team could make appropriate recommendations for the parents to prevent violence incidents. Currently, the LR classifier with n-gram features achieved a PPV/SEN of 83.3%/93.8% on the test data (Figure 2). Further refinements are required to increase PPV. However, the high AUC achieved by the algorithms suggests their potential to facilitate school violence risk assessment by improving efficiency and minimizing clinical subjectivity.
4.2. Error analysis
To identify challenges with automated risk prediction, we performed error analysis for the LR classifier with n-gram features. The algorithm made 18 errors (10 false positives and 8 false negatives) on the cross-validation set and the test data. By reviewing psychiatrists’ clarifications, we grouped the errors into six categories in Table 5. A notable portion of the errors was caused by missing collateral information in the analysis (category 1). The collateral information was helpful for assisting the psychiatrists’ decision making, particularly when the subject hesitated to share information. However, the questions asked by the research team were not fully structured and hence not recorded in the current study. In the future, we will structure and include collateral interviews in the analysis to see if they improve the accuracy of risk prediction.
Table 5.
Misclassification errors made by the LR classifier with n-gram features.
| ID | Category Description | False Positives | False Negatives |
|---|---|---|---|
| 1 | The collateral information from parents and school provided more insights on a subject’s behaviors compared to what he/she was willing to share in the interview (33.3%) | 3 | 3 |
| 2 | Subjects had high-risk of self-harm behaviors but having low risk of violence towards others (16.7%) | 3 | 0 |
| 3 | Subjects presented both risk factors (e.g., history of violent thoughts) and protective factors (e.g., family support, no drug use) (16.7%) | 0 | 3 |
| 4 | As clarified by the psychiatrists, subjects appeared to be on the line between low risk and high risk (11.1%) | 0 | 2 |
| 5 | The system missed temporal (e.g., aggressive in the past but not current) or experiencer (e.g., fighting with brothers at home rather than school peers) information (11.1%) | 2 | 0 |
| 6 | Subjects provided inconsistent answers to the same questions during interviews (11.1%) | 2 | 0 |
Another set of errors was caused by the machine learning algorithms’ misinterpretation of risk factors, and their tradeoff between risk and protective factors (categories 2-4). Subjects with self-harm behaviors tended to use wording such as “killing me” and “hurt myself’, which could be misinterpreted as risk factors towards others by the algorithms (category 2). In addition, the algorithms showed lower capacity for balancing conflict features if a subject presented both risk and protective factors (categories 3-4). To alleviate this problem, we will pilot advanced multi-layer classifiers in our future work to balance different types of factors before aggregating them for risk prediction.[50] Missing temporal and experiencer information by the NLP pipeline caused a couple of false positive predictions (category 5). The observation suggested the necessity of additional assertion detection in linguistic feature extraction, which will be implemented in our future work. Finally, certain subjects provided conflicting answers to overlapped questions between the assessments and it caused 11.1% of the errors (category 6). How to refine the interviewing process to improve consistency of the collected information warrants further investigation.
4.3. Limitations and future work
Limited by its funding and resources, this study did not collect future violence data from schools after subject interviews. Although historical violence is the strongest predictor for future violence, the risk levels meticulously determined by our psychiatrists might not always warrant future violence behaviors.[51,52] To evaluate its predictive validity, a new protocol has been initiated to follow up with schools in three school months after the interviews to collect subjects’ violence related outcomes. Based on the Modified Overt Aggression Scale, a survey has been developed to collect four outcomes at school including verbal aggression (against others) and physical aggression (against self, others, and property).[53] By using the set of school-based outcomes we will validate our capacity for predicting violence in the future work. Another limitation is that our linguistic patterns, particularly n-grams may be specific to a geographic region. Because the language used by students could vary across regions of the country, the warning markers identified in our dataset may not capture dialects used in other geographic areas. To address this limitation, project planning and communication is in progress to establish collaborations with regional schools and healthcare institutions nationwide for subject recruitment.
5. CONCLUSIONS
In this study, we demonstrated the power of linguistic patterns in capturing school violence signals. By analyzing interview content from our unique assessment scales, the NLP- and machine learning-based algorithms showed good capability of detecting violence risk for individual subjects. The predictive performance of linguistic features significantly outperformed subject household information. The best performing classifier with n-gram features was accurate with assessing subjects’ risk levels when compared to clinical judgement made by pediatric psychiatrists (AUCs of 94.0% on the cross-validation set and 94.6% on the test data). The feature selection uncovered multiple warning markers that could deliver useful clinical insights to assist personalizing intervention. Consequently, we hypothesize that our risk assessment scales along with the automated risk prediction algorithms, when fully developed, will pave the way to an accurate and scalable computerized screening service for preventing school violence.
8. SUMMARY TABLE.
8.1. What was already known on the topic:
The largest school-based crime-prevention results occur when youth at elevated risk are given timely intervention.
The current risk assessments do not include direct analysis of the words (linguistic patterns) used by subjects and hence, provide few recommendations to personalize intervention.
Natural language processing and machine learning technologies identify linguistic patterns to construct predictive models and they have been applied to detect mental health problems such as suicidal ideation.
8.2. What this study added to our knowledge:
By analyzing the content from subject interviews, the NLP and machine learning algorithms show good capacity for detecting risk of school violence.
The feature selection process discovers multiple warning markers that could deliver useful clinical insights to assist personalizing intervention.
The developed approach offers the promise of an accurate and scalable computerized screening service for preventing school violence.
HIGHLIGHTS.
NLP and machine learning show good capacity for detecting risk of school violence.
Linguistic features work better in predicting violence than sociodemographic information.
Feature selection discovers useful violence-related linguistic markers for prevention.
6. ACKNOWLEDGEMENTS
This work was supported by the National Institutes of Health (grant numbers: 1R01LM012230, 1U01HG008666, UL1TR001425), and the Agency for Healthcare Research and Quality (grant number 1R21HS024983). YN was also supported by internal funds from CCHMC.
Particular thanks go to Shelby Tanguay, MD for reviewing the subject interviews and providing clinical judgment on the risk levels. The authors also thank Elana Harris, MD, PhD for her support in subject discussion and risk level adjudication.
Footnotes
Publisher's Disclaimer: This is a PDF file of an unedited manuscript that has been accepted for publication. As a service to our customers we are providing this early version of the manuscript. The manuscript will undergo copyediting, typesetting, and review of the resulting proof before it is published in its final form. Please note that during the production process errors may be discovered which could affect the content, and all legal disclaimers that apply to the journal pertain.
STATEMENT ON CONFLICTS OF INTEREST
The authors have no competing interests to declare.
REFERENCES
- [1].Centers for Disease Control and Prevention. Understanding school violence 2016. [cited June 4, 2019]; Available from: http://www.cdc.gov/violenceprevention/pdf/school_violence_fact_sheet-a.pdf
- [2].Kann L, McManus T, Harris WA, Shanklin SL, Flint KH, Hawkins J, Queen B, Lowry R, Olsen EO, Chyen D, Whittle L, Thornton J, Lim C, Yamakawa Y, Brener N, Zaza S. Youth risk behavior surveillance - United States, 2015. Morbidity and mortality weekly report Surveillance summaries (Washington, DC : 2002). 2016;65(6):1–174. [DOI] [PubMed] [Google Scholar]
- [3].National Association of School Psychologists. School safety and crisis. 2010. [cited June 4, 2019]; Available from: https://www.nasponline.org/resources-and-publications/resources/school-safety-and-crisis
- [4].Gottfredson DC, Cook PJ, Chongmin N. Schools and prevention In: Farrington DP, Welsh BC, editors. The oxford handbook of crime prevention. Oxford: Oxford University Press; 2012. [Google Scholar]
- [5].Tanner-Smith EE, Wilson SJ, Lipsey MW. Risk factors and crime In: Maguire M, Morgan R, Reiner R, editors. The oxford handbook of criminology. Oxford: Oxford University Press; 2012. [Google Scholar]
- [6].Borum R, Cornell DG, Modzeleski W, Jimerson SR. What can be done about school shootings?: A review of the evidence. Educational Researcher. 2010;39(1):27–37. [Google Scholar]
- [7].Nekvasil EK, Cornell DG. Student reports of peer threats of violence: Prevalence and outcomes. Journal of School Violence. 2012;11(4):357–75. [Google Scholar]
- [8].Barzman D, Mossman D, Sonnier L, Sorter M. Brief rating of aggression by children and adolescents (bracha): A reliability study. J Am Acad Psychiatry. 2012;40(3):374–82. [PubMed] [Google Scholar]
- [9].Barzman DH, Brackenbury L, Sonnier L, Schnell B, Cassedy A, Salisbury S, Sorter M, Mossman D. Brief rating of aggression by children and adolescents (BRACHA): Development of a tool for assessing risk of inpatients’ aggressive behavior. J Am Acad Psychiatry. 2011;39(2):170–9. [PubMed] [Google Scholar]
- [10].Bernes K, Bardick A. Conducting adolescent violence risk assessments: A framework for school counselors. Professional School Counseling. 2007;10(4):419–27. [Google Scholar]
- [11].Hilterman EL, Nicholls TL, van Nieuwenhuizen C. Predictive validity of risk assessments in juvenile offenders: Comparing the SAVRY, PCL:YV, and YLS/CMI with unstructured clinical assessments. Assessment. 2014;21(3):324–39. [DOI] [PubMed] [Google Scholar]
- [12].McGowan MR, Horn RA, Mellott RN. The predictive validity of the structured assessment of violence risk in youth in secondary educational settings. Psychological Assessment. 2011;23(2):478–86. [DOI] [PubMed] [Google Scholar]
- [13].Monahan J, Steadman HJ. Violence risk assessment: A quarter century of research In: Frost LE, Bonnie RJ, editors. The evaluation of mental health law: American Psychological Association; 2001;2001:195–211. [Google Scholar]
- [14].Welsh JL, Schmidt F, McKinnon L, Chattha HK, Meyers JR. A comparative study of adolescent risk assessment instruments: Predictive and incremental validity. Assessment. 2008;15(1):104–15. [DOI] [PubMed] [Google Scholar]
- [15].Barzman D, Ni Y, Griffey M, Bachtel A, Lin K, Jackson H, Sorter M, DelBello MP. Automated risk assessment for school violence: A pilot study. Psychiat Quart. 2018;89(4):817–28. [DOI] [PubMed] [Google Scholar]
- [16].Barzman DH, Ni Y, Griffey M, Patel B, Warren A, Latessa E, Sorter M. A pilot study on developing a standardized and sensitive school violence risk assessment with manual annotation. Psychiatr Q. 2017. September;88(3):447–57. [DOI] [PubMed] [Google Scholar]
- [17].Ni Y, Bermudez M, Kennebeck S, Liddy-Hicks S, Dexheimer JW. Designing and evaluating a real-time automated patient screening system in an emergency department. JMIR Med Inform. 2019;7(3):e14185. [DOI] [PMC free article] [PubMed] [Google Scholar]
- [18].Melton GB, Hripcsak G. Automated detection of adverse events using natural language processing on discharge summaries. J Am Med Inform Assoc. 2005;12(4):448–457. [DOI] [PMC free article] [PubMed] [Google Scholar]
- [19].Tang H, Solti I, Kirkendall E, Zhai H, Lingren T, Meller J, Ni Y. Leveraging food and drug administration adverse event reports for the automated monitoring of electronic health records in a pediatric hospital. Biomedical informatics insights. 2017;9:1178222617713018. [DOI] [PMC free article] [PubMed] [Google Scholar]
- [20].Perry C Machine learning and conflict prediction: A use case. Stability: International Journal of Security & Development. 2013;2(3):56. [Google Scholar]
- [21].Pestian JP, Sorter M, Connolly B, Bretonnel Cohen K, McCullumsmith C, Gee JT, Morency LP, Scherer S, Rohlfs L, Group STMR. A machine learning approach to identifying the thought markers of suicidal subjects: A prospective multicenter trial. Suicide Life Threat Behav. 2017;47(1):112–21. [DOI] [PubMed] [Google Scholar]
- [22].O’Toole ME. The school shooter: A threat assessment perspective. Quantico, VA: FBI Academy; 2000. [Google Scholar]
- [23].Hripcsak G, Rothschild AS. Agreement, the F-measure, and reliability in information retrieval. J Am Med Inform Assoc. 2005;12(3):296–8. [DOI] [PMC free article] [PubMed] [Google Scholar]
- [24].McHugh ML. Interrater reliability: The kappa statistic. Biochem Med (Zagreb). 2012;22(3):276–82. [PMC free article] [PubMed] [Google Scholar]
- [25].Li Q, Spooner SA, Kaiser M, Lingren N, Robbins J, Lingren T, Tang H, Solti I, Ni Y. An end-to-end hybrid algorithm for automated medication discrepancy detection. BMC medical informatics and decision making. 2015;15(1):37. [DOI] [PMC free article] [PubMed] [Google Scholar]
- [26].Ni Y, Kennebeck S, Dexheimer JW, McAneney CM, Tang H, Lingren T, Li Q, Zhai H, Solti I. Automated clinical trial eligibility prescreening: Increasing the efficiency of patient identification for clinical trials in the emergency department J Am Med Inform Assoc. 2015;22(1):166–78. [DOI] [PMC free article] [PubMed] [Google Scholar]
- [27].Ni Y, Wright J, Perentesis J, Lingren T, Deleger L, Kaiser M, Kohane I, Solti I. Increasing the efficiency of trial-patient matching: Automated clinical trial eligibility pre-screening for pediatric oncology patients. BMC medical informatics and decision making. 2015;15(1):28. [DOI] [PMC free article] [PubMed] [Google Scholar]
- [28].Manning CD, Surdeanu M, Bauer J, Finkel J, Bethard SJ, Mcclosky D. The stanford corenlp natural language processing toolkit. In Proceedings of the 52nd Annual Meeting of the Association for Computational Linguistics: System Demonstrations; 2014;2014:55–60. [Google Scholar]
- [29].Jaccard P The distribution of the flora in the alpine zone. New Phytologist. 1912;11(2):37–50. [Google Scholar]
- [30].Pennebaker JW, Boyd RL, Jordan K, Blackburn K. The development and psychometric properties of liwc2015. Austin, TX: University of Texas at Austin; 2015. [Google Scholar]
- [31].Mikolov T, Sutskever I, Chen K, Corrado G, Dean J. Distributed representations of words and phrases and their compositionality. In Proceedings of the 26th International Conference on Neural Information Processing Systems Lake Tahoe, Nevada; 2013;2013:3111–9. [Google Scholar]
- [32].Manning CD, Schutze H. Foundation of statistical natural language processing. Cambridge, MA: MIT Press; 1999. [Google Scholar]
- [33].Bishop CM. Pattern recognition and machine learning: Springer Science+Business Media, LLC; 2006. [Google Scholar]
- [34].Shawe-Taylor J, Christianini N. Kernel methods for pattern analysis: Cambridge University Press; 2004. [Google Scholar]
- [35].Breiman L Random forests. Machine Learning. 2001; 45(1) :5–32. [Google Scholar]
- [36].Reed MO, Jakubovski E, Johnson JA, Bloch MH. Predictors of long-term school-based behavioral outcomes in the multimodal treatment study of children with attention-deficit/hyperactivity disorder. J Child Adolesc Psychopharmacol. 2017;27(4):296–309. [DOI] [PMC free article] [PubMed] [Google Scholar]
- [37].Molnar BE, Cerda M, Roberts AL, Buka SL. Effects of neighborhood resources on aggressive and delinquent behaviors among urban youths. Am J Public Health. 2008;98(6):1086–93. [DOI] [PMC free article] [PubMed] [Google Scholar]
- [38].McDonald JH. Handbook of biological statistics (3rd ed.): Sparky House Publishing; 2014. [Google Scholar]
- [39].Kohavi R, John GH. Wrappers for feature subset selection. Artificial Intelligence. 1997;97(1-2):273–324. [Google Scholar]
- [40].Altman DG, Bland JM. Diagnostic tests. 1: Sensitivity and specificity. BMJ. 1994;308(6943):1552. [DOI] [PMC free article] [PubMed] [Google Scholar]
- [41].Altman DG, Bland JM. Diagnostic tests 2: Predictive values. BMJ. 1994;309(6947):102. [DOI] [PMC free article] [PubMed] [Google Scholar]
- [42].Rice JA. Mathematical statistics and data analysis (3rd ed.): Duxbury Advanced; 2006. [Google Scholar]
- [43].Venek V, Scherer S, Morency L- P, Rizzo AS, Pestian J. Adolescent suicidal risk assessment in clinician-patient interaction. IEEE Transactions on Affective Computing. 2017;8(2):204–15. [Google Scholar]
- [44].Moore RK, Mehl MR, Walker MA, Mairesse F. Using linguistic cues for the automatic recognition of personality in conversation and text. J Artif Intell Res. 2007;30:457–500. [Google Scholar]
- [45].Singh JP, Grann M, Fazel S. A comparative study of violence risk assessment tools: A systematic review and metaregression analysis of 68 studies involving 25,980 participants. Clin Psychol Rev. 2011;31(3):499–513. [DOI] [PubMed] [Google Scholar]
- [46].Douglas KS, Webster CD. The hcr-20 violence risk assessment scheme. Criminal Justice and Behavior. 2016;26(1):3–19. [Google Scholar]
- [47].Borum R, Bartel P, Forth A. Manual for the structured assessment for violence risk in youth (savry): Consultation edition. Tampa, FL: University of South Florida; 2000. [Google Scholar]
- [48].Pestian J, Nasrallah H, Matykiewicz P, Bennett A, Leenaars A. Suicide note classification using natural language processing: A content analysis. Biomedical informatics insights. 2010;3:19–28. [DOI] [PMC free article] [PubMed] [Google Scholar]
- [49].Pestian JP, Matykiewicz P, Linn-Gust M. What’s in a note: Construction of a suicide note corpus. Biomedical informatics insights. 2012;5:1–6. [DOI] [PMC free article] [PubMed] [Google Scholar]
- [50].Zhai H, Srikant I, Ni Y, Lingren T, Kirkendall E, Tang H, Li Q, Solti I. Mining a large-scale EHR with machine learning methods to predict all-cause 30-day unplanned readmissions. In Proceedings of the 2nd ASE International Conference on Big Data Science and Computing Standford, CA 2014. [Google Scholar]
- [51].Mossman D Assessing predictions of violence - being accurate about accuracy. Journal of Consulting and Clinical Psychology. 1994;62(4):783–92. [DOI] [PubMed] [Google Scholar]
- [52].Janofsky JS, Spears S, Neubauer DN. Psychiatrists’ accuracy in predicting violent behavior on an inpatient unit. Psychiatric Services. 1988;39(10):1090–4. [DOI] [PubMed] [Google Scholar]
- [53].Blader JC, Pliszka SR, Jensen PS, Schooler NR, Kafantaris V. Stimulant-responsive and stimu-lant-refractory aggressive behavior among children with adhd. Pediatrics. 2010;126(4):e796–806. [DOI] [PMC free article] [PubMed] [Google Scholar]