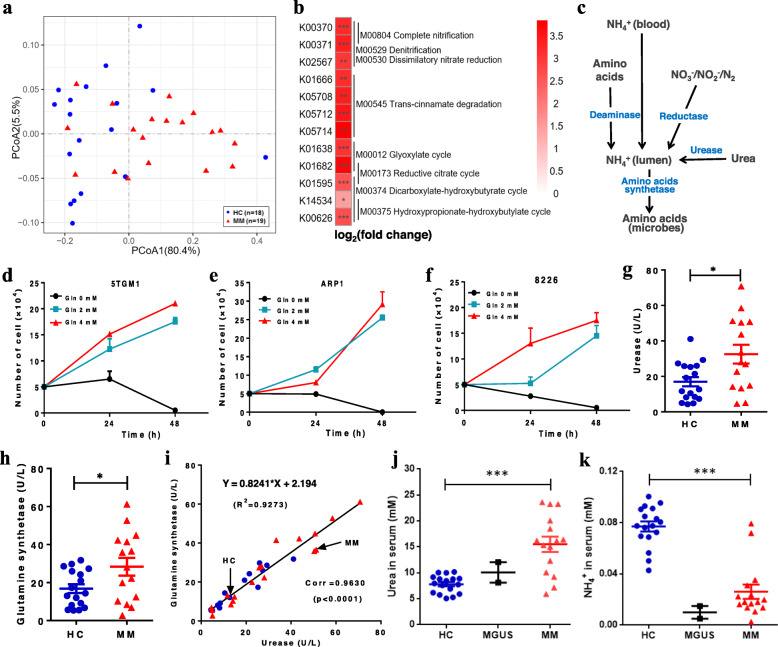
Fig. 3.
Functional alterations of microbes (KOs) in MM. a PCoA based on Bray-Curtis dissimilarity index shows the between-samples (β) diversity (PERMANOVA, P = 0.004). b Eight modules mapped by at least 2 identified KOs. c Metabolic pathways of NH4+ in the intestinal lumen. d–f Cell proliferation curves with different glutamine concentrations, including 5TGM1 (d), ARP1 (e), and 8226 (f). g, h The activities of urease (g) and glutamine synthase (h) in HC and MM subjects, respectively. i Linear fitting of urease and glutamine synthase activity in all subjects, in which blue dots and red triangles represent HC and MM samples, respectively. j, k The concentrations of serum urea (j) and NH4+ (k) in HC, MGUS, and MM samples, respectively. P value was determined by using two-tailed unpaired t test. *P < 0.05, **P < 0.01, ***P < 0.001

