

Abstract
Piezo1 is a mechanosensitive channel that converts applied force into electrical signals. Partial molecular structures show a bowl-shaped trimer with extended arms. Here we use cryo-electron microscopy (cryo-EM) to show that Piezo1 adopts different degrees of curvature in lipid vesicles of different size. We also use high-speed atomic force microscopy (HS-AFM) imaging to analyze the deformability of Piezo1 under force in membranes on a mica surface: Piezo1 can be flattened reversibly into the membrane plane. By approximating the absolute force applied, we estimate a range of values for a mechanical spring constant for Piezo1. Both methods demonstrate that Piezo1 can deform its shape towards a planar structure. This deformation could explain how lateral membrane tension can be converted into a conformation-dependent free energy change to gate the Piezo1 channel in response to mechanical perturbations.
Introduction:
Piezo channels are mechanosensitive, nonselective cation channels that mediate force-detection in eukaryotic cells1–3. They transduce mechanical stimuli in many different physiological processes, including touch sensation3–11. As a consequence, deficiency or gain-of-function mutations have been linked to diseases, underscoring their medical importance12–15.
Piezo channels are large proteins (>2500 amino acids) with 38 predicted transmembrane (TM) helices per subunit1. Recently, several partial molecular structures of mouse Piezo1 have been determined using cryo-EM16–18. These show a triskelion-shaped homo-trimer with a central pore module, a C-terminal extracellular domain (CED), and long, bent arms projecting away from the central 3-fold axis, with helical beams near the arms’ attachment to the pore module (Extended Data Fig. 1a)16. TM helices 37 and 38 form the pore module. TM helices 13 – 36, arranged in six 4-helical repeats, form the arms. Topology analysis suggests the existence of an additional 12 TM helices (Extended Data Fig. 1b, TM helices 1 – 12).
In cryo-EM structures, the detergent micelle follows a curved contour to satisfy the non-planar shape of Piezo1 (Extended Data Fig. 1a, bottom), and in lipid vesicles Piezo1 causes the membrane to curve locally into a dome16. It has been suggested that the Piezo1 arms might act as levers to sense force for gating18–20, and a model for sensing membrane tension through in-plane area change resulting from dome-flattening has been proposed16.
Various mechanical stimuli3–5,21,22 have been used to activate Piezo1 which, when open, give rise to a single channel conductance ~29 pS, with a significant inactivation period2,19. These methods of activation could be consistent with either of the classical models for mechanical gating: the ‘lateral membrane tension’ model16,21–26 (Fig. 1a) and the ‘tethered spring’ model19,23,27–29 (Fig. 1b). Due to the complexity of cell membranes and membrane patches30,31 and the potential multitude of pathways leading to channel activation19,20,32,33, the quantitative and mechanistic identification of force transduction remains challenging.
Fig 1. Proposed activation mechanisms of Piezo1.
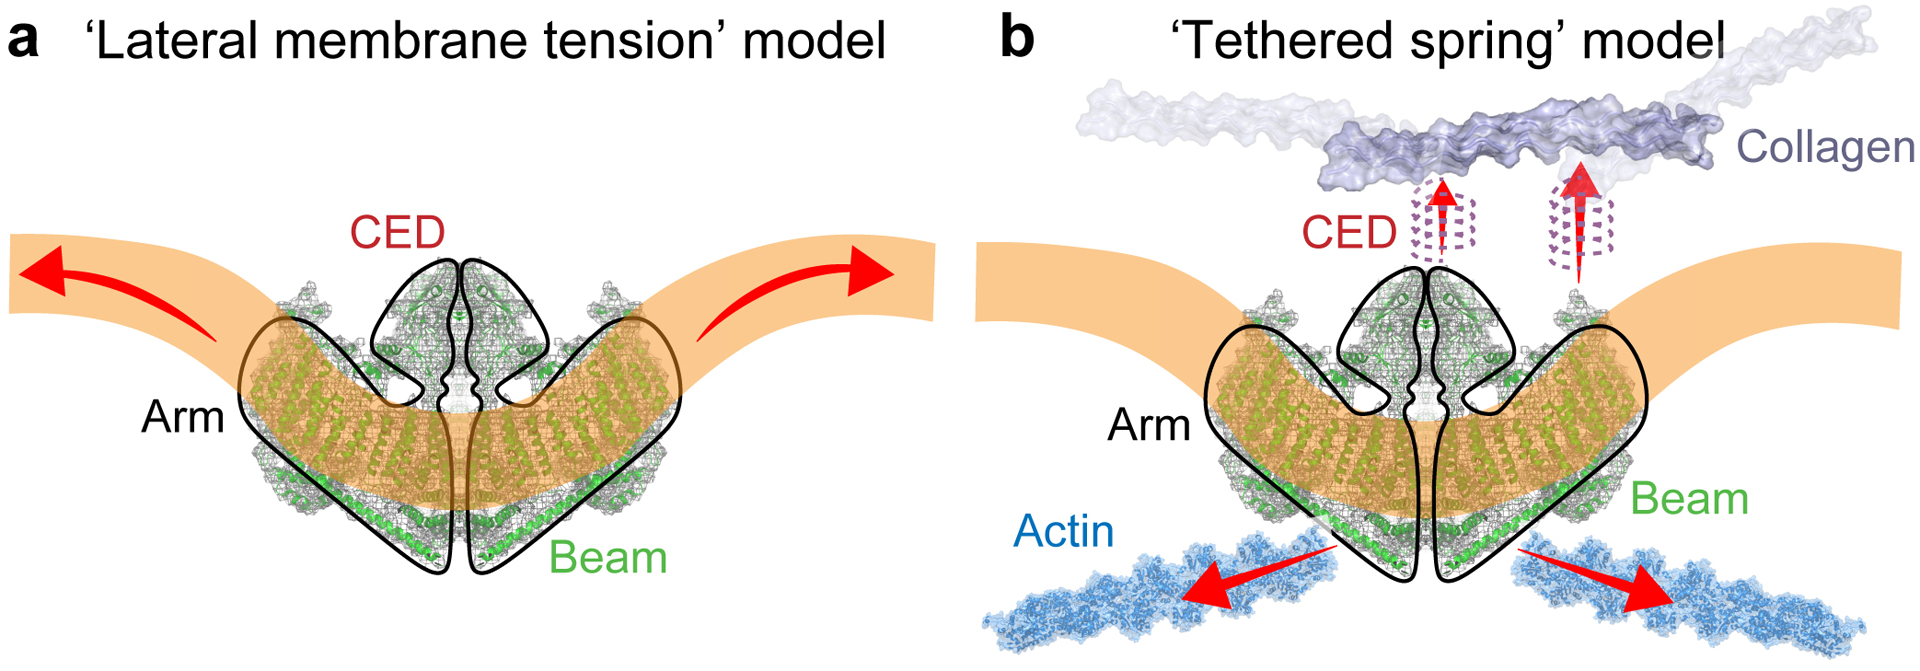
(a) Lateral membrane tension model: Changes in membrane properties, e.g. tension or curvature, lead to a gating force applied onto Piezo1. (b) Tethered spring model: Piezo1 channel is activated through interactions with the cytoskeleton or the extracellular matrix. Red arrows indicate force application.
In this study we analyze Piezo1 channels in lipid vesicles with different sizes to determine how the vesicle radius of curvature influences the shape of Piezo1. We also analyze Piezo1 reconstituted into supported lipid membranes using HS-AFM, which can simultaneously provide structural and dynamical information on single biomolecules34, and, importantly for the investigation of a mechanosensitive channel, permits the application of controlled force during image acquisition35. These data characterize the structural response of Piezo1 to its biologically relevant physical stimulus, mechanical force.
Results:
Behavior of Piezo1 channels in lipid vesicles
Using cryo-EM we studied Piezo1 channels embedded in vesicles consisting of POPC/DOPS/CHOL = 8:1:1 (w:w:w) (Fig. 2a). In the absence of Piezo1 these vesicles form spheres because the membrane bending energy is minimized by the spherical shape36. Single Piezo1 channels are visible in some of the vesicles (Fig. 2a, inset). In projection, viewed down the pore axis, the arms bend at the elbow either clockwise or counterclockwise, depending on whether a channel is being viewed from its extracellular or its intracellular surface. Piezo1 reconstitutes with a preferred orientation in which its extracellular surface faces the inside of a vesicle – likely due to its intrinsic curvature. Averages of these projected views fit quite well to top and bottom views of the atomic model of Piezo116–18, indicating that Piezo1 reconstituted in vesicles has a structure similar to Piezo1 in detergent (Fig. 2b)16–18.
Fig 2. Reconstitution of Piezo1 in vesicles exhibit various orientations in cryo-EM micrographs.
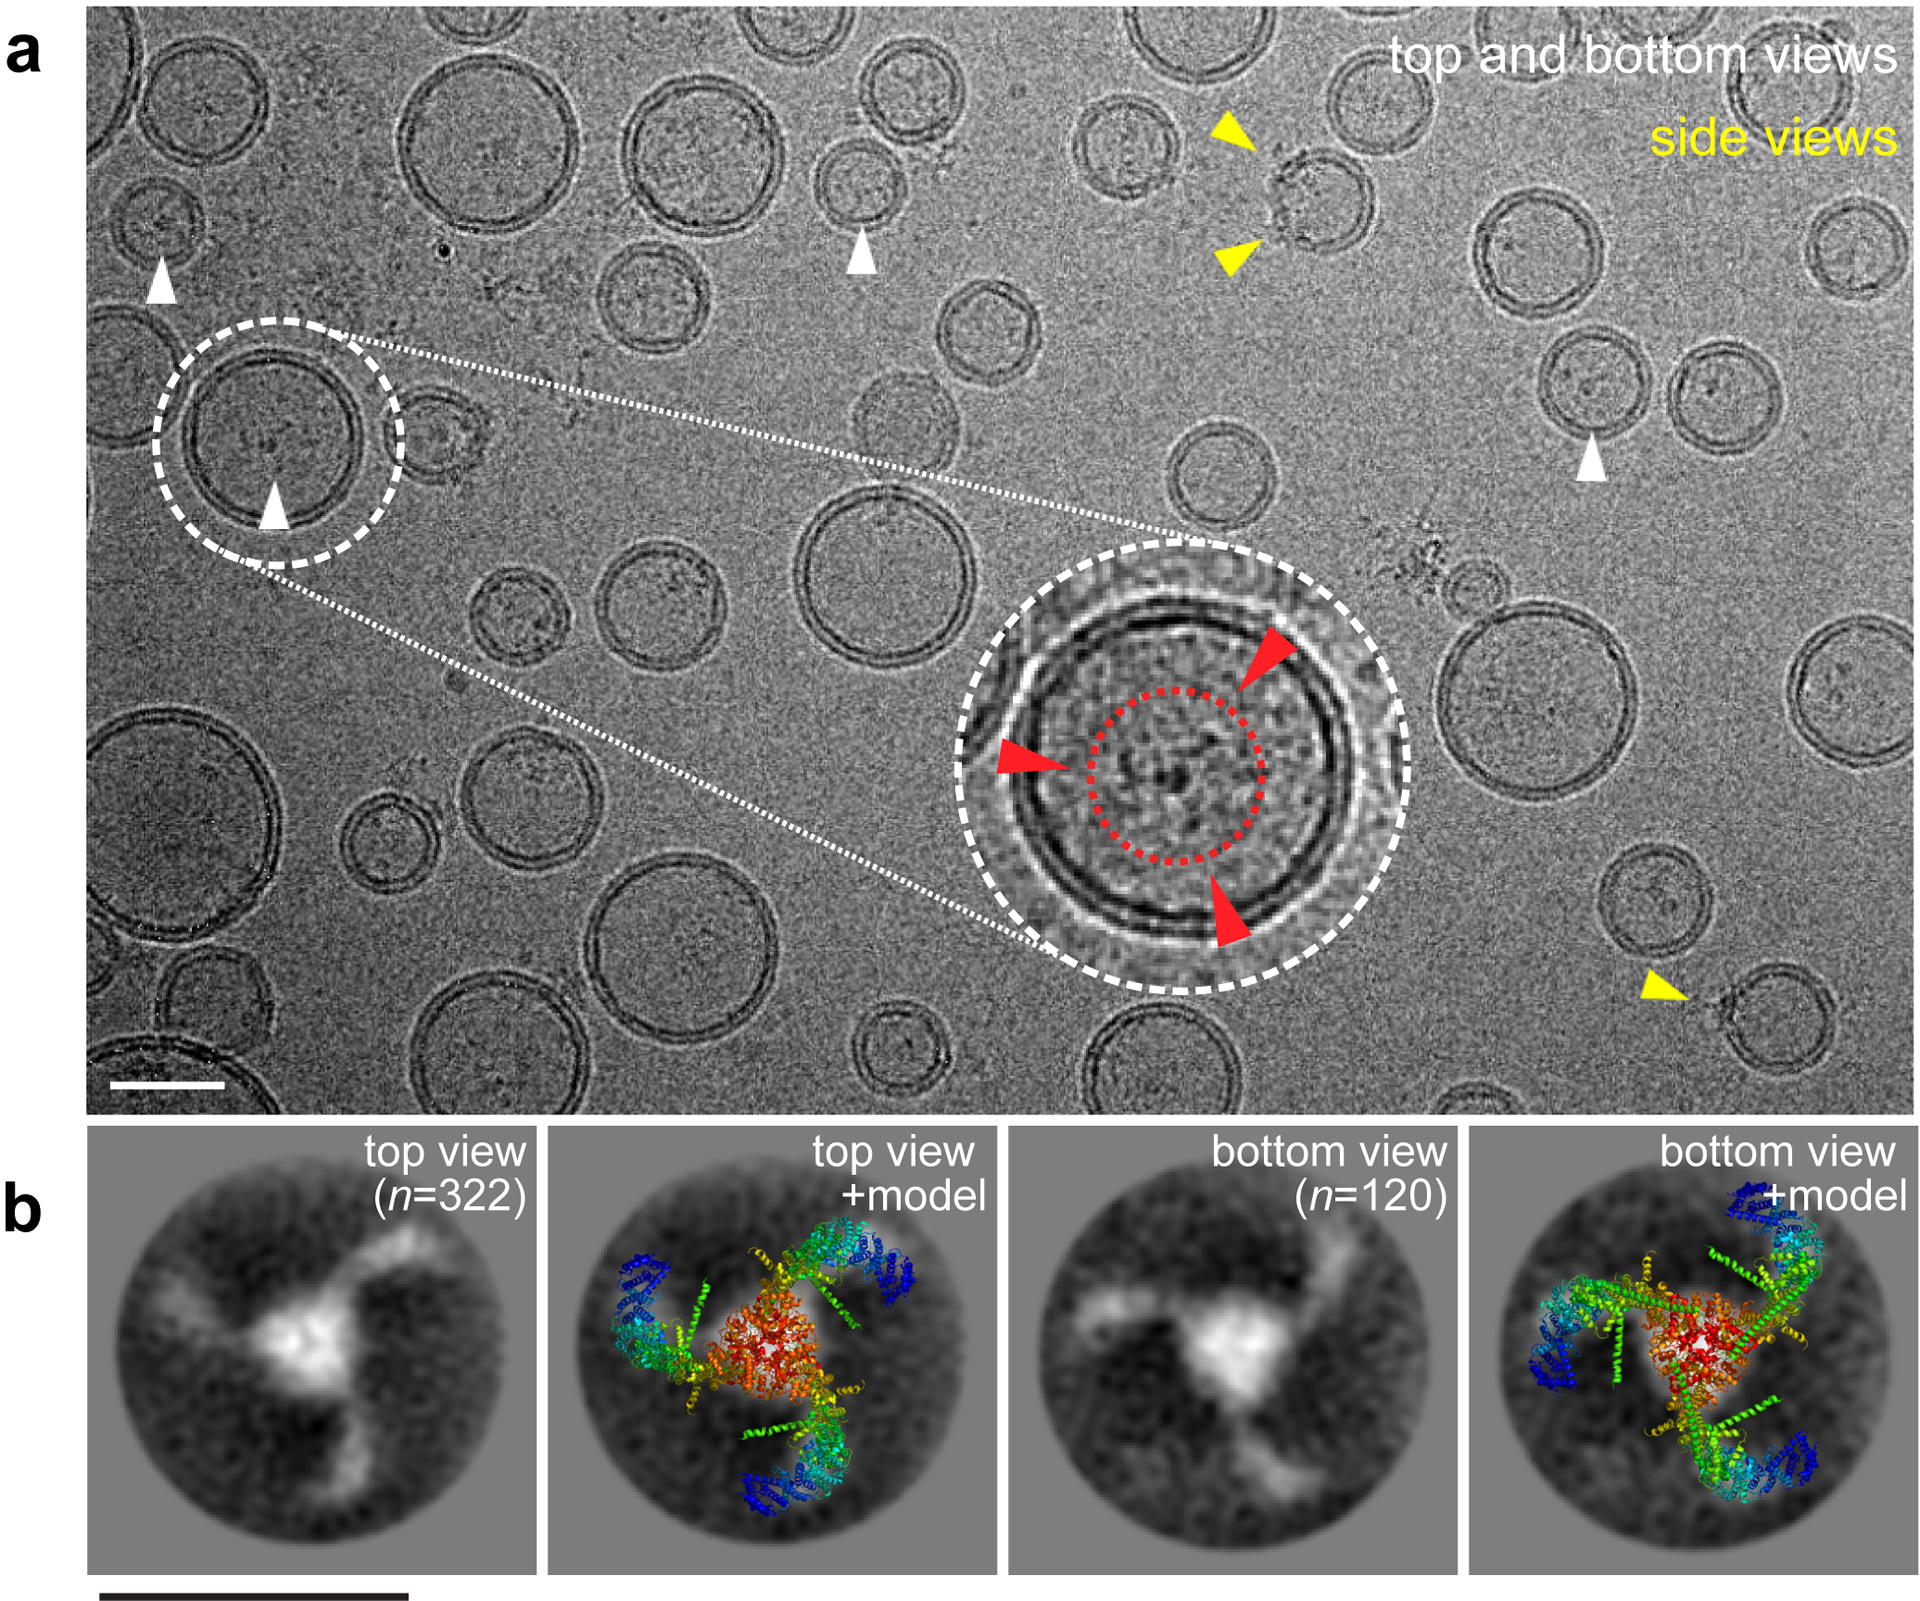
(a) Piezo1 channels reconstituted in POPC/DOPS/CHOL (8:1:1) vesicles (≥1000 images). Top/bottom-view and side-view particles are highlighted by white and yellow arrowheads, respectively. Inset: magnified, filtered and contrast adjusted view containing a top-view Piezo1 channel with left-handed curved arms in projection (red dashed circle and arrowheads). (b) Averages of the top-view (n=322) and bottom-view (n=120) Piezo1 compared to the structural model (PDB 6B3R). The handedness of the three arms in projection permits the determination of Piezo1 orientation. Scale bars: 20 nm.
Viewed from the side, it is evident that Piezo1 distorts vesicles into a teardrop shape, with the channel located at the region of highest curvature (Fig. 2a, yellow arrowheads). Detailed inspection of individual channels shows density for the CED inside the vesicle and the intrinsic curvature of Piezo1 distorting the vesicle away from its spherical shape to a locally more highly curved surface (Fig. 3a). This means that Piezo1 is applying force onto the membrane and, of course, the membrane is applying force onto the channel. To investigate this interaction in further detail, we identified 1166 side views of Piezo1 and binned them into groups according to vesicle size and generated averaged images (Fig. 3b). We then fit circles to a small segment of arclength centered on Piezo1 and centered exactly opposite Piezo1 (Fig. 3c, Extended Data Fig. 2, Methods). We define the radii of these circles as the radius of curvature (Rc) of the inner and outer membrane leaflet projections at Piezo1 and at the vesicle pole opposite Piezo1. We call the average value of Rc for the outer and inner surfaces the mid-membrane Rc. Mid-membrane Rc for Piezo1 is graphed against mid-membrane Rc at the opposite pole (Fig. 3d). The data lead to two conclusions. First, Piezo1 adopts different curvatures as a function of vesicle size. Second, in larger vesicles, Piezo1 remains more highly curved than the membrane at the opposite pole. In other words, Piezo1 curvature persists, implying that Piezo1 likely exhibits some degree of curvature even in a planar membrane (Rc→) in the absence of applied tension.
Fig 3. Piezo1 channels become flatter in large vesicles.
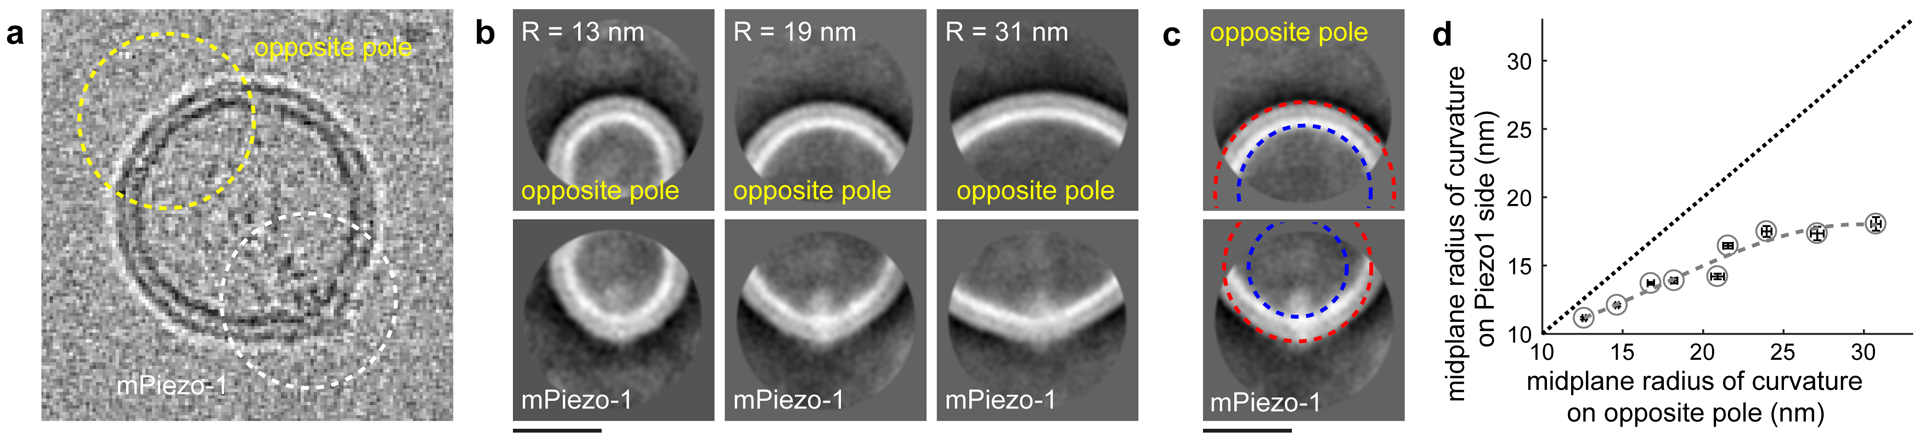
(a) Cryo-EM image of a vesicle with a Piezo1 channel in side-view. Membrane curvatures for the region centered on Piezo1 and on the opposite pole (1166 particles). (b) Comparison of the average membrane densities at the opposite pole (top) and at Piezo1 (bottom). Vesicles with 13 nm (n=19), 19 nm (n=25) and 31 nm (n=19) curvature radius (opposite pole) are shown. (c) Circles defining the radius of curvature for outer (red) and inner (blue) membrane leaflets at the opposite pole (top) and at Piezo1 (bottom). (d) The midplane radius of curvature for Piezo1 is graphed against the midplane radius of curvature at the opposite pole (circles and dashed curve). The straight dotted line shows the relationship for spherical vesicles. Data are mean ±95% confidence intervals of the fitted radii (n ≥ 15).
These experiments show that Piezo1 is capable of undergoing at least some degree of flattening in response to force applied through the membrane. In this case the force originates from the vesicle-imposed curvature of a membrane with some degree of stiffness. In living cells, even larger forces may be expected, mediated through lateral membrane tension16,21–26, attached tethers19,23,27–29, or both. Next, to investigate whether Piezo1 can change its shape in a reversible manner, we studied it using HS-AFM.
HS-AFM of Piezo1 in supported membranes.
HS-AFM imaging is mediated by raster-scanning the sample surface with a nanometric tip at the end of a cantilever oscillating at its resonance frequency (~600 kHz). The topography, i.e. the Z-dimension, is a surface that is contoured by the same oscillation setpoint amplitude (Aset) maintained by the feedback-loop operation. Aset must be smaller than the amplitude of the cantilever swinging freely Afree in solution. The ratio of Aset to Afree defines how much the oscillation is damped through the sample interaction. Thus, at constant Afree, varying Aset provides images at varying force FHS-AFM. Lowering Aset leads to a higher FHS-AFM on each tap (Fig. 4a). The peak force and average force during an oscillation cycle can be determined by the analysis of the force trajectories from experiment37 or by numerical simulation38,39 using the point mass model40 (Extended Data Fig. 3, Methods). In our HS-AFM setup, the average applied force ‹FHS-AFM› to the imaged objects can be approximated by
| (eq 1) |
, where k and Q are the cantilever spring constant and quality factor, respectively. Controlling the ratio Aset/Afree thus allows physical manipulation of Piezo1 while observing its structural changes in response to ‹FHS-AFM›. The use of this approximation to quantify an average force seems justified, because the HS-AFM cantilever oscillates at ~600 kHz and the peak force application, which exceeds ‹FHS-AFM›, is applied during a short period of only ~200 ns (Extended Data Fig. 3), many orders of magnitude faster than the reaction rate of Piezo119. In such conditions, the channel is expected to respond to an average scanning force, whereas the peak force can be considered as the upper bound of the force applied to the channel.
Fig 4. HS-AFM experiments of Piezo1.
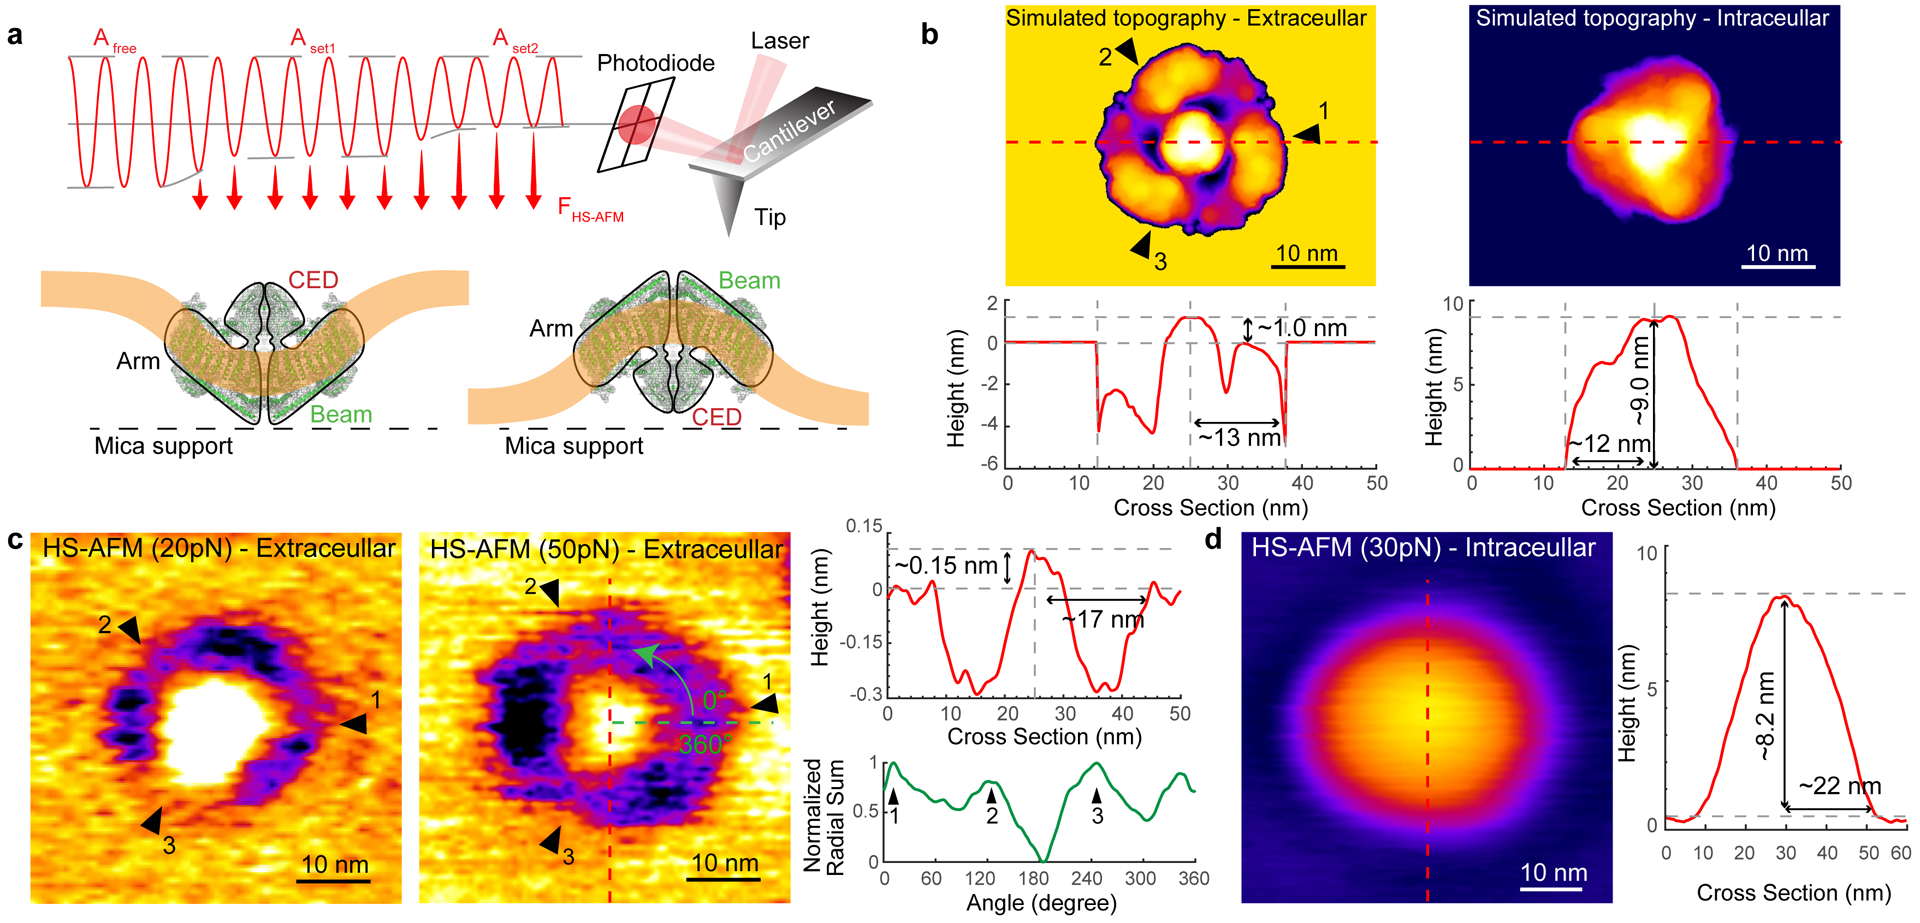
(a) Schematic diagram of force-controlled HS-AFM imaging of membrane-embedded Piezo1: The ratio Aset/Afree defines the average applied force ‹FHS-AFM›. (b) Top: Simulated topographies of Piezo1 in the detergent micelle viewed from the extracellular (left) and the intracellular (right) faces. The membrane was set as a uniform height level extending from the most peripheral resolved TM helices. The three black arrowheads indicate the positions of the three arms. Bottom: Section profiles of the simulated topographies. (c, d) HS-AFM images at specific ‹FHS-AFM› of Piezo1 viewed from the extracellular ((c), ~20 pN and ~50 pN) and intracellular ((d), ~30 pN) faces. Right: Section profiles (red traces) of the topographies. Extracellular face: a central plug surrounded by a bowl with ‘negative height’, i.e. at a level below the surrounding bilayer. The three arms of Piezo1 are observed within the deep ring area when imaged at ~50 pN, as highlighted by the radial profile with ~120° periodicity (green trace). The intracellular face is contoured as a featureless dome. HS-AFM images are representative of 100 particles from ≥5 different samples.
To investigate the morphology of Piezo1 in HS-AFM images, we simulated the topography of Piezo1 using the cryo-EM map of protein in micelle (Extended Data Fig. 1a, bottom, Methods). Given the 2D-confinement of the channels in supported bilayers, we only calculated topographies viewed from both faces of the 3-fold axis, resulting in bowl-shaped with central plug (Fig. 4b, top left, extracellular face) and a dome-shaped (Fig. 4b, top right, intracellular face) topography models of Piezo1. The resulting simulated topographies (Fig. 4b, top) and height section profiles (Fig. 4b, bottom) reveal a ~1 nm and ~9 nm central protrusion from the membrane surface on the extracellular and intracellular faces, respectively. Most notable, the extracellular face should, due to the bowl-shaped, web-like protein-membrane architecture, produce a topography that features a slightly triangular ring of ‘negative height’ between the CED and the periphery of the arms, which is a recognizable feature.
For HS-AFM, we screened numerous lipids and found best conditions when Piezo1 channels were reconstituted into small unilamellar vesicles of POPE/POPG (85:15, w:w). These vesicles opened on the HS-AFM support and formed a continuous supported lipid bilayer with embedded Piezo1 channels. Imaged under both low and high scanning force of ~20 pN or ~50 pN, the extracellular face of Piezo1 was identifiable by its ring of ‘negative height’ surrounding a central, protruding cap, and three membrane-extended arms that reach out into the membrane plane (Fig. 4c, left two panels). The radial profile within the ‘negative height’ area of the extracellular Piezo1 face imaged at ~50 pN highlights the 3-fold symmetry of the channel with the three arms protruding with ~120° periodicity from a presumably suspended bilayer between the arms (Fig. 4c, right, green trace; Supplementary Video 1). The intracellular face of Piezo1 exhibits a featureless dome with ~8.2 nm height above the membrane (Fig. 4d). The dome-like intracellular face was, however, only rarely observed, consistent with vesicles bursting on mica to expose the concave extracellular face of Piezo1 to the AFM tip.
The general features of the experimental topographies (Fig. 4c,d) resemble qualitatively the simulated topographies (Fig. 4b), however, the dimensions of Piezo1 viewed from the extracellular side matched the structure only when imaged at low force, ~20 pN. The ring of ‘negative height’, that we term ‘halo’, expands outwards under increasing force. While HS-AFM tip convolution and uncertainties concerning the precise placement of the membrane level in the simulated topography can well explain differences in protrusion dimension and indentation depth of the CED and the bowl, respectively, the experimental bowl radius of ~17 nm imaged at ~50 pN compared to a radius of ~13 nm of the simulated topography could not be explained by such effects (compare the height profiles in Fig. 4c and Fig. 4b, left). This observation led us to realize that the Piezo1 channel imaged at ~50 pN was more extended and flattened than the zero-force cryo-EM structure (and HS-AFM topographies at low-force). Thus, we next examined these structural changes as a function of applied force.
Force-induced conformational changes
For Piezo1 we designed a force-sweep cycle during HS-AFM imaging through fine-tuning the ratio Aset/Afree (Fig. 5a, blue trace)35. While gradually increasing the imaging force up to ~60 pN by displacing the sample support towards the AFM tip (Fig. 5a, green trace), Piezo1 channels undergo a circular expansion, as evidenced by the enlargement of the ‘area of negative height’ (Fig. 5a, top; Supplementary Video 2). Upon lowering the force again to ~25 pN, Piezo1 channels return to their initial, less expanded conformation (Fig. 5a, top right).
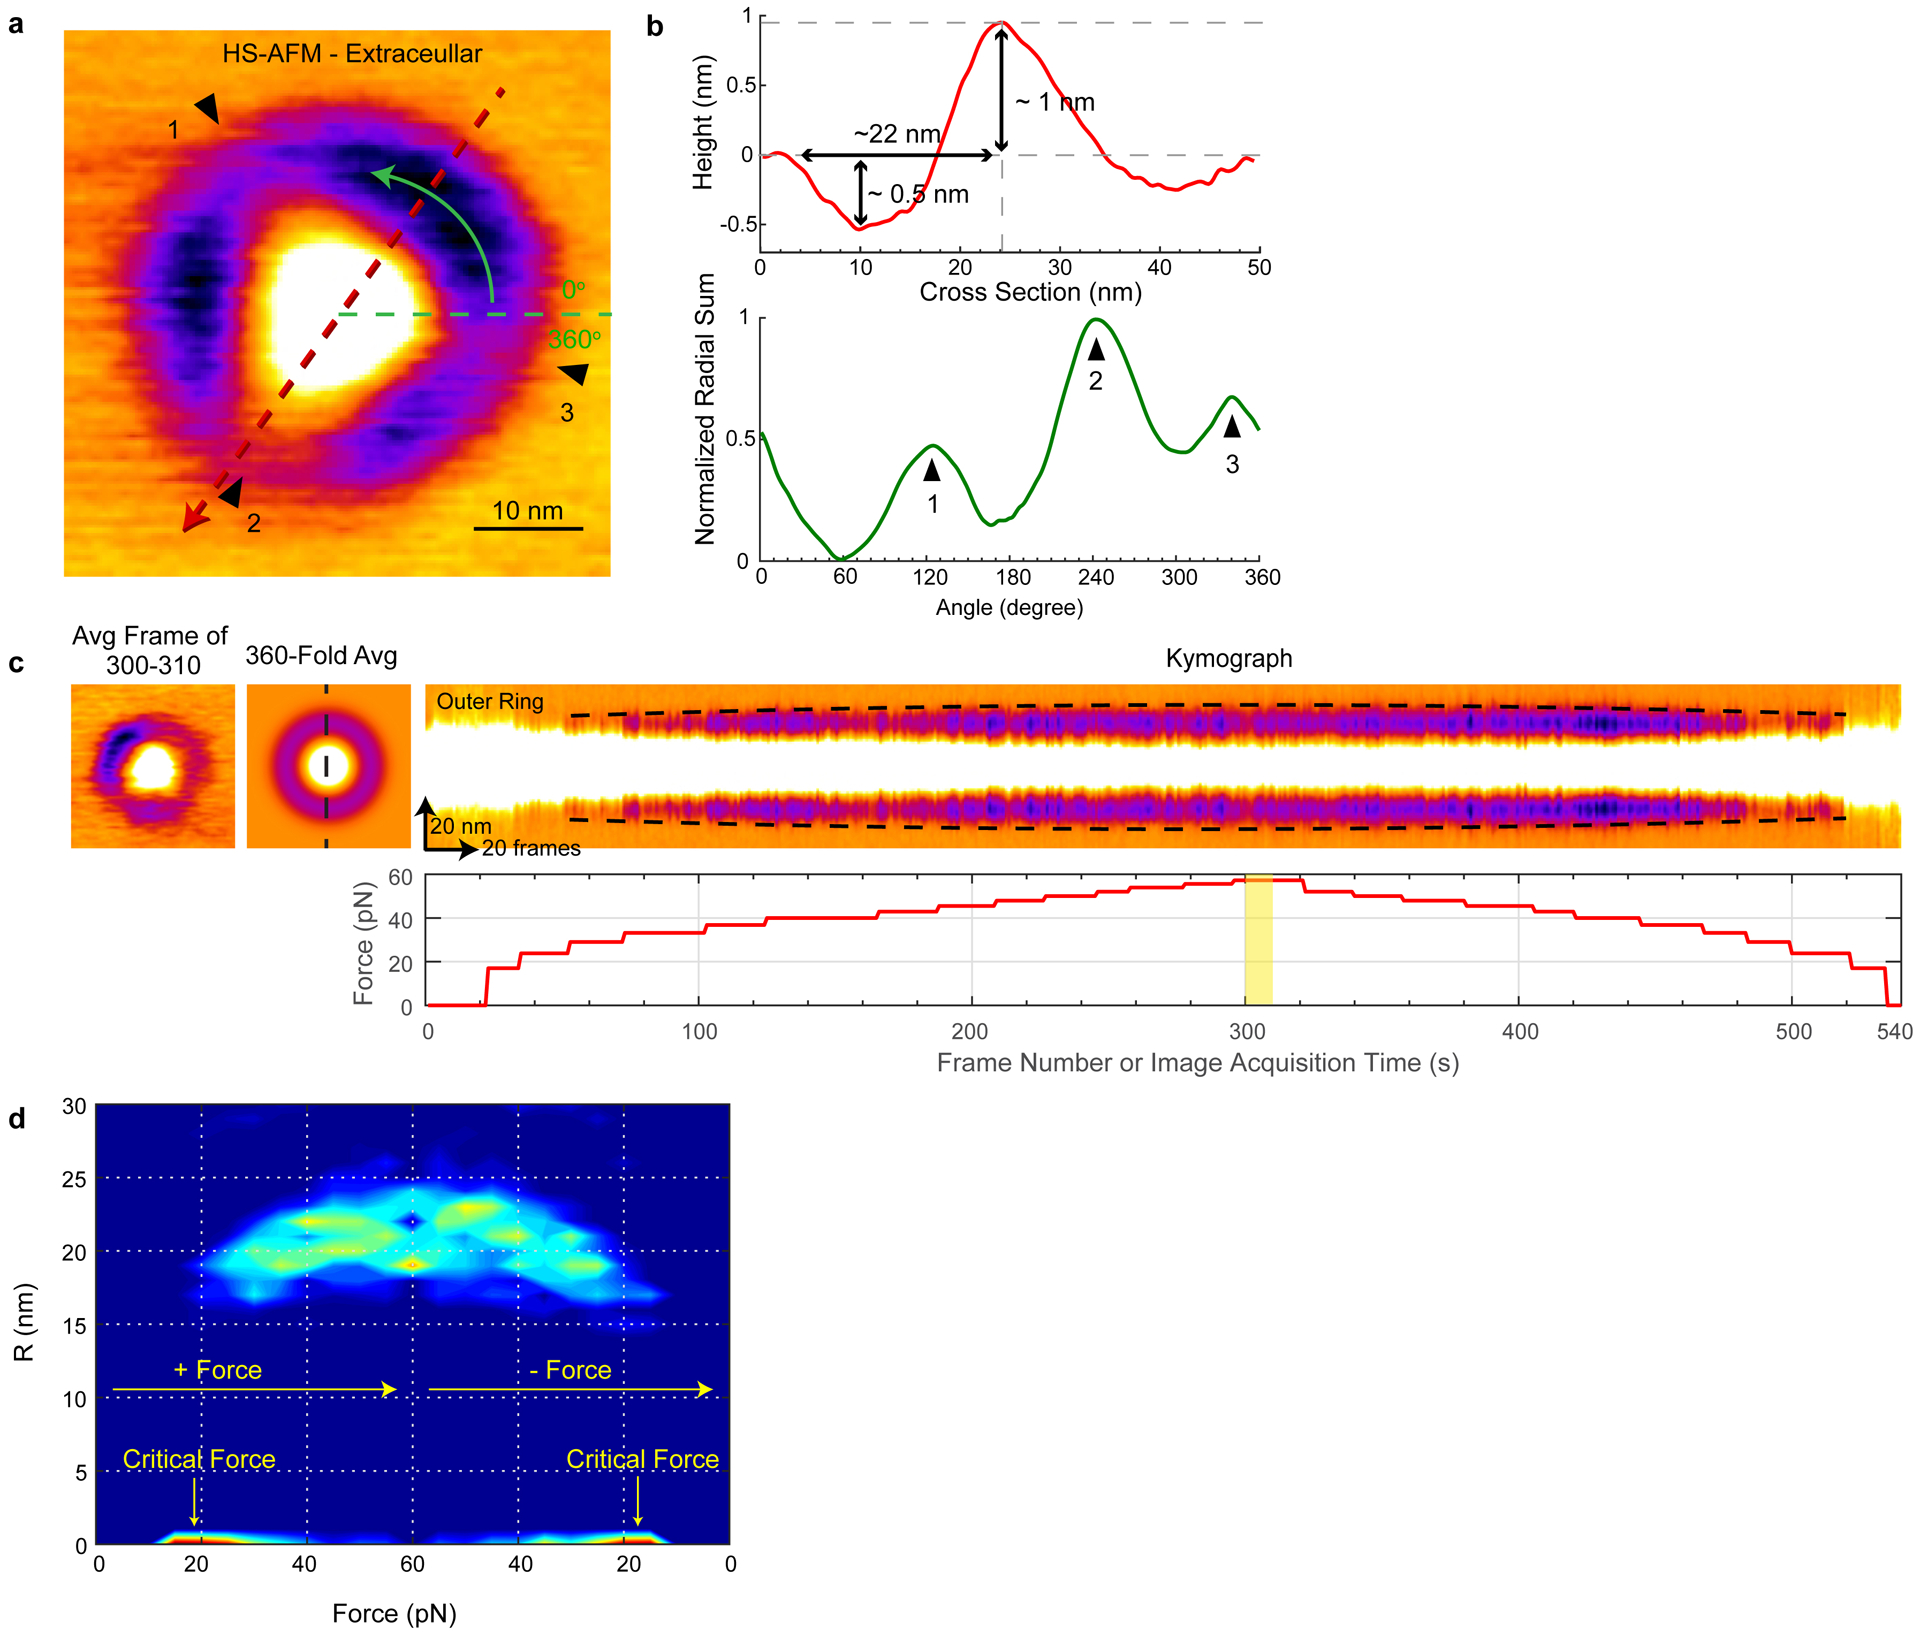
Fig 5. Mechanical response of Piezo1 to applied force.
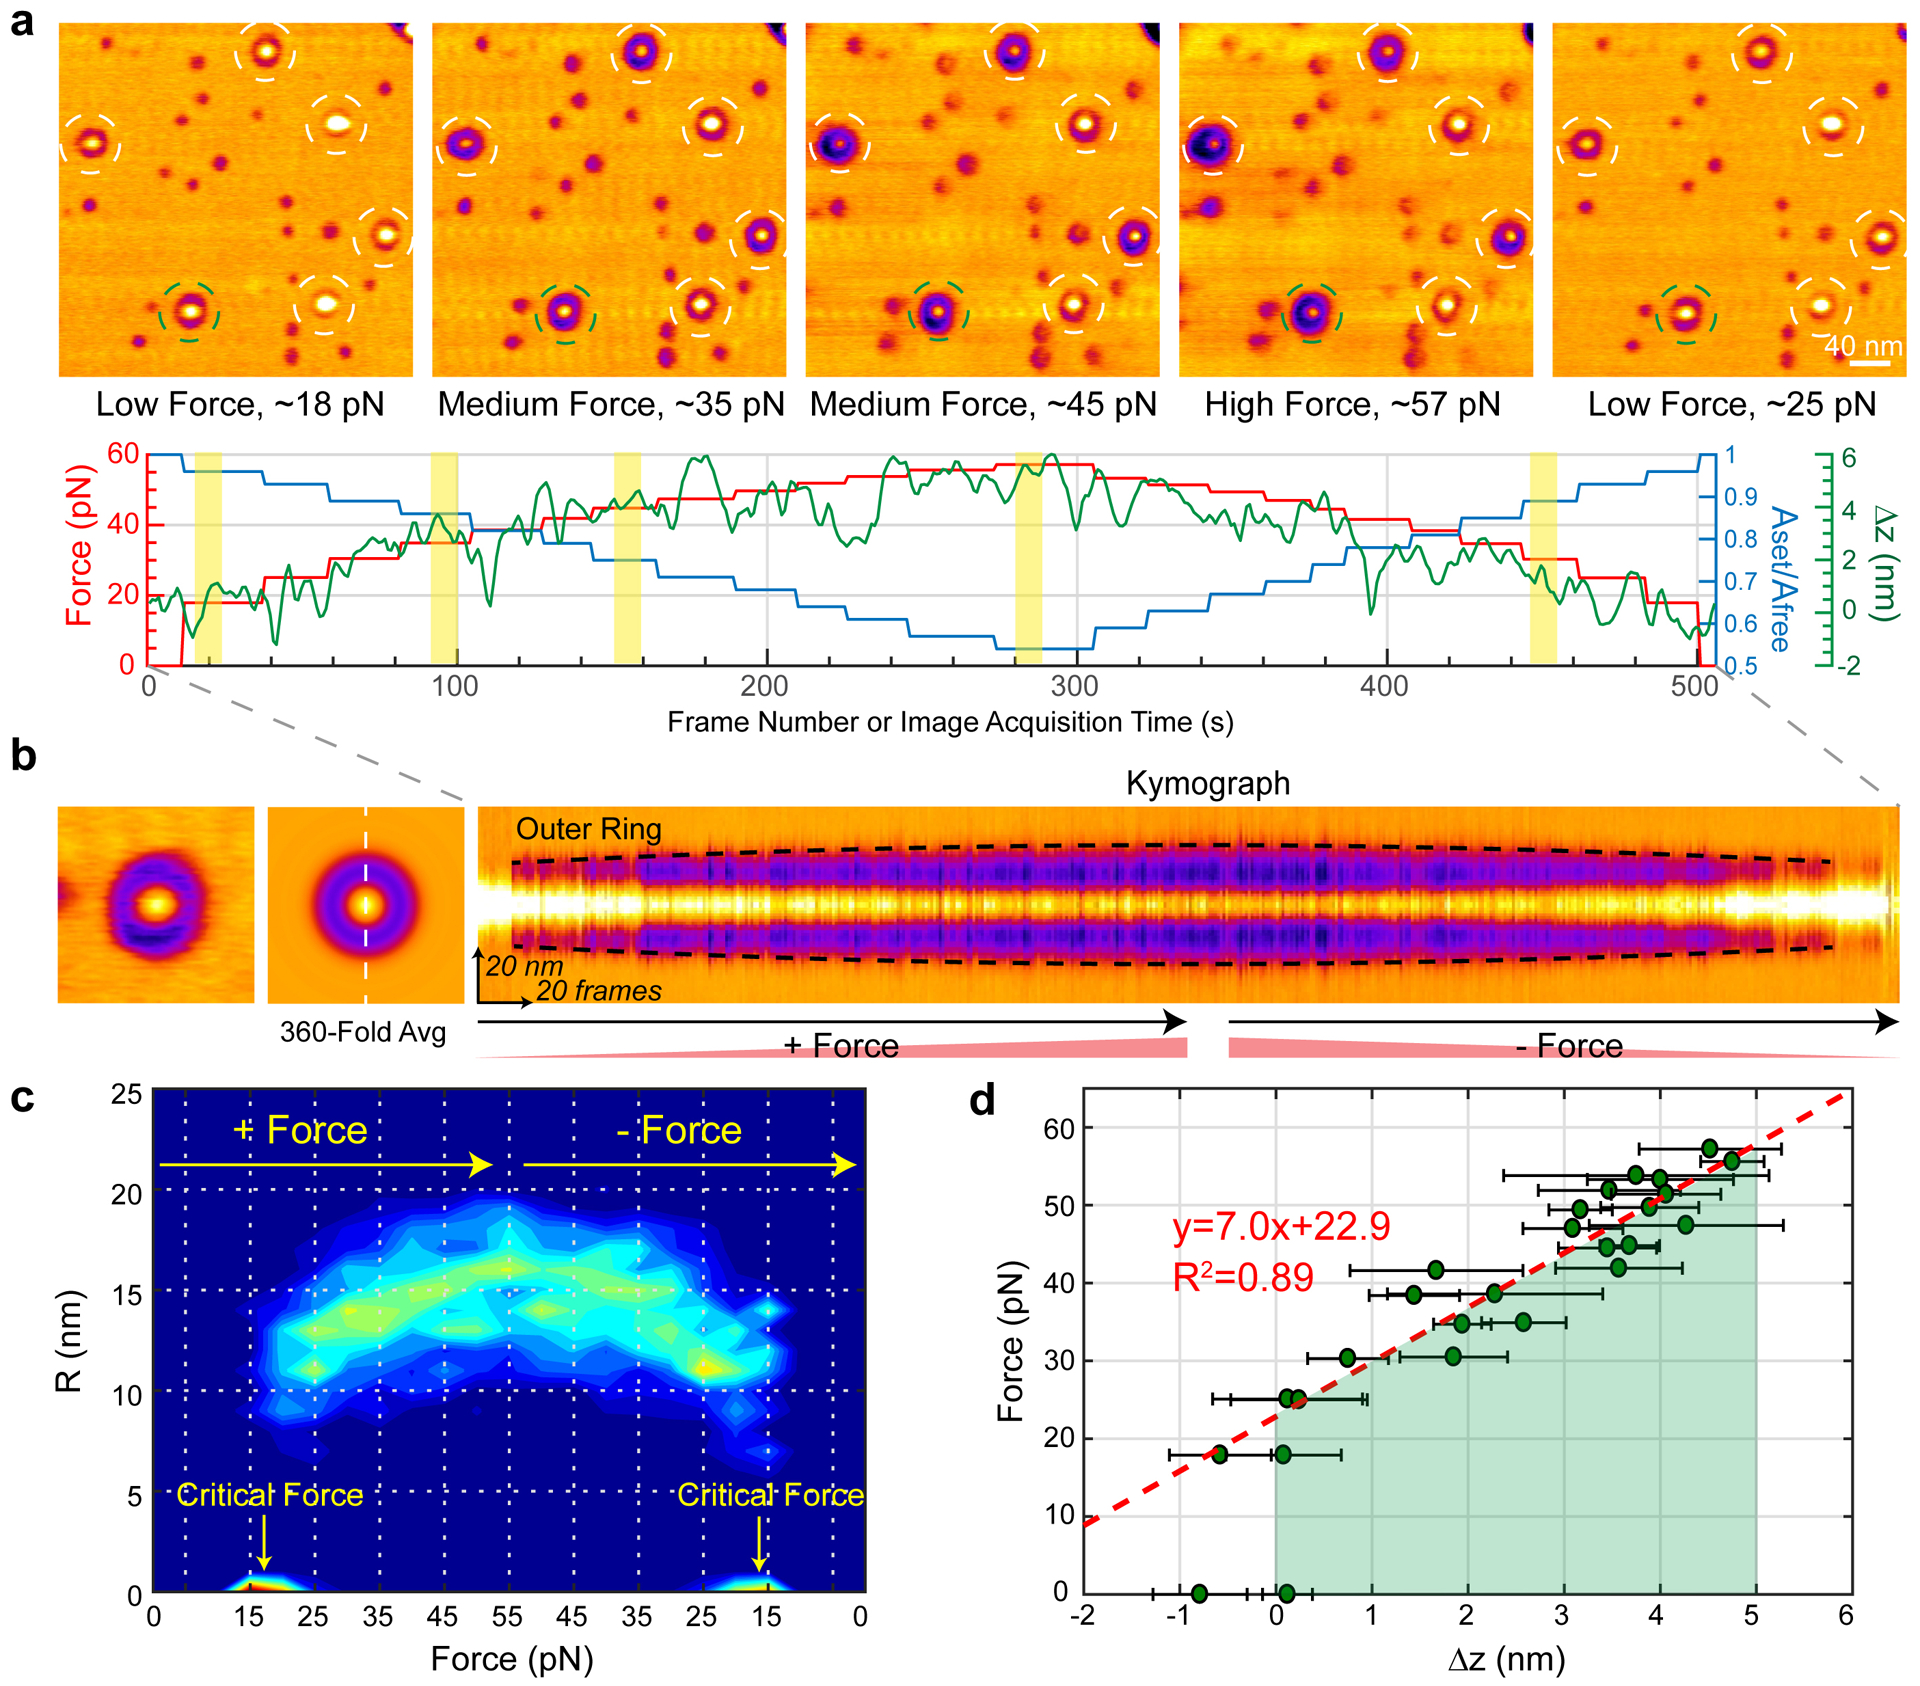
(a) Top: HS-AFM images from a force-sweep movie of Piezo1 in a POPE/POPG = 85:15 (w/w) bilayer. Each image is an average over 10 frames acquired at a specific loading force. Bottom: Force (red), Aset/Afree ratio (blue) and Z-piezo displacement (green) as function of frame acquisition time. The 5 yellow colored areas correspond to the image acquisition periods of the frames shown above. Afree~1.5 nm. Representative of ≥11 independent experiments from ≥5 different Piezo1 samples. (b) Example of lateral expansion analysis of a single Piezo1 particle. Each single molecule (left) is 360-fold symmetry averaged (middle) and a kymograph (right) across the center of Piezo1 calculated (white dashed line). The kymograph highlights the outer radius (halo) expansion (black dashed line) as a function of force. Kymograph is representative of ≥100 particles. (c) Normalized probability density map of outer ring radius (R) as a function of force. 100 Piezo1 particles from 11 movies acquired on ≥5 different samples, days and HS-AFM tips. The symmetric distribution of R shows the structural reversibility upon force increase and decrease. A critical force Fc~18 pN is required during HS-AFM operation. (d) Applied force as a function of the sample displacement towards the AFM tip. The linear regression (red dashed line), performed by disregarding the zero-force and negative Δz data points, provides the stiffness constant K~7.0 pN/nm for stressing a spring-like piezo1 based on our proposed dome-flattening model. The green-colored area indicates the work exerted by the HS-AFM measurement for dome-flattening of Piezo1. Data are mean ± s.d. with n≥10.
We extracted individual Piezo1 channels from the HS-AFM movies, performed 360-fold symmetry averaging of each frame to eliminate scan-direction dependent effects, and calculated kymographs to observe the force-dependent structural changes (Fig. 5b). The contour of the halo (highlighted by the black dashed lines in the kymograph), demonstrates the reversible expansion of the Piezo1 channel as a function of image acquisition time and applied force (Supplementary Video 3). We calculated a normalized probability density map which shows that reversible ring expansion under an applied force is a general and reproducible property of the channels, with a maximum ring radius of ~17±2 nm at ~55 pN (Fig. 5c). A minority of channels, not included in this analysis, segregated into a second somewhat larger subgroup (Extended Data Fig. 4). While these channels had a radius about 6 nm larger, their physical response to force was indistinguishable to the majority of molecules (Extended Data Fig. 5).
The HS-AFM experiments show that when a compressive mechanical force is exerted parallel to the pore axis, Piezo1 undergoes a circular expansion in a direction radial to the pore axis (Fig. 5c). Qualitatively, this conformational change in Piezo1 is consistent with the change in mid-plane radius of curvature in the cryo-EM vesicle imaging experiments (Fig. 3d). In HS-AFM, because we approximate the force applied (equation 1, Extended Data Fig. 3) as a function of the sample displacement towards the HS-AFM tip (Fig. 5d), we can estimate the mechanical properties of the channel. In the analysis that follows, we approximate the structure of Piezo1 as a dome or spherical cap to represent the 3 curved arms extending from the central pore, with a web of membrane in between the arms16. For a spherical cap, with fixed area A and bending modulus k, the energy to bring about a deformation of the cap away from its intrinsic (zero-force) radius of curvature r0 to a new radius of curvature r can be expressed as16,36:
| (eq 2) |
From the geometric relationship for a spherical cap A = 2πrz,41 where z is the height of the cap above the membrane plane, we can express equation 2 as a function of z:
| (eq 3) |
where z0 is the height of the cap in the absence of force (i.e. the value of z corresponding to radius of curvature r0). During HS-AFM imaging the force is applied in the z direction, therefore, we can express the force as:
| (eq 4) |
where is the stiffness constant in Hooke’s law. Equating Fz(z) with ‹FHS−AFM› and Δz with the drift-corrected displacement of the sample (see Methods), force-displacement data for the HS-AFM movie corresponding to images in Fig. 5a are shown with a line fit corresponding to equation 4 (Fig. 5d). Two quantities are extractable from this analysis. First, the area subtended by the data is the work to bring about the conformational change from curved to flat (Fig. 5d, green-shaded area), which would be ~200 pN nm, or ~50 kBT, if we use eq. 1 to estimate the force. Second, the slope of the line reports the stiffness constant K of the protein, ~7.0 pN/nm, or ~1.8 kBT/nm2. The stiffness constant is proportional to the ratio , bending modulus to surface area. With this relation in mind, it is notable that the Piezo1 architecture is an outlier when compared to other membrane proteins, with a uniquely large area reflecting a very low helical density in the membrane of ~0.2 helix/nm2 (Extended Data Fig. 6).
The low-force projection radius (11 nm) and height (5 nm) predict a surface area for the Piezo1 dome of π(112 + 52) ≅ 460 nm2. But the fully flattened projection radius under high force, ~17 nm, predicts a Piezo1 surface area of π(172) ≅ 900 nm2. This discrepancy has two potential origins that we can think of. First, the cryo-EM structures do not resolve the first 12 TM helices, presumably because they are disordered. It is possible that they become ordered under applied force, in which case, as Piezo1 flattens out it might encompass a larger area than would be predicted on the basis of the cryo-EM structures. Further work will be needed to test this hypothesis. Second, the halo that surrounds Piezo1 extends into the lipid membrane beyond the observed limits of the protein42. Again, further work will be needed to better understand the origins of the halo. These uncertainties notwithstanding, it is clear that Piezo1 is compressible to a flatter structure under force and the compressibility is completely reversible.
Discussion
The specific changes we observe in Piezo1 are reversible and perfectly suited to render the channel sensitive to lateral membrane tension. This is because flattening produces in-plane area expansion; and the difference in the in-plane area exhibited by two states of a protein is precisely a quantity that converts lateral membrane tension into a free energy difference. For the free energy difference between a flat and curved Piezo1 channel embedded in a membrane with lateral membrane tension γ, we have
| (eq 5) |
Where ΔG(γ = 0) is the free energy difference between the flat and curved conformations in the absence of lateral tension and ΔA is the in-plane (projected) area difference between the conformations16. ΔG equals 0 when γΔA offsets ΔG(γ = 0). That is, the flat and curved conformations will be equally probable (i.e. in balanced equilibrium) when the following relationship holds:
| (eq 6) |
Using eq.1 to estimate force, the HS-AFM experiments indicate that it takes about 50 kBT to flatten Piezo1. Equating this energy to ΔG(γ = 0) and ΔA to 80 nm2 (dome area, ~460 nm2, minus the projected area under low force, π (11)2 ≅ 380 nm2), equation 6 implies that Piezo1 will be in balanced equilibrium at γ ≅ 0.6 kBT/nm2. If the flattened conformation is associated with an open pore, then the channel will have an open probability 0.5 at this membrane tension. This tension value is not far from half activation tensions reported in the literature, between 0.35 kBT/nm2 (21) and 1.2 kBT/nm2 (22). The average applied force calculated using eq. 1 and the derived energy (Fig. 5d) are likely lower limit estimates. If instead of the average force we use the peak force estimated from the point-mass model (Extended Data Fig. 2, Methods), we would conclude that the stiffness constant K of the protein would be ~32.5 pN/nm (~7.9 kBT/nm2), the work to bring about the conformational change from curved to flat would be ~625 pN nm (~150 kBT), and the tension associated with half activation would be γ ≅ 1.9 kBT/nm2. There is uncertainty in the precise quantification of the force magnitude in HS-AFM. And for a number of reasons, including lipid compositional differences and possible lipid membrane-mica surface interactions, we do not expect the supported bilayer to be a perfect replica of a cell membrane. Nevertheless, the calculated range of tension sensitivity determined by HS-AFM in this study is consistent with values measured in electrophysiology experiments21,22.
We conclude that Piezo1 can undergo a reversible, flattening deformation when force is applied. The HS-AFM experiments apply force normal to the membrane surface. If tethers can attach to the channel in a cellular setting then similarly directed forces could gate Piezo1. If lateral membrane tension is the primary gating stimulus, then equations 5 and 6 present a way to think about the energetic equivalence to a normal force, such as that applied by the HS-AFM tip.
Methods:
Proteoliposome reconstitution
Full-length mouse Piezo1 protein (mPiezo1) was expressed in HEK293S GnTI- cells and purified in C12E10 as previously described16. For cryo-electron microscopy, lipid mixture of 1-palmitoyl-2- oleoyl-sn-glycero-3-phosphocholine (POPC), 1,2-dioleoyl-sn-glycero-3-phospho-L-serine (DOPS) (Avanti Polar Lipids, Alabaster, AL) and cholesterol at a 8:1:1 (w:w:w) ratio was used for proteoliposome reconstitution. For AFM measurement, the lipid composition was 1-palmitoyl-2-oleoyl-snglycero-3-phosphoethanolamine (POPE) and 1-palmitoyl-2-oleoyl-sn-glycero-3-phospho-(1’-rac-glycerol) (POPG) (Avanti Polar Lipids) at a 85:15 (w:w) ratio. Lipids were prepared with 1.3% C12E10 as previously described16. Purified protein was incubated with the lipid/detergent mixture at a protein-to-lipid ratio of 1:20 (w:w) for 2 hours at 4°C. SM-2 bio-beads (Bio-rad, Hercules, CA) were then added to the mixture for incubation overnight to remove C12E10.
Electron microscopy sample preparation and imaging
Freshly reconstituted mPiezo1 in POPC:DOPS:cholesterol was supplemented with 3 mM fluorinated Fos-Choline-8 (FFC-8) and frozen on glow-discharged Quantifoil 400 mesh gold R1.2/1.3 holey carbon grids as previously described16. Micrographs were recorded on a Talos Arctica transmission electron microscope (FEI) operating at 200 keV equipped with a K2 Summit direct electron detector (Gatan) controlled by SerialEM43. Super-resolution mode was used with nominal defocus range of 0.8 to 2.4 μm and a calibrated physical pixel size of 1.9 Å. The exposure time for each image was 10 s fractionated over 50 frames, with a dose rate of 15 electrons per physical pixel per second. A total of 1373 images were combined from two data collection sessions.
Electron microscopy image processing
MotionCor2 was used for whole-frame motion correction with gain reference applied and dose weighting44. CTFFIND4 was used to estimate the contrast transfer function parameters for the summed images45. Using RELION46,47, 477 particles of top/bottom views were manually picked and extracted with a box size of 200 pixels. 2D classification in RELION generated the averaged images of top views (322 particles) and bottom views (120 particles) of mPiezo1 with a mask size of 250 Å to minimize the interference from the peripheral membrane density.
1166 particles of side views were manually picked and grouped based on the radii of their residing vesicles with a bin width of 1 nm (except for the 13 nm and 31 nm groups with the bin width of 3 nm). 2D averaging was performed in RELION on 19 particles from the 13 nm, 27 nm and 31 nm groups, and 25 particles from 15 nm, 17 nm, 19 nm, 21 nm, 23 nm and 25 nm groups. The box size was 320 pixels and the mask size was 400 Å. 2D averaging was also performed on the exact opposite side to the channels of the same vesicles following the same procedure. Control vesicles with no channels were also binned with the width of 1 nm. 2D averages were performed on 21 to 25 particles from each group (except for the 13 nm group containing only 12 particles).
MATLAB R2018a (The MathWorks, Inc., Natick, MA) was used to measure the radii of curvature on all 2D averaged images of vesicles with embedded Piezo1 (Extended Data Fig. 2a), which share the same vesicle size, was first extracted by edge detection (Extended Data Fig. 2b). Using a polygon to select the Piezo1 position (Extended Data Fig. 2c), the inner and outer membrane boundaries on the Piezo1 side were identified as segmented lines (Extended Data Fig. 2d), i.e. the cyan-green and green-yellow-blue contours represent the inner and outer membrane boundaries, respectively. The X and Y coordinates of the edges corresponding to the outer and inner boundaries of the vesicle membrane were fitted as concentric circles using Nonlinear least-squares solver (Extended Data Fig. 1e and 1f). 95% confidence intervals of the fitted radii were calculated based on the Jacobian of the fitted values with respect to the coefficients. The circle fits to the data on both boundaries gives the local radius of curvature on the Piezo1 side that is tangent to the center of the Piezo1 channel (Extended Data Fig. 1g and 1h). For midplane radii, the error bars were calculated as the geometric mean of the error bars of inner and outer radii.
High-speed atomic force microscopy.
All HS-AFM movies in this study were taken by amplitude modulation mode HS-AFM (RIBM, Tsukuba, Japan) using optimized scanning and feedback parameters. Short cantilevers (NanoWorld, Neuchatel, Switzerland) with spring constant of 0.15 N/m, resonance frequency of ~600 kHz and a quality factor of ~1.5 in buffer, were used. A total of 2 μL of the mPiezo1 reconstituted vesicles (POPE/POPG 85:15, (w:w)) were deposited on a 1.5 mm diameter freshly cleaved mica, gently rinsed with imaging buffer (Tris-buffered saline 20 mM, pH 8.0, 150 mM NaCl) after 5 minutes of incubation, and then mounted in the HS-AFM fluid cell. Both, the setpoint amplitude Aset and the free amplitude Afree (~1.5 nm) of the cantilever oscillation were simultaneously recorded during HS-AFM force-sweep measurements35. The displacement of the sample (Δz) is linearly drift-corrected by the positions of Z-piezo attenuator (and also corrected for the cantilever oscillation amplitude reduction) before and after force-sweep experiment. The HS-AFM movies were drift corrected and contrast adjusted by a laboratory build image analysis software in ImageJ. The 360-fold average and the dimensional changes of mPiezo1 particles were performed by self-written routines in ImageJ. The cross-correlation analysis of mPiezo1 channels was performed using self-written routines in MATLAB R2018a.
Estimations of FHS-AFM during force-sweep measurements.
In the main text, we used equation 1 to estimate the average force applied by the HS-AFM tip <FHS-AFM>. To evaluate the validity of this approach, we undertook a thorough analysis of the tip and the sample interact during HS-AFM operation. We monitored the real tip motion z(t) to reconstruct force trajectories of FHS-AFM applied when imaging objects in amplitude-modulated AFM. In amplitude-modulated AFM, the motion of the microcantilever–tip system can be described using the point-mass model40:
| (eq 7) |
Where m is the effective cantilever mass, z(t) is absolute tip motion, k is the cantilever stiffness, Fdr is the drive force, Fts is the tip-sample interaction force that depends on the instantaneous gap (d) between the tip and the sample, ω0 and Q are the angular resonant frequency and quality factor, respectively. Equation 7 describes the total force that governs the tip motion includes the elastic response of the cantilever (the 1st term), the hydrodynamic damping with the medium (the 2nd term), the periodic driving force (the 3rd term) and the tip-sample interaction force (the 4th term). Rearranging equation 7, we can obtain equation 8 that illustrates the sum of the driving force and tip-sample interaction force can be estimated by a detailed analysis of the tip motion (Extended Data Fig. 3a and 3b).
| (eq 8) |
Thus, our force reconstruction steps include (1) Calculate the forces caused by the elastic response of the cantilever and the hydrodynamic damping with the medium, and total force that governs the tip motion (Extended Data Fig. 3c and 3d). (2) Sum up the above three forces that equals to Fdr(t) + Fts(d) (Extended Data Fig. 3e and 3f). (3) In the out-of-contact condition (Aratio=Aset/Afree=1), Fts is 0 (we do not detect attractive forces in our HS-AFM tip oscillations), and thus only Fdr(t) remains when the tip oscillates freely (Extended Data Fig. 2e and 2f, dashed line). (4) Fdr(t) is always constant while Aratio is changed to apply different forces. Therefore, the Fts (Extended Data Fig. 3g and 3h) can be derived by calculating the difference between Fdr(t) + Fts(d) (Aratio<1) and Fdr(t) (Aratio=1). These reconstructed force trajectories (Extended Data Fig. 3g and 3h) of Fts per oscillation period is equivalent to the FHS-AFM applied to the imaging objects.
To experimentally determine Fts, we measured the cantilever deflections during oscillation cycles at different Aratio (Aset/Afree, amplitude set point ratio) on mica (Extended Data Fig. 3a) and membrane (Extended Data Fig. 3b), respectively (traces from black to grey with decreasing Aratio). The reduction of the tip oscillation amplitude is caused by the tip-sample repulsive forces when the tip physically contacts the sample. Following the force reconstruction steps described above, we constructed the trajectories of Fts at different Aratio on mica (Extended Data Fig. 3g) and membrane (Extended Data Fig. 3h), respectively. The peak force occurs always during the first part of the Fts force reconstruction trajectory caused by tip initial tip-sample clash.
Two characteristic forces, the peak force of Fts (Extended Data Fig. 3i) and the average force per cycle (Extended Data Fig. 3j, <Fts>) at different Aratio, were extracted, respectively. The peak force applied by the tip to the stiff mica and the soft membrane are very similar, only when Aratio<0.65, then the peak-force grows significantly higher on mica (compare blue and red dashed lines in Extended Data Fig. 3i). We compared these experimental measurements of the peak forces with a web-based AFM simulation tool, VEDA (https://nanohub.org/resources/veda)38, to estimate the peak force on samples with different stiffness. This simulation tool solves the point mass model differential equation numerically and applies different contact models. We used the Hertz contact model and similar parameters as in our experiments. The resulting peak force values (Extended Data Fig.3i, black and gray dashed lines, and grey shadowed area) compare very well with our data measured on membrane.
The average force applied per cycle <Fts> increases more linearly with decreasing Aratio on mica (Extended Data Fig. 3j, blue dashed line), while the dependence of <Fts> with Aratio on the membrane increases in a somewhat fluctuating manner and seems to reach a plateau in the low Aratio<0.7 region (Extended Data Fig. 3h, red dashed line). Finally, the <Fts> calculated by equation 1 (Extended Data Fig. 3j, black dashed line) shows a similar trend and estimates <Fts> of the same order as the <Fts> measurement on membrane. Thus, the use of equation 1 to estimate the <Fts> is a valid approach in our HS-AFM setup.
We further evaluated the influence of Afree on the peak force during HS-AFM imaging on membrane (Extended Data Fig. 3k). The higher Afree produces the larger peak force at the same Aratio. In the condition of the HS-AFM force-sweep measurements (Afree = 1.5 nm), the peak force reaches ~200 pN at Aratio = 0.5, which is roughly 3 times higher than the average force <Fts> calculated by equation 1 (~65 pN).
Generation of topographies from PDB files.
A plugin was written for IgorPro7 (WaveMetrics, Lake Oswego, OR) in which a cone-shaped tip with a hard-sphere of user-defined radius r is scanned point-by-point (x,y) over the surface of a PDB structure. The sphere is lowered to the lowest position (z) it can occupy without clashing into any of the atoms of the PDB file. No mechanical properties of tip or protein nor protein hydration layers are considered. The algorithm simply generates sphere-convoluted surface representations of PDB files at zero-force.
Extended Data
Extended Data Fig. 1. Architecture and topology of mechano-sensitive channel Piezo1.
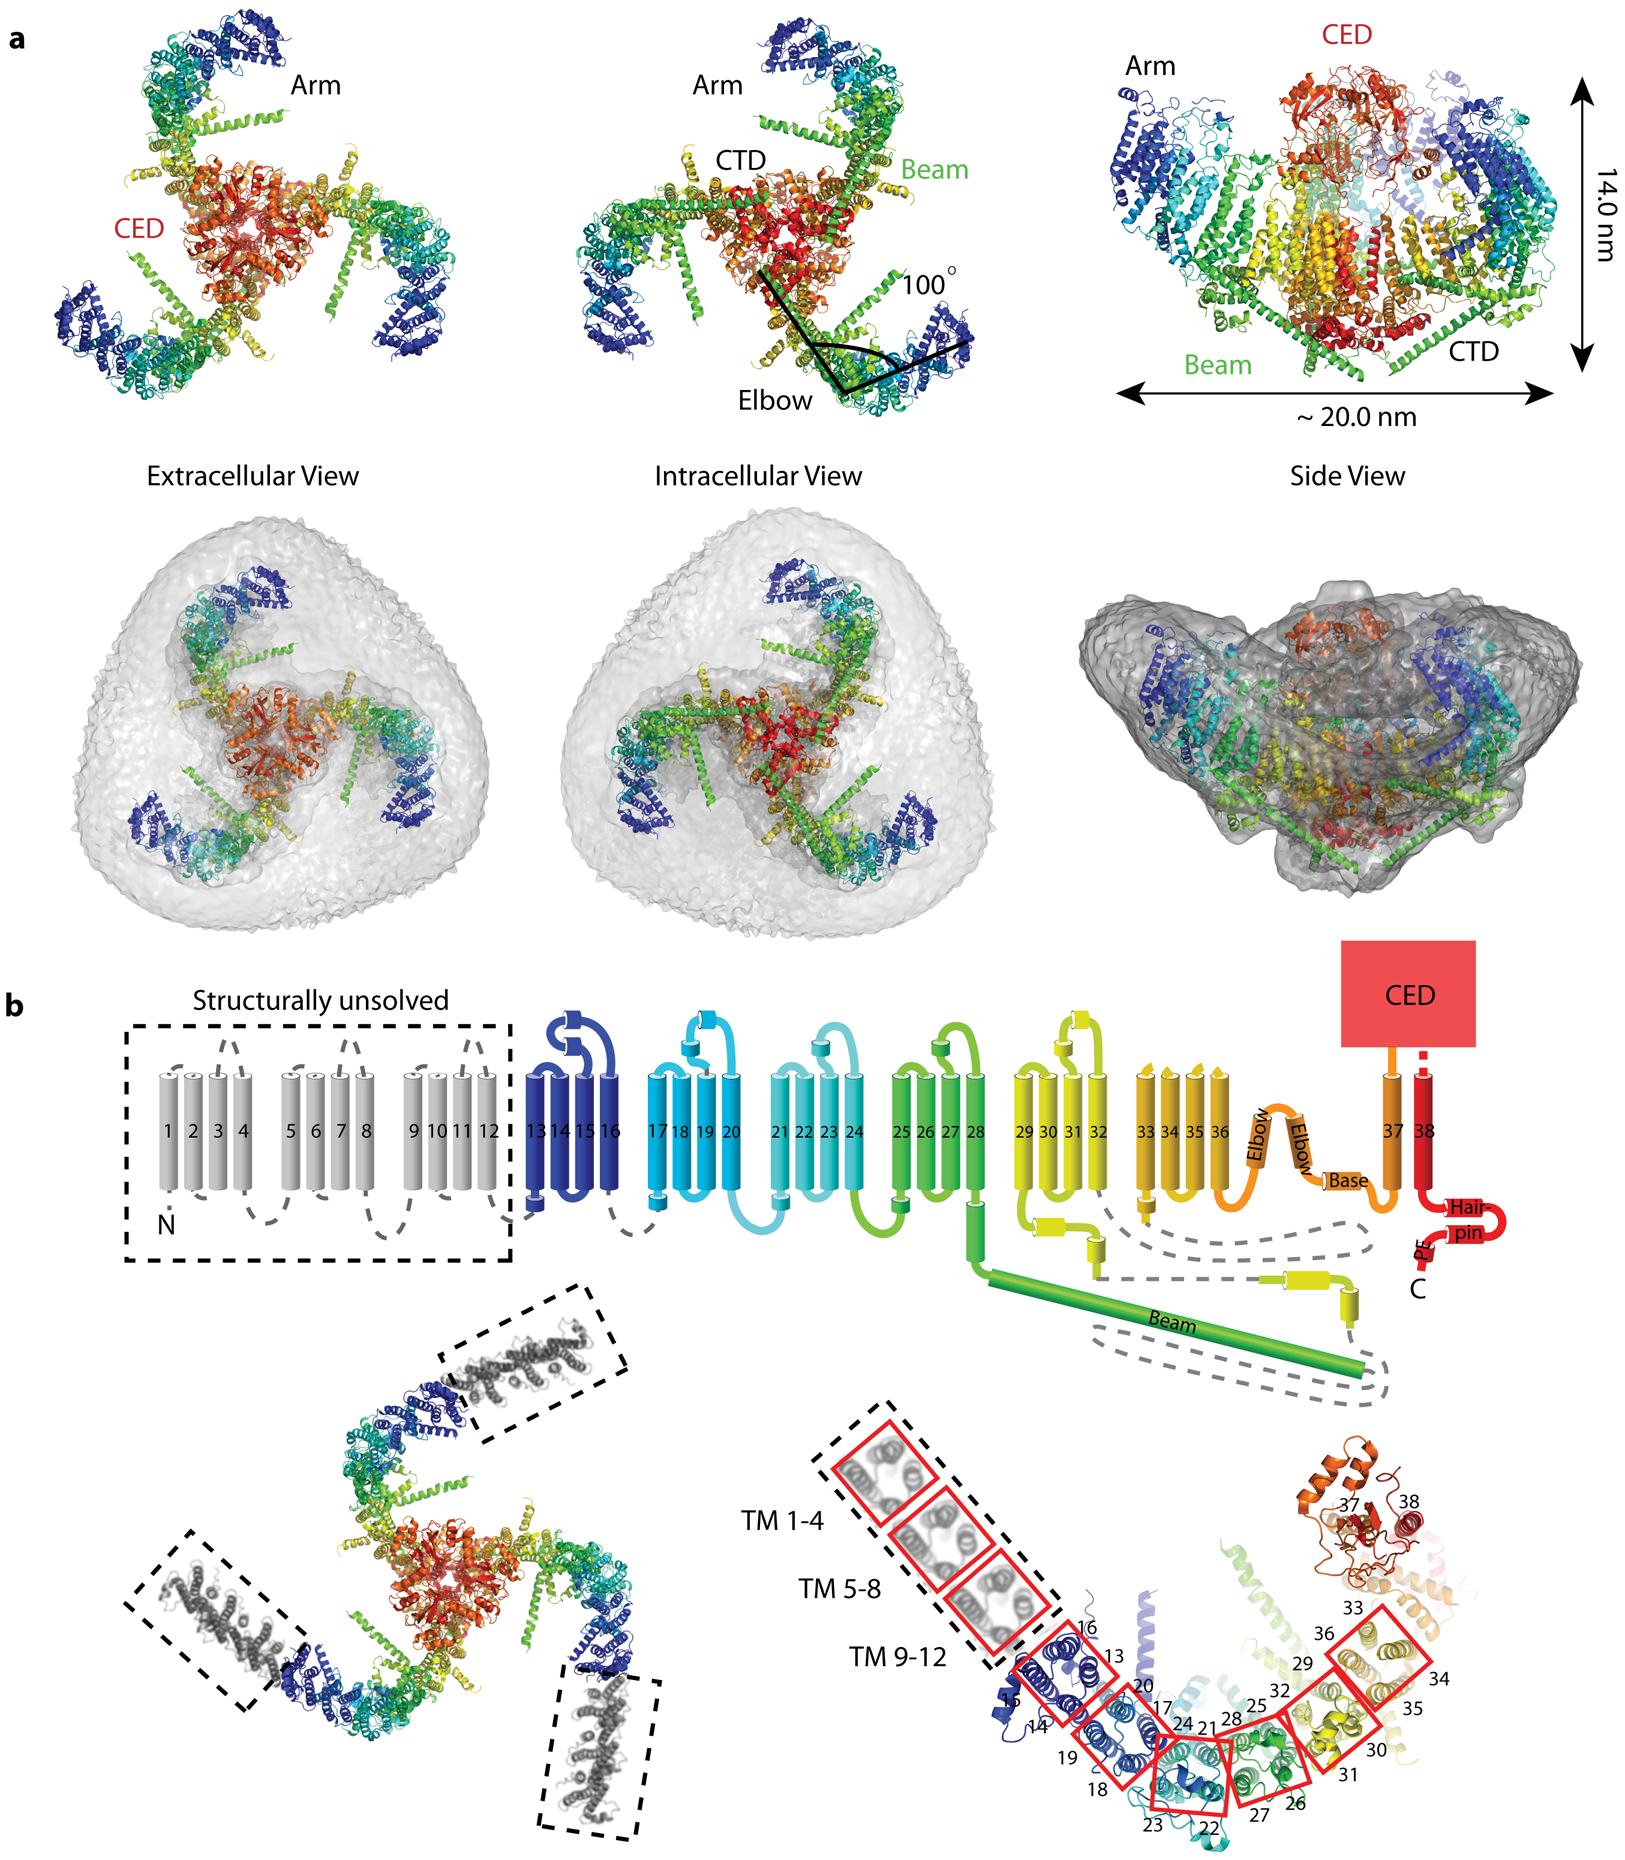
(a) Top, bottom and side views of Piezo1 (PDB 6B3R) in cartoon representation (top) and embedded in the micelle density map (EMD-7042) contoured at 6σ. CED: C-terminal extracellular domain, CTD: C-terminal domain. (b) Top: Topology of Piezo1, rainbow-colored with N-terminus in blue and C-terminus in red, except for structurally unsolved TM 1–12 regions in grey. Helices are represented as cylinders, loops as solid lines, and unresolved regions as dotted lines. Bottom: Top view of TMs, labeled as in the topology. Red squares outline 4-TM units that constitute the arm. TM 21–24 is at the ‘elbow’ of the arm. The hypothetical position of the unresolved units TM 1–4, TM 5–8 and TM 9–12 are indicated (dashed outline).
Extended Data Fig. 2. Image processing procedure to determine the radius of curvature of side-view Piezo1 channels and the intrinsic radius of curvature of the vesicles in which they are embedded.
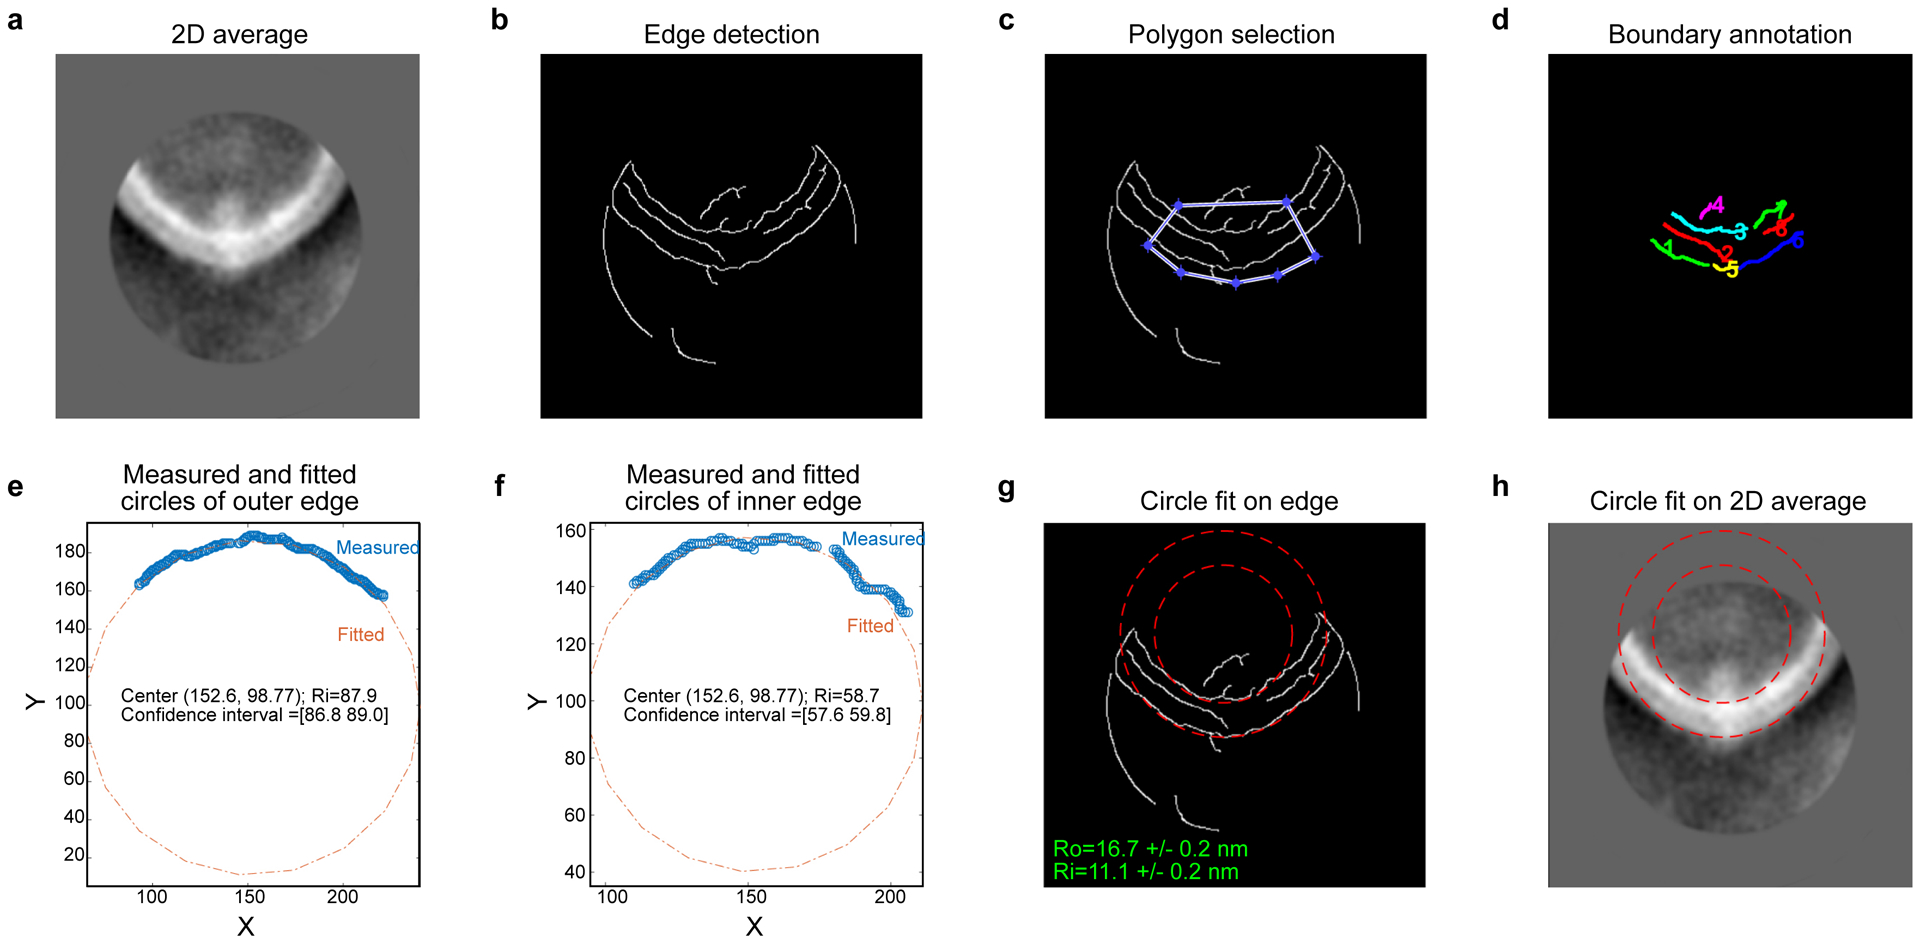
(a) The input 2D averaged image of one side of the vesicle (here Piezo1 occupied side). (b) Edge detection output using the Canny method. (c) Edge detection output overlaid with the selection polygon. (d) Edges in the selected polygon region annotated with numbers in different colors for easier identification. (e) and (f) Measured (blue circle) and fitted (red dotted line) circles of the edges corresponding to the outer (e) and inner (f) boundaries of the vesicle membrane. Center coordinates, radius and its 95% confidence interval are shown. The unit of all values is in pixels. (g) Fitted circles (red dashed lines) overlaid onto the edge detection output. Radii with the confidence interval of outer and inner boundaries are shown in units of nm. (h) Fitted circles (red dashed lines) overlaid onto the input 2D averaged image.
Extended Data Fig. 3. Estimation of tip-sample interaction force (Fts) in HS-AFM at various Aratio(=Aset/Afree) based on experimental tip motion analysis and numerical simulation.
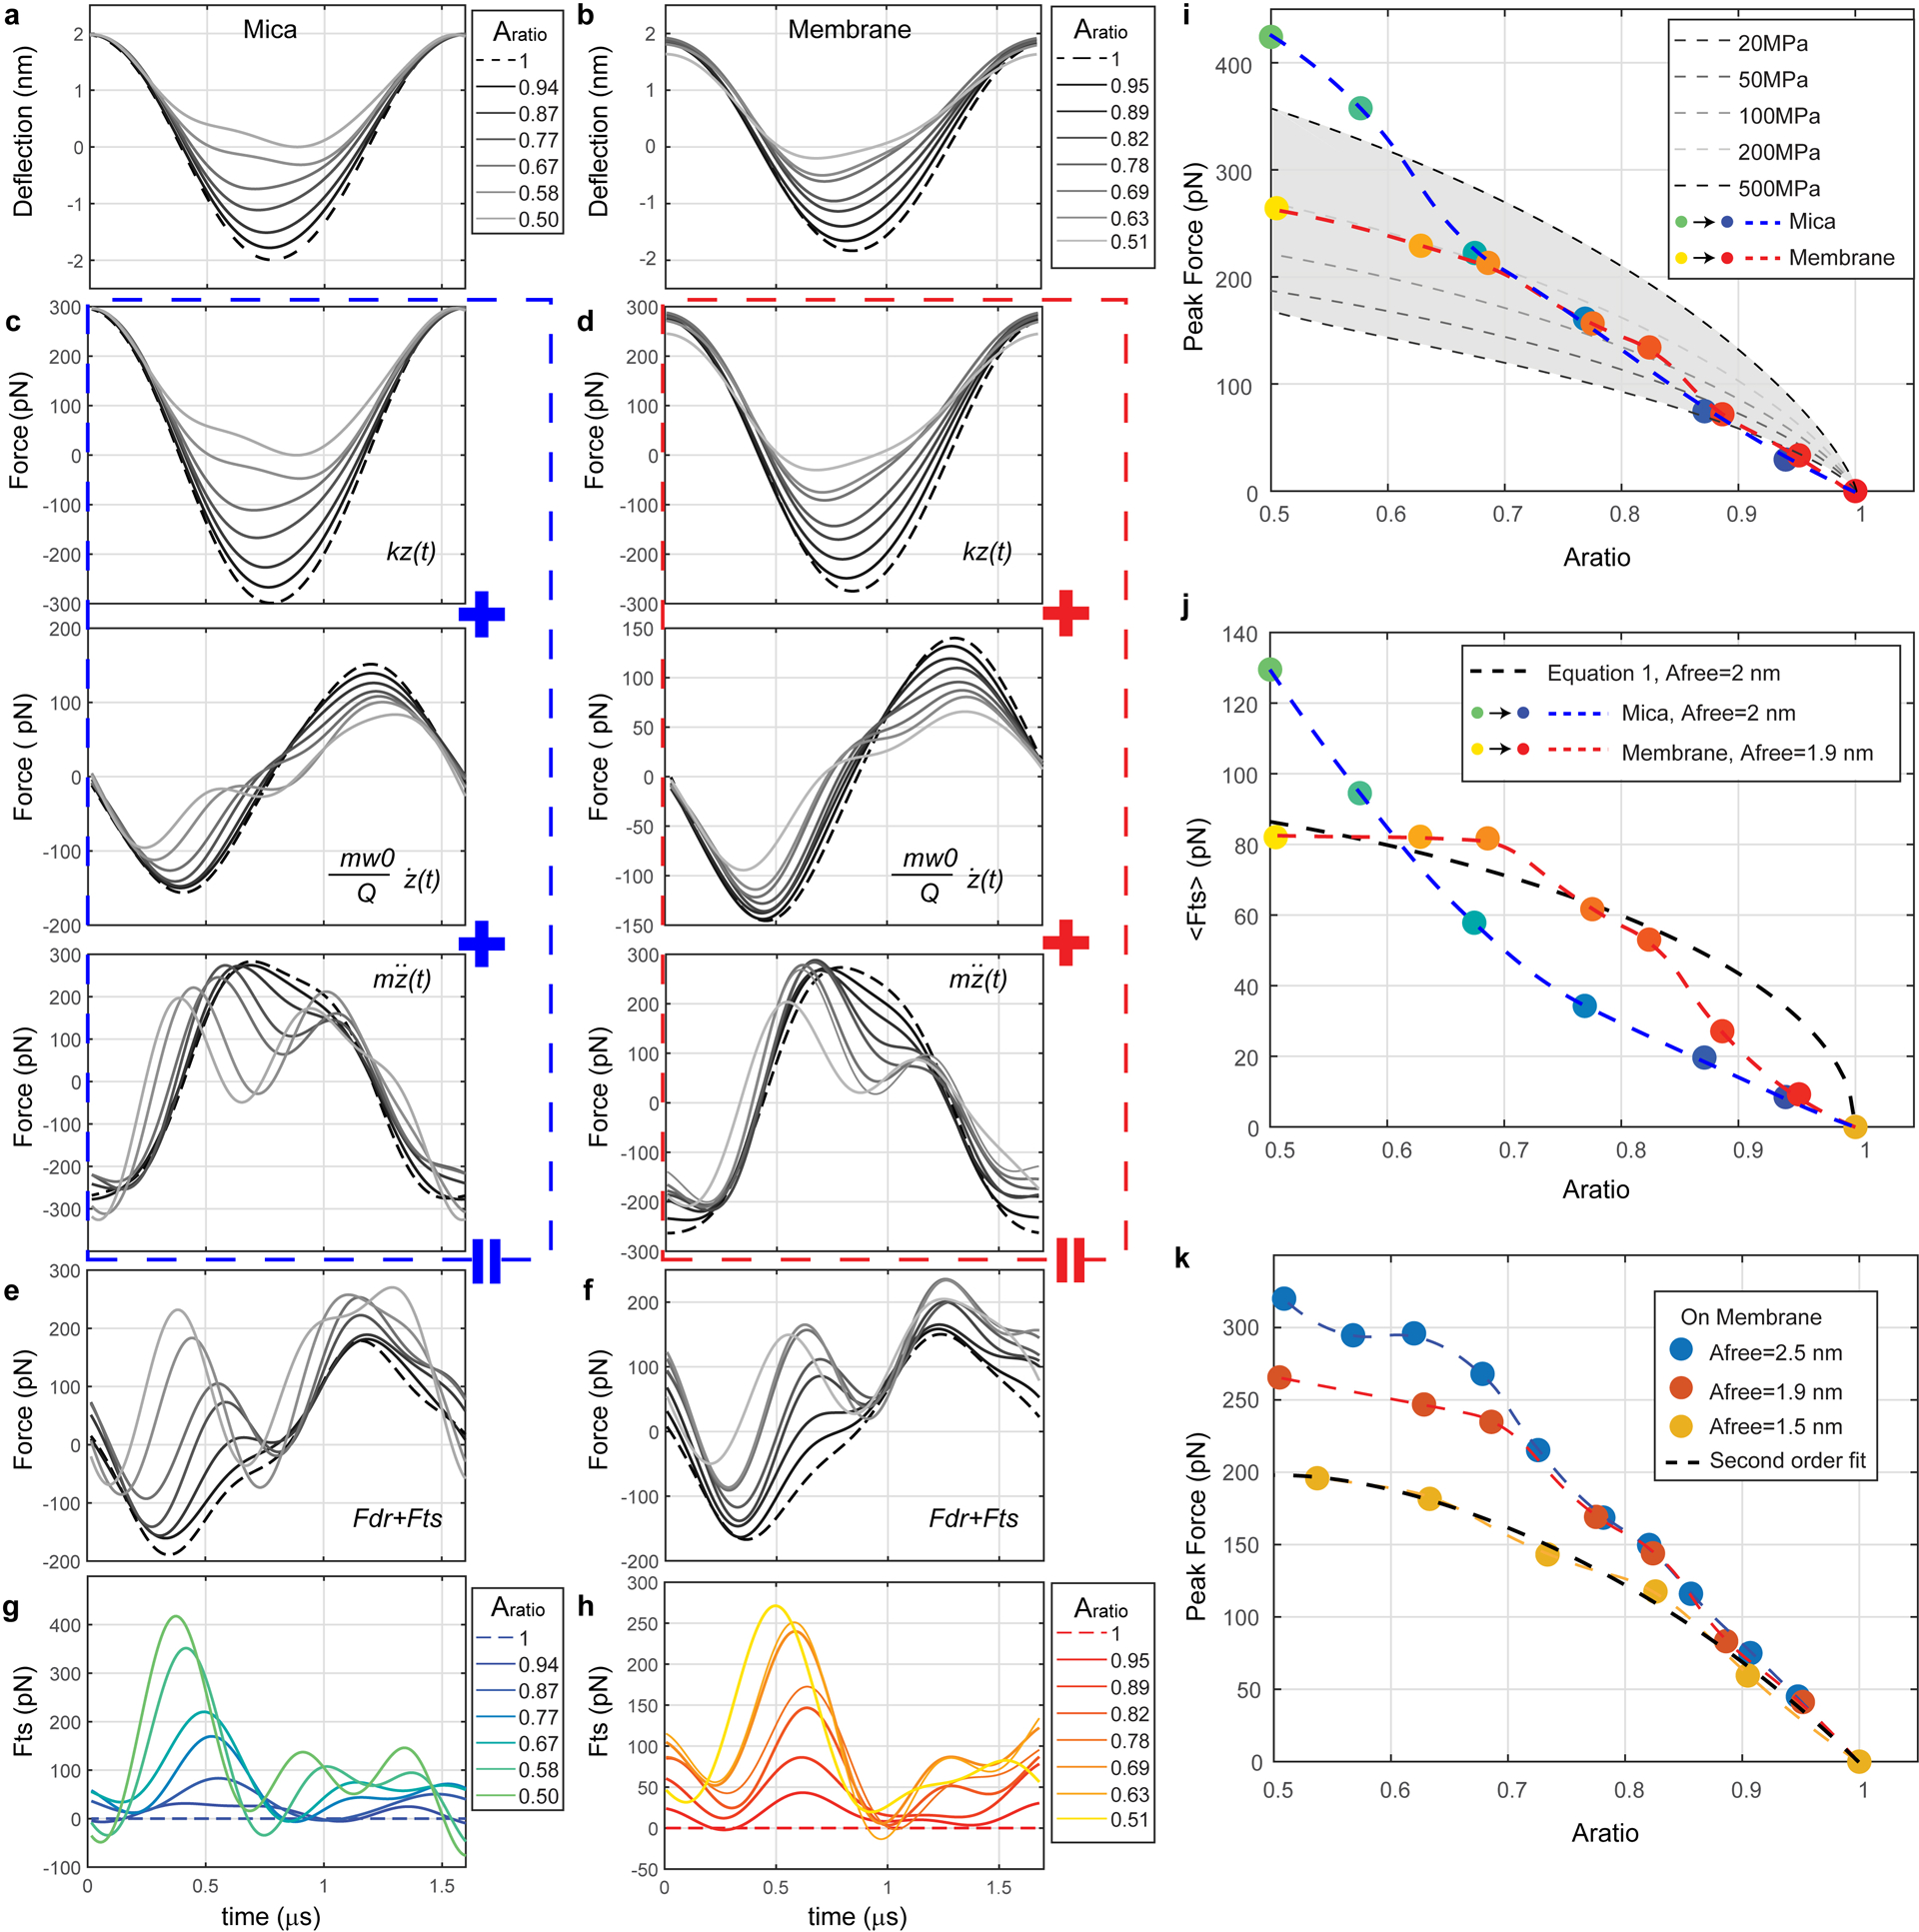
(a) and (b) Average tip motions observed at different Aratio in buffer solution during HS-AFM imaging on mica (a) and a supported lipid bilayer (DOPC/DOPS; 4:1) (b), respectively. (c) and (d) Forces caused by the elastic response of the cantilever (top), the hydrodynamic damping with the medium (middle) and the total force that governs the tip motion (bottom). (e) and (f) Sum of the drive force and tip-sample interaction force. (g) and (h) Reconstructed Fts trajectories during a single oscillation cycle based on the point mass model (Equations 7 and 8, Methods). (i) Comparison between peak forces obtained from reconstructed Fts trajectories on mica (blue dashed line) and membrane (red dashed line), and peak forces simulated using different surface stiffness using VEDA: Virtual Environment for Dynamic AFM (https://nanohub.org/resources/veda)38 (dashed lines and grey shadowed area). The VEDA simulation is performed by using the amplitude modulation approach curve tool with the following settings: discrete approach steps within a defined z-range, acoustic excitation, Afree=2 nm, Hertz contact model (Etip=130 GPa, νtip=0.3, νsample=0.5, ν is the Poisson’s ratio) with a tip radius of 1 nm, and other HS-AFM experimental parameters, e.g. k, Q, and ω0. (j) Comparison between average forces obtained from reconstructed Fts trajectories on mica (blue dashed line) and membrane (red dashed line) and values calculated through Equation 1 (thick black dashed line). (k) Comparison between peak forces obtained from experimental Fts trajectories on membrane at different Afree values. Using second order polynomial fitting, the peak force reconstructed in the condition of Afree=1.5 nm can be well described by y = −688.7x2 + 633.4x + 55 (black dashed line) with R2 = 0.99. This fitting allows us to estimate the upper bound of force, peak force, applied to Piezo1 channels at any given Aratio. Tip trajectories are representative of ≥5 independent experiments using ≥3 different HS-AFM cantilevers.
Extended Data Fig. 4. Classification of Piezo1 channels using cross-correlation analysis on characteristic dimensions measured upon force application.
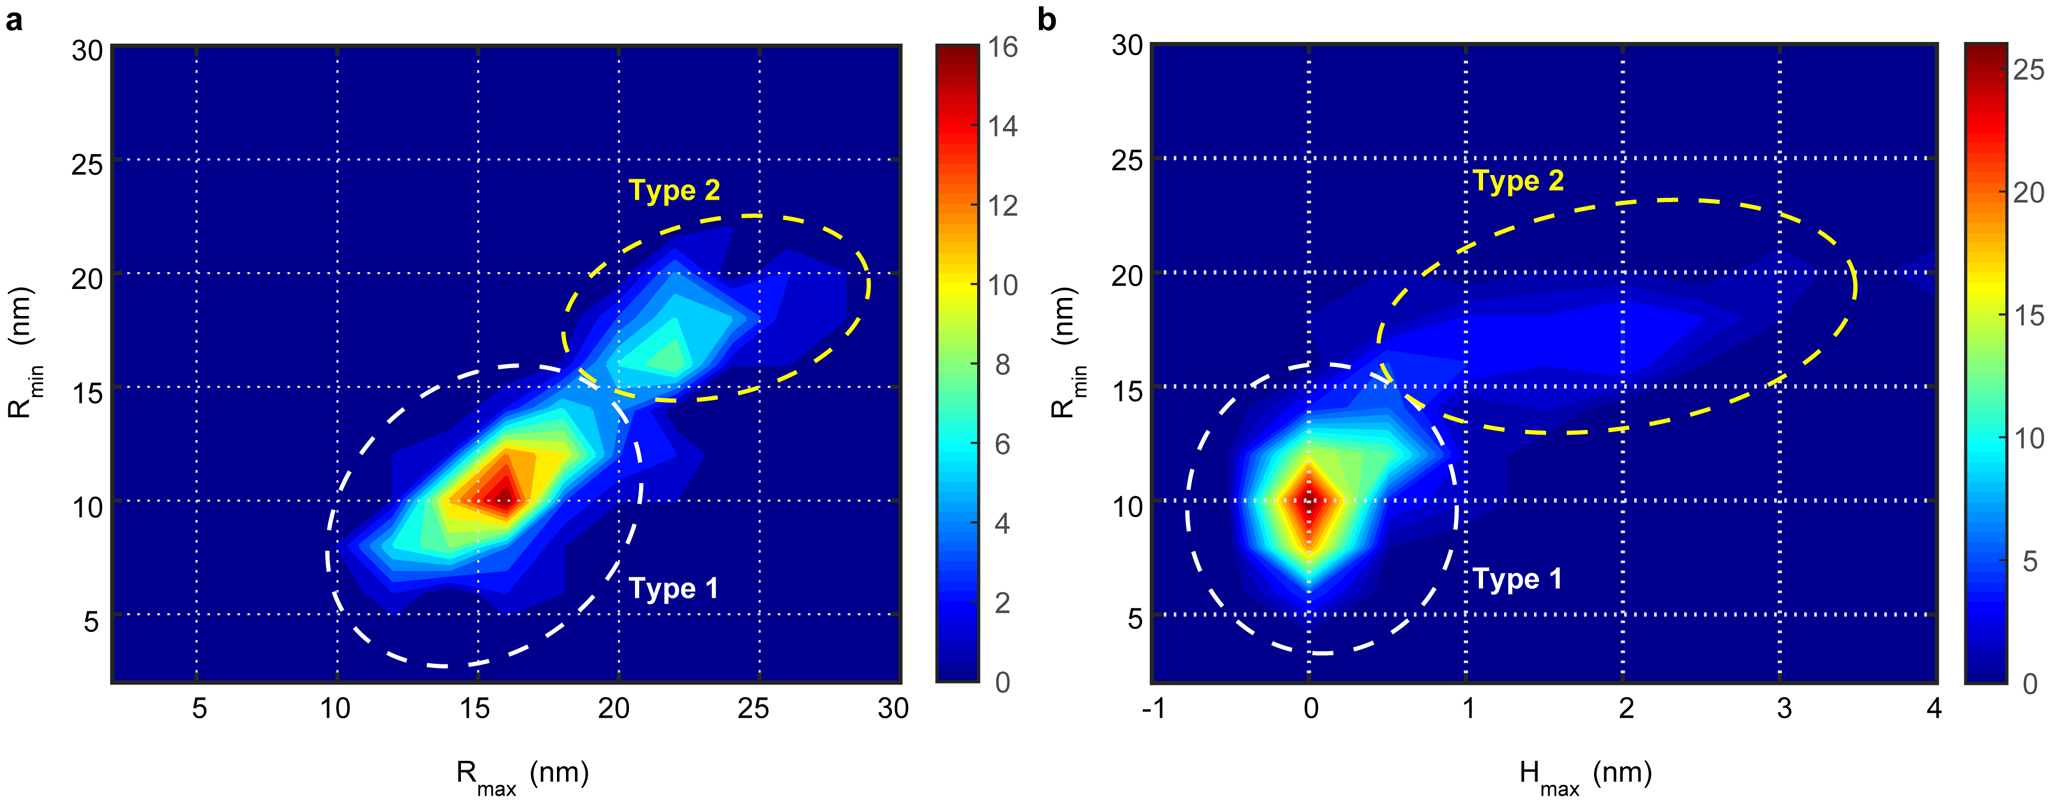
(a) and (b) Cross-correlation density maps of smallest halo radius (Rmin) at low applied force versus largest halo radius (Rmax) at highest applied force (a) and of smallest halo radius (Rmin) versus maximum central height (Hmax) at lowest applied force. Along the diagonal direction of the cross-correlation density maps, the molecules separate into two peaks that suggests the existence of two Piezo1 subtypes with different size in HS-AFM force-sweep movies. Therefore, we assigned the molecules in the peaks as Type-1 (~70%, white-dashed circle) and Type-2 (~30%, yellow-dashed circle) Piezo1, respectively. The same molecules populate in the same subtype according to all analyzed criteria. The total number of analyzed Piezo1 particles is 143 from 11 HS-AFM movies acquired on ≥5 different samples, days and HS-AFM tips.
Extended Data Fig. 5. Mechanical response of Type-2 Piezo1 to applied force.
(a) HS-AFM image at ‹FHS-AFM› ~52 pN of Type-2 Piezo1 viewed from the extracellular face. (b) Height section profile (top) and radial height profile (bottom) of the topography displayed in (a). (c) Dimensional analysis of single Type-2 Piezo1 particle in a force-sweep HS-AFM experiment. Like the Type-1 Piezo1 reported in the main text, each single molecule (left) is 360-fold symmetry averaged (center) and a kymograph (right) across the center profile (dashed line in 360-fold image) calculated. The kymograph highlights the halo expansion (dashed line) as a function of force. Bottom: Force as function of frame acquisition or time during the force-sweep HS-AFM movie acquisition. The yellow colored area corresponds to the image acquisition of the particle shown (left). (d) Normalized probability density maps of halo radius (R) as a function of force. Type-2 Piezo1 also show the structural reversibility. The total number of analyzed Type-2 Piezo1 particles are 43 from 11 HS-AFM movies acquired on ≥5 different samples, days and HS-AFM tips.
Extended Data Fig. 6. Piezo1 has an exceptional low 2D-density of TM helices.
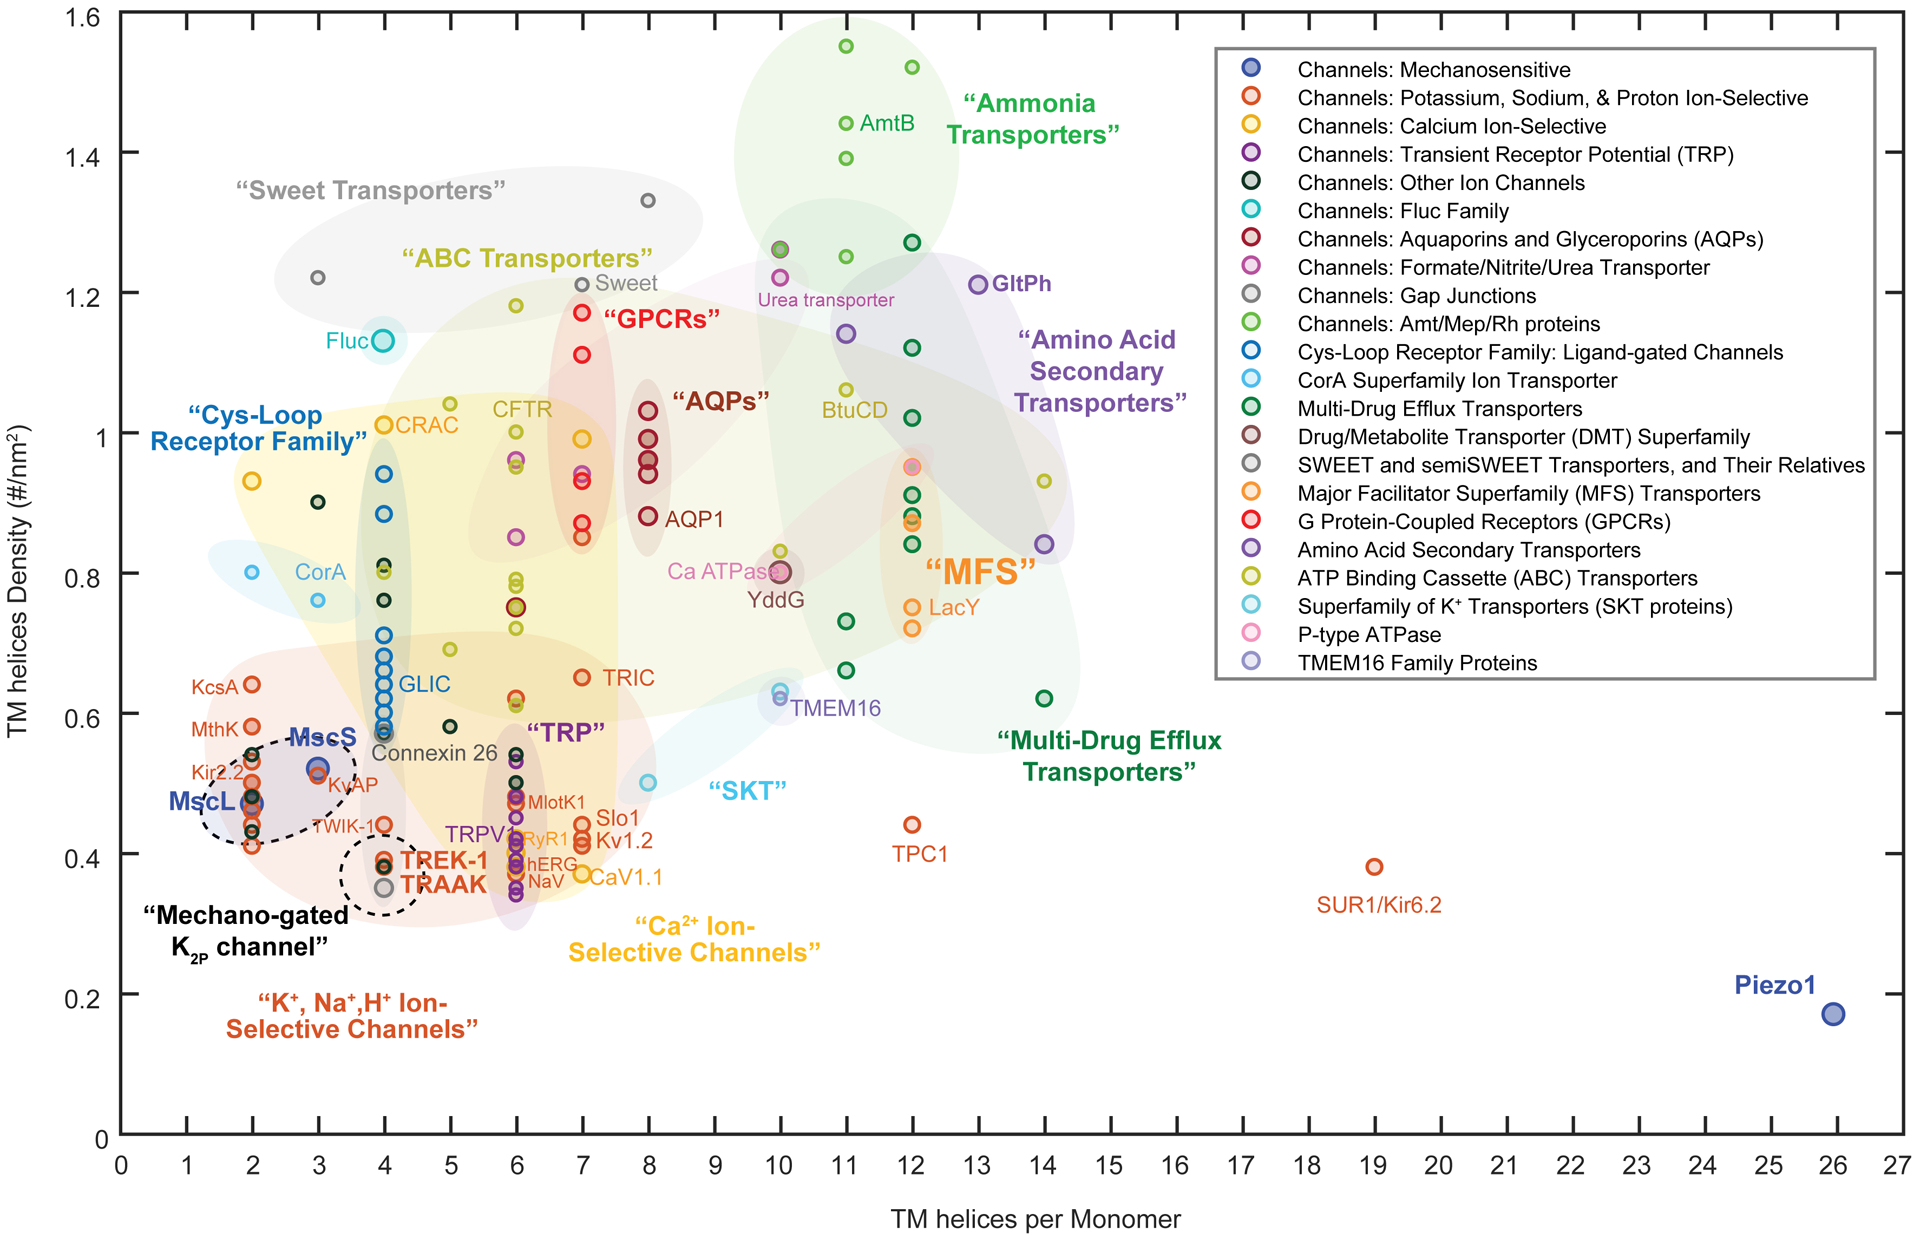
Transmembrane (TM) helix 2D-density analysis for channels and transporters of known 3D structure. The TM helix density is estimated by the total TM helices number divided by the occupied membrane area of each known structure. A total of 201 channels and transporters structures have been analyzed. A general trend seems that channels are somewhat less densely packed than transporters, possibly a signature of the existence of a protein-free pore region. The Piezo1 structure is an outlier: It is of exceptional size and has an exceptionally low TM helices density, <0.2 helices/nm2. This unique feature might be a signature and prerequisite for Piezo1 mechano-sensing.
Supplementary Material
Acknowledgements
We thank M. Ebrahim and J. Sotiris at the Evelyn Gruss Lipper Cryo-EM Resource Center of Rockefeller University for assistance with cryo-EM data collection. Y.R.G. is a Howard Hughes Medical Institute Fellow of the Damon Runyon Cancer Research Foundation (DRG 2317-18). R.M. is an investigator in the Howard Hughes Medical Institute.
Footnotes
Supplementary Information is available in the online version of the paper.
The authors declare no competing interests.
References:
- 1.Coste B et al. Piezo1 and Piezo2 are essential components of distinct mechanically activated cation channels. Science 330, 55–60, doi: 10.1126/science.1193270 (2010). [DOI] [PMC free article] [PubMed] [Google Scholar]
- 2.Coste B et al. Piezo proteins are pore-forming subunits of mechanically activated channels. Nature 483, 176–181, doi: 10.1038/nature10812 (2012). [DOI] [PMC free article] [PubMed] [Google Scholar]
- 3.Wu J, Lewis AH & Grandl J Touch, Tension, and Transduction - The Function and Regulation of Piezo Ion Channels. Trends Biochem Sci 42, 57–71, doi: 10.1016/j.tibs.2016.09.004 (2017). [DOI] [PMC free article] [PubMed] [Google Scholar]
- 4.Li J et al. Piezo1 integration of vascular architecture with physiological force. Nature 515, 279–282, doi: 10.1038/nature13701 (2014). [DOI] [PMC free article] [PubMed] [Google Scholar]
- 5.Ranade SS et al. Piezo1, a mechanically activated ion channel, is required for vascular development in mice. Proc Natl Acad Sci U S A 111, 10347–10352, doi: 10.1073/pnas.1409233111 (2014). [DOI] [PMC free article] [PubMed] [Google Scholar]
- 6.Retailleau K et al. Piezo1 in Smooth Muscle Cells Is Involved in Hypertension-Dependent Arterial Remodeling. Cell Rep 13, 1161–1171, doi: 10.1016/j.celrep.2015.09.072 (2015). [DOI] [PubMed] [Google Scholar]
- 7.Cahalan SM et al. Piezo1 links mechanical forces to red blood cell volume. Elife 4, doi: 10.7554/eLife.07370 (2015). [DOI] [PMC free article] [PubMed] [Google Scholar]
- 8.Wang S et al. Endothelial cation channel PIEZO1 controls blood pressure by mediating flow-induced ATP release. J Clin Invest 126, 4527–4536, doi: 10.1172/JCI87343 (2016). [DOI] [PMC free article] [PubMed] [Google Scholar]
- 9.Rode B et al. Piezo1 channels sense whole body physical activity to reset cardiovascular homeostasis and enhance performance. Nat Commun 8, 350, doi: 10.1038/s41467-017-00429-3 (2017). [DOI] [PMC free article] [PubMed] [Google Scholar]
- 10.Ranade SS et al. Piezo2 is the major transducer of mechanical forces for touch sensation in mice. Nature 516, 121–125, doi: 10.1038/nature13980 (2014). [DOI] [PMC free article] [PubMed] [Google Scholar]
- 11.Woo SH et al. Piezo2 is the principal mechanotransduction channel for proprioception. Nat Neurosci 18, 1756–1762, doi: 10.1038/nn.4162 (2015). [DOI] [PMC free article] [PubMed] [Google Scholar]
- 12.Demolombe S, Duprat F, Honore E & Patel A Slower Piezo1 inactivation in dehydrated hereditary stomatocytosis (xerocytosis). Biophys J 105, 833–834, doi: 10.1016/j.bpj.2013.07.018 (2013). [DOI] [PMC free article] [PubMed] [Google Scholar]
- 13.Andolfo I et al. Novel Gardos channel mutations linked to dehydrated hereditary stomatocytosis (xerocytosis). Am J Hematol 90, 921–926, doi: 10.1002/ajh.24117 (2015). [DOI] [PubMed] [Google Scholar]
- 14.Fotiou E et al. Novel mutations in PIEZO1 cause an autosomal recessive generalized lymphatic dysplasia with non-immune hydrops fetalis. Nat Commun 6, 8085, doi: 10.1038/ncomms9085 (2015). [DOI] [PMC free article] [PubMed] [Google Scholar]
- 15.Coste B et al. Gain-of-function mutations in the mechanically activated ion channel PIEZO2 cause a subtype of Distal Arthrogryposis. Proc Natl Acad Sci U S A 110, 4667–4672, doi: 10.1073/pnas.1221400110 (2013). [DOI] [PMC free article] [PubMed] [Google Scholar]
- 16.Guo YR & MacKinnon R Structure-based membrane dome mechanism for Piezo mechanosensitivity. Elife 6, doi: 10.7554/eLife.33660 (2017). [DOI] [PMC free article] [PubMed] [Google Scholar]
- 17.Saotome K et al. Structure of the mechanically activated ion channel Piezo1. Nature 554, 481–486, doi: 10.1038/nature25453 (2018). [DOI] [PMC free article] [PubMed] [Google Scholar]
- 18.Zhao Q et al. Structure and mechanogating mechanism of the Piezo1 channel. Nature 554, 487–492, doi: 10.1038/nature25743 (2018). [DOI] [PubMed] [Google Scholar]
- 19.Wu J, Goyal R & Grandl J Localized force application reveals mechanically sensitive domains of Piezo1. Nat Commun 7, 12939, doi: 10.1038/ncomms12939 (2016). [DOI] [PMC free article] [PubMed] [Google Scholar]
- 20.Wang Y et al. A lever-like transduction pathway for long-distance chemical- and mechanogating of the mechanosensitive Piezo1 channel. Nat Commun 9, 1300, doi: 10.1038/s41467-018-03570-9 (2018). [DOI] [PMC free article] [PubMed] [Google Scholar]
- 21.Lewis AH & Grandl J Mechanical sensitivity of Piezo1 ion channels can be tuned by cellular membrane tension. Elife 4, doi: 10.7554/eLife.12088 (2015). [DOI] [PMC free article] [PubMed] [Google Scholar]
- 22.Cox CD et al. Removal of the mechanoprotective influence of the cytoskeleton reveals PIEZO1 is gated by bilayer tension. Nat Commun 7, 10366, doi: 10.1038/ncomms10366 (2016). [DOI] [PMC free article] [PubMed] [Google Scholar]
- 23.Arnadottir J & Chalfie M Eukaryotic mechanosensitive channels. Annu Rev Biophys 39, 111–137, doi: 10.1146/annurev.biophys.37.032807.125836 (2010). [DOI] [PubMed] [Google Scholar]
- 24.Brohawn SG, Su ZW & MacKinnon R Mechanosensitivity is mediated directly by the lipid membrane in TRAAK and TREK1 K+ channels. P Natl Acad Sci USA 111, 3614–3619, doi: 10.1073/pnas.1320768111 (2014). [DOI] [PMC free article] [PubMed] [Google Scholar]
- 25.Brohawn SG, Campbell EB & MacKinnon R Physical mechanism for gating and mechanosensitivity of the human TRAAK K+ channel. Nature 516, 126–130, doi: 10.1038/nature14013 (2014). [DOI] [PMC free article] [PubMed] [Google Scholar]
- 26.Moe P & Blount P Assessment of potential stimuli for mechano-dependent gating of MscL: effects of pressure, tension, and lipid headgroups. Biochemistry 44, 12239–12244, doi: 10.1021/bi0509649 (2005). [DOI] [PubMed] [Google Scholar]
- 27.Zhang W et al. Ankyrin Repeats Convey Force to Gate the NOMPC Mechanotransduction Channel. Cell 162, 1391–1403, doi: 10.1016/j.cell.2015.08.024 (2015). [DOI] [PMC free article] [PubMed] [Google Scholar]
- 28.Jin P et al. Electron cryo-microscopy structure of the mechanotransduction channel NOMPC. Nature 547, 118–122, doi: 10.1038/nature22981 (2017). [DOI] [PMC free article] [PubMed] [Google Scholar]
- 29.Gaub BM & Muller DJ Mechanical Stimulation of Piezo1 Receptors Depends on Extracellular Matrix Proteins and Directionality of Force. Nano Lett 17, 2064–2072, doi: 10.1021/acs.nanolett.7b00177 (2017). [DOI] [PubMed] [Google Scholar]
- 30.Hamill OP & McBride DW Jr. Induced membrane hypo/hyper-mechanosensitivity: a limitation of patch-clamp recording. Annu Rev Physiol 59, 621–631, doi: 10.1146/annurev.physiol.59.1.621 (1997). [DOI] [PubMed] [Google Scholar]
- 31.Suchyna TM, Markin VS & Sachs F Biophysics and structure of the patch and the gigaseal. Biophys J 97, 738–747, doi: 10.1016/j.bpj.2009.05.018 (2009). [DOI] [PMC free article] [PubMed] [Google Scholar]
- 32.Moroni M, Servin-Vences MR, Fleischer R, Sanchez-Carranza O & Lewin GR Voltage gating of mechanosensitive PIEZO channels. Nat Commun 9, 1096, doi: 10.1038/s41467-018-03502-7 (2018). [DOI] [PMC free article] [PubMed] [Google Scholar]
- 33.Lacroix JJ, Botello-Smith WM & Luo Y Probing the gating mechanism of the mechanosensitive channel Piezo1 with the small molecule Yoda1. Nat Commun 9, 2029, doi: 10.1038/s41467-018-04405-3 (2018). [DOI] [PMC free article] [PubMed] [Google Scholar]
- 34.Ando T, Uchihashi T & Scheuring S Filming biomolecular processes by high-speed atomic force microscopy. Chem Rev 114, 3120–3188, doi: 10.1021/cr4003837 (2014). [DOI] [PMC free article] [PubMed] [Google Scholar]
- 35.Miyagi A & Scheuring S Automated force controller for amplitude modulation atomic force microscopy. Rev Sci Instrum 87, 053705, doi: 10.1063/1.4950777 (2016). [DOI] [PubMed] [Google Scholar]
- 36.Helfrich W Elastic properties of lipid bilayers: theory and possible experiments. Z Naturforsch C 28, 693–703 (1973). [DOI] [PubMed] [Google Scholar]
- 37.Legleiter J, Park M, Cusick B & Kowalewski T Scanning probe acceleration microscopy (SPAM) in fluids: mapping mechanical properties of surfaces at the nanoscale. Proc Natl Acad Sci U S A 103, 4813–4818, doi: 10.1073/pnas.0505628103 (2006). [DOI] [PMC free article] [PubMed] [Google Scholar]
- 38.Kiracofe D et al. VEDA: Virtual Environment for Dynamic AFM, <https://nanohub.org/resources/veda> (2012).
- 39.Guzman HV, Garcia PD & Garcia R Dynamic force microscopy simulator (dForce): A tool for planning and understanding tapping and bimodal AFM experiments. Beilstein J Nanotechnol 6, 369–379, doi: 10.3762/bjnano.6.36 (2015). [DOI] [PMC free article] [PubMed] [Google Scholar]
- 40.García R & San Paulo A Attractive and repulsive tip-sample interaction regimes in tapping-mode atomic force microscopy. Physical Review B 60, 4961–4967, doi: 10.1103/PhysRevB.60.4961 (1999). [DOI] [PMC free article] [PubMed] [Google Scholar]
- 41.Weisstein EW “Spherical Cap.” From MathWorld--A Wolfram Web Resource. http://mathworld.wolfram.com/SphericalCap.html.
- 42.Haselwandter CA & MacKinnon R Piezo’s membrane footprint and its contribution to mechanosensitivity. Elife 7, doi: 10.7554/eLife.41968 (2018). [DOI] [PMC free article] [PubMed] [Google Scholar]
- 43.Mastronarde DN Automated electron microscope tomography using robust prediction of specimen movements. J Struct Biol 152, 36–51, doi: 10.1016/j.jsb.2005.07.007 (2005). [DOI] [PubMed] [Google Scholar]
- 44.Zheng SQ et al. MotionCor2: anisotropic correction of beam-induced motion for improved cryo-electron microscopy. Nat Methods 14, 331–332, doi: 10.1038/nmeth.4193 (2017). [DOI] [PMC free article] [PubMed] [Google Scholar]
- 45.Rohou A & Grigorieff N CTFFIND4: Fast and accurate defocus estimation from electron micrographs. J Struct Biol 192, 216–221, doi: 10.1016/j.jsb.2015.08.008 (2015). [DOI] [PMC free article] [PubMed] [Google Scholar]
- 46.Scheres SH RELION: implementation of a Bayesian approach to cryo-EM structure determination. J Struct Biol 180, 519–530, doi: 10.1016/j.jsb.2012.09.006 (2012). [DOI] [PMC free article] [PubMed] [Google Scholar]
- 47.Kimanius D, Forsberg BO, Scheres SH & Lindahl E Accelerated cryo-EM structure determination with parallelisation using GPUs in RELION-2. Elife 5, e18722, doi: 10.7554/eLife.18722 (2016). [DOI] [PMC free article] [PubMed] [Google Scholar]
Associated Data
This section collects any data citations, data availability statements, or supplementary materials included in this article.