

Abstract
Non-alcoholic fatty liver disease and steatohepatitis are highly associated with obesity and type 2 diabetes mellitus. Cotadutide, a GLP-1R/GcgR agonist, was shown to reduce blood glycemia, body weight and hepatic steatosis in patients with T2DM. Here, we demonstrate that the effects of Cotadutide to reduce body weight, food intake and improve glucose control are predominantly mediated through the GLP-1 signaling, while, its action on the liver to reduce lipid content, drive glycogen flux and improve mitochondrial turnover and function are directly mediated through Gcg signaling. This was confirmed by the identification of phosphorylation sites on key lipogenic and glucose metabolism enzymes in liver of mice treated with Cotadutide. Complementary metabolomic and transcriptomic analyses implicated lipogenic, fibrotic and inflammatory pathways, which are consistent with a unique therapeutic contribution of GcgR agonism by Cotadutide in vivo. Significantly, Cotadutide also alleviated fibrosis to a greater extent than Liraglutide or Obeticholic acid (OCA), despite adjusting dose to achieve similar weight loss in 2 preclinical mouse models of NASH. Thus Cotadutide, via direct hepatic (GcgR) and extra-hepatic (GLP-1R) effects, exerts multi-factorial improvement in liver function and is a promising therapeutic option for the treatment of steatohepatitis.
INTRODUCTION
Nonalcoholic fatty liver disease (NAFLD) and its progressive form, nonalcoholic steatohepatitis (NASH), are unmet medical conditions affecting a substantial and increasing patient population.1 Characterized by hepatic lipid accumulation, inflammation and fibrosis, NASH can lead to cirrhosis, liver failure and cancer.2,3 As obesity and T2DM are major risk factors for NASH, treatments that impact body weight and glucose control have been explored.4 Bariatric surgery is associated with increases in incretin hormones that regulate body weight and glucose metabolism.5–7 One of these, oxyntomodulin, activates both the glucagon-like protein-1 (GLP-1) and glucagon (Gcg) receptors (GLP-1R, GcgR), to decrease body weight via reducing food intake8,9 and increasing energy expenditure.10 While GcgR agonism can relieve metabolic disease symptoms through increasing energy expenditure and reducing hepatic fat, Gcg-driven hepatic glucose production is a liability by impairing glucose control. However, several studies have now demonstrated that GLP-1 can effectively counterbalance the hyperglycemic effects of Gcg.11,12–15
Anti-obesity effects of dual GLP-1R/GcgR agonists were first demonstrated in diet-induced obese (DIO) mice, where dual agonism reduced body weight, hyperglycemia and hepatic lipid over that of a GLP-1R agonist alone.12,16 Our complementary work, treating overweight patients with T2DM with the dual-agonist Cotadutide (MEDI0382) resulted in significant improvement in post-prandial glucose excursions, and reductions in body weight and liver fat.11 Others have shown a related dual agonist can reduce liver fat and slow development of hepatic fibrosis in high-fat diet (HFD) and HFD/CCl4 mouse models.17,18 Furthermore, in methionine- and choline-deficient diet (MCD)-fed mice with partial hepatectomy, a similar dual agonist reduced inflammation, cell death and improved hepatic regeneration.19 These data are suggestive of GLP-1R/GcgR agonists as potential therapeutics, however the studies were prophylactic, rather than interventional, and not conducted in a pathophysiological relevant model of NASH.20
Cotadutide has been engineered to balance GLP-1R and GcgR agonism (with a ~5:1 bias towards GLP-1R affinity) to optimize beneficial outcomes for metabolic disease. Here, we show Cotadutide harnessed glucose- and body weight-lowering effects of GLP-1R agonism, while also improving hepatic lipid and glucose metabolism via GcgR target engagement, to intervene and reverse NASH and hepatic fibrosis in two pathophysiological relevant mouse models.
RESULTS
Cotadutide effect on body weight/food intake and glucose homeostasis is GLP-1R-dependent
RNA sequencing confirmed that GLP-1R was not expressed in human liver tissue, or the non-parenchymal Kupffer or stellate cells (Supplementary Fig. 1). In contrast, GcgR was expressed in whole liver with negligible expression in Kupffer and stellate cells, implying that any impact of Cotadutide on hepatic outcomes is directly mediated through GcgR signaling in hepatocytes (Supplementary Fig. 1). Metabolic and hepatic outcomes of Cotadutide treatment was assessed in vivo using wildtype (WT) and GLP-1R knockout (KO) mice. Following 14 days of equimolar dosing (10 nmol/kg) with either Cotadutide (dual GLP-1R/GcgR agonist), Liraglutide (GLP-1R agonist), g1437 (GcgR agonist) or co-administration of Liraglutide+g1437 (5+5 nmol/kg), body weight was significantly reduced compared with vehicle in WT mice (Fig. 1a and e). Weight lowering effects of GLP-1R agonists in mice lacking GLP-1R were not observed when administered Cotadutide or Liraglutide (Fig. 1b and f). Although the Gcg signaling component of Cotadutide may hypothetically induce some weight loss independent of GLP-1, its lower potency at the GcgR rendered insignificant weight loss in KO animals (Fig. 1b and f). Indeed, treatment with g1437 (a more potent Gcg agonist) or Liraglutide+g1437 resulted in significant weight loss in KO mice (Fig. 1a–b). There was no effect on body composition (fat/lean mass) with any intervention (not shown). Food intake was significantly reduced on the first 2 days of Cotadutide treatment and days 2-4 of Liraglutide treatment (Fig. 1c), but not in KO mice (Fig. 1d). Liver lipid content was reduced in all WT groups, by Cotadutide, g1437 and Liraglutide+g1437 treatments to a greater degree than Liraglutide alone (Fig. 1g), This effect was also seen in KO mice except when treated with Liraglutide alone (Fig. 1h). Fasting glucose was lowered in WT mice treated with Cotadutide and Liraglutide compared with vehicle, while g1437 alone caused higher fasting glucose (Fig. 1i). GLP-1R KO mice exhibited loss of glucose control and did not respond to any treatments (Fig. 1j, l and n). During ipGTT Liraglutide reduced blood glucose compared with vehicle in WT mice, with a similar trend observed for Cotadutide (Fig. 1k and m). Treatment with g1437 or Liraglutide+g1437 resulted in significantly higher blood glucose during GTT (Fig. 1k and m). Plasma insulin was lower in all WT animals following treatment compared with vehicle, but only lower in g1437 and Liraglutide+g1437 treated KO animals (Fig. 1o and p). Endogenous plasma Gcg was suppressed in groups treated with a therapeutic GcgR agonist regardless of genotype (Fig. 1q and r). Plasma leptin, a marker of fat mass, was lower in all WT animals following treatment. In the absence of GLP-1R, plasma leptin remained lower in mice treated with a GcgR agonist, while Liraglutide had no effect (Fig. 1s and t). These data demonstrate that metabolic benefits of Cotadutide are mediated through GLP-1 action while improvements in hepatic lipid content are mediated through GcgR activation.
Figure 1.
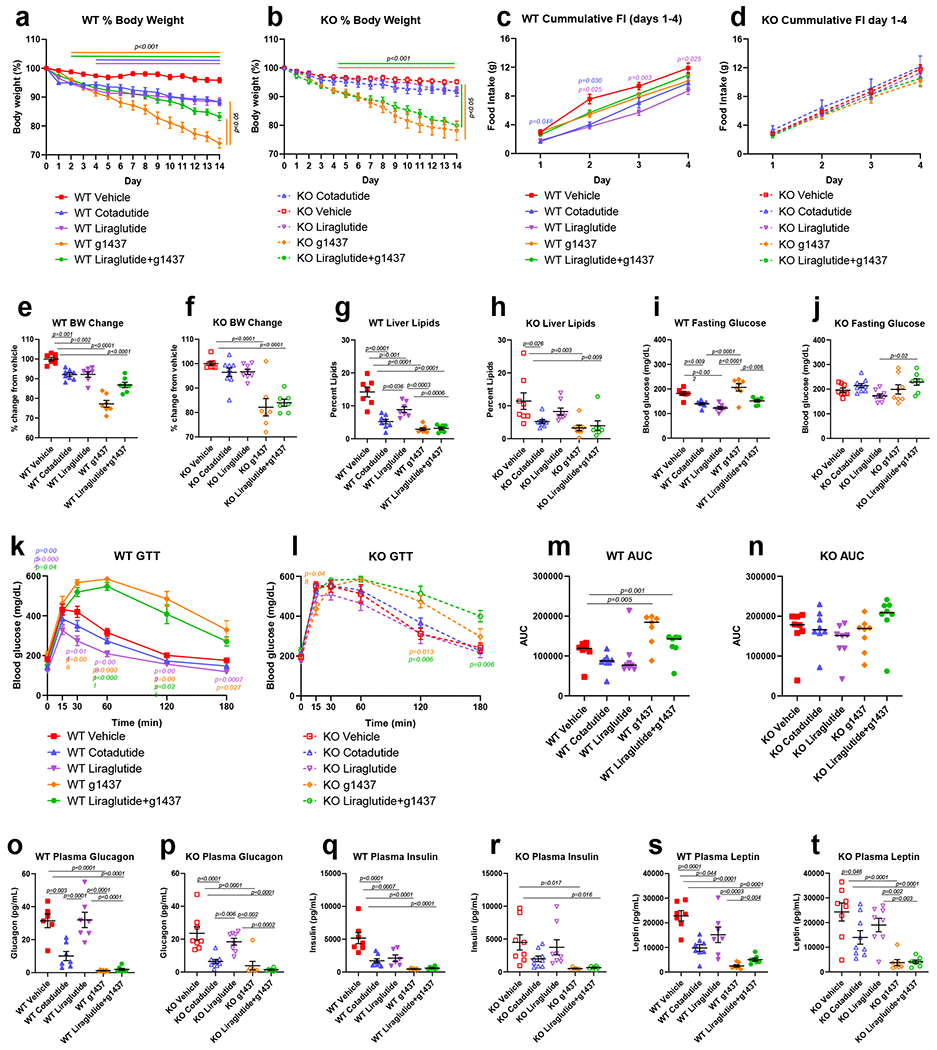
Metabolic and hepatic parameters following two-week treatment of DIO GLP-1R WT or KO mice with Cotadutide, Liraglutide, g1437 or Liraglutide+g1437 at equimolar dosing (10 nmol/kg, SC, QD for 14 days) compared to vehicle. Blood and tissues were harvested 20h after administration of the final dose. Animals were given ad libitum access to food for the entirety of the study except for the day of GTT where they were fasted for 6h prior to injection of glucose (1.25 mg/kg). Reduction in body weight throughout the 14 day dosing period shown as % change in WT (a) and KO (b) mice. Cumulative food intake during the first 4 days of dosing in WT (c) and KO (d) mice. Percent change in body weight from vehicle in WT (e) and KO (f) mice. Terminal liver lipid percentage in WT (g) and KO (h) mice. Fasting blood glucose levels, blood glucose profile during IPGTT and area under the glucose curve in WT (i, k and m, respectively) and KO mice (j, l and n, respectively). Plasma glucagon, insulin and leptin in WT (o, q and s, respectively) and KO (p, r and t, respectively) mice. WT Vehicle (n=7); WT Cotadutide (n=8); WT Liraglutide (n=7); WT g1437 (n=7); WT Liraglutide+g1437 (n=7); KO Vehicle (n=8); KO Cotadutide (n=9); KO Liraglutide (n=8); KO g1437 (n=8); KO Liraglutide+g1437 (n=7) mice/group. Data shown as the mean ± SEM. (a-d, i and j) Two-way ANOVA, (e-h, k and l) One-way ANOVA, with Tukey’s multiple comparisons post-hoc. In (a) and (b), lines above the graph indicated differences compared with vehicle at each time point, lines to the right indicated differences between groups at day 14. In (c), (k) and (l) p-values in color represent the treatment group indicated vs. vehicle.
Cotadutide reduces hepatic lipid content and alters carbohydrate flux in DIO mice
Temporal effects of Cotadutide, Liraglutide, g1437 and Liraglutide+g1437 on metabolic and hepatic parameters were assessed after daily dosing of DIO male mice for 7 days, with significant weight loss in all groups compared with vehicle (Fig. 2a, Supplementary Fig. 2). All groups that received a GcgR agonist displayed lower hepatic lipid content versus vehicle, unlike Liraglutide (Fig. 2b, Supplementary Fig. 2). After dosing, serum Cotadutide concentration was highest at 2h and 6h, but undetectable at 16h (Fig. 2c–d, Supplementary Fig. 2e). Liraglutide’s pharmacokinetics estimated lower levels (~50%) but with longer bioavailability, while g1437 estimated concentrations were ~30% that of Cotadutide with similar clearance (Fig. 2c–d). Blood glucose was not different between groups across the time course (Fig. 2e), but in a smaller study of vehicle versus Cotadutide treatment, Cotadutide significantly lowered blood glucose at 2h and 6h (Supplementary Fig. 2e).
Figure 2.
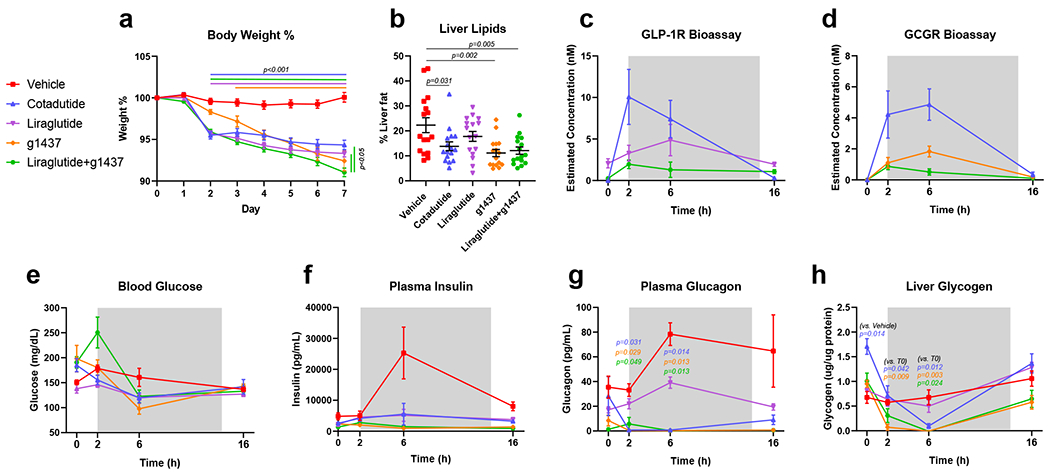
Temporal changes in metabolic and hepatic parameters following one-week treatment of DIO C57Bl6/J mice with Cotadutide, Liraglutide, g1437 or Liraglutide+g1437 at equimolar dosing (10 nmol/kg, SC, QD for 7 days) compared to vehicle. Blood and tissues were harvested at indicated timepoints after administration of final dose. Animals were given ad libitum access to food for the entirety of the study. (a) Reduction in body weight throughout the 7 day dosing period shown as % change from baseline, (b) terminal liver lipid percentage, (c) serum GLP-1 receptor bioactivity profiles for Cotadutide and Liraglutide treatments, (d) serum Gcg receptor bioactivity profiles for Cotadutide and g1437 treatments, (e) blood glucose levels, (f) plasma insulin levels, (g) plasma glucagon and (h) liver glycogen content. For each timepoint n=4 mice/group. Data shown as the mean ± SEM. (a, c-h) Two-way ANOVA, (b) One-way ANOVA, with Tuckey’s multiple comparison post-hoc. In (a) lines above the graph indicated differences compared with Vehicle at each time point, lines to the right indicated differences between groups at day 7. In (g) p values indicated differences compared with Vehicle at each time point for the indicated group.
Plasma insulin in the vehicle-treated group increased at 6h post-dose (Fig. 2f and Supplementary Fig. 2c) corresponding to increased food intake. Plasma Gcg was elevated in vehicle-treated animals (Fig 2g and Supplementary Fig. 2d) and reduced in Liraglutide-treated animals (Fig. 2g). In all groups treated with a therapeutic Gcg agonist, endogenous Gcg secretion was suppressed (Fig. 2g and Supplementary Fig. 2d). Liver glycogen was elevated prior to the final dose of Cotadutide and rapidly depleted by 6h post Cotadutide but rebounded to normal at 16h (Fig. 2h and Supplementary Fig. 2f). g1437 and Liraglutide+g1437 treatment produced similar rapid depletion, although less restoration of liver glycogen, while Liraglutide alone did not differ from vehicle (Fig. 2h).
Dynamic changes in liver glycogen and lipid content were evaluated using hyperglycemic clamps to induce a fed-like state and stimulate hepatic glucose uptake, glycogen synthesis and de novo lipogenesis (Fig. 3a). Hepatic glycogen depletion following Cotadutide administration was observed, as indicated by lower core glycogen levels (i.e. glycogen that has not incorporated radio-labeled glucose) (Fig. 3b and i). This is consistent with increased basal glucose production, that was preferentially generated through gluconeogenesis, and not glycogenolysis (Fig. 3c–e). Liraglutide had no impact on core glycogen, while g1437 resulted in severely depleted hepatic glycogen following fasting (Fig. 3b), consistent with GcgR activation resulting in lower glycogenolysis (Fig 3e). Glycogen synthesis, stimulated by hyperglycemia, was intact in Cotadutide-treated mice, Liraglutide augmented direct glycogen synthesis, and g1437 strongly decreased both direct and indirect synthesis (Fig. 3f–h). Importantly, hepatic glucose production in Cotadutide-treated mice was suppressed during hyperglycemia (Fig. 3j), while g1437 limited suppression of endogenous glucose production (Fig 3j–l).
Figure 3.
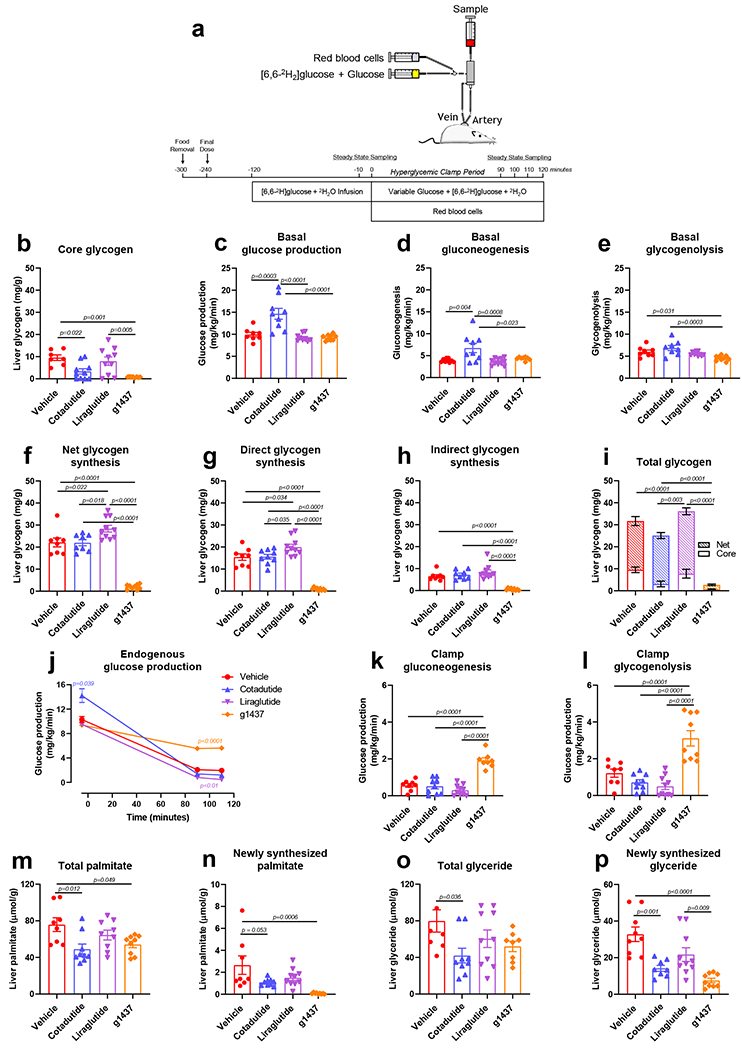
Hepatic glycogen flux following one-week treatment of DIO C57Bl6 mice with Cotadutide, Liraglutide or g1437 at equimolar dosing (10 nmol/kg, SC, QD for 7 days) compared to vehicle. (a) Experimental design showing continuous infusion of [6,6-D2]-glucose was initiated 2h following the final dose in fasted animals for 120 min to achieve steady state and then for an additional 120 min with hyperglycemia. (b) Core hepatic glycogen is the liver glycogen content that does not contain radio-labeled glucose indicating it was synthesized prior to initiation of the infusion. (c) Glucose production, (d) gluconeogenesis and (e) glycogenolysis during the fasted, basal state. (f) Net, (g) direct and (h) indirect glycogen synthesis is indicative of incorporation of glucose directly from the circulation or indirectly from diversion of gluconeogenic carbon to glycogen, respectively. (i) Total liver glycogen at the conclusion of the experiment showing the net and core glycogen contributions. (j) Endogenous glucose production, (k) gluconeogenesis and (l) glycogenolysis during the hyperglycemic clamp. (m) Total and (n) newly synthesized hepatic palmitate during 2H2O infusion. (o) Total and (p) newly synthesized hepatic glyceride during 2H2O infusion. Vehicle (n=8); Cotadutide (n=9); Liraglutide (n=10); g1437 (n=9) mice/group. Data shown as the mean ± SEM. One-way ANOVA, with Tuckey’s multiple comparison post-hoc. In (j) Two-way ANOVA, with Tuckey’s multiple comparison post-hoc and colored p-value represent difference of indicated group to vehicle.
Cotadutide reduced de novo lipogenesis during the clamp as shown by reduced palmitate and glyceride synthesis (i.e. lipids that have incorporated radio-labeled 2H2O), contributing to lower levels of total hepatic palmitate and glyceride (Fig. 3m–p). Liraglutide had no effect, but g1437 dramatically reduced lipid synthesis resulting in similar overall effect to Cotadutide (Fig. 3m–p). These novel tracer experiments demonstrate that the balance of Gcg tone and GLP-1 activity by Cotadutide allows for hepatic metabolic switching in response to glycemic status.
Metabolomic analysis revealed that at 6h post treatment, both 3-phosphoglycerate and phosphoenolpyruvate, metabolites of glycolysis/gluconeogenesis, were elevated in liver of Cotadutide-treated mice (Supplementary Table 1). All metabolites of the pentose phosphate pathway (PPP) detected were increased with Cotadutide treatment, while TCA cycle intermediates were unchanged or reduced (Supplementary Table 1). Multiple glucogenic and ketogenic amino acids were reduced in Cotadutide-treated liver compared to vehicle at 6h, along with increased AMP and ADP levels (Supplementary Table 1). These data, in the context of altered corresponding blood glucose and liver glycogen, suggest that gluconeogenic precursors may be shunted through the PPP in Cotadutide-treated mice.
To understand sub-chronic effects of Cotadutide we compared the hepatic and metabolic outcomes with Liraglutide or g1437 or the combination Liraglutide+g1437 in C57BL6J diet-induced NASH model. Cotadutide reduced body weight similarly to Liraglutide+g1437, but more than either Liraglutide or g1437 alone (Extended data 1a). A pyruvate tolerance test revealed lower glucose excursion in Cotadutide-treated animals (Extended data 1b, c). Fasted insulin was also lower in Cotadutide-treated animals compared with vehicle, Liraglutide and Liraglutide+g1437 (Extended data 1d). Fasted glucose was significantly higher in g1437-treated animals and in combination with Liraglutide (Extended data 1e). Plasma alanine aminotransferase (ALT) was significantly reduced in Cotadutide, g1437 and Liraglutide+g1437 treated animals but unchanged by Liraglutide alone (Extended data 1f). Hepatic glycogen was reduced in NASH vehicle and elevated only with Cotadutide treatment. Triglycerides were elevated with NASH and reduced in Cotadutide, g1437 and Liraglutide+g1437 treated mice (Extended data 1g, h). Hepatic cholesterol increased with NASH and reduced in the g1437 and Liraglutide+g1437 groups (Extended data 1i). Altogether, these data suggest that Cotadutide dual-agonism promotes optimal hepatic and metabolic benefits of GLP-1R and GcgR action.
Cotadutide induces hepatic phosphoproteomic changes and reveals novel targets of hepatic GcgR signaling
The hepatic phosphoproteome in response to Cotadutide was investigated in the mouse cohort presented in Supplementary Fig. 2. Phosphorylation of AMPKα and AMPKβ subunits were increased 2h and 6h after administration of Cotadutide relative to vehicle (Fig. 4a), at T490, S496 and S508 of AMPKα1, T172 and S481 of AMPKα2 and S24 and S25 of AMPKβ1 (Fig. 4a and Supplementary Table 2). Cotadutide induced changes in phosphorylation for numerous proteins involved in carbohydrate (Fig. 4b) and lipid (Fig. 4c) metabolism, including cAMP-response element binding protein (ChREBP), acetyl CoA carboxylase 2 (ACC2) and ATP-citrate lyase (ACLY) (Fig. 4c and Supplementary Table 2).
Figure 4.
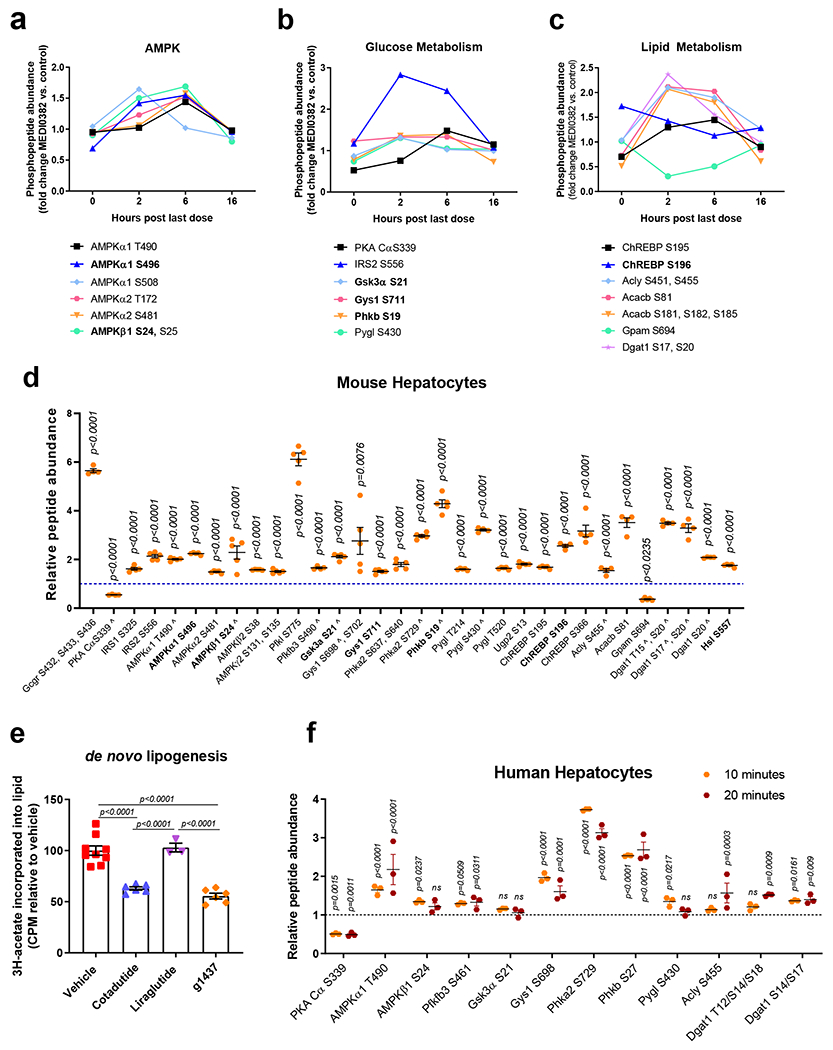
Cotadutide-induced changes in the hepatic phosphoproteome of carbohydrate and lipid metabolism-related molecules. Hepatic phospho-sites of (a) AMPKα/AMPKβ, (b) proteins involved in glucose metabolism and (c) proteins involved in lipid metabolism detected in DIO mice following repeated dosing of Cotadutide (10 nmol/kg, SC, QD for 7 days) compared to vehicle. Livers were harvested at indicated timepoints after administration of final dose. For each timepoint n=3 mice/group. Adjusted p-values from in-built ANOVA are shown in Supplementary Table 2. (d) Differential abundance of phosphopeptides detected in primary murine hepatocytes following a 10 min treatment with 100 nM g1437, a GcgR agonist. Abundance in g1437-treated cells relative to unstimulated control cells (n=5/group). The experiment was replicated on 2 separate occasions yielding similar results. Bold text indicates known PKA-targeted sites; ^ indicates homologous sites identified in human hepatocytes. (e) De novo lipogenesis in primary murine hepatocytes treated ex vivo with 100 nM Cotadutide (n=6), 100 nM g1437 (n=6) or 100 nM Liraglutide (n=3) shown as 3H-acetate lipid incorporation relative to vehicle-treated controls (n=9). Sample size indicates biologically independent experiments and data shown as the mean ± SEM. (f) Differential abundance of phosphopeptides detected in primary human hepatocytes following a 10 or 20 min treatment with 100 nM g1437. Abundance in g1437-treated cells relative to unstimulated control cells (n=3 biologically independent samples/group). d-f: data shown as mean ± SEM; d, f: vs. unstimulated controls, two-sided Student’s t-test; e: vs. vehicle controls, one-way ANOVA with Tuckey’s multiple comparison post-hoc.
We determined which phosphorylation changes detected in vivo were due to Gcg-driven signaling in hepatocytes. Numerous novel phospho-sites were detected for molecules associated with cellular metabolism (Fig. 4d). Six were reported PKA substrates (indicated in bold), including AMPK catalytic subunit α1 (p-S496), AMPK non-catalytic subunit β1 (p-S24), glycogen synthase kinase-3 alpha (Gsk3a p-S21), phosphorylase b kinase regulatory subunit beta (Phkb p-S19), ChREBP (p-S196) and hormone sensitive lipase (Hsl p-S557) (Fig. 4d, Extended data 2). We mined data compiled on PhosphoSitePlus to further interrogate the remaining sites. Twenty of the phospho-sites contain PKA consensus motifs, with an additional 11 that do not (Fig. 4d). Aside from 6 previously identified PKA targets, all but 4 of the detected phospho-sites were previously reported. Phosphorylase b kinase regulatory subunit alpha, liver isoform (Phka2 p-S640), glycogen phosphorylase, liver form (Pygl p-T214 and p-T520), and chREBP (p-S195) do not contain PKA consensus motifs, indicating they may be targets of other downstream kinases (Fig. 4d, Extended data 2). Note that phosphoproteomic analysis does not detect all phosphoproteins, and some known phosphorylation sites downstream of glucagon such as pCREB did not survive the stringent 1% FDR cut-off. However, key phosphoproteins including pPKA and pCRTC3 were detected supporting reliability of the phosphoproteomic data-set.
Multiple enzymes involved in the lipid synthesis pathway were phosphorylated following g1437 treatment including ACLY (p-S455), ACC2 (p-S81) and diacylglycerol O-acyltransferase (Dgat1, p-T15/p-S20, p-S17/p-S20 and p-S20) (Fig. 4d). Phosphorylation of these enzymes is predicted to inhibit their activity, complementary to reduce de novo lipid synthesis in primary mouse hepatocytes treated with g1437 or Cotadutide, but not Liraglutide, (Fig. 4e). Incubation with H89, a PKA inhibitor, or U73122, a phospholipase C inhibitor, failed to alleviate Cotadutide-mediated suppression of de novo lipogenesis, indicating this may not necessarily be mediated by PKA or phospholipase C (Supplementary Fig. 3). Pharmacological inhibition of other kinases (rapamycin to inhibit mTOR, SB 203580 to inhibit p38MAPK, compound C to inhibit AMPK, LY-294 to inhibit PI3K and PD98 to inhibit MAPKK) all failed to block the suppression of de novo lipogenesis induced by Cotadutide (Supplementary Fig. 3). Twelve homologous phospho-sites were detected following g1437 treatment of primary human hepatocytes (Fig. 4f) supporting the relevance of our findings in mice to human biology.
Cotadutide induces mitochondrial turnover and enhances mitochondrial function
Hepatic mitochondrial dysfunction and oxidative stress have been implicated in NASH pathogenesis, and whether Cotadutide could alter mitochondrial dynamics and function was examined in primary mouse hepatocytes. Increased number of green-labeled mitochondria within red-labeled lysosomes (here termed mitophagosomes) were observed in both Cotadutide- and g1437-treated cells compared to vehicle (Fig. 5a and b), without altering mitochondrial number (Supplementary Fig. 4).
Figure 5.
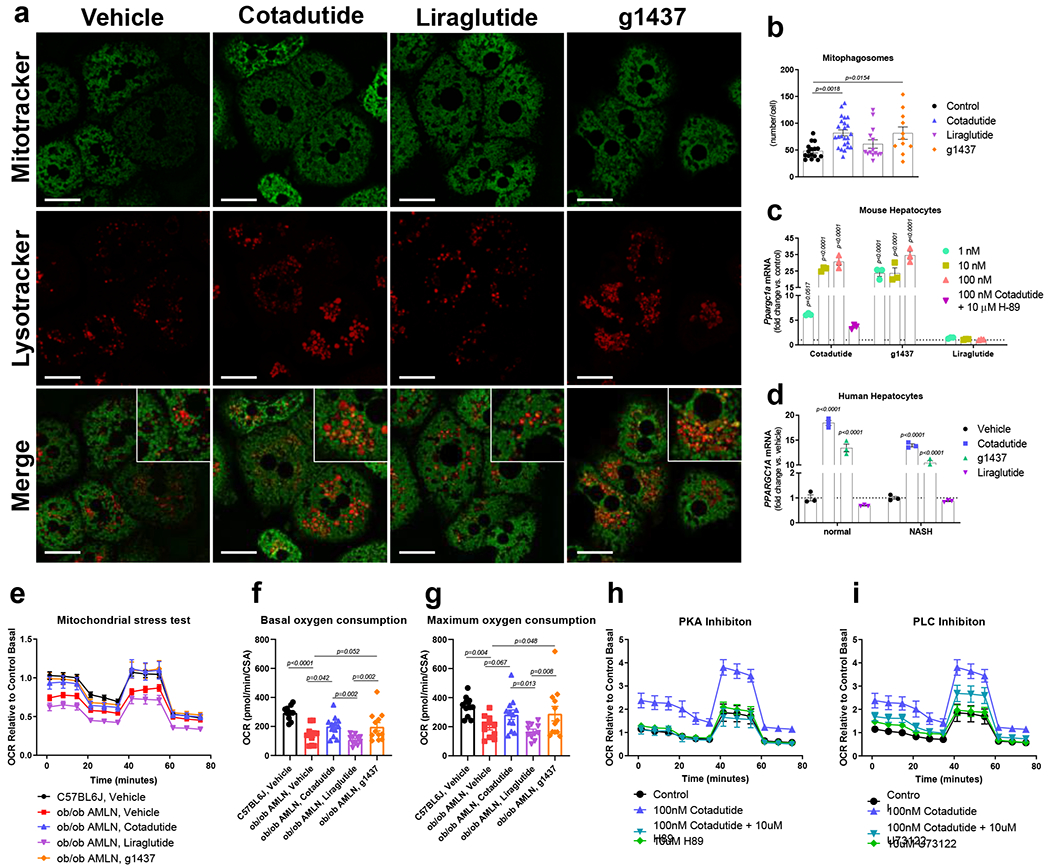
Cotadutide induces mitochondrial turnover and improves mitochondrial respiration. (a) Representative live cell confocal microscopy images showing mouse primary hepatocytes treated ex vivo with 100 nM Cotadutide, g1437 or Liraglutide for 2h and stained with Mitotracker green and Lysotracker Deep red. Scale bar = 25 μm. (b) Quantification of Lysotracker deep red puncta that contain Mitotracker green as a measure of mitophagosomes Control (n=15); Cotadutide (n=24); Liraglutide (n=14); g1537 (n=11) cells/treatment. (c) Ppargc1a mRNA levels in primary mouse hepatocytes treated with increasing concentrations (1, 10, and 100 nM) of Cotadutide, g1437, or Liraglutide for 4h. Cells were also treated with 100 nM Cotadutide plus 10 μM H89. (n=3 biologically independent samples/group) (d) PPARGC1a mRNA in primary human hepatocytes from normal or NASH donors treated with 100 nM Cotadutide, g1437, or Liraglutide for 4 h (n=3 biologically independent samples/group). (e) Oxygen consumption rate during mitochondrial stress test of primary murine NASH hepatocytes treated ex vivo for 4h with 100 nM Cotadutide (n=12) or 100 nM Liraglutide (n=11) or g1437 (n=11) compared to untreated NASH hepatocytes (n=11). Respiration of untreated primary hepatocytes from lean C57BL6J controls (n=3) also shown (Sample size indicates number of replicates from a single biological sample. The experiment was repeated 3 times yeilding similar results). (f) Basal and (g) maximal respiration from (e). (h and i) Oxygen consumption of healthy mouse primary hepatocytes treated with Cotadutide +/− PKA inhibitor, H89 (h; 10 uM) or PLC inhibitor, U73122 (i; 10 uM) (n=6 replicates for a single biologically sample. The experiment was repeated 3 time yeilding similar results). All data shown as the mean ± SEM. (b-d) vs. vehicle controls, one-way ANOVA with Dunnett’s multiple comparisons post-hoc test; (f, g) Two-sided student’s t-test for C57BL6J, vehicle vs. ob/ob AMLN, vehicle to determine effect of dieat and one-way ANOVA with Tukey’s multiple comparisons post-hoc, C57BL6J, vehicle group excluded.
The transcriptional induction of the mitochondrial biogenesis regulator PPARGC1A (also known as PGC-1α) downstream of Gcg and PKA signaling is known. Cotadutide and g1437 equally increased Ppargc1a mRNA in a concentration-dependent manner, via PKA signaling (Fig. 5c). Other genes known to be induced downstream of GcgR and PKA activation, G6pc and Pck1, were also induced by Cotadutide and g1437 (Extended data 3). In primary human hepatocytes from both healthy and NASH donors, Cotadutide and g1437significantly increased PPARGC1A transcript levels (Fig. 5d). Liraglutide had no effect (Fig. 5c and d).
It was examined whether Cotadutide-mediated improvement in mitochondrial maintenance benefited mitochondrial function. Hepatocytes from ob/ob NASH mice displayed significantly reduced basal and maximal oxygen consumption rate (OCR) compared to lean controls (Fig. 5e, f), as previously observed23,24. Ex vivo treatment with Cotadutide or g1437, but not Liraglutide, restored basal and maximal respiratory rates in NASH hepatocytes to similar levels as normal controls (Fig. 5e, f). Treatment of healthy mouse primary hepatocytes with Cotadutide or g1437 also increased basal and maximal respiration rates (Extended data 4a–c). Ex vivo treatment with Cotadutide or g1437 had no effect on fuel preference (Extended data 4d). This improved mitochondrial function was mediated by GcgR downstream signaling. When PKA, PLC, p38MAPK and AMPK were inhibited, Cotadutide was unable to increase OCR in the hepatocytes (Fig. 5g–h and Extended data 4e–f and Supplementary Fig. 5a–d). Whereas, inhibition of mTOR or non-GcgR mediated pathways including MAPKK and PI3K resulted in the normal Cotadutide-induced increase in OCR (Extended data 4g–I and Supplementary Fig. 5e–g). These data demonstrate that Cotadutide increases mitochondrial turnover and improves mitochondrial oxidative capacity directly via GcgR signaling.
Superior efficacy of Cotadutide to alleviate NASH in vivo
Cotadutide treatment was compared to Liraglutide and the synthetic bile acid and farnesoid X-receptor (FXR) agonist Obeticholic acid (OCA) in a physiologically relevant mouse model of NASH. Cotadutide and Liraglutide doses were deliberately adjusted to achieve similar weight loss, ~8% from baseline, while OCA had a lesser effect with only ~3% reduction (Fig 6a). Both Cotadutide and Liraglutide reduced food intake within the first 4 days, with OCA having no effect (Fig. 6b). Glucose tolerance was significantly improved by Cotadutide more so than Liraglutide or OCA (Fig. 6c–d). Plasma insulin increased at 15 min in Cotadutide vs. Liraglutide group during the GTT, while OCA had no effect (Fig. 6e).
Figure 6.

Superior efficacy of Cotadutide on NASH endpoints in C57BL6/J mice fed AMLN diet for 29 weeks compared to Liraglutide and Obeticholic acid. Effect of sub-chronic Cotadutide (10 nmol/kg, SC, QD for 6 weeks), Liraglutide (40 nmol/kg, SC, QD for 6 weeks) or Obeticholic acid (OCA, 70 μmol/kg, PO, QD for 6 weeks) compared to vehicle or lean chow-fed mice. (a) Body weight expressed as change in body weight from baseline (%). (b) Cumulative food intake over the first 4 days of dosing. (c) Blood glucose profile following intraperitoneal injection of 1.5 mg/kg glucose after 4 weeks of dosing. (d) Area under the GTT curve. (e) Time 0 and 15 min plasma insulin levels during GTT. (f) Terminal liver weight normalized to body weight. (g) Terminal plasma ALT. (h) Hepatic glycogen levels. Serum and liver levels of total lipid species of (i) triglycerides, (j) diacylglycerols, (k) cholesterol esters, and (l) free fatty acids. (m) Representative type I collagen-stained liver sections. Scale bar = 200 μm. Responder rate (number of mice to exhibit improved vs. no change vs. higher) for (n) steatosis, (o) inflammation, (p) ballooning, (q) NAFLD activity score (NAS) and (r) fibrosis, shown as number of mice per group and evaluated by comparing scores from terminal vs. pre-study biopsy liver sections. Chow (n=9); Vehicle (n=12); Cotadutide (n=12); Liraglutide (n=12); OCA (n=12) mice/group. Data represented as mean ± SEM. (a, b, c) vs. vehicle controls, two-way repeated measures ANOVA followed by Dunnett’s multiple comparisons post-hoc test; (d-l) Two-sided Student’s t-test for chow controls vs. vehicle to determine effect of NASH diet; one-way ANOVA, with Tuckey’s multiple comparison post-hoc, chow group excluded; (n-q) vs. vehicle, Chi-square test for pairwise comparisons to vehicle.
Terminal non-fasted blood glucose, and plasma insulin, triglycerides, cholesterol, and aspartate aminotransferase (AST) were increased with NASH (Supplementary Table 3). OCA reduced plasma cholesterol, while Cotadutide and Liraglutide reduced glucose and cholesterol vs. vehicle (Supplementary Table 3). NASH increased liver mass (Fig. 6f) and plasma ALT (Fig. 6g). Liraglutide reduced liver mass and ALT levels, with OCA only reducing liver mass vs. vehicle (Fig. 6f–g). Cotadutide reduced ALT levels (Fig. 6f–g) while the increase in hepatic glycogen (Fig. 6h) likely accounted for unchanged liver mass in the face of reduced liver lipids (Fig. 6i–l). Metabolomics analysis demonstrated increased hepatic glycogen synthesis/degradation intermediates following Cotadutide treatment (Supplementary Fig. 6).
Serum and liver lipidomics revealed NASH reduced serum, but increased hepatic, levels of triglycerides (TAG), diglycerides (DAG), cholesterol esters (CE) and free fatty acids (FFA) compared to controls (Fig. 6i–l). All therapeutic treatments resulted in reduction of hepatic TAG, DAG and FFA (Fig. 6i, j and l), and serum and hepatic CE, with Cotadutide having a more profound effect than Liraglutide and a similar effect to OCA (Fig. 6k).
Hepatic fibrosis is a key characteristic of NASH pathogenesis. NASH mice exhibited stable fibrosis, during the treatment period, with 1/12 animals (8.3%) showing worsened fibrosis.(Fig. 6r and Supplementary Fig. 7 and 8) All treatments induced reductions in fibrosis to some degree: Liraglutide and OCA groups had 1/12 animals (8.3%) and Cotadutide had 3/12 (25%) with reduced fibrosis (Fig. 6r and Supplementary Fig. 7 and 8). Cotadutide was the only treatment where no animals had worsened fibrosis (Fig. 6r and Supplementary Fig. 7 and 8). Unlike humans, ‘hepatocyte ballooning’ is extremely rare in rodent NASH models and thus the NAS is predominately driven by steatosis and inflammation. Both Cotadutide and OCA had significantly more animals with lower steatosis and inflammation scores and overall NAS (Fig. 6n–q; Supplementary Fig. 7 and 8). Transcriptome signatures specific to metabolism were enriched in chow controls compared to NASH mice (Supplementary Fig. 9 and Supplementary Table 4 and 5). Cotadutide treatment was significantly different compared to NASH vehicle for peroxisome pathway (Supplementary Fig. 9a and Supplementary Table 5). Biocarta signatures related to inflammation and fibrosis showed significant differences between control and NASH mice in IL-17 pathway, fibrinolysis pathway, IL-12 pathway and platelet-derived growth factor (Pdgf) pathway (Supplementary Fig. 9b and Supplementary Table 5). Liraglutide and OCA treatment had no significant impact on any pathway, while Cotadutide trended to impact the IL-17 and the fibrinolysis pathways vs. NASH vehicle (Supplementary Fig. 9b and Supplementary Table 5). Signatures for transforming growth factor β (Tgfβ) signaling, interferon-α response, inflammatory response and apoptosis were all significantly different between controls and NASH (Supplementary Fig. 9c and Supplementary Table 5). Cotadutide and OCA groups showed more separation on the PCA plot from NASH vehicle, while Liraglutide-treated animals did not separate (Supplementary Fig. 9d).
Cotadutide is more effective at reducing hepatic steatosis
The effect of Cotadutide was examined on metabolic and liver endpoints in a more severe ob/ob mouse NASH model, compared to vehicle controls (AMLN, vehicle), Liraglutide and a control group switched back to low-fat diet (LFD) and administered vehicle. Again, Cotadutide (30 nmol/kg) and Liraglutide (40 nmol/kg) were dose-adjusted to achieve similar weight loss ~7-8% from baseline (Fig. 7a). Switching from AMLN to LFD transiently prevented weight gain between days 15-20 only (Fig. 7a). There were no differences in body composition between groups (Fig. 7b). Cotadutide- and Liraglutide-treated animals had similar improved glucose control compared to AMLN, vehicle (Fig. 7c and d). NASH induction increased fed plasma insulin, TAGs, and cholesterol, with Cotadutide and Liraglutide reducing plasma cholesterol (Supplementary Table 6). Liver mass was increased with NASH and similarly reduced by Cotadutide and Liraglutide (Fig. 7e).
Figure 7.
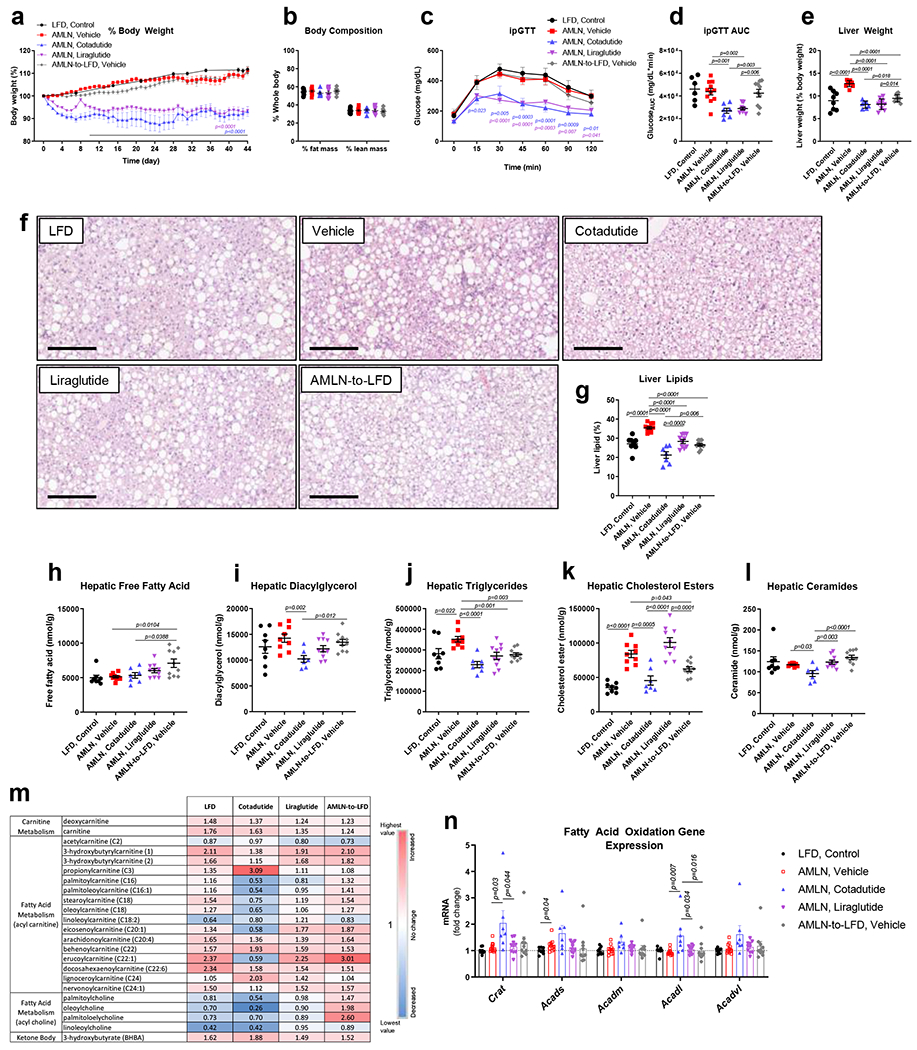
Superior reductions in liver lipid with Cotadutide versus Liraglutide in ob/ob AMLN mouse model of NASH. Effect of sub-chronic Cotadutide (30 nmol/kg, SC, QD for 6 weeks), Liraglutide (40 nmol/kg, SC, QD for 6 weeks) or reversion from NASH-inducing diet to LFD (AMLN-to-LFD) in male ob/ob AMLN NASH mice compared to untreated ob/ob LFD controls and vehicle-treated AMLN NASH mice. (a) Body weight expressed as change in body weight from baseline (%). (b) Body composition expressed as percent lean and fat mass. (c) Blood glucose profile following intraperitoneal injection of 1.5 mg/kg glucose after 4 weeks of dosing and (d) area under the glucose curve. (e) Terminal liver weight shown as percentage of body weight. (f) Representative H&E-stained liver sections. Scale bar = 200 μm. (g) Terminal percent liver lipid content. Terminal hepatic concentration of (h) free fatty acid, (i) diacylglycerol, (j) triglyceride, (k) cholesterol esters, and (l) ceramide. (m) Hepatic fatty acid metabolism-related metabolite levels relative to vehicle-treatment. (n) Hepatic mRNA expression of fatty acid oxidation genes. LFD (n=8); Vehicle (n=11); Cotadutide (n=7); Liraglutide (n= 10); AMLN-to-LFD, Vehicle (n=10) mice/group. Data represented as the mean ± SEM. (a, c) Two-way repeated measures ANOVA followed by Dunnett’s multiple comparisons post-hoc test vs. vehicle controls; (b, d, e, g-l, n) Two-sided student’s t-test for vehicle vs. LFD to determine effect of NASH diet and One-way ANOVA, with Tuckey’s multiple comparisons post-hoc, LFD group excluded.
Macro and microsteatotic lipid droplets were increased in NASH but reduced by Cotadutide (Fig. 7f), complementary to a more significant reduction in hepatic lipid content compared to Liraglutide and diet-switch (Fig 7g). TAGs and CEs, but not FFAs, DAGs, or ceramides, were increased in AMLN vehicle vs. LFD mice (Figs. 7h–l). FFAs were increased by diet-switching (Fig. 7h). All treatments reduced hepatic TAGs, but only Cotadutide additionally reduced DAGs and ceramides vs. vehicle (Figs. 7i, j, l). Long chain acyl carnitine species were increased in LFD controls but decreased in Cotadutide-treated mice compared to vehicle (Fig. 7m and Supplementary Table 7).
Metabolomics indicated propionylcarnitine, a product of amino acid catabolism, was increased in Cotadutide-treated livers compared to vehicle (Fig. 7m). Ketone body 3-hydroxybutyrate was increased in LFD and with all treatments compared to vehicle, but highest with Cotadutide (Fig. 7m and Supplementary Table 7). Levels of glycolysis and gluconeogenesis pathway metabolites did not differ between groups (Supplementary Fig. 10). Similarly, TCA cycle intermediates were unchanged, except for higher citrate and aconitate in the diet-switch group (Supplementary Fig. 10). Cotadutide also elicited specific changes in hepatic phospholipid, ceramide and glycerolipid moieties versus vehicle control and other treatment groups (Supplementary Tables 8a and b). Unique significant differences in hepatic amino acid levels were mediated by Cotadutide with arginine, asparagine and glutamine reduced vs. vehicle, while glutamate and urea increased (Supplementary Table 9).
Hepatic expression of genes involved in fatty acid oxidation tended to be higher in the Cotadutide group (Figure 7n). Furthermore, mice with diet-induced NASH had reduced Ppargc1a, but sub-chronic treatment with Cotadutide restored mRNA levels to those of LFD control along with significantly increased expression of genes associated with mitochondrial biogenesis and turnover (Supplementary Fig. 11). PCA analysis of the transcriptome revealed separation between treatment groups (Supplementary Fig. 12b). Signatures specific to metabolism including fatty acid and peroxisomal metabolism were significantly enriched in LFD controls compared to vehicle (Supplementary Fig. 12 and Supplementary Table 10). Cotadutide treatment was also associated with enrichment of these pathways in addition to oxidative phosphorylation pathways (Supplementary Fig. 12 and Supplementary Table 10).
Cotadutide resolves hepatic fibrosis and inflammation in ob/ob AMLN NASH mice
Hepatic fibrosis was significantly increased in AMLN vehicle mice relative to LFD controls. Cotadutide lowered collagen staining by ~17%, although this was not statistically significant due to one unresponsive mouse (Fig. 8a–b). Plasma ALT was lowered by Cotadutide (Fig. 8c), as was liver α-smooth muscle actin (αSMA), picrosirius red (PSR) and hydroxyproline (Fig. 8d–f and Extended data 5). Liraglutide also lowered liver αSMA, PSR and hydroxyproline (Fig. 8d–f and Extended data 5). NAS was significantly increased in AMLN vehicle animals relative to LFD controls, and reduced by Cotadutide as well as LFD switch (Fig. 8g and Extended data 6). CD68 scoring, as a marker of immune cell infiltration, was significantly increased in NASH vehicle mice but only reduced by Cotadutide treatment (Extended data 7). The fibrosis stage was higher in AMLN vehicle relative to LFD and was improved only by Cotadutide treatment (Fig. 8h).
Figure 8.
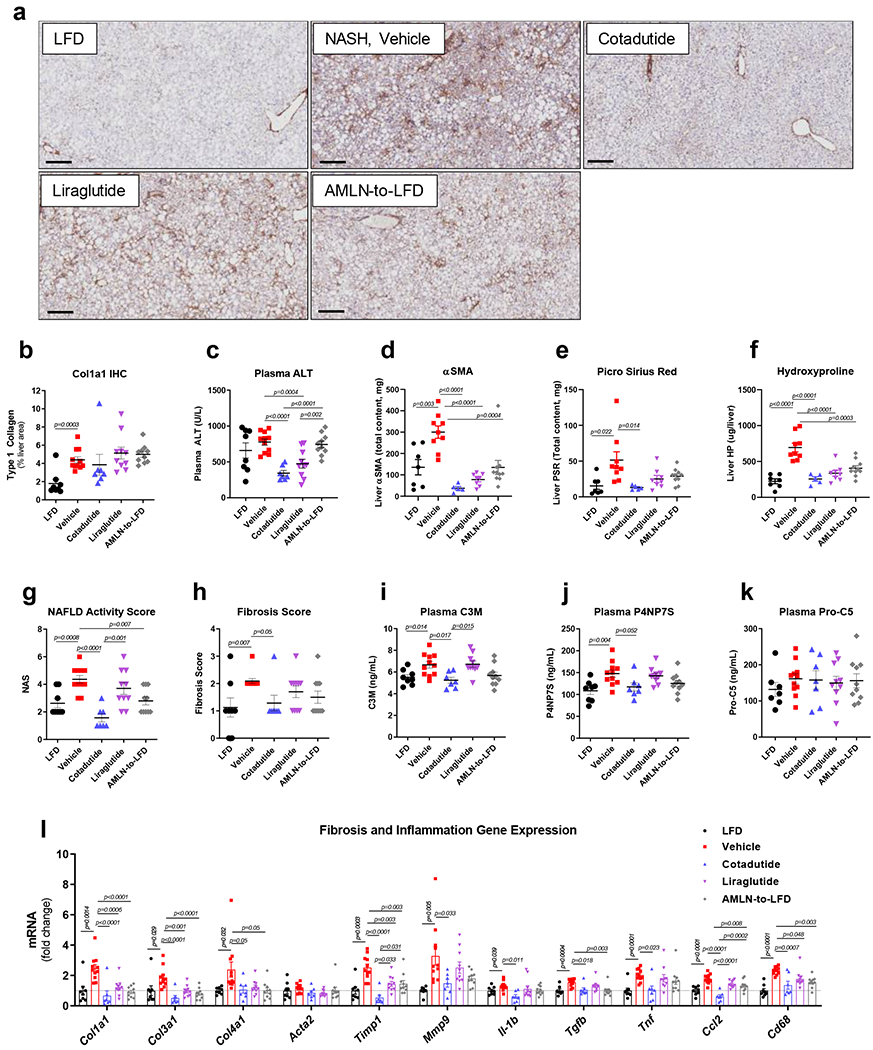
Cotadutide further reduces hepatic fibrosis and inflammation compared to Liraglutide or diet switch in ob/ob AMLN mouse model of NASH. Effect of sub-chronic Cotadutide (30 nmol/kg, SC, QD for 6 weeks), Liraglutide (40 nmol/kg, SC, QD for 6 weeks) or reversion to LFD on fibrosis endpoints from male ob/ob NASH mice. (a) representative type-I collagen stained liver sections. Scale bar = 200 μm. (b) quantification of Col1a1 staining in a. (c) Plasma ALT levels. (d) Quantification of αSMA staining, representative images in Supplementary Fig. 14. (e) Quantification of PSR staining, representative images in Supplementary Fig. 14. (f) Liver hydroxyproline content. (g) NAFLD activity scores. (h) fibrosis scores. Quantification of plasma levels of (i) C3M, a type III collagen peptide fragment, (j) P4NP7S, a type IV collagen pro-peptide fragment and (k) pro-C5. (l) Hepatic transcript levels of fibrosis- and inflammation-related genes. LFD (n=8); Vehicle (n=11); Cotadutide (n=7); Liraglutide (n= 10); AMLN-to-LFD (n=10) mice/group. Data represented as the mean ± SEM. Two-sided student’s t-test for vehicle vs. LFD to determine effect of NASH diet. One-way ANOVA, with Tuckey’s multiple comparison post-hoc, LFD group excluded, for treatment effects.
Plasma levels of C3M, a neo-epitope fragment of type III collagen cleaved during degradation and circulating levels of P4NP7S, an internal epitope derived from the basement membrane collagen type 4 upon formation, were increased in NASH and only reduced in Cotadutide-treated mice (Fig. 8i and j). Levels of pro-C5, a type V collagen pro-peptide marker, were not altered (Fig. 8k).
Biocarta signatures related to inflammation and fibrosis showed significant changes in IL-12 pathway, IL-17 pathway, Th1Th2 pathway in LFD controls and Cotadutide compared to NASH vehicle. (Supplementary Fig. 13a and Supplementary Table 10). The Tgfβ IL-4 and IL-6/Jak/Stat3 pathways also tended to be impacted by Cotadutide treatment (Supplementary Fig. 13a and Supplementary Table 10). Hallmark apoptosis and inflammatory response signatures were significantly enriched in AMLN vehicle animals compared to LFD and Cotadutide. In addition, Cotadutide transcriptome was different to vehicle for the tumor necrosis factor-α (Tnfα signaling via nuclear factor κ-light-chain-enhancer of activated B cells (NFκB) pathway (Supplementary Fig. 13b and Supplementary Table 10).
Quantitative-PCR analysis confirmed transcriptomic analyses. Furthermore, hepatic transcript levels of collagens (Col1a1, Col3a1, Col4a1), regulators of collagen turnover (Timp1, Mmp9) and inflammatory mediators (Il-1b, Tgfb, Tnf-α, Ccl2 and Cd68) were all increased in AMLN vehicle compared to LFD controls (Fig. 8l). Cotadutide, Liraglutide and diet switching all significantly reduced levels of Col1a1, Col3a1, Timp1, Ccl2, and Cd68 relative to AMLN vehicle treatment, but with Cotadutide-treated mice showing the greatest reduction and uniquely reducing Mmp9, Il-1b and Tnf (Fig. 8l).
DISCUSSION
NASH is an unmet medical need and future therapies will need to resolve NASH features (steatosis, inflammation, hepatocyte ballooning) and either reduce or not worsen hepatic fibrosis. Here, the GLP-1R/GcgR dual agonist, Cotadutide (MEDI0382), reduced steatosis, inflammation and fibrosis in two distinct mouse models of NASH, in addition to weight loss, improved glucose homeostasis and endogenous insulin production. Liraglutide, a GLP-1 monoagonist, induced equivalent weight loss, however hepatic benefits were greater with Cotadutide attributable to additional engagement of GcgR. Cotadutide inhibited hepatic lipogenesis, enhanced mitochondrial turnover and oxidative capacity to similar levels induced by monoagonism of GcgR by g1437 (lipidated/long-acting Gcg agonist), suggesting this effect was mediated through Cotadutide’s Gcg component. These pleiotropic effects of Cotadutide, and clinical data showing that Cotadutide significantly reduces liver fat in T2DM,11 suggests that Cotadutide may be a viable therapeutic option for the treatment of NAFLD/NASH.
Temporal assessment of endogenous Gcg and hepatic glycogen content showed an inverse relationship to Cotadutide exposure levels. Since Cotadutide resolved glucose homeostasis, its therapeutic Gcg component more likely suppressed endogenous Gcg rather than changes in glucose per se. Liver glycogen content was rapidly depleted 2h and 6h after Cotadutide dosing but then rebounded back above normal at 16h post-dose, inversely proportional to Cotadutide pharmacokinetics. However, a reduction in food intake may partially contribute to a reduction in hepatic glycogen, but treatment with Liraglutide matched to give similar reduced food intake did not change liver glycogen content. Indeed, g1437 elicited similar glycogen depletion without impacting food intake. Therefore, enhanced liver glycogen flux mediated by Cotadutide is directly through GcgR signaling. During a hyperglycemic clamp, fasted Cotadutide-treated mice also exhibited increased gluconeogenesis to stabilize glycemia. Maintenance of pancreatic β-cell function via GLP-1 action allowed the liver to switch to glycogen synthesis upon hyperglycemia, that was absent in g1437 treated animals. Likewise, metabolites associated with glycogen synthesis and glycogenolysis were significantly increased by Cotadutide. This physiologic regulation of hepatic glycogen flux likely contributes to the mechanism of improved glucose homeostasis by Cotadutide in T2DM.11,13
A key pathological feature of NAFLD/NASH is excess hepatic lipid accumulation,3 caused by excess supply of metabolic substrates leading to chronic generation of potential toxic lipid species (e.g. ceramides) and increased de novo lipogenesis.22 Cotadutide effectively reduced the levels of lipotoxic species in NASH mice, and reduced de novo lipogenesis in vivo and in vitro. Numerous Gcg-induced signaling mechanisms related to lipogenesis and lipid handling pathways were revealed in complementary murine and human hepatocyte phosphoproteomic analyses. Several novel sites of phosphorylation on key proteins were identified, some involved in Gcg signaling and negative control of insulin signaling (GcgR, PKA catalytic subunit, IRS1/2), while others are involved in carbohydrate and lipid metabolism (Acly, ACC2, Gpam, Dgat1) and account for inhibition of hepatic lipogenesis by Cotadutide and Gcg. Increased expression of gluconeogenic genes were observed, in line with the known action of Gcg to activate CREB via PKA, and subsequent PPARGC1A transcription. Although AMPK phosphorylation may inhibit gluconeogenic gene expression24,25 it is apparent that the induction of PPARGC1A by Cotadutide/Gcg over-ruled AMPK in this regard. These findings represent novel insight in Gcg action in hepatocytes and unveils mechanisms whereby Gcg halts hepatic anabolic processes (like lipogenesis) while activating catabolic glycogenolysis, lipolysis and ketogenesis. Specific kinase(s) responsible for some of the novel Gcg-dependent phosphorylations, downstream of PKA, and their functional consequence on regulation of de novo lipogenesis require further experimentation to be elucidated, and alternative signaling mechanisms should not yet be ruled out.
Cotadutide augmented mitochondrial turnover resulting in an overall more functional mitochondrial population reflected by increased hepatocyte oxidative capacity. This was mediated by the Gcg component of Cotadutide as pharmacological inhibition of GcgR signaling blocked both the elevated basal and maximal oxygen consumption rate (OCR) induced by Cotadutide. This improvement in mitochondrial respiration complements in vivo data showing increased oxygen consumption and reduced respiratory exchange ratio in mice treated with Cotadutide.13 Collectively this indicates that increased energy expenditure along with preferential fat oxidation in vivo is mediated through the enhanced mitochondrial maintenance and function.13 Moreover, together with Cotadutide-induced inhibition of hepatic de novo lipogenesis, this increase in mitochondrial function mediated by Cotadutide represents a major mechanism that resolves hepatic steatosis in NASH mice.
The pathogenesis of hepatic fibrosis in the context of NASH is thought to be the result of prolonged inflammation and activation of resident stellate cells to activated, collagen-secreting, myofibroblasts. Fibrosis is a key histopathological feature associated with morbidity and mortality in NASH patients.26 Transcriptional, biochemical and histologic data shown here suggest that Cotadutide mitigated hepatic inflammation and improved fibrosis. Indeed, Cotadutide administration in the ob/ob AMLN NASH model, with the more severe hepatic fibrosis, was associated with reduced hepatic collagen, α-SMA and PSR, hydroxyproline content, circulating collagen markers, and suppression or normalization of multiple inflammatory and pro-fibrotic genes. However, neither GcgR nor GLP-1R are expressed in human Kupffer or stellate cells, suggesting that the anti-inflammatory/anti-fibrotic effects of Cotadutide are likely not mediated on these cell types directly. More likely, the reduction in hepatic steatosis and improved mitochondrial function induced by Cotadutide, combined with the weight loss and restored glucose homeostasis, precedes, and indirectly leads to, reduced inflammation and less activation of stellate cells allowing for remodeling and resolution of the extracellular matrix. Regardless, the Cotadutide-induced reversal of fibrosis in our preclinical models is unprecedented and supportive of current clinical trials in NASH patients.
Indeed, the combination of metabolic and NASH benefits provided by Cotadutide supports its use as a NASH therapy over GLP-1R monoagonist Liraglutide or the FXR agonist OCA, two therapies with positive Phase 2 clinical data.27,29 In the LEAN trial more patients treated with Liraglutide vs. placebo exhibited resolution of NASH (39% vs. 9%, respectively), and also improved fibrosis stage (26% vs. 14%).27 Likewise, in the FXR ligand for non-cirrhotic, non-alcoholic steatohepatitis (FLINT) trial, more patients receiving OCA showed a reduction in NAS versus placebo (20% vs. 12%, respectively) and fibrosis stage (35% vs. 17%), however, other metabolic comorbidities including obesity and diabetes were not impacted.28 In our preclinical model, NAS was reduced in more mice treated with Cotadutide (83%), compared to OCA (75%), Liraglutide (42%), and vehicle controls (8%). Further, Cotadutide improved fibrosis stage (25% of animals) with no worsening, versus only 8% for each of the OCA and Liraglutide groups, with some mice exhibiting worsened fibrosis. Thus, Cotadutide appears superior to OCA and Liraglutide in this mouse model for NASH resolution and improvement in fibrosis, especially in the context of similar body weight loss compared with Liraglutide. Furthermore, in the more severe ob/ob AMLN NASH model, fibrosis was resolved in all but one of Cotadutide-treated mice and associated with improved NAS versus other treatment arms, again in the context of equivalent weight loss. These results underscore the potential impact of Cotadutide with its pleiotropic mechanisms of action not only on NASH hepatopathology but also on metabolic comorbidities. This is in contrast to more focused hepatic targeting approaches to treat only NASH29, where combination with other therapeutics will be likely be needed to address the wider metabolic disease state.
In summary, in characterizing Cotadutide effects in the liver we have gained novel mechanistic insight into the pathogenesis of NAFLD/NASH. The dual GLP-1R/GcgR action of Cotadutide positively impacts key metabolic and pathological components of NASH in part through mitigating features that drive hepatocellular injury including nutrient oversupply, toxic lipid species generation, mitochondrial dysfunction and, importantly, fibrosis (Fig. 9). These effects are unique to the dual action of Cotadutide, as GLP-1 alone only produced modest hepatoprotective effects despite similar weight loss and glycemic control. As such, Cotadutide represents a promising distinctive therapeutic approach for obese and/or T2DM patients with NAFLD/NASH comorbidities.
Figure 9.
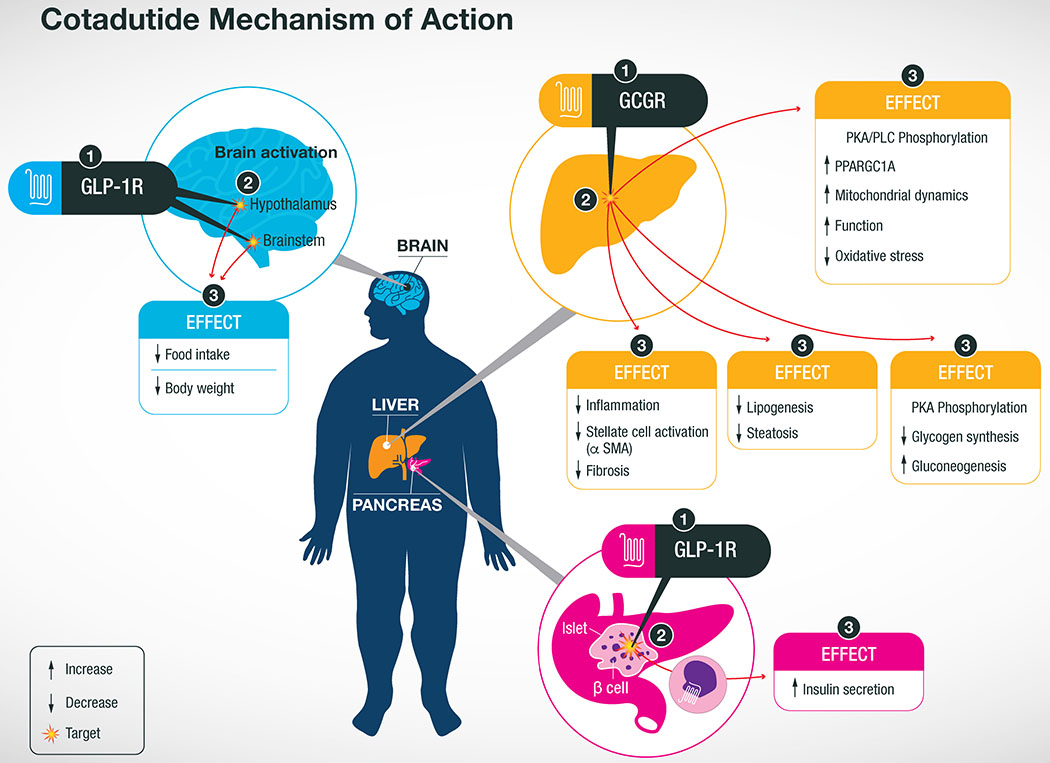
Summary of Cotadutide mechanism of action at target organs.The dual-agonist activity of Cotadutide acts at the GLP-1R in the brain to inhibit appetite resulting in decreased food intake and body weight loss. Meanwhile the GLP-1R agonist activity at the pancreatic β-cells increases insulin secretion to improve whole body glucose control. Cotadutide also acts at the GcgR of hepatocytes in the liver to improved mitochondrial maintenance and function leading to lower levels of oxidative stress. GcgR signaling in the liver also decreases de novo lipogenesis and glycogen synthesis resulting in lower lipid content a greater flux of glucose through the liver. Altogether, these action in the liver reduces inflammation and stellate cell activation resulting in less fibrosis, a major hallmark of NASH morbidity and mortality. Although these observations originated from preclinical studies in mouse models of NASH, these effects are being replicated in clinical studies of T2D patients.
Materials and Methods
Animal studies.
Animal studies were approved by either the Institutional Animal Care and Use Committee at MedImmune/AstraZeneca (Gaithersburg, MD, USA) or Vanderbilt University (Nashville, TN, USA) in accordance with Animal Welfare Act guidelines, or Gubra (Hørsholm, Denmark) under personal licenses issued by the Danish Committee for Animal Research. Details regarding power calculations and sample size selection are included in the Reporting Summary. Animals were housed in standard caging at 22°C on a 12h light:dark cycle.
GLP-1R KO study.
Male GLP-1R knock-out (KO) mice and C57Bl/6J Wild-type (WT) littermates (Jackson Laboratories, Bar Harbor, ME), 7-10 weeks of age, were maintained on 60% high fat diet (D12492; Research Diets, New Brunswick, NJ) for 8 weeks to establish obesity. Mice were then switched to 45% high fat diet (D12451; Research Diets) for ease of food intake measurements and acclimated to the new diet for 2 weeks. Mice were randomized to drug treatment groups (n=7-9) based on body weight and then administered either vehicle [50 mM phosphate buffer, propylene glycol (1.85% w/v), 0.04% PS-80, pH 7.5], Cotadutide (10 nmol/kg), Liraglutide (10 nmol/kg), g1437 (10 nmol/kg) or a combination of Liraglutide+g1437 (5+5 nmol/kg). Vehicle and test agents were administered subcutaneously once daily for 14 days. An intraperitoneal glucose tolerance test was performed on day 12 after a 4h fast (1.25 g/kg glucose) and body composition was measured by MRI on day 14.
Cotadutide Time course study in DIO C57Bl/6J.
To understand the temporal effects associated with Cotadutide treatment, a separate study utilizing 20-week old C57Bl/6J diet induced obese (DIO) male mice (Jackson Laboratories) was performed. Animals were dosed with vehicle or Cotadutide (10 nmol/kg), Liraglutide (10 nmol/kg), g1437 (10 nmol/kg) or a combination of Liraglutide+g1437 (5+5 nmol/kg) 2h prior to lights out at 16:00, for 6 consecutive days. On the 7th day, animals were euthanized at time 0, or received a final dose and euthanized at 2, 6, or 16 h post final dose (n=4 mice/group/timepoint). Blood was collected via cardiac puncture and livers were excised, weighed and processed for further analysis. All animals had ad libitum access to food for the study entirety. This study is a replication of a separate study consisting of only vehicle and Cotadutide treated mice presented in Supplementary Fig. 2.
Hyperglycemic clamp and stable isotope infusions in DIO C57Bl6J.
This is the first study to perform carbohydrate and lipid tracing, with radiolabeled glucose and water, in a single animal under such clamp conditions. Mice were maintained on a modified light/dark cycle such that light cycle was between midnight and noon to allow for appropriately timed dosing and subsequent clamp experiment. Twenty-week old C57Bl/6J DIO male mice (Jackson Laboratories) were dosed with vehicle or Cotadutide (10 nmol/kg), Liraglutide (10 nmol/kg) or g1437 (10 nmol/kg) 2h prior to lights out at 10:00 am for 6 consecutive days (n=8–10). Five days prior to the clamp, mice underwent arterial and venous catheterization30–32. On the 7th day of treatment, animals were 5h-fasted (starting at 9 am) and received a final dose at 10 am (Fig. 3a). After 3h of fasting, an arterial blood sample was obtained to determine natural isotopic enrichment of plasma glucose. Immediately following this sample, a quantitative stable isotope delivery to increase isotopic enrichment above natural isotopic labeling was initiated.33 A [6,6-2H2]Glucose-2H2O (99.9%)-saline bolus was infused for 25 min to enrich total body water to 4.5% and provide a glucose prime (80 mg kg−1) (t=−120 min to −95 min). A continuous infusion of [6,6-2H2]glucose (t=−95 min to 0 min; 0.8 mg kg−1 min−1) was started following the [6,6-2H2]Glucose-2H2O-saline prime. The hyperglycemic clamp was initiated at t=0 min with a variable infusion of glucose ((50% dextrose + 2H2O (0.04 MPE) +[6,6-2H2]Glucose (0.08 MPE)), to induce stable hyperglycemia (250–300 mg/dL) and stable enrichment of 2H2O and [6,6-2H2]Glucose in plasma. Arterial glucose levels were monitored every 10 min to provide feedback for adjustment of the glucose infusion rate (GIR). Steady state blood sampling for glucose kinetics was performed at −10 and +90-120 min of hyperglycemia. Red blood cells were continuously infused during the hyperglycemic period to maintain hematocrit. At t=120 min, mice were sacrificed, and liver tissue immediately frozen in liquid nitrogen. The experimental design is presented in Fig. 3a. Stable isotopes were purchased from Cambridge Isotope Laboratories, Inc. (Tewksbury, MA). Each infusate was prepared in a 4.5% 2H 2O-enriched saline solution.
Plasma glucose enrichments ([6,6-2H2]Glucose), isotopomer distribution and the enrichment ratio of deuterium on the fifth (C5) and second carbon (C2) of glucose were assessed by GC-MS.34,35 Each plasma sample collected during the study was chemically derivatized so as to obtain di-O-isopropylidene propionate, aldonitrile pentapropionate, and methyloxime pentapropionate derivatives of glucose.
Liver glycogen was digested by amyloglucosidase36 and glucose mass and enrichments were assessed in the homogenate in the same manner. To determine 2H2O in plasma, the sample is spiked with acetone and NaOH. After exchange, 2H-enriched acetone is extracted with chloroform and assayed by gas chromatography–mass spectrometry.37 Hepatic palmitate and glyceride enrichments and content were assessed in saponified extracts spiked with internal standards (1,1,2,3,3-2H2]Glycerol and Heptadecanoic acid)32,38. Glucose fluxes were assessed using non–steady-state equations (volume of distribution of glucose= 130 ml/kg).31 The contribution of gluconeogenesis was assessed as the ratio of C5 and C2 of plasma glucose.39,40 Direct hepatic glycogen synthesis ([6,6-2H2]Glucose in glycogen=liver glycogen mass (mg/g)* (glycogen [6,6-2H2]Glucose MPE/ plasma [6,6-2H2]Glucose MPE) from plasma glucose and percent indirect hepatic glycogen synthesis (C5/C2 in liver glycogen *100) from gluconeogenesis were calculated. Simultaneously, hepatic de novo lipogenesis and triglyceride esterification rates were calculated from the incorporation of 2H in palmitate and glyceride, respectively. The contribution of newly synthesized palmitate and esterified glycerol was determined using the following equations: %newly made palmitate = Palmitate M+1 MPE / (plasma 2H2O MPE * n) × 100 where “n” represents the number of exchangeable hydrogens, which was assumed to be 22.32 % newly made esterified glycerol = (Glycerol M+1 enrichment MPE + 2 * M+2 enrichment MPE) / (plasma 2H2O MPE * 4.25) × 100 where “n” represents the number of exchangeable hydrogens, which was assumed to be 4.2532.
Sub-chronic dosing in C57Bl/6J NASH model.
In a separate study male C57BL/6J mice aged ~6 weeks (Janvier Labs, France) were maintained on chow (Altromin 1324, Brogaarden, Denmark) or high trans-fat, high fructose and high cholesterol (AMLN) diet (D09100301; Research Diets, New Brunswick, NJ) for 29 weeks prior to study start to establish a severe NASH phenotype. Three weeks prior to study start mice were subjected to a liver biopsy procedure41 for baseline NASH phenotype measurements. After an overnight fast a small incision in the midline of the mouse under isoflurane anesthesia was made and the left lateral lobe of the liver exposed. A cone shaped wedge of liver tissue (~50–100 mg) was excised from the distal portion of the lobe, weighed, and fixed in 4% paraformaldehyde. The cut surface of the liver was instantly electrocoagulated using bipolar coagulation. The liver was returned to the abdominal cavity and the abdominal wall sutured and the skin closed with staples. Three weeks post-biopsy mice were randomized to treatment arms based on body weight, liver fibrosis and steatosis scores. Mice on AMLN diet (n=12 per group) were administered vehicle [50 mM phosphate buffer, propylene glycol (1.85% w/v), 0.04% PS-80, pH 7.5, n=11], Cotadutide (10 nmol/kg) or Liraglutide (40 nmol/kg) via subcutaneous injection once daily just prior to lights off. Another group was administered Obeticholic acid (OCA; Selleckchem, Houston, TX) dosed at 70 μmol/kg orally once daily. The OCA group received an additional subcutaneous vehicle injection, and the vehicle, Cotadutide and Liraglutide groups received an oral dose of vehicle (0.5% carboxymethyl cellulose) at the same time, thus all mice received two daily administrations of vehicle or test agent. Treatment and diet were continued for 6-weeks. Body weight was recorded daily. An intraperitoneal glucose tolerance test was performed on day 28 after a 4 h fast (1.5 g/kg glucose), with blood glucose sampled from tail vein collections (BIOSEN c-Line glucose meter; EKF-diagnostics, Germany). On study day 42 mice were euthanized via isoflurane overdose and cardiac blood collected for terminal analyses. Liver was excised, weighed and prepared for downstream analyses.
Sub-chronic dosing in Ob/Ob NASH model.
Male Lepob/Lepob mice with C57Bl/6J background (B6.Cg-Lepob/J, Jackson Laboratories, Bar Harbor, ME), aged 8 weeks were placed on either low-fat control diet (LFD; D09100304, Research Diets) or AMLN diet (D09100301, Research Diets) for 8 weeks. On day −3 mice on AMLN diet were randomized to drug treatment groups based on body weight, non-fasting blood glucose (Breeze2 glucometer, Bayer, Pittsburgh, PA), and plasma ALT (Cobas c-111, Roche Diagnostics USA, Indianapolis, IN) from retro-orbital blood collection in the conscious mouse. Mice on LFD (n=8) were not administered any vehicle or compound. Mice on AMLN diet were administered either vehicle [50 mM phosphate buffer, propylene glycol (1.85% w/v), 0.04% PS-80, pH 7.5, n=11], Cotadutide (n=7), Liraglutide (n=10), or switched back to LFD (AMLN-to-LFD) and administered vehicle (n=10). Vehicle and test agents were administered subcutaneously once daily for 6 weeks. Cotadutide and Liraglutide dose started at 10 nmol/kg and escalated by 10 nmol/kg every 2 days until the target dose of 40 nmol/kg was achieved (3 steps). For Cotadutide, after 4 days at 40 nmol/kg the dose was lowered to 30 nmol/kg for the remainder of the study in order to match body weight loss between Cotadutide and Liraglutide treatment arms. Body weight was measured daily. Non-fasted blood glucose was recorded on day 0 and weekly thereafter for all mice (Breeze2 glucometer). An intraperitoneal glucose tolerance test was performed on day 28 after a 4h fast (1.5 g/kg glucose). Vehicle or drug was administered for 6 weeks at which point mice were euthanized in the non-fasted state, blood was collected via cardiac puncture and livers excised, weighed and processed for further analysis.
Plasma measurements.
ALT.
Terminal blood was collected in EDTA-coated tubes and centrifuged at 10,000 x g for 10 min. The plasma was collected and analyzed for ALT levels using a biochemistry analyzer (Cobas c-111, Roche Diagnostics, Indianapolis, IN).
Plasma collagen fragment analysis.
ELISA-based techniques for the detection of C3M, P4NP7S and C5M in plasma were conducted as described below.42–44
For C3M, a 96-well streptavidin-coated plate ((Roche diagnostics, Basel, Switzerland) was further coated with 5 ng/ml of the synthetic biotinylated peptide KNGETGPQGP-biotin dissolved in PBS-TBE buffer at 20°C for 30 min with constant shaking at 300 rpm. After washing five times in wash buffer, 20 μl of the sample was added followed by 100 μl of peroxidase conjugated anti-human mAb-NB51- 32 CO3-610 solution (23 pg/ml in incubation buffer). The plate was incubated for 1h at 20°C with shaking at 300 rpm. Following an additional five washes, 100 μl of tetramethylbenzinidine (TMB) (Kem-En-Tec cat. 438OH, Taastrup, Denmark) was added. The plate was incubated for an additional 15 min in the dark with shaking at 300 rpm. The reaction was stopped upon the addition of 100 μl of stopping solution (95-97% H2SO4, Merck Cat. No.: 1.00731). The plate was analyzed at 450 nm with 650 nm as the reference (Molecular Devices, SpectraMax M, CA, USA).
For P4NP7S, a 96-well streptavidin-coated plate (Roche diagnostics, Basel, Switzerland) was further coated with the biotinylated peptide Biotin-PGEILGHVPG dissolved in assay buffer (50 mM Tris-BTB, pH 7.4), incubated for 30 min at 20°C in the dark and subsequently washed in wash buffer (20 mM Tris, 50 mM NaCl, pH 7.2). Then, 20 μL of the peptide calibrator or sample were added to appropriate wells, followed by 100 μL of HRP-conjugated monoclonal antibody NB102-1E6. The plate was incubated for 1h at 20°C and then washed. After the addition of 100 μL of tetramethylbenzinidine (TMB) (Kem-En-Tec cat. 438OH, Taastrup, Denmark), the plate was incubated for an additional 15 min at 20°C. The reaction was stopped upon the addition of 100 μL of stopping solution (1% H2SO4). The plate was analyzed at 450 nm with 650 nm as the reference (Molecular Devices, SpectraMax M, CA, USA).
For C5M, a 96-well streptavidin-coated plate (Roche diagnostics, Basel, Switzerland) was coated with 2.5 ng of the biotinylated synthetic peptide, TAALGDIMGHGGC-Biotin, dissolved in assay buffer (50 mM Tris, 1% bovine serum albumin (BSA), 0.1% Tween-20, adjusted to pH 7.4 at 20°C) and incubated for 30 min at 20°C. First, 20 μL of the peptide calibrator or sample were added to appropriate wells followed by 100 μL of 125 ng conjugated monoclonal antibody. The plate was incubated for 1h at 20°C and then 100 μL tetramethyl benzinidine (TMB) (Kem-En-Tec cat.438OH, Taastrup, Denmark) was added followed by an additional 15 min incubation at 20°C in the dark. After each incubation step, the plate was washed five times in washing buffer (20 mM Tris, 50 mM NaCl, pH 7.2). The TMB reaction was stopped upon the addition of 100 μL of stopping solution (1% HCl). The plate was measured at 450 nm with 650 nm as the reference (Molecular Devices, SpectraMax M, CA, USA).
Plasma insulin.
Mouse/rat insulin kit (MSD, Rockville, MD) was performed as per kit instruction.
Plasma glucagon.
Glucagon R-plex kit (MSD, Rockville, MD) was performed as per kit instruction.
GLP-1R and GcgR Bioassay.
Serum peptide content was determined using a cell-based cAMP accumulation bioassay (Cisbio, France) to estimate peptide bioactivity in serum samples at hGLP1R or hGcgR.45 CHO K1 cells stably transfected with human GLP1R or human GcgR were used to determine apparent peptide concentration in serum from treated animals by comparing potency for inducing cAMP accumulation. Reference peptides at a known concentration were spiked into naïve serum to create standard curves. Bioactivity data were analyzed using nonlinear regression analysis in GraphPad Prism.
Liver lipid quantification.
Total lipids were measured in liver samples using a Bruker LF-90 minispec system (Bruker Biospin Corporation, Billerica, MA). The data are expressed as the percent lipid relative to the total tissue mass.
Glycogen quantification.
Liver and muscle glycogen were measured following tissue lysis, precipitation, digestion and glucose quantification. Tissue was lysed in 0.75% SDS, an aliquot was reserved for protein measurements, and protein in remaining lysate was precipitated upon addition of 100% TCA. Following protein precipitation, supernatant was removed and added to 2.5 volumes of 100% ethanol to precipitate glycogen. After overnight storage at −80°C, pelleted glycogen samples were washed with 75% ethanol, and dried under speed-vac, followed by digestion with glucoamylase for 1.5h at 45°C. Glucose was measured using the glucose oxidase/peroxidase method and read on a Spectramax plate reader (Molecular Devices, USA) at 405 nm.
Histological analysis and quantification of liver tissue.
Livers were fixed in 10% neutral buffered formalin for 24h. Paraffin-embedded tissue sections were de-paraffinated in xylene and rehydrated in series of graded ethanol. Slides were incubated in Mayer’s Hematoxylin (Dako, Aglient, Santa Clara, CA), washed in tap water, stained in Eosin Y solution (Sigma, St Louis, MO), hydrated and mounted with Pertex. For Picro Sirius red the slides were incubated in Weigert’s iron hematoxylin (Sigma), washed in tap water, stained in Picro-sirius red (Sigma) and washed twice in acidified water. Excess water is removed by shaking the slides and then dehydrated in three changes of 100% ethanol, cleared in xylene and mounted with Pertex.
Histological assessments were conducted by a pathologist under blinded conditions. A modified scoring system, based on the Brunt and Kleiner NAFLD activity score46, previously developed and validated to enable a more reproducible and semiquantitative assessment of murine liver was used to quantify various parameters of liver phenotype including inflammation, steatosis, hepatocyte ballooning and biliary hyperplasia.
Immunohistochemistry.
Immunohistochemistry was performed using a Ventana Discovery ULTRA Staining Module (Ventana Medical Systems, Tucson, AZ). Formalin-fixed, paraffin embedded liver sections were stained with anti-collagen type 1 (1310-01, Southern Biotech, Birmingham, AL), anti-α-smooth muscle actin (ab124964, Abcam, Cambridge, MA) or anti-CD68 (ab125212, Abcam, Cambridge, MA). Specific antibody details can be found in the Reporting Summary.
Liver hydroxyproline content.
Liver samples were homogenized in 6 M HCl and hydrolyzed to degrade collagen. Samples were centrifuged and hydroxyproline content was measured using a colorimetric assay (Quickzyme Biosciences, Leiden, Netherlands) according to the manufacturer’s instructions.
Primary hepatocyte isolation.
Primary hepatocytes were isolated using a modified two-step non-recirculating perfusion method.47 Mice were anesthetized with isoflurane and the portal vein was cannulated using a 23-guage needle and a 2 mL/min flow of Hank’s Balanced Salt Solution (HBSS with 5 mM glucose, 0.5 mM EGTA, 25 mM HEPES pH 7.4). Upon blanching of the liver nearly immediately after cannula insertion into the portal vein (a confirmation of successful cannulation), the inferior vena cava was cut and the flow rate was increased from 2 mL/min to 8 mL/min. Approximately 50 mL of HBSS was perfused through the liver, taking approximately 6 min. During this time, the IVC was periodically clamped for 5 second periods. Digestion medium (low-glucose DMEM (Gibco, Thermofisher, Waltham, MA), supplemented with 15 mM HEPES, 100 U/mL penicillin and 0.1 mg/mL streptomycin (Pen/Strep), and 100 U/mL type IV collagenase (Worthington Biochemical Corp, Lakewood, NJ) was then perfused at 8 mL/min for approximately 8 minutes or until the liver was fully digested. The IVC was periodically clamped, as before, to accelerate digestion and maximize total cell yield. Total digestion was confirmed upon loss of liver elasticity/ minimal change in liver size upon IVC clamping. The digested liver was excised and transferred to a culture dish containing 15 mL of the digestion medium and was gently ripped and shaken using forceps to release the cells. The cells were gently pipetted up and down three times and then filtered through a 74 μM fine mesh strainer (Dual Manufacturing, Franklin Park, IL, USA). The cells were spun at 50xg for 2 minutes at 4°C followed by three washes with 25 mL of ice-cold isolation medium (high glucose DMEM (Gibco, Thermofisher) supplemented with 1 mM sodium lactate, 2 mM L-glutamine, 15 mM HEPES, 0.1 μM dexamethasone, 1x Pen/Strep, and 10% fetal bovine serum). After the final wash the hepatocytes were resuspended in 25 mL of isolation medium and the viability and yield were assessed. An aliquot of the cell suspension was mixed in a 4:1 ratio with 0.4% trypan blue, after which the viable hepatocytes were counted using a hemocytometer. The hepatocytes were diluted to 300,000 cells/mL, and approximately 3 million hepatocytes were seeded per type I collagen-coated plate unless otherwise noted. After a 1h incubation at 37°C in a humidified 5% CO2 incubator, the cells were washed and fresh isolation medium was added for an additional 4 hours. Following this initial recovery period, the medium was changed to a serum-free culture medium (low-glucose DMEM (Gibco, Thermofisher) supplemented with 10 mM sodium lactate, 2 mM L-glutamine, 5 mM HEPES, 10 nM dexamethasone and 1x Pen/Strep).
All assays were carried out within 18-24h post-plating. Hepatocytes were treated for 2-4h with 100 nM of Cotadutide, Liraglutide or g1437. Live-cell imaging of hepatocytes stained with Mitotracker green and Lysotracker deep red (Thermofisher) was performed using the Leica SP5 X confocal microscope and quantified using the Arivis Vision4D software. In indicated assays cells were treated with PKA inhibitor, H89 (10 μM, Sigma); AMPK inhibitor, Compound C (20 μM, Calbiochem, San Diego, CA); p38MAPK inhibitor, SB 203580 (20 μM, Calbiochem); PLC inhibitor, U73122 (10 μM, Calbiochem); mTOR inhibitor, rapamycin (1 μM, Sigma); PI3K inhibitor, LY-294 (10 μM, Sigma) or MAPKK inhibitor, PH 98 (20 μM, Sigma).
Human hepatocytes.
Human primary hepatocytes were obtained from Samsara Sciences (San Diego, CA). They were plated on type I collagen-coated plates and cultured in Hepatocyte Maintenance Media (HMM, CC-3197, Lonza, Morristown, NJ, USA) supplemented with Singlequots (CC-4192, Lonza). The components of the Singlequots kit are dexamethasone, insulin and gentamicin/amphotericin B. The cells were cultured for no more than 36h. For gene expression analyses, hepatocytes were treated for 4h with indicated compounds followed by RNA isolation using TRIzol (Life Technologies, Rockville, MD, USA).
Lipogenesis.
De novo lipogenesis was assessed in primary hepatocytes isolated from C57Bl/6J male mice. Hepatocytes were serum-starved overnight, then high glucose DMEM containing 10 μM cold acetate and 1.0 μCi 3H-acetate (Perkin Elmer, Waltham, MA, USA) per well of a 12-well plate was added. After a 2 h incubation, hepatocytes were washed with PBS then scraped in 0.1 N HCl. Lipids were extracted by addition of 2:1 chloroform:methanol (v/v). After addition of water, samples were centrifuged, and the lower phase was transferred to a scintillation vial containing scintillation fluid. 3H activity was measured using a scintillation counter (Beckman Coulter, Brea CA, USA).
Mitochondrial oxygen consumption.
Mitochondrial oxygen consumption was measured using the Seahorse Xfe96 analyzer (Agilent; Santa Clara, CA, USA). Primary mouse hepatocytes were plated at a density of 7500 cells per well and allowed to recover overnight. The medium was exchanged (DMEM containing 5 mM glucose, 4 mM L-glutamine, 2 mM sodium pyruvate, pH 7.4) and the plate was placed in a CO2-free incubator for 30 min prior to being placed in the analyzer. The following compounds were used in the mitochondrial stress test: 1 μM oligomycin (Sigma, St Louis, MO), 0.5 μM FCCP (Sigma), and 5 μM antimycin A (Sigma). Basal and maximal oxygen consumption rates were normalized to citrate synthase activity (CSA) (Cat. no. K13, Biovision, USA) as a measure of mitochondrial mass.
Liquid chromatography-tandem mass spectrometry (LC-MS/MS) – Metabolomics
Frozen liver samples were placed in CK14 Precellys tubes for soft tissue and extracted with 1 mL/100 mg of cold acetonitrile/methanol/water 40/40/20 v/v. Homogenization was performed by 3 cycles (30 sec/cycle) of 4000 rpm in a pre-cooled Precellys-24 system with Cryolys unit. A 60 second pause between cycles was used to ensure samples remained cold. After centrifugation at 21,100 x g (14 800 rpm) to pellet debris, supernatants were transferred to 1.5 ml Eppendorf tubes and stored at −80°C. Prior to analysis, 10 μl of each sample was mixed with 90 μl of ultrapure water and transferred to a 0.3 ml polypropylene HPLC microvial for LC-MS/MS analysis.
Samples were analyzed using an LC-MS platform consisting of an Ultimate 3000 chromatography system (Thermo, UK) coupled to an AB4000 triple quadrupole mass spectrometer (ABSciex, UK). The mass spectrometer was operated in negative ion mode. Chromatographic separation was achieved with a Waters Acquity HSS T3 column, C18 100 x 2.1 mm, 1.8 μm particle size. The column oven housing the analytical column was maintained at a constant temperature of 60 °C. Solvent flow was delivered at 400 μl/min and buffer composition was as follows: Buffer A: 10 mM tributylamine (TBA), 15 mM acetic acid in HPLC-MS grade Ultrapure water. Buffer B: 80% (v/v) methanol, 20% (v/v) isopropanol. Full details of the mass spectrometry method are given in Michopoulos et. al.48
Raw data was analyzed, and peak integration performed with the software package MultiQuan v.2.0.2 (Applied Biosystems/MDS Sciex). Peak areas were exported into Microsoft Excel for normalization and further data processing (F-test, t-test, fold-change). Analytical reproducibility was deemed to be acceptable for those metabolite peaks for which a coefficient of variation of less than 30% was calculated. Metabolite perturbation was considered significant for t-test p<0.05, and an average difference greater than 30%.
RNA isolation and real-time PCR.
Total liver RNA and genomic DNA were isolated using standard procedures. Qiagen RNeasy® columns (Qiagen, Valencia, CA, USA) were used for RNA purification according to the manufacturer’s protocol, including an on-column DNA digestion using DNase I. Equal amounts of RNA were reverse transcribed to cDNA using SuperScript III First Strand cDNA synthesis kit (Invitrogen, Carlsbad, CA, USA) according to the manufacturer’s instructions. Real-Time PCR was performed on a QuantStudio-7 Flex System (Applied Biosystems, Foster City, CA) using Applied Biosystems TaqMan Fast Universal PCR Master Mix and TaqMan probes. Each sample was assayed in triplicate and quantified using the ΔΔCT method normalized to endogenous control Ppia. Relative gene expression was normalized to a value of 1.0 for the control group.
RNA-sequencing.
Total RNA samples treated with RNase-free DNase I (Qiagen) were quantified and analyzed using Nanodrop-1000 Spectrophotometer (Thermofisher) and 2100 Bioanalyzer (Agilent, Santa Clara, CA, USA).
RNA-seq libraries were prepared using Illumina TruSeq RNA Library Prep Kit v2 according to the manufacturer’s instructions (Illumina, San Diego, CA, USA). Briefly, poly(A)-containing mRNA in 150 ng total RNA was converted into a double-stranded cDNA library which was, in turn, ligated to TruSeq paired-end adaptors containing unique index barcode sequences. The ligated products were purified and enriched with 15 cycles of Polymerase Chain Reaction (PCR). The size distribution of the RNA-seq libraries was analyzed on a 2100 Bioanalyzer (Agilent) and the library concentrations were determined using Kapa Library Quantification kit (Kapa Biosystems, Woburn, MA, USA). Sequencing libraries were normalized and pooled to 4 nM in 10 mM Tris-HCl, pH 8.0 and subjected to denaturation in 0.1 N NaOH for 5 min prior to the final dilution to 1.8 pM. Denatured and diluted libraries were loaded onto NextSeq 500/550 v2 flow cells and paired-end sequencing (2 x 75 cycles) was performed on NextSeq 500 sequencing instruments (Illumina).
Analysis of RNAseq data.
NextSeq data was demultiplexed using bcl2fastq (Illumina, San Diego, CA). Sequencing reads were aligned to the GRCm38/mm10 mouse assembly by applying STAR v2.5 (Spliced Transcripts Alignment to a Reference).49 Reads were counted with RSEM v1.2 (RNA-Seq by Expectation Maximization), and a log2 tpm (transcripts per million) data matrix was generated for further analysis. All samples were confirmed to have at least 30 million unique paired reads, and alignment rates of greater than 79%. Differential expression of genes was determined by linear regression using the limma package in R. p-values were determined by the eBayes function (Empirical Bayes Statistics), and a Benjamini-Hochberg (BH) correction was applied to adjust p-values for multiple testing.
Analysis of genomic signatures.
Data analysis was performed with the R programming language (v.3.4) in R Studio (v.1.0). Genomic signatures were obtained from the public MSigDB database, including Hallmark and Biocarta signatures.50–52 Details of the selected signatures are listed in Supplementary Tables 5, 6 and 11. Signature scores were calculated for each subject using GSVA (Gene Set Variation Analysis) and visualized using the pheatmap package for R.53–55 Genomic signatures scores were analyzed by ANOVA to determine differential response, and adjusted p-values were calculated by applying Tukey Honest Significant Difference (Tukey HSD).
Phosphoproteomics analyses
Mouse hepatocytes.
Cell pellets were lysed by probe sonication for 2 x 20 sec (40% amplitude) on ice in 0.5 mL ice-cold 0.1 M Na2CO3, pH 11 with protease (cOmplete Protease Inhibitor, Sigma) and phosphatase inhibitors (PhosSTOP, Sigma) + 10 mM sodium pervanadate using a Q125 probe sonicator (Qsonica). After sonication, the samples were incubated at 4°C for 1h, then ultracentrifuged at 100,000 x g for 90 min and the supernatant stored at −20°C pending analysis. The pellet was washed/redissolved gently with 500 μL of 500 mM triethyl ammonium bicarbonate (TEAB; pH 8) and centrifuged at 14,000 x g for 30 min at 4°C. The supernatant was discarded and the pellet (membrane enriched fraction) redissolved in 6 M urea/2 M thiourea, 10 mM DTT and 1 μL (4 μg) endoproteinase Lys-C (Vako Chemicals) and incubated at room temperature for 2h. After incubation, the cysteines were alkylated using 20 mM iodoacetamide for 30 min in the dark, then the solution diluted 10 times with 20 mM TEAB; pH 7.8 with trypsin added (2-5%) and incubated at room temperature overnight.
For the soluble proteins, the volume was reduced by centrifugation to 50 μL using a 10 kDa cutoff spin filter (Amicon® Ultra, Merck Millipore Ltd) at 4°C. The proteins were washed in 450 μL of 50 mM TEAB, pH 7.8 containing phosphatase inhibitors (PhosSTOP) + 10 mM sodium pervanadate on the filter. After washing, a total of 50 μL 6 M urea/2 M thiourea, 10 mM DTT was added and incubated for 30 min at room temperature. Iodoacetamide was then added to a final concentration of 20 mM and incubated in the dark for 30 min at room temperature. After, 300 μL of 50 mM TEAB, pH 7.8 containing phosphatase inhibitors (PhosSTOP) + 10 mM sodium pervanadate was added and the solution centrifuged to reduce the volume to 50 μL. After centrifugation, 150 μL of 50 mM TEAB, pH 7.8 containing trypsin (5 μg) was added to each sample and incubated overnight at room temperature. Concentration of peptides was measured for both the soluble and membranous samples using the Qubit fluorescent technology (Thermofisher).
A total of 120 μg peptides for all samples were labeled with TMT10 plex (Thermofisher) according to the manufacturer’s protocol, resulting in one TMT10 plex for the soluble fraction and one TMT10 plex for the membrane fraction. The control (non-stimulated) samples were labeled with TMT 126, 127N, 127C, 128N and 128C. The stimulated samples (10 min g1437) were labeled with TMT 129N, 129C, 130N, 130C and 131. After labeling, the TMT labeled samples were combined and lyophilized prior to phosphopeptide enrichment.
Human hepatocytes.
Cell pellets (control or treated) were lysed in 20 μL of lysis buffer (6 M urea/2 M thiourea, 10 mM DTT, 1xPhosSTOP (Sigma) and 1 μL (4 μg) endoproteinase Lys-C (Vako Chemicals) and incubated at room temperature for 2h. Then, iodoacetamide was added to the samples (20 mM final concentration) and incubated at room temperature for 30 min. These samples were then diluted 10X with 50 mM TEAB, pH 7.8 and sonicated using a Q125 probe sonicator (Qsonica sonicators; 2 x 10 sec at 60% amplitude) on ice. After centrifugation at 14,000 x g for 20 min, the supernatant was collected, and the protein concentration measured using Qubit fluorescence labeling (Thermofisher).
A total of 120 μg peptides was taken out for each sample and labeled with TMT 11 plex according to the manufacturer’s protocol (Thermofisher). The TMT labeling was performed as follows: TMT 126 (Control), 127N (Control), 127C (Control), 128N (10 min g1437) and 128C (10 min g1437), 129N (10 min g1437), 129C (20 min g1437), 130N (20 min g1437), 130C (20 min g1437). After labeling, the samples were combined and lyophilized prior to phosphopeptide enrichment.
Pooled liver samples.
Pieces (3 mm3) of liver from each individual mouse (n=3) per treatment (vehicle or Cotadutide) per timepoint (0, 2, 6 and 16 h) were pooled such that 8 samples were generated for testing (i.e., vehicle or Cotadutide for each timepoint). Each sample was homogenized in 1 mL ice-cold 0.1 M Na2CO3, pH 11 with protease (cOmplete Protease Inhibitor) and phosphatase inhibitors (PhosSTOP) + 10 mM sodium pervanadate using a Dounce homogenizer. After homogenization, the samples were sonicated using a Q125 probe sonicator (Qsonica) for 4 x 10 sec on ice, with 20 sec cooling intervals, with amplitude of 60%. The samples were ultracentrifuged at 100,000 x g for 90 min at 4°C, and the supernatant stored at −20°C pending analysis. The pellet was resuspended in 500 μL of 500 mM TEAB, pH 8. This solution was centrifuged at 14,000 x g for 30 min at 4°C, the supernatant discarded and the pellet (membrane-enriched fraction) was re-dissolved in 6 M urea/2 M thiourea, 10 mM DTT and 1 μL (4 μg) endoproteinase Lys-C (Vako Chemicals) and incubated at room temperature for 2h. The peptide cysteines were then alkylated using 20 mM iodoacetamide for 30 min in the dark. The solution was then diluted 10X with 20 mM TEAB, pH 7.8 and trypsin was added (5 μg) and incubated at room temperature overnight.
For the soluble proteins, these samples were treated as described for mouse hepatocyte soluble protein samples. A total of 120 μg peptides for soluble and membrane samples were labeled with TMT 10 plex (Thermofisher). For both fractions the TMT labeling was performed as following: vehicle 0h (TMT126), vehicle 2h (TMT127N), vehicle 6h (TMT127C), vehicle 16h (TMT128N), Cotadutide 0h (TMT128C), Cotadutide 2h (TMT129N), Cotadutide 6h (TMT129C), Cotadutide 16h (TMT130N). After TMT labeling, the 8 samples from soluble and membrane extractions were mixed, respectively, and lyophilized prior to PTM enrichment.
Enrichment of phosphopeptides.
The purification of phosphorylated peptides was performed using titanium dioxide (TiO2) chromatography described in detail below.55 To ensure high enrichment efficiency and to eliminate co-purified sialic acid containing N-linked glycopeptides the phosphopeptides were purified using a double TiO2 enrichment strategy with an enzymatic de-glycosylation step between the TiO2 enrichment steps. The final phosphopeptide sample was fractionated using high-pH reversed-phase (HpH RP) separation prior to LC-MS/MS.
First TiO2 enrichment step.
The lyophilized TMT labelled peptides were resuspended in TiO2 loading buffer (80% acetonitrile (ACN), 5% trifluoracetic acid (TFA), 1 M glycolic acid) and incubated with 0.6 mg TiO2 beads (GL Science, Japan) per 100 μg peptide on a shaker for 10 min. After incubation and centrifugation, the supernatant was incubated again with 3 mg TiO2 beads on a shaker for 10 min. After incubation, all TiO2 beads were sequentially washed together in one tube with 100 μL 80% ACN, 1% TFA and subsequently with 20% ACN, 0.1% TFA. All supernatants from the washes were collected, lyophilized and the “non-modified” peptides were subsequently purified using HLB reversed-phase chromatography. The TiO2 beads were dried and the bound peptides were eluted with 1% ammonium hydroxide solution, pH 11.3 on a shaker for 10 min. After incubation and centrifugation, the supernatant was lyophilized.
De-glycosylation.
To remove the sialylated N-linked glycan structures from the enriched sialic acid containing N-linked glycopeptides that are co-enriched in the TiO2, the dried peptides solution was resuspended in 100 μL 20 mM TEAB, pH 8,0 and treated with 2 μL N-glycosidase F (New England Biolabs, Ipswich, MA, USA) and 0.5 μL Sialidase A (Agilent) overnight at 37°C.
Second TiO2 enrichment step.
The de-glycosylated sample was adjusted to 500 μL 70% ACN and 2% TFA and the TiO2 beads used for the first TiO2 enrichment were added to the solution and incubated on a shaker as described above. After incubation, the beads were pelleted, and the supernatant was recovered. The TiO2 beads were washed with 200 μL 50% ACN, 0.1% TFA, the beads were pelleted, and the supernatant was recovered with the supernatant. The TiO2 beads were dried and bound phosphopeptides were eluted from the beads with 1% ammonium hydroxide solution, pH 11.3 as described above. The phosphopeptides were lyophilized prior to HpH RP separation.
High-pH reversed-phase separation.
The phosphorylated peptides were re-dissolved in 31 μL 20 mM ammonium formate, pH 9.3 and sonicated for 5 min. The sample with the phosphorylated peptides was then centrifuged for 15 min at 14000 x g at room temperature and the supernatant was applied to an ACQUITY UPLC M-class CSH C18, 1.7 μm 300 μm x 100 mm RP column using a Dionex 3000 Ultimate system. The phosphopeptides were eluted from the C18 column with increasing concentrations of acetonitrile in ammonium formate (2, 50, 95% acetonitrile) for 155 min with a flowrate of 5.0 μL/min. The various phosphopeptide samples were fractionated into 15-20 concatenated fractions. The fractions were lyophilized prior to LC-MS/MS.
Liquid chromatography tandem mass spectrometry (LC-MS/MS) – Phosphoproteomics
The various samples were analyzed on an EASY nanoLC system coupled with a Fusion Lumos Tribrid orbitrap MS instrument or a Q-Exactive HF MS instrument. Lyophilized phosphopeptides from the HpH RP fractionation (15-20 concatenated fractions) were re-solubilized in 5 μL of 0.1% TFA and loaded onto a two-column system containing a 3 cm pre-column and a 17 cm analytical column both consisting of fused silica capillary (75 μm inner diameter) packed with ReproSil – Pur C18 AQ 3 μm reversed-phase material. The peptides were eluted with an organic solvent gradient from 100% phase A (0.1% FA) to 40% phase B (95% ACN, 0.1% FA) at a constant flow rate of 300 nL/min. Depending on the sample the gradient was either 60 min or 120 min for each fraction starting at 5% phase B up to 22% B for 50 or 90 min and then up to 40% phase B for 10 or 30 min. The EASY-nLC was online connected to a Fusion Lumos Tribrid orbitrap MS instrument or a Q-Exactive HF MS instrument.
For the Lumos instrument the automatic gain control target value of 1.5x10⁶ ions and a maximum fill time of 50 ms was used. Each MS scan was acquired at high-resolution (120,000 full width half maximum (FWHM)) at m/z 200 in the Orbitrap with a mass range of 400-1400 Da. The instrument was set to select as many precursor ions as possible in 3 sec between the MS analyses. Phosphopeptide ions were selected from the MS for higher energy collision-induced dissociation (HCD) fragmentation (collision energy: 40%). Fragmentation was detected in the orbitrap at high resolution (60,000 FWHM) for a target value of 1x10⁵ ions and a maximum injection time of 150 ms using an isolation window of 0.7 Da and a dynamic exclusion of 30 sec.
For the QE-HF a full MS scan with an AGC target value of 3x10⁶ ions and a maximum fill time of 100 ms was used. Each MS scan was acquired at high-resolution (120,000 full width half maximum (FWHM)) at m/z 200 in the Orbitrap with a mass range of 400-1600 Da. The 15 most abundant peptide ions were selected from the MS for HCD fragmentation (collision energy: 31V). Fragmentation was performed at high resolution (60,000 FWHM) for a target of 1x10⁵ and a maximum injection time of 150 ms using an isolation window of 1.2 Da and a dynamic exclusion of 10 sec. All raw data were viewed in Xcalibur v3.0 (Thermo Fisher Scientific).
Phosphopeptide identification and quantitation.
All LC-MS/MS raw data files were searched using Proteome Discoverer (PD) version 2.2. The raw data were searched in PD using a workflow where the raw data were first subjected to database searching using an in-house Mascot server (Version 2.2.04, Matrix Science Ltd., London, UK) The searches had the following criteria: database, SwissProt human protein database (version 17.07.2017; 75193 sequences); enzyme, trypsin; maximum missed cleavages, 2; fixed modifications, TMT6plex (N-terminal), TMT6plex (K) and Carbamidomethyl (C). Variable modification for the phosphopeptides was Phospho (S/T/Y) and Deamidation (N). Peptides were accepted for further analysis if they had a q-value below 0.01 (Percolator),56,57 corresponding to 1% False Discovery Rate, had Mascot rank 1, and a cut-off value of Mascot score >18.58
The TMT10 plex reporter ion signals were quantified using S/N and they were normalized to the total peptide S/N in the PD program. The in-built ANOVA test in PD was used to generate p-values for all the phosphopeptides analyzed here. With low number of replicates (e.g. pooled liver samples) a t-test was performed so that the ratio of a protein or peptide is compared to 200 protein/peptide ratios with approximately the same intensity, providing more reliable p-values for low number of replicates.59
Metabolomics and lipidomics.
Samples were prepared and analyzed for global metabolomic and lipidomic profiling at Metabolon (Durham, NC, USA).60,61 For global metabolomics, liver samples were homogenized in water prior to extraction at a constant volume per mass. Liver homogenate and serum samples were extracted with methanol in the presence of recovery standards under vigorous shaking followed by centrifugation. The extracts were aliquoted, dried under nitrogen, and reconstituted in appropriate solvents containing internal standards. The aliquots were analyzed by ultra-performance liquid chromatography (UPLC)-MS/MS using four different methods: two with acidic positive ion conditions, one with basic negative ion conditions, and one with negative ionization which was optimized for polar compounds. Metabolites were identified by comparison of chromatographic and MS data to a reference library of chemical standards. For lipidomic profiling, samples were extracted in the presence of deuterated internal standards. Serum samples were prepared using an automated butanol:methanol extraction procedure incorporating heptane:ethylacetate and acetic acid phase separation based on a previously described method.62 Liver samples were soaked overnight at 4°C in dichloromethane:methanol (50:50) at a constant volume per mass and then lipids were extracted from the supernatant using a modified Bligh-Dyer extraction. Extracts were dried under nitrogen and reconstituted in dichloromethane:methanol (50:50) containing 10 mM ammonium acetate. Lipids were analyzed on a Sciex SelexIon-5500 QTRAP operated in multiple reaction monitoring mode with both positive and negative mode electrospray. Individual lipid species were quantified based on the concentration of assigned internal standards added to the samples and the ratio of the signal intensity of each target compound to that of its assigned internal standard. Lipid class concentrations were calculated from the sum of all molecular species within a class. Fatty acid compositions were determined based on the proportion of individual fatty acids in each lipid class.
Statistics.
All statistical analyses were carried out using GraphPad Prism 7 (GraphPad Software, San Diego, CA). The data were analyzed via Student’s t-test, one-way or two-way ANOVA as indicated in each figure, with post hoc tests as indicated in the figure legends. Values of p≤0.05 were considered to represent statistically significant differences.
DATA AVAILABILITY STATEMENT
The datasets generated during these studies are available from the corresponding author on reasonable request. These datasets include: in vivo data for the mouse studies and encompass metabolic, biochemical and histological data/images; mass spectrometry data from mouse liver and/or serum, mouse hepatocytes or human hepatocytes; imaging and quantitation data for mitochondrial analyses; qRT-PCR data for select gene expression analyses. RNAseq datasets are available in the SRA database with accession number PRJNA574649.
Extended Data
Extended Data Fig. 1. Metabolic and hepatic parameters following six-week treatment of NASH C57Bl6/J mice.
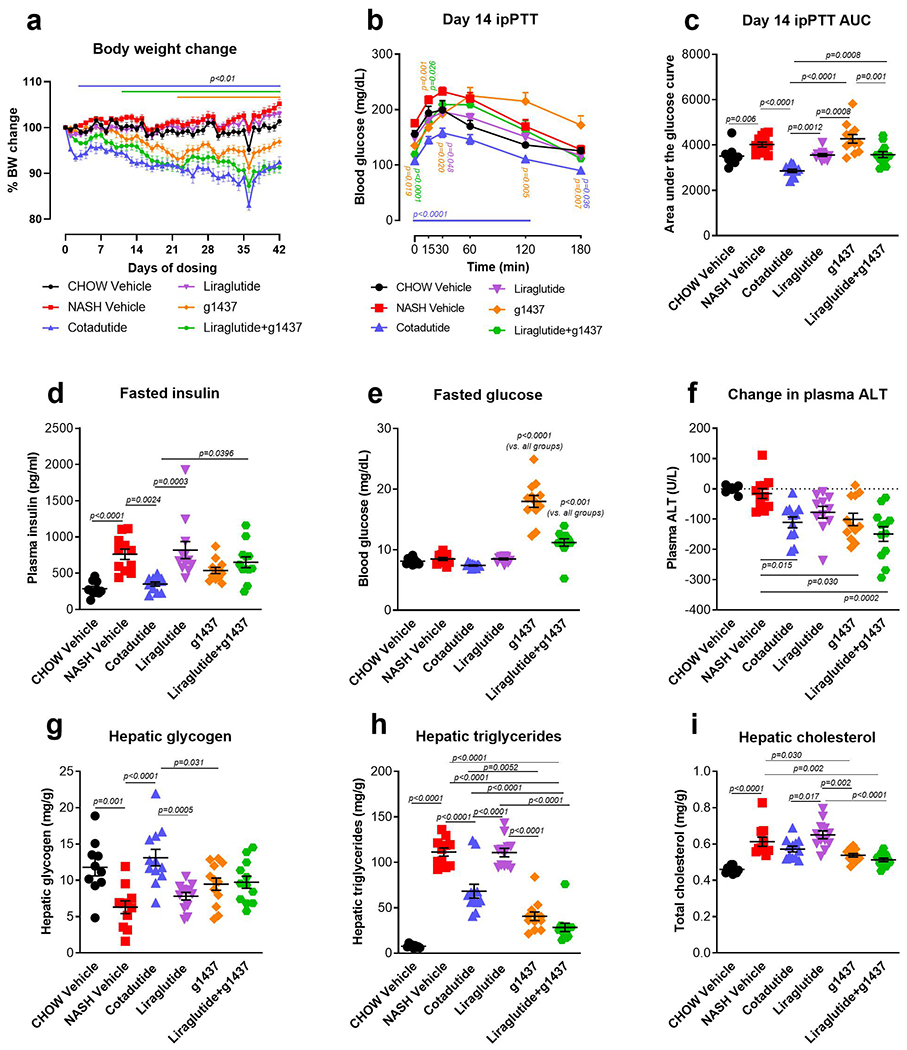
Mice were treated with Cotadutide, Liraglutide, g1437 or Liraglutide+g1437 at equimolar dosing (10 nmol/kg, SC, QD for 42 days) compared to vehicle. Animals were given ad libitum access to food for the entirety of the study except on day 14 mice were fasted for 6 h prior to ipPTT. (a) Reduction in body weight throughout the 42-day dosing period shown as % change. (b) Blood glucose profile during ipPTT (pyruvate given at dose of 2g/kg) and (c) area under the PTT curve. (d) Fasting plasma insulin, (e) fasting blood glucose and (f) plasma ALT levels at the end of the study. (g) Terminal liver glycogen content, (h) triglycerides and (i) cholesterol. Chow Vehicle (n=10); NASH Vehicle (n=11); Cotadutide (n=12); Liraglutide (n=12); g1437 (n=12); Liraglutide+g1437 (n=12). Data shown as the mean ± SEM. (a and b) Two-way ANOVA, Tukey’s multiple comparisons post-hoc test. In (a and b) colored lines and p-values indicated differences for the corresponding treatment group compared with NASH vehicle at each time point. (c-i) Two-sided student’s t-test for chow controls vs. NASH vehicle to determine effect of NASH diet; One-way ANOVA, Tukey’s multiple comparisons post-hoc test, chow group excluded.
Extended Data Fig. 2. Table of phosphopeptides.
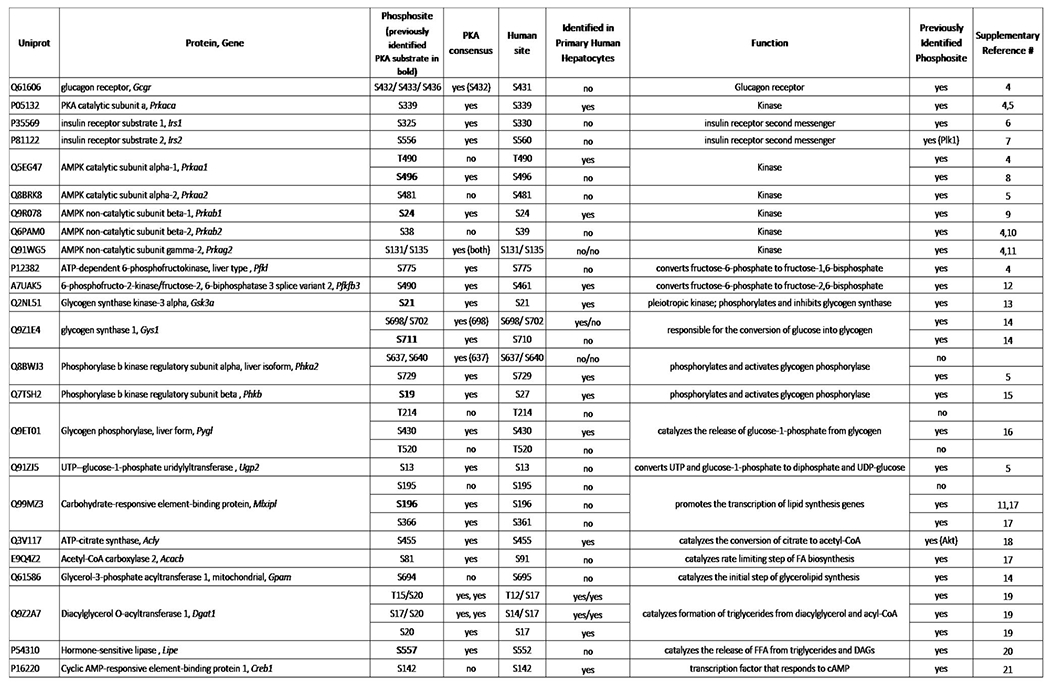
Description of hepatic phosphopeptides detected in primary mouse and human hepatocytes following treatment with g1437.
Extended Data Fig. 3. Glucagon induced gene expression of G9Pase and Pck1 is PKA-dependent.
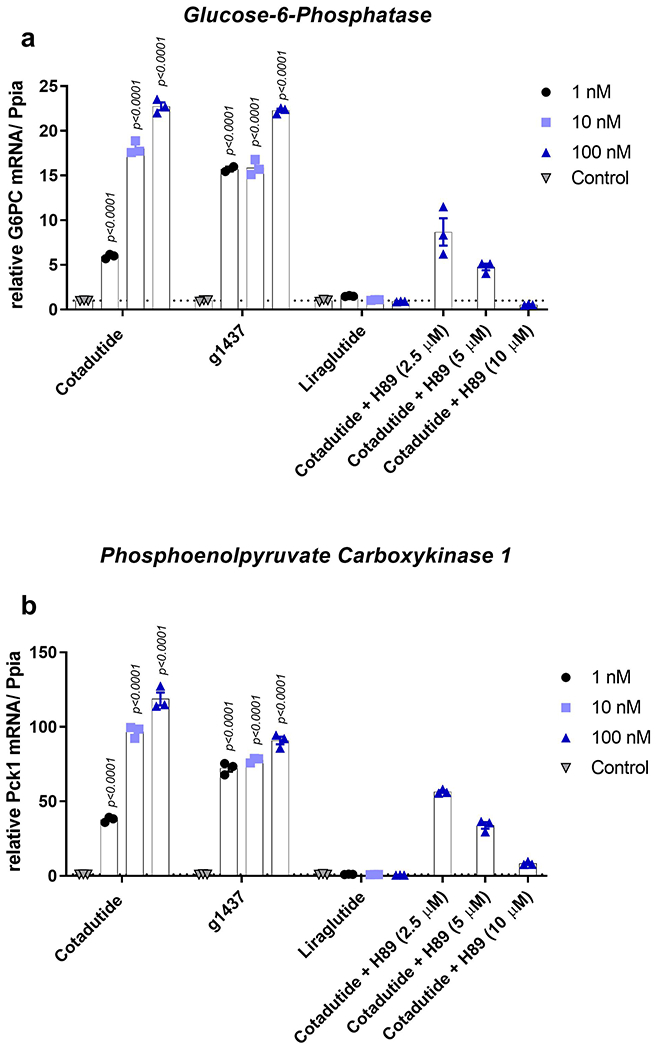
(a) G6Pase and (b) Pck1 mRNA levels in primary mouse hepatocytes treated with increasing concentrations (1, 10, and 100 nM) of Cotadutide, g1437 or Liraglutide for 4h. Cells were also treated with 100 nM Cotadutide plus increasing concentrations of H89 (2.5 μM, 5 μM and 10 μM). (n=3 biologically independent samples for each group and concentration). All data shown as the mean ± SEM. One-way ANOVA with Dunnett’s multiple comparisons post-hoc test.
Extended Data Fig. 4. Cotadutide improves mitochondrial respiratory function in primary mouse hepatocytes through Gcg signaling mechanisms.
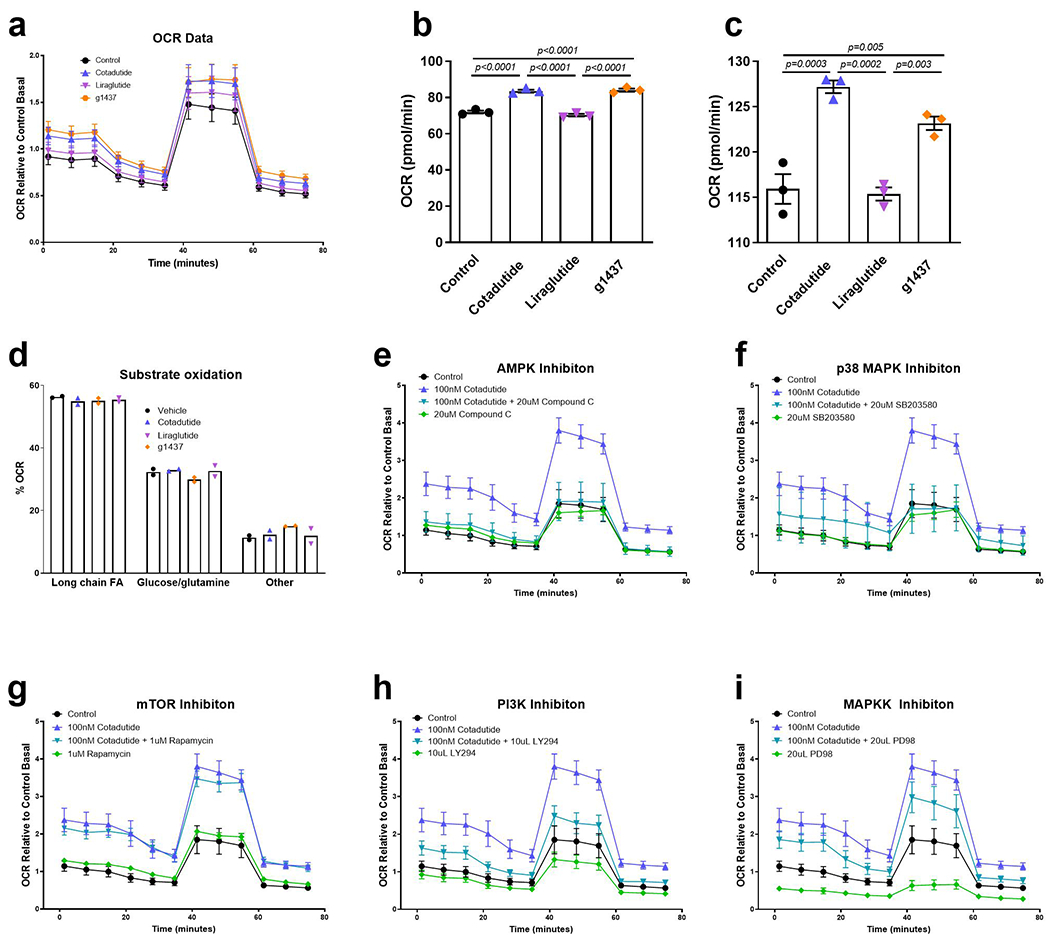
(a) Mitochondrial oxygen consumption rate (OCR) during mitochondrial stress test of healthy primary murine hepatocytes treated ex vivo for 4h with 100 nM Cotadutide, g1437 or Liraglutide compared to vehicle control hepatocytes (n=3 biologically independent samples/group). (b) Basal respiration and (c) maximal respiration measured following injection of uncoupler FCCP. (d) Oxygen consumption of primary mouse hepatocytes shown as the percentage of total respiration that is driven by the oxidation of indicated substrates (n=2 biologically independent samples/group). (e-i) Oxygen consumption of mouse primary hepatocytes, during mitochondrial stress test, treated with Cotadutide +/− AMPK inhibitor, Compound C (e; 20 uM), p38MAPK inhibitor, SB203580 (f; 20 um), mTOR inhibitor, Rapamycin (g; 1 uM), PI3K inhibitor, LY294 (h; 10 uM) or MAPKK inhibitor, PD98 (i; 20 uM) compared with Control treated hepatocytes. n=6 replicates from 1 biological samples for all except for Cotadutide; Cotadutide+SB203580; Rapamycin; Cotadutide+Rapamycin; PD98; Cotadutide+PD98 in which 5 replicates were performed. The experiment was performed on 3 separate occasions with similar results. All data shown as the mean ± SEM. (b-d) One-way ANOVA with Dunnett’s multiple comparisons post-hoc test.
Extended Data Fig. 5. Cotadutide reduces hepatic fibrosis and inflammation corresponding to animals shown in Figures 7 and 8.
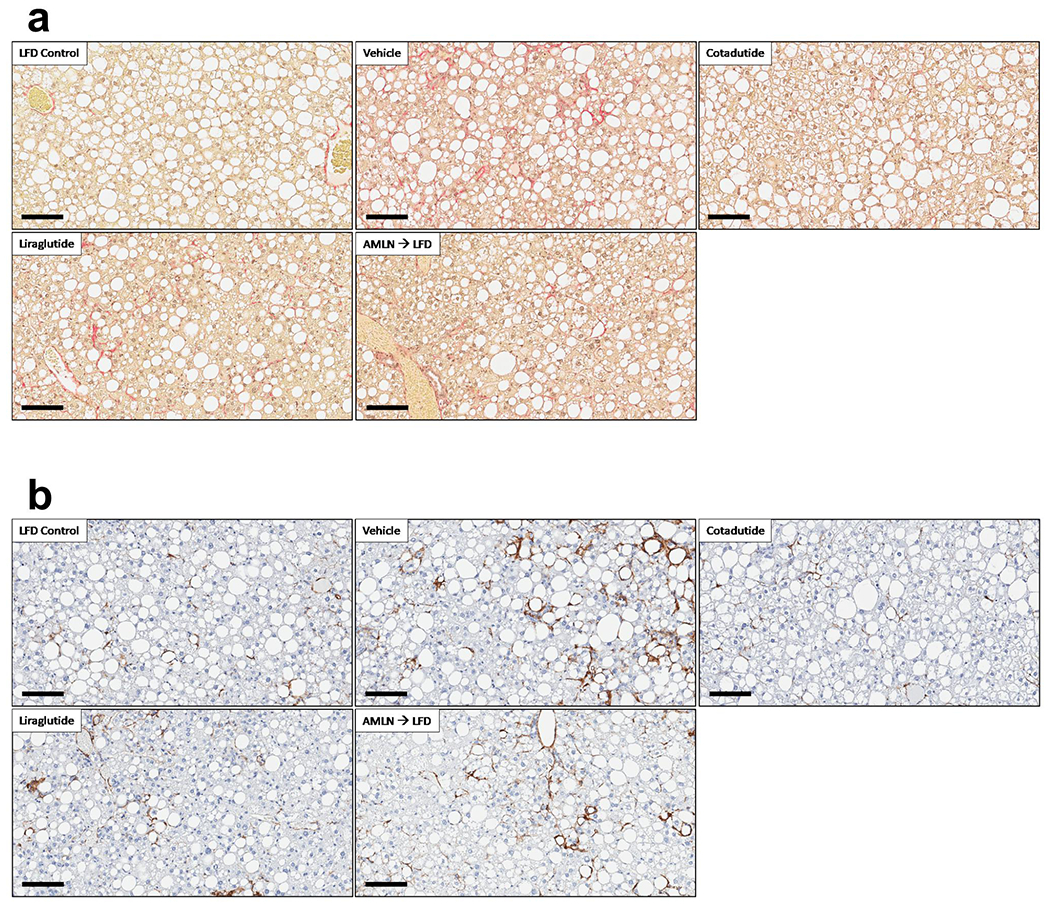
(a) representative αSMA stained liver sections, quantification is provided in Fig. 8d. Scale bar = 100 μm. (b) representative PSR stained liver sections, quantification is provided in Fig. 8e. Scale bar = 100 μm. These experiments were performed in ob/ob mice with LFD (n=8); AMLN Vehicle (n=11); Cotadutide (n=7); Liraglutide (n= 10); AMLN-to-LFD (n=10) mice/group.
Extended Data Fig. 6. Grades of histopathological NASH features corresponding to animals in Figures 7 and 8.
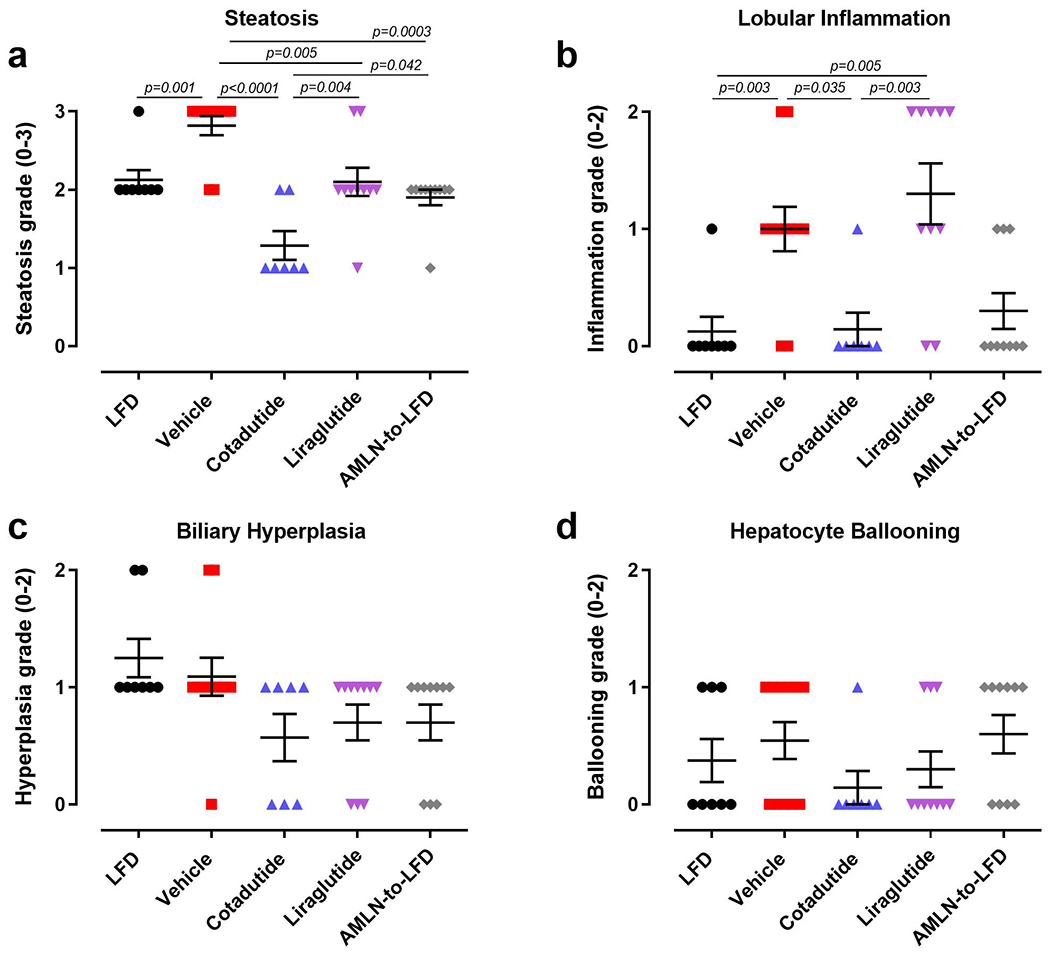
(a) steatosis grade, (b) lobular inflammation, (c) biliary hyperplasia and (d) hepatocyte ballooning. LFD (n=8); Vehicle (n=11); Cotadutide (n=7); Liraglutide (n=10); AMLN-to-LFD (n=10). Data represented as the mean ± SEM. Two-sided student’s t-test for LFD vs. vehicle to determine effect of NASH diet; one-way ANOVA, Tukey’s multiple comparison post-hoc test, LFD group excluded.
Extended Data Fig. 7. CD68, a marker of immune cell infiltration, is reduced by Cotadutide in animals corresponding to Figures 7 and 8.
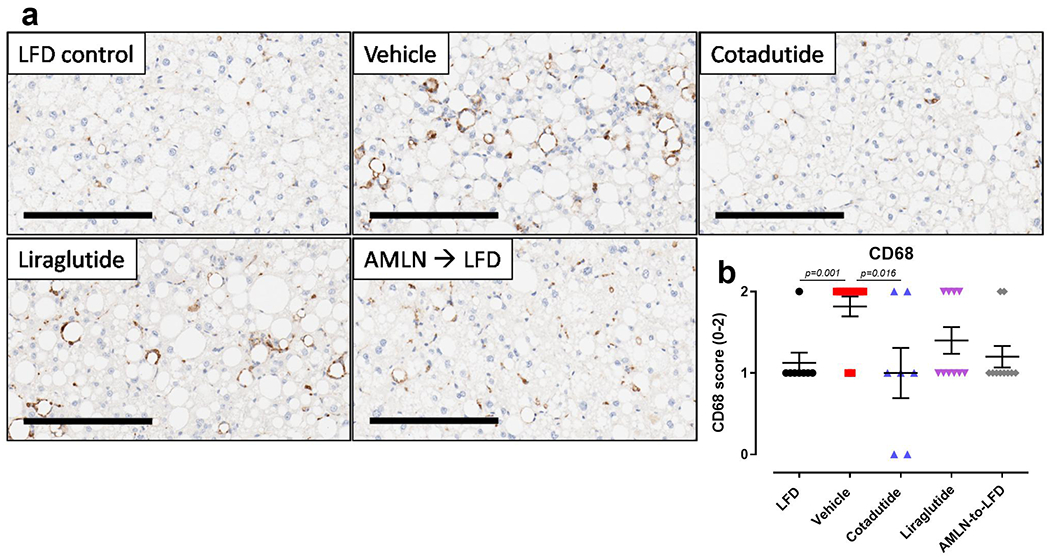
(a) Representative images of CD68 IHC staining of mouse liver and the (b) pathologist graded scoring. LFD control slides are set to baseline of 1 to account for resident Kupffer cells (dark stained spots disperse equally between hepatocytes). Infiltration of immune cells identified by accumulation around vacuoles we scored relative to the baseline. Scale bar = 200 μm. LFD (n=8); Vehicle (n=11); Cotadutide (n=7); Liraglutide (n=10); AMLN-to-LFD (n=10). Data represented as the mean ± SEM. Two-sided student’s t-test for LFD vs. vehicle to determine effect of NASH diet; One-way ANOVA, Tukey’s multiple comparisons post-hoc test, LFD group excluded.
Supplementary Material
ACKNOWLEDGEMENTS
The authors wish to thank the Lab Animal Resource staff at MedImmune/AstraZeneca for their assistance with animal husbandry and care. We thank Diana Leeming and Morten Karsdal (Nordic Biosciences, Denmark) for assistance with circulating collagen fragment detection and interpretation. We thank Kendra Hightower (Metabolon, Durham, NC) for assistance with metabolomics analyses and interpretation. The authors also wish to thank Meena Jain (Astrazeneca, Cambridge, UK) for critical review and comments on the manuscript during preparation. The Villum Center for Bioanalytical Sciences at University of Southern Denmark is acknowledged for access to high-end MS instruments. Vanderbilt MMPC and their NIH funding (DK059637).
Footnotes
COMPETING INTERESTS STATEMENT
The authors declare competing interests as defined by Nature Research. Employee of AstraZeneca (R.C.L., K.M., S.O., J.C., J.N., J.G., L.J., C.J.R.). Owns stock in AstraZeneca (K.M., S.O., J.C., J.N., J.G., L.J., C.M.R., J.L.T., C.J.R.).
REFERENCES
- 1.Younossi Z, et al. Global burden of NAFLD and NASH: trends, predictions, risk factors and prevention. Nat Rev Gastroenterol Hepatol 15, 11–20 (2018). [DOI] [PubMed] [Google Scholar]
- 2.Ibrahim SH, Hirsova P & Gores GJ Non-alcoholic steatohepatitis pathogenesis: sublethal hepatocyte injury as a driver of liver inflammation. Gut 67, 963–972 (2018). [DOI] [PMC free article] [PubMed] [Google Scholar]
- 3.Friedman SL, Neuschwander-Tetri BA, Rinella M & Sanyal AJ Mechanisms of NAFLD development and therapeutic strategies. Nature Medicine 24, 908–922 (2018). [DOI] [PMC free article] [PubMed] [Google Scholar]
- 4.Cusi K Treatment of patients with type 2 diabetes and non-alcoholic fatty liver disease: current approaches and future directions. Diabetologia 59, 1112–1120 (2016). [DOI] [PMC free article] [PubMed] [Google Scholar]
- 5.Bueter M & le Roux CW Gastrointestinal hormones, energy balance and bariatric surgery. Int J Obes (Lond) 35 Suppl 3, S35–39 (2011). [DOI] [PubMed] [Google Scholar]
- 6.Ionut V, Burch M, Youdim A & Bergman RN Gastrointestinal hormones and bariatric surgery-induced weight loss. Obesity (Silver Spring) 21, 1093–1103 (2013). [DOI] [PMC free article] [PubMed] [Google Scholar]
- 7.Meek CL, Lewis HB, Reimann F, Gribble FM & Park AJ The effect of bariatric surgery on gastrointestinal and pancreatic peptide hormones. Peptides 77, 28–37 (2016). [DOI] [PubMed] [Google Scholar]
- 8.Cohen MA, et al. Oxyntomodulin suppresses appetite and reduces food intake in humans. J Clin Endocrinol Metab 88, 4696–4701 (2003). [DOI] [PubMed] [Google Scholar]
- 9.Wynne K, et al. Oxyntomodulin increases energy expenditure in addition to decreasing energy intake in overweight and obese humans: a randomised controlled trial. Int J Obes (Lond) 30, 1729–1736 (2006). [DOI] [PubMed] [Google Scholar]
- 10.Scott R, Minnion J, Tan T & Bloom SR Oxyntomodulin analogue increases energy expenditure via the Gcg receptor. Peptides 104, 70–77 (2018). [DOI] [PMC free article] [PubMed] [Google Scholar]
- 11.Ambery P, et al. Cotadutide, a GLP-1 and Gcg receptor dual agonist, in obese or overweight patients with type 2 diabetes: a randomised, controlled, double-blind, ascending dose and phase 2a study. The Lancet 10140, 2607–2618 (2018). [DOI] [PubMed] [Google Scholar]
- 12.Day JW, et al. A new Gcg and GLP-1 co-agonist eliminates obesity in rodents. Nat Chem Biol 5, 749–757 (2009). [DOI] [PubMed] [Google Scholar]
- 13.Henderson SJ, et al. Robust anti-obesity and metabolic effects of a dual GLP-1/Gcg receptor peptide agonist in rodents and non-human primates. Diabetes Obes Metab 18, 1176–1190 (2016). [DOI] [PMC free article] [PubMed] [Google Scholar]
- 14.Khajavi N, Biebermann H, Tschop M & DiMarchi R Treatment of Diabetes and Obesity by Rationally Designed Peptide Agonists Functioning at Multiple Metabolic Receptors. Endocr Dev 32, 165–182 (2017). [DOI] [PubMed] [Google Scholar]
- 15.Tan TM, et al. Coadministration of Gcg-like peptide-1 during Gcg infusion in humans results in increased energy expenditure and amelioration of hyperglycemia. Diabetes 62, 1131–1138 (2013). [DOI] [PMC free article] [PubMed] [Google Scholar]
- 16.Pocai A, et al. Glucagon-like peptide 1/Gcg receptor dual agonism reverses obesity in mice. Diabetes 58, 2258–2266 (2009). [DOI] [PMC free article] [PubMed] [Google Scholar]
- 17.Patel V, et al. Coagonist of GLP-1 and Gcg receptor ameliorates development of non-alcoholic fatty liver disease. Cardiovasc Hematol Agents Med Chem 16, 35–43 (2018). [DOI] [PubMed] [Google Scholar]
- 18.Patel V, et al. Coagonist of Gcg-like peptide-1 and Gcg receptors ameliorates nonalcoholic fatty liver disease. Can J Physiol Pharmacol 96, 587–596 (2018). [DOI] [PubMed] [Google Scholar]
- 19.Valdecantos MP, et al. A novel Gcg-like peptide 1/Gcg receptor dual agonist improves steatohepatitis and liver regeneration in mice. Hepatology 65, 950–968 (2017). [DOI] [PubMed] [Google Scholar]
- 20.Hansen HH, et al. Mouse models of nonalcoholic steatohepatitis in preclinical drug development. Drug Discov Today 22, 1707–1718 (2017). [DOI] [PubMed] [Google Scholar]
- 21.Koliaki C, et al. Adaptation of hepatic mitochondrial function in humans with non-alcoholic fatty liver is lost in steatohepatitis. Cell Metab 21, 739–746 (2015). [DOI] [PubMed] [Google Scholar]
- 22.Lawitz EJ, et al. Acetyl-CoA Carboxylase Inhibitor GS-0976 for 12 Weeks Reduces Hepatic De Novo Lipogenesis and Steatosis in Patients With Nonalcoholic Steatohepatitis. Clin Gastroenterol Hepatol 16, 1983–1991 (2018). [DOI] [PubMed] [Google Scholar]
- 23.Boland ML, et al. Nonalcoholic steatohepatitis severity is defined by a failure in compensatory antioxidant capacity in the setting of mitochondrial dysfunction. World J Gastroenterol 24, 1748–1765 (2018). [DOI] [PMC free article] [PubMed] [Google Scholar]
- 24.Shaw RJ, et al. The kinase LKB1 mediates glucose homeostasis in liver and therapeutic effects of metformin. Science 310, 1642–1646 (2005). [DOI] [PMC free article] [PubMed] [Google Scholar]
- 25.Koo S-H, et al. The CREB coactivator TORC2 is a key regulator of fasting glucose metabolism. Nature 437, 1109–1113 (2005). [DOI] [PubMed] [Google Scholar]
- 26.Dulai PS, et al. Increased risk of mortality by fibrosis stage in nonalcoholic fatty liver disease: Systematic review and meta-analysis. Hepatology 65, 1557–1565 (2017). [DOI] [PMC free article] [PubMed] [Google Scholar]
- 27.Armstrong MJ, et al. Liraglutide safety and efficacy in patients with non-alcoholic steatohepatitis (LEAN): a multicentre, double-blind, randomised, placebo-controlled phase 2 study. Lancet 387, 679–690 (2016). [DOI] [PubMed] [Google Scholar]
- 28.Neuschwander-Tetri BA, et al. Farnesoid X nuclear receptor ligand obeticholic acid for non-cirrhotic, non-alcoholic steatohepatitis (FLINT): a multicentre, randomised, placebo-controlled trial. Lancet 385, 956–965 (2015). [DOI] [PMC free article] [PubMed] [Google Scholar]
- 29.Loomba R, et al. GS-0976 Reduces Hepatic Steatosis and Fibrosis Markers in Patients with Nonalcoholic Fatty Liver Disease. Gastroenterology 155, 1463–1473 (2018). [DOI] [PMC free article] [PubMed] [Google Scholar]
References for Materials and Methods
- 30.Ayala JE, et al. Hyperinsulinemic-euglycemic Clamps in Conscious, Unrestrained Mice. J Vis Exp, e3188 (2011). [DOI] [PMC free article] [PubMed] [Google Scholar]
- 31.Steele R, Wall JS, De Bodo RC & Altszuler N Measurement of size and turnover rate of body glucose pool by the isotope dilution method. Am J Physiol 187, 15–24 (1956). [DOI] [PubMed] [Google Scholar]
- 32.Bederman IR, Foy S, Chandramouli V, Alexander JC & Previs SF Triglyceride synthesis in epididymal adipose tissue: contribution of glucose and non-glucose carbon sources. J Biol Chem 284, 6101–6108 (2009). [DOI] [PMC free article] [PubMed] [Google Scholar]
- 33.Hasenour CM, et al. Mass spectrometry-based microassay of 2H and 13C plasma glucose labeling to quantify liver metabolic fluxes in vivo. Am J Physiol Endocrinol Metab 309, E191–203 (2015). [DOI] [PMC free article] [PubMed] [Google Scholar]
- 34.Young JD INCA: a computational platform for isotopically non-stationary metabolic flux analysis. Bioinformatics 30, 1333–1335 (2014). [DOI] [PMC free article] [PubMed] [Google Scholar]
- 35.Hughey CC, et al. Loss of hepatic AMP-activated protein kinase impedes the rate of glycogenolysis but not gluconeogenic fluxes in exercising mice. J Biol Chem 292, 20125–20140 (2017). [DOI] [PMC free article] [PubMed] [Google Scholar]
- 36.Chan TM & Exton JH A method for the determination of glycogen content and radioactivity in small quantities of tissues or isolated hepatocytes. Anal.Biochem. 71, 96–105 (1976). [DOI] [PubMed] [Google Scholar]
- 37.Yang D, et al. Assay of low deuterium enrichment of water by isotopic exchange with [U-13C3]acetone and gas chromatography-mass spectrometry. Anal Biochem 258, 315–321 (1998). [DOI] [PubMed] [Google Scholar]
- 38.Previs SF, et al. Using [(2)H]water to quantify the contribution of de novo palmitate synthesis in plasma: enabling back-to-back studies. Am J Physiol Endocrinol Metab 315, E63–e71 (2018). [DOI] [PubMed] [Google Scholar]
- 39.Burgess SC, et al. Impaired tricarboxylic acid cycle activity in mouse livers lacking cytosolic phosphoenolpyruvate carboxykinase. J Biol Chem 279, 48941–48949 (2004). [DOI] [PubMed] [Google Scholar]
- 40.Antoniewicz MR, Kelleher JK & Stephanopoulos G Measuring Deuterium Enrichment of Glucose Hydrogen Atoms by Gas Chromatography/Mass Spectrometry. Analytical Chemistry 83, 3211–3216 (2011). [DOI] [PMC free article] [PubMed] [Google Scholar]
- 41.Kristiansen MN, et al. Obese diet-induced mouse models of nonalcoholic steatohepatitis-tracking disease by liver biopsy. World J Hepatol 8, 673–684 (2016). [DOI] [PMC free article] [PubMed] [Google Scholar]
- 42.Barascuk N, et al. A novel assay for extracellular matrix remodeling associated with liver fibrosis: An enzyme-linked immunosorbent assay (ELISA) for a MMP-9 proteolytically revealed neo-epitope of type III collagen. Clin Biochem 43 (10-11), 899–904 (2010). [DOI] [PubMed] [Google Scholar]
- 43.Leeming DJ, et al. Enzyme-linked immunosorbent serum assay specific for the 7S domain of Collagen Type IV (P4NP 7S): A marker related to the extracellular matrix remodeling during liver fibrogenesis. Hepatol Res 42, 482–493 (2012). [DOI] [PubMed] [Google Scholar]
- 44.Vassiliadis E, et al. Immunological detection of the type V collagen propeptide fragment, PVCP-1230, in connective tissue remodeling associated with liver fibrosis. Biomarkers 16, 426–433 (2011). [DOI] [PubMed] [Google Scholar]
- 45.Ouberai MM et al. Controlling the bioactivity of a peptide hormone in vivo by reversible self-assembly. Nat. Commun. 8, 1026 (2017). [DOI] [PMC free article] [PubMed] [Google Scholar]
- 46.Kleiner DE, et al. Design and validation of a histological scoring system for nonalcoholic fatty liver disease. Hepatology (Baltimore, Md.) 41, 1313–1321 (2005). [DOI] [PubMed] [Google Scholar]
- 47.Glick D, et al. BNip3 regulates mitochondrial function and lipid metabolism in the liver. Mol Cell Biol 32, 2570–2584 (2012). [DOI] [PMC free article] [PubMed] [Google Scholar]
- 48.Michopoulos F, et al. Targeted profiling of polar intracellular metabolites using ion-pair-high performance liquid chromatography and -ultra high performance liquid chromatography coupled to tandem mass spectrometry: applications to serum, urine and tissue extracts. J Chromatogr A 1349, 60–68 (2014). [DOI] [PubMed] [Google Scholar]
- 49.Dobin A, et al. STAR: ultrafast universal RNA-seq aligner. Bioinformatics 29, 15–21 (2013). [DOI] [PMC free article] [PubMed] [Google Scholar]
- 50.Subramanian A, et al. Gene set enrichment analysis: a knowledge-based approach for interpreting genome-wide expression profiles. Proc Natl Acad Sci U S A 102, 15545–15550 (2005). [DOI] [PMC free article] [PubMed] [Google Scholar]
- 51.Liberzon A, et al. Molecular signatures database (MSigDB) 3.0. Bioinformatics 27, 1739–1740 (2011). [DOI] [PMC free article] [PubMed] [Google Scholar]
- 52.Liberzon A, et al. The Molecular Signatures Database (MSigDB) hallmark gene set collection. Cell Syst 1, 417–425 (2015). [DOI] [PMC free article] [PubMed] [Google Scholar]
- 53.Hanzelmann S, Castelo R & Guinney J GSVA: gene set variation analysis for microarray and RNA-seq data. BMC Bioinformatics 14, 7 (2013). [DOI] [PMC free article] [PubMed] [Google Scholar]
- 54.Network T.C.R.A. pheatmap: Pretty Heatmaps. (2018).
- 55.Kang T, et al. Characterization of the Molecular Mechanisms Underlying Glucose Stimulated Insulin Secretion from Isolated Pancreatic beta-cells Using Post-translational Modification Specific Proteomics (PTMomics). Mol Cell Proteomics 17, 95–110 (2018). [DOI] [PMC free article] [PubMed] [Google Scholar]
- 56.The M, et al. Fast and accurate proteim false discovery rates on large-scale proteomics data sets with percolator 3.0. J. Am. Soc. Mass Spectrom 27, 1719–1727 (2016). [DOI] [PMC free article] [PubMed] [Google Scholar]
- 57.Käll L, et al. Semi-supervised learning for peptide identification from shotgun proteomics datasets. Nature Methods 4(11), 923–925 (2007). [DOI] [PubMed] [Google Scholar]
- 58.Marx H, et al. A large synthetic peptide and phosphopeptide reference library for mass spectrometry-based proteomics. Nature Biotechnology 13(6), 557–566 (2013). [DOI] [PubMed] [Google Scholar]
- 59.Navarro P, et al. General statistical framework for quantitative proteomics by stabe isotope labeling. J. Proteome Res. 13, 1234–1247 (2014). [DOI] [PubMed] [Google Scholar]
- 60.Zierer J, et al. The fecal metabolome as a functional readout of the gut microbiome. Nat Genet 50, 790–795 (2018). [DOI] [PMC free article] [PubMed] [Google Scholar]
- 61.Zhang M, et al. Adipocyte-derived lipids mediate melanoma progression via FATP proteins. Cancer Discov 8, 1006–1025 (2018). [DOI] [PMC free article] [PubMed] [Google Scholar]
- 62.Lofgren L, et al. The BUME method: a novel automated chloroform-free 96-well total lipid extraction method for blood plasma. J Lipid Res 53, 1690–1700 (2012). [DOI] [PMC free article] [PubMed] [Google Scholar]
Associated Data
This section collects any data citations, data availability statements, or supplementary materials included in this article.
Supplementary Materials
Data Availability Statement
The datasets generated during these studies are available from the corresponding author on reasonable request. These datasets include: in vivo data for the mouse studies and encompass metabolic, biochemical and histological data/images; mass spectrometry data from mouse liver and/or serum, mouse hepatocytes or human hepatocytes; imaging and quantitation data for mitochondrial analyses; qRT-PCR data for select gene expression analyses. RNAseq datasets are available in the SRA database with accession number PRJNA574649.