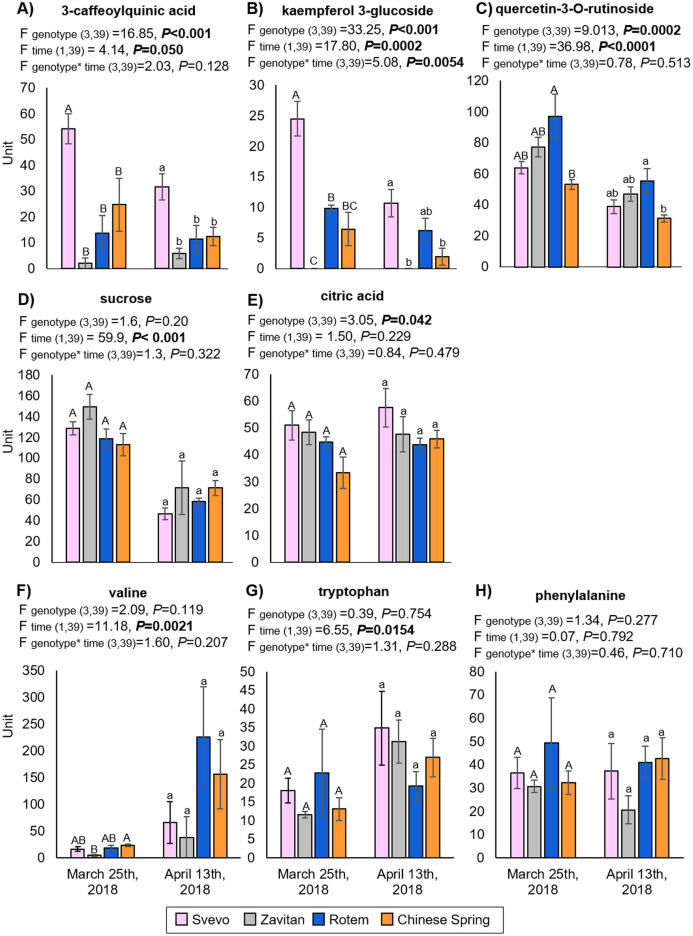
Figure 4. The relative levels of eight metabolites detected in the wheat leaves.
(A) 3-Caffeoylquinic acid, (B) kaempferol 3-glucoside, (C) quercetin-3-O-rutinoside, (D) sucrose, (E) citric acid, (F) valine, (G) tryptophan and (H) phenylalanine. The levels are presented in units (integration for the LC-qTOF-MS), mean ± SE, n = 5. Different letters above the bars indicate significant differences between genotypes for each counting date separately (P value ≤ 0.05), using the one-way ANOVA (Tukey-Kramer HSD post-hoc tests).

