

SUMMARY
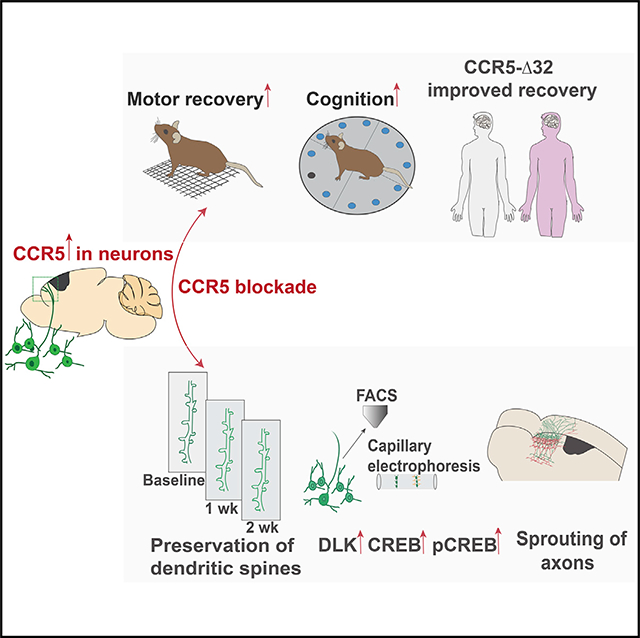
We tested a newly described molecular memory system, CCR5 signaling, for its role in recovery after stroke and traumatic brain injury (TBI). CCR5 is uniquely expressed in cortical neurons after stroke. Post-stroke neuronal knockdown of CCR5 in pre-motor cortex leads to early recovery of motor control. Recovery is associated with preservation of dendritic spines, new patterns of cortical projections to contralateral pre-motor cortex, and upregulation of CREB and DLK signaling. Administration of a clinically utilized FDA-approved CCR5 antagonist, devised for HIV treatment, produces similar effects on motor recovery post stroke and cognitive decline post TBI. Finally, in a large clinical cohort of stroke patients, carriers for a naturally occurring loss-of-function mutation in CCR5 (CCR5-Δ32) exhibited greater recovery of neurological impairments and cognitive function. In summary, CCR5 is a translational target for neural repair in stroke and TBI and the first reported gene associated with enhanced recovery in human stroke.
In Brief
Genetic and small molecule-based perturbation of CCR5 promotes functional recovery from stroke and traumatic brain injury.
Graphical Abstract
INTRODUCTION
Stroke and traumatic brain injury (TBI) are the leading causes of adult disability due to limited neurological recovery. Approximately 50%–60% of patients continue to experience motor impairments after stroke (Schaechter, 2004). 43% of those hospitalized for TBI suffer long-term disability (Ma et al., 2014). Recovery of function in these injuries have been studied most thoroughly in stroke and occurs through molecular, cellular, and behavioral systems. These include temporal upregulation of growth-promoting genes, axonal sprouting and re-mapping of cortical connections, dendritic spine morphogenesis and changes in cellular systems that subserve memory, such as inductions in long-term potentiation (LTP), and alterations in tonic gamma-aminobutyric acid (GABA) and α-amino-3-hydroxy-5-methyl-4-isoxazolepropionic acid (AMPA) receptor signaling (Clarkson et al., 2010, 2011; Overman et al., 2012; Di Lazzaro et al., 2010). While the biology of neural repair in adult brain injuries such as stroke and TBI is increasingly defined (Grafman and Salazar, 2015), there have been no medical therapies developed to promote recovery in these conditions.
Recovery after brain injury shares molecular, cellular, and neuropsychological principles with mechanisms of learning and memory. Based on these similarities, manipulations that enhance synaptic plasticity could accelerate recovery of function after stroke and TBI (Clarkson et al., 2010, 2011). Inhibition of C-C chemokine receptor 5 (CCR5) signaling has recently been shown to enhance learning, memory, and plasticity processes in hippocampal and cortical circuits (Zhou et al., 2016). To understand the role of CCR5 and mechanisms through which it affects stroke recovery, we knocked down CCR5 in motor to pre-motor cortex in neurons well after the initial stroke, during the period of limited repair and recovery. We show that neuronal knockdown of CCR5 promotes early motor recovery. Motor recovery from CCR5 knockdown (kd) is a result of heightened plasticity in the pre-motor cortex and is associated with stabilization of dendritic spines in pre-motor cortex adjacent to the stroke site, upregulation of CREB and dual leucine zipper kinase (DLK) signaling in neurons with CCR5 kd, and formation of new connections in contralateral pre-motor cortex. Furthermore, we show that in a rodent model of traumatic brain injury, CCR5 kd reduces learning deficits and improves cognitive function. CCR5 was first identified as a co-receptor for the HIV virus (Samson et al., 1996). We show that a clinically utilized FDA-approved CCR5 antagonist in AIDS therapy promotes recovery of function in stroke and TBI. Finally, in a large human stroke epidemiological study, we show that patients with a naturally occurring CCR5Δ32 loss-of-function mutation (Samson et al., 1996; Maayan et al., 2000) have enhanced motor recovery and reduced cognitive deficits months after the stroke. Taken together, our results show that CCR5 acts as a valid target for stroke and TBI recovery.
RESULTS
CCR5 Is Differentially Upregulated in Neurons Post Stroke
CCR5 is expressed in microglia in the normal brain (Wang et al., 2016), but its expression has not been well defined in other CNS cell types. We examined expression of CCR5 in cortical neurons and microglia through fluorescence in situ hybridization (FISH) and fluorescence-activated cell sorting (FACS) isolation following stroke during periods of acute tissue damage and recovery (Figure 1). In normal adult cortex, CCR5 is undetectable in neurons but is highly expressed in microglia (Figures 1A, 1B, and S1A). However, at 12 h and 7 days following a stroke, expression of CCR5 transcripts co-localize with TUBB3+ve neurons and CX3CR1+ve microglia (Figures 1C–1E, S1B, and S1C). Further, we quantified temporal changes in transcript expression of CCR5 in neurons and microglia using FACS and qPCR (Figures 1F and 1G). 12 h following a stroke, CCR5 expression in cortical neurons isolated from peri-infarct tissue is significantly heightened (p < 0.001; compared to pre-stroke) with expression levels even higher than CD11b expressing microglia/macrophages at the same time point and location (p < 0.01; Figure 1G). CCR5 expression is sustained in neurons at varying levels up to 28 days. Conversely, macrophage/microglial CCR5 expression decreases at 12 h post stroke when compared to either baseline (p < 0.01) or post-stroke neuronal CCR5 at this time point, with a regain to baseline levels at day 28 (Figure 1G). These results show that CCR5 is differentially induced in neurons after stroke and transiently declines in microglia/macrophages. This differential pattern of expression in both cell types is unique to post-stroke events.
Figure 1.

CCR5 Is Differentially Expressed in Neurons after a Cortical Stroke Data represent detection of CCR5 transcripts in sections of mouse cortex through FISH (A–E) and quantitative gene expression following FACS isolation (F and G).
(A) Representative images from healthy mouse cortex show absence of co-localization of CCR5 transcripts (red, column 2) with TUBB3+ve (yellow) neurons (column 3). Insets represent digitally magnified field of view from the image. Inset in column 2 shows DAPI+ve (blue) nuclei and negligible CCR5 (red). Schematic on left represents location of field of view. Scale bar, 50 μm.
(B) Microglia (CX3CR1+ve, yellow) co-localize with CCR5 (red) as seen in column 3 in healthy cortex. Scale bar, 50 μm.
(C) CCR5 expression co-localizes with TUBB3+veneurons and non-neuronal DAPI+ve nuclei at 12 h after stroke. Scale bar, 100 μm.
(D) Column 1 represents a projection image (3D visualization, Imaris) of neurons at higher magnification (TUBB3+ve, yellow; DAPI+ve, blue) that express CCR5 (red) at 12 h after stroke. Columns 2 and 3 represent images from column 1 that were processed with spot detection feature from Imaris (Bitplane software) as a visual aid for co-localization of TUBB3, CCR5 (column 2) and DAPI (column 3). Scale bar, 10 μm.
(E) CCR5 expression at 7 days after stroke; additional images are in Figure S1. CCR5 is expressed in neurons at lower abundance in TUBB3+ neurons compared to 12 h and non-neuronal DAPI+ve cells. Columns 2 and 3 were processed similar to (D). Scale bar, 20 μm.
(F) Representative dot plots from FACS show gating strategy used to isolate allophycocyanin (APC)-expressing NCAM+ve neurons isolated from peri-infarct cortex. Similar gating strategy was used for isolation of CD11b+ve cells. (G) Data on CCR5 gene expression quantified from FACS-isolated cells from naive and 12 h, 7 days,14 days, and 28 days post stroke. Gene expression data are from four different observations for NCAM pre-stroke, NCAM 12 h, CD11b pre-stroke, CD11b 12 h, and three different observations from all other groups. Data are mean ± SEM.
Knockdown of CCR5 Leads to Motor Recovery after Stroke and Improves Cognitive Outcome following TBI
As stroke induces neuronal expression of CCR5, and increased CCR5 signaling is associated with reduced learning and memory (Zhou et al., 2016), we examined if neuron-specific knockdown of CCR5 in pre-motor cortex promotes stroke recovery. Neuronal plasticity in pre-motor-to-motor circuits after stroke in motor cortex is causally associated with motor recovery (Clarkson et al., 2010, 2011; Overman et al., 2012; Li et al., 2015). Animals were injected with shCCR5 adeno-associated virus (AAV) or control AAV, which targets neurons, 3 days prior to stroke into pre-motor cortex anterior to the prospective stroke site. This timing of viral injection allows sufficient time for viral expression, enabling kd to be delivered well after the insult but within the first week of stroke (Figures 2A–2C). Functional recovery of motor control was determined in two tasks of spontaneous motor behaviors of the forelimb in rearing and in gait (Clarkson et al., 2010;2011; Figures 2D and 2E). Motor deficits in animals that received a stroke persisted throughout the testing period of 9 weeks. However, animals that received knockdown of CCR5 showed a substantial decrease in the number of foot faults in the grid-walk test (5.9 ± 1.09% versus 11.25 ± 1.7%, p = 0.001; Figure 2D) at 1 week that persisted to 9 weeks (4.35 ± 1.1% versus 9.48 ± 1.25%, p = 0.004) after stroke compared to animals with control AAV and stroke. Similarly, CCR5 kd led to a significant decrease in forelimb bias in the cylinder test at 3–6 weeks following stroke (0.21 ± 0.13 s versus 0.53 ± 0.06 s at week 3, p = 0.043; 0.2 ± 0.09 s versus 0.56 ± 0.11 s at week 6, p = 0.033; compared to control AAV stroke; Figure 2 E). CCR5 kd thus produced an early and sustained improvement in motor control compared with groups that had a stroke or stroke and control AAV.
Figure 2.

CCR5 kd Induces Early and Sustained Motor Recovery after Stroke and Improves Cognitive Decline after TBI
(A) Images represent expression of shCCR5 AAV in cortex at 9 days post injection in naive and post-stroke tissue. shCCR5 AAV targets neurons. Viral GFPexpression (green) co-localizes with NeuN (red) but does not co-localize with an astrocytic marker, GFAP (red) or microglial marker, IBA-1 (red). Asterisk denotes stroke site. Scale bar, 100 μm.
(B) Schematic of experimental timeline. shCCR5AAV injected anterior to the prospective stroke site in pre-motor cortex at 3 days prior to stroke. This enables delivery of viral knockdown 3–5 days after stroke as quantified in (C). Motor performances were assessed at baseline and 1–9 weeks after stroke.
(C) Quantification of CCR5 transcript expression in GFP+ve neurons FACS isolated from animals with shCCR5 AAV or control AAV at 4 days after stroke. Data show downregulation of CCR5 expression in neurons transduced with shCCR5AAV; p = 0.04. Data are mean ± SEM; n = 3.
(D and E) Animals with neuronal knockdown of CCR5 (shCCR5AAV) show improved motor performances in gridwalk (D) and cylinder (E) tests at early and late time points after stroke. Data are mean ± SEM; n = 11 for stroke + control AAV and n = 10 per group for all other conditions.
(F and G) Pharmacological inhibition of CCR5 with maraviroc produces motor recovery after stroke in gridwalking (F) and use of forelimb (G); n = 10 animals per group. Additional data are in Figure S2A.
(H and I) Maraviroc produces sustained motor recovery even after treatment cessation. n = 10 animals per group for gridwalk (H); n = 9 stroke + maraviroc and n = 8 stroke + vehicle for cylinder test (I).
(J and K) Administration of maraviroc 1 month after stroke produces motor recovery in chronic stroke as assessed in the grid walk test (J). No statistical differences observed in the cylinder test (K); n = 9 animals per group.
(L and M) shCCR5AAV or pharmacological inhibition with maraviroc improves cognitive function after TBI (closed head injury [CHI]). Animals with neuronal CCR5 kd in hippocampal CA1 and CA3 (L) or treatment with maraviroc (M) show improved performances in the Barnes maze test. n = 6 for maraviroc; n = 8 for all other groups.
(N and O) Treatment with shCCR5AAV (N) or maraviroc (O) leads to improved performances in the novel object-recognition task after CHI when compared to CHI + control AAV. Patterned bars indicate baseline performance prior to CHI. n = 6 for maraviroc; n = 8 for all other groups. Additional data presented in Figures S2B and S2C.
For (F)–(N), data are mean ± SEM.
CCR5 acts as a co-receptor for HIV (Samson et al., 1996; Maayan et al., 2000). An FDA-approved drug, maraviroc, that selectively antagonizes CCR5 function is in clinical use. As opposed to viralknockdown of CCR5, pharmacological blockade of CCR5 signaling may provide a readily translatable approach for clinical treatment of stroke. We examined if maraviroc (commercial Selzentry) promotes stroke recovery. Maraviroc (100 mg/kg) was delivered beginning 24 h post stroke through daily intraperitoneal injections for 9 weeks. The availability of maraviroc in the brain was confirmed in cerebrospinal fluid (CSF) with ultra-performance liquid chromatography (Figure S2A) and is at comparable levels to the human therapeutic range for this drug. Following stroke, maraviroc treatment resulted in improved motor control at 3 weeks on gridwalk (7.5 ± 1.3% versus 15.7 ± 1.3%, p < 0.001; Figure 2F) and cylinder tasks (0.19 ± 0.095 s versus 0.75 ± 0.11 s, p = 0.029; Figure 2G) when compared to animals that received stroke and vehicle that showed significant lasting motor impairments. Recovery induced through maraviroc treatment was similar but delayed compared to the effects of viral knockdown of CCR5 in motor-pre-motor cortex.
To further determine the therapeutic applicability of maraviroc for stroke recovery, we tested if constant CCR5 inhibition is required to sustain recovery (Figures 2H and 2I). Animals were administered with maraviroc or vehicle from 24 h to 3 weeks after stroke. On the grid walk test, animals with maraviroc treatment showed reduced number of foot faults at week 3 compared to control stroke (29.1 ± 2.45 versus 39.3 ± 1.27, p = 0.04); in concordance with the previous dataset (as in Figure 2F) and at a time period of ongoing maraviroc administration. Following termination of drug treatment, animals with maraviroc washout in stroke showed a significant decline in foot faults at week 9 compared to control stroke (27.4 ± 1.62 versus 37.3 ± 3.54, p = 0.05; Figure 2H). The pattern of recovery observed corresponded to recovery from constant inhibition of CCR5 (Figure 2F), where significant differences were observed at weeks 3 and 9. Similar results were recorded with the cylinder task, where animals with prior treatment with maraviroc showed reduced bias at week 9 compared to control (−0.18 ± 0.19 s versus 0.76 ± 0.15, p = 0.0003; Figure 2I) and is compatible with data recorded from prolonged inhibition of CCR5 (Figure 2G). These results show that short-term inhibition of CCR5 in the first month after stroke is sufficient to produce motor recovery even after the drug is no longer present.
Next, we determined the feasibility of maraviroc as treatment for chronic stroke (Figures 2J and 2K). Animals were administered with maraviroc 3 weeks after a stroke and motor deficits were assessed up to 11 weeks post stroke. In the grid walk test, animals with delayed administration of maraviroc showed improved performances with reduced foot faults at weeks 8 and 11 compared to stroke and vehicle (28.01 ± 2.38 versus 40.1 ± 2.12, p = 0.0004 for week 8; 24.7 ± 2.77 versus 38.5 ± 2.56, p ≤ 0.0001 for week 11; Figure 2J). In the cylinder test, no statistical differences were observed between treated and control groups, although differences in reduced bias were recorded (0.28 ± 0.12 s versus 0.44 + 0.19 s, p = 0.0.9 for week 8; 0.23 ± 0.13 s versus 0.36 ± 0.17 s, p = 0.97 for week 11; Figure 2K). Collectively, these results show that treatment with maraviroc during chronic stroke promotes motor recovery, further supporting translational potential of CCR5 inhibition for stroke recovery.
Stroke and TBI are the most common acquired adult brain injuries (Tennant, 2013). Both produce a region of maximal damage and reduced neuronal responsiveness. In addition to direct motor impairments, TBI also damages hippocampal circuits and produces prominent learning and memory deficits (Paterno et al., 2017). We tested if learning impairments resulting from TBI can be improved through knockdown of CCR5 in CA1 and CA3 hippocampal circuits. 48 h following a closed-head-injury model of TBI (Flierl et al., 2009), mice were examined in a novel-objectrecognition task to evaluate cognitive deficits. Animals that received CCR5 kd 2 weeks prior to TBI spent significantly more time exploring a novel object (able to identify as “novel”) over a familiar one compared to animals that received control AAV and TBI (74.1 ± 5.4 versus 59.6 ± 3.0%, p = 0.02; Figure 2N). In a separate measure to test spatial learning and memory, animals were tested in a Barnes maze between 7 and 10 days post TBI. After TBI, during the acquisition phase of the test, animals with CCR5 kd showed significant improvements in latency and shorter time to find the hole to the goal box when compared to control AAV (days 2 and 3, p < 0.01; day 4, p < 0.05; Figure 2L). The improvement in performances were comparable to healthy sham animals. Moreover, the number of errors to find the goal box in Barnes maze, as indicated by the number of “other hole” visits, were significantly lower in the CCR5 kd group when compared to control AAV and TBI (p < 0.01; Figure S2B). We next tested pharmacological blockade of CCR5. Animals that received maraviroc treatment after TBI showed improved performances in the novel-object-recognition task at 4 days following TBI (72.5 ± 2.74 versus 57.4 ± 4.1%, p = 0.0094; Figure 2O), as well as improved latency to goal box in the Barnes maze (p = 0.016 versus vehicle, day 3; Figure 2M) when compared to vehicle-treated animals. Moreover, maraviroctreated animals showed increased successful hole visits as indicated by higher number of visits to the hole of the goal box and its two adjacent holes at both sides (p < 0.01; Figure S2C). These results show that either circuit-specific viral knockdown in CA1 and CA3 or pharmacological blockade of CCR5 improves learning and cognition following TBI.
CCR5 kd Upregulates Neuronal CREB and Mediates Motor Recovery through DLK Signaling
In normal brain, CCR5 kd enhances signaling through activation of MAPK and CREB pathways (Zhou et al., 2016). We next determined molecular signaling pathways that participate in functional recovery after stroke with CCR5 kd. Neurons from pre-motor cortex transduced with either shCCR5 AAV or control AAV were FACS isolated at 1 week after stroke during periods of motor recovery (Figure 3A). Protein lysates from FACS-isolated neurons were screened for targets that were selected based on previous reports on their roles as regulators of axonal regeneration or of synaptic plasticity and participants of the CCR5 signaling cascade in other systems. These included MAPK proteins, such as p38, Erk 42/44, JNK1, JNK2, regeneration-associated proteins GAP43, DLK/MAP3K12, and the transcription factor CREB (and its phosphorylated state—pCREB). Neurons with CCR5 kd and stroke have large and significant increases in neuronal DLK (p = 0.006), CREB (p = 0.05), and pCREB (p = 0.013) (Figures 3B and 3C) when compared to neurons from animals with stroke and control AAV. We have recently shown the involvement of CREB as a critical node for recovery after stroke (Caracciolo et al., 2018). Moreover, previous studies have shown that CREB mediates axonal sprouting across multiple species during neurodevelopment and in the context of injury to induce a regenerative program (Moore and Goldberg, 2011; Huebner and Strittmatter, 2009). We confirmed upregulation of pCREB through immunostaining and show increased expression of pCREB in neurons with CCR5 kd at 7 days after stroke (Figure 3H). These results show that motor recovery resulting from CCR5 kd is associated with enhanced pCREB signaling.
Figure 3.

CCR5 kd Produces Motor Recovery through CREB and DLK Signaling
(A) Schematic on workflow for identification of downstream signaling targets.
(B–G) Protein levels for potential downstream targets quantified from FACS-isolated neurons at 7 days post stroke. Neurons transduced with shCCR5AAV show a significant increase in CREB (p = 0.05), pCREB (B; p = 0.013), and DLK (C; p = 0.009) compared to neurons with control AAV after stroke. Protein levels for Erk-p42 p44 (D), GAP43 (E; p = 0.08), JNK1, JNK2 (F), and p38MAPK (G; p = 0.09) did not statistically differ between treatment and control groups; n = 4 stroke + shCCR5AAV and n = 5 stroke + control AAV. Data are mean ± SEM.
(H) Representative images for pCREB immunostain in post-stroke tissue from animals with shCCR5AAV (top panel) or control AAV (bottom panel). Imaging parameters for pCREB photmicrographs were kept constant between groups. Neurons (NeuN, red) with shCCR5 AAV (green) show higher expression of pCREB (grayscale) compared to control AAV, compatible with protein expression data in (B). Scale bar, 10 μm.
(I and J) Knockdown of DLK abrogates motor recovery induced through CCR5 kd. Data on motor performances assessed with gridwalk (I) and cylinder (J) tests. n = 8 control AAV + stroke, and n = 10 for all other groups. Data are mean ± SEM.
DLK, a MAP kinase, is an injury and axonal regeneration signal in the peripheral nervous system (PNS) and CNS (Watkins et al., 2013; Shin et al., 2012). Given its heightened levels in neurons with CCR5 kd, we further dissected the mechanistic role of DLK signaling in motor recovery. We delivered knockdown of DLK in neurons with small hairpin DLK (shDLK) AAV (synapsin promoter) in pre-motor cortex after stroke, following which motor deficits were assessed (Figures 3I and 3J). In the gridwalk test, animals that received DLK knockdown after stroke showed significant motor deficits that persisted from weeks 1 to 9 and were comparable to stroke with control AAV (Figure 3I). To test if DLK signaling is required for motor recovery induced by CCR5 inhibition, we knocked down both CCR5 and DLK after stroke. Animals with shCCR5AAV showed a substantial decrease in foot faults from weeks 1–9, replicating the previous results (Figure 2D). Animals with dual knockdown of CCR5 and DLK showed significant motor deficits by way of increased foot faults from weeks 1–9 after stroke (11.3 ± 0.1 versus 16.2 ± 0.1, p > 0.0001 at week 1; 11.7 ± 0.08 versus 14.8 ± 0.05, p = 0.02). Similarly, in the cylinder test (Figure 3J), animals with CCR5 and DLK knockdown showed a gradual increase in motor deficit with significant impairments at weeks 6 and 9 compared to animals with stroke and CCR5 kd. (0.49 + 0.14 s versus −0.061 + 0.19 s, p = 0.001 at week 6; 0.48 + 0.11 versus 0.089 + 0.11, p = 0.02 at week 9; Figure 3J). In short, the recovery effects induced by CCR5 kd were abrogated with diminished levels of DLK. These results show that DLK is an effector of signaling processes through which CCR5 kd mediates motor recovery.
CCR5 kd Preserves Dendritic Spines in Pre-motor Cortex within the First Week after a Stroke
Motor learning is associated with plastic changes in dendritic spines that include weakening (spine loss) or strengthening (spine morphogenesis, clustering) of synapses in task-specific cortical networks that engage in learning and memory processes (Fu et al., 2012). The loss of neuronal circuits from a stroke is reflected in early loss of dendritic spines in cortical neurons that are adjacent to the stroke site (Brown et al., 2007, 2008). DLK and CREB mediate responses in dendritic spines in response to injury and memory association (Middei et al., 2012; Li et al., 2010). We examined if CCR5 kd affects dendritic spine dynamics after stroke by tracking changes in real time with two-photon imaging at 4 and 12 days after stroke. These are post-stroke time points of maximal spine loss and then spine gain after stroke (Mostany et al., 2010). Stroke causes a significant loss of dendritic spines (resultant survival fraction—50 ± 2.9%) in pre-motor cortex at 4 days when compared to pre-stroke conditions (Figures 4A and 4B). However, some spines re-emerge at 12 days, leading to an increase in surviving fraction to 66.9 ± 3.6%. The increase in total spines was also reflected as a decline in spines lost (50 ± 1.3% 4 days; 41 ± 1.9% at 12 days; Figures 4A and 4C). A gain of 6.3 ± 1.2% spines at 4 days and 14.1 ± 1.1% at 12 days post stroke were observed. These results demonstrate that stroke induces early spine loss in adjacent cortex in the first few days, consistent with previous observations (Brown et al., 2007, 2008). Moreover, the re-emergence and gain of spines is indicative of a recovering circuit (Mostany et al., 2010; Wang et al., 2016).
Figure 4.

CCR5 kd Reduces Dendritic Spine Loss and Increases Survival Fraction of Dendritic Spines in Pre-motor Cortex following Stroke
(A) Representative images of dendritic spine dynamics after stroke, or stroke + treatment. Stroke causes spine loss (red arrows). Some spines re-emerge at 12 days after stroke (green arrows). Few new spines are added (yellow arrows).
(B and C) Quantification of spine changes at 4 days (B) and 12 days (C) following stroke. n = 5 stroke alone, n = 4 stroke + shCCR5AAV, and n = 3 stroke + control AAV. Data are mean ± SEM.
We next examined if CCR5 inhibition post stroke significantly alters spine loss, stability, or gain. At 4 days after stroke, animals with shCCR5AAV or treatment with maraviroc showed an increase in total number of spines in pre-motor cortex when compared to stroke and control virus or stroke alone (80.3 ± 9.7% versus 50.6 ± 3.6%, p = 0.0004; 79 ± 5% versus 53.3 ± 4.1%, p < 0.0001; Figure 4B). This increase in total spines was a result of an increase in the surviving fraction of spines; i.e., more spines persisted after stroke and CCR5 inhibition (72.6 ± 7.3 versus 48.5 ± 4.6, p = 0.005 for CCR5kd versus control virus; 63.7 ± 3.2 versus 50 ± 2.9, p = 0.02 for maraviroc versus stroke alone). Consistent with increased spine preservation, a decline in fraction of spines lost was recorded with treatment with maraviroc or CCR5 kd and stroke (34.2 ± 5.3 versus 51.5 ± 4.6, p = 0.02 for CCR5kd; 36 ± 3.2 versus 51.8 ± 2, p = 0.007 for maraviroc versus stroke alone). In addition, treatment with maraviroc led to a significant gain of new spines (19.1 ± 2.3 versus 5.7 ± 2.3, p = 0.02), an effect that trended with viral CCR5kd (9.1 ± 2.3 versus 1.9 ± 1.9, p = 0.057 compared to stroke + control AAV). At 12 days after stroke (Figure 4C), the effects of CCR5 kd on spine preservation was further enhanced, as well as associate effects on decreased spine loss when compared to stroke and control AAV (93.4 + 7.6% versus 53.5 + 2.5% total spines, 81 + 3.3% versus 50.3 + 4.1% persistent, and 24 + 5.1% versus 49.7 + 4.1% lost; p > 0.0001, 0.0006, 0.0045). However, treatment with maraviroc did not produce any significant effects on spine loss, preservation, or gain when compared to stroke alone at this time point (p > 0.9).
Taken together, the data show that CCR5 kd leads to preservation of spines in cortical dendrites in pre-motor cortex in the first and second weeks following stroke in the motor cortex. This suggests that CCR5 kd preserves circuit connectivity in adjacent brain areas after stroke. Moreover, the effect on spine preservation induced by CCR5 kd in pre-motor circuits in the first week of stroke parallels temporal periods of behavioral motor recovery also manifested in the first week after stroke (Figures 2D and 2E).
CCR5 kd after Stroke Enhances Axonal Projections to Contralateral Cortex
We have previously characterized axonal sprouting in peri-infarct cortex as a mechanism through which long-term recovery is mediated, in part through the formation of new connections in the cortical motor system (Li et al., 2010; Overman et al., 2012). To test for changes in axonal projections in the motor system with CCR5 kd, we quantified projections from pre-motor cortex at the site of AAV-shCCR5 kd or in control AAV 10 weeks after stroke using microinjections of an anatomical tracer, biotinylated dextran amine (BDA) (Figures 5, S3, and S4). BDA injection size and location did not change across treatment groups (Figure S5H). Axonal projections from pre-motor cortex were examined in both cortical hemispheres. The ipsilateral cortex contained sites of stroke, viral CCR5 kd (or control AAV), and BDA tracer. In normal non-stroke ipsilateral cortex, CCR5 kd alone did not alter the spatial pattern of axonal connections from pre-motor cortex to other regions of ipsilateral cortex (Figure S4A; p = 0.086). Following stroke, CCR5 kd also did not significantly alter the spatial pattern of axonal connections in ipsilateral cortex when compared to stroke only, (p = 0.25; Figure S4B) and stroke + control AAV virus (p = 0.062; Figure 5A; representative images in Figure S3B and S3D). These results show that in ipsilateral cortex, CCR5 kd following stroke does not change the pattern of axonal connections from pre-motor cortex.
Figure 5. CCR5 kd Induces Axonal Sprouting in Contralateral Cortex.

Maps represent Cartesian coordinates of BDA-labeled axons. Axes represent approximate stereotactic coordinates lateral and anterior to bregma. BDA injection placed in pre-motor cortex 10 weeks post stroke. BDA+ve projections from injection site mapped in ipsilateral (A and B) and contralateral (C and D) cortices. Blue represents projections from control condition, red from treated conditions, and royal blue from overlap between conditions. Polar plots on the right of each map aid in visualizing spatial differences between conditions plotted. n = 5 animals per group; Hoteling’s T2 test. Additional data presented in Figures S3 and S4. (A and B) BDA-labeled projections mapped in ipsilateral cortex. A large proportion of axons overlaps between stroke + shCCR5 AAV (red) and stroke + control AAV (sky blue) (A). Treatment from either condition did not produce unique projections; p = 0.062. Statistical non-significance confirmed with additional testing that showed that 95% prediction ellipses under bivariate normal distribution have 93.5% overlap, suggesting spatial distribution of axons did not differ in a statistically meaningful way. Treatment with maraviroc (B, red) resulted in a band of unique projections that occupied peri-infarct cortex compared with stroke + vehicle (sky blue; p = 0.001).
(C and D) Cortical axons projecting from ipsilateral pre-motor cortex mapped in contralateral cortex.
(E) Overview of (A) and (C) in mouse brain showing extent of axonal projections in contralateral hemisphere as a result of CCR5 kd.
However, in contralateral cortex to the stroke site, viral CCR5 kd induced a robust axonal sprouting response. Post-stroke knockdown of CCR5 in ipsilateral cortex led to substantial numbers of axons from ipsilateral pre-motor cortex to new regions in contralateral pre-motor, pre-frontal, and somatosensory cortices. These differences were large and significant (p = 0.003) when compared to the axonal connections to contralateral cortex from ipsilateral pre-motor cortex in the conditions of stroke + control AAV or stroke alone (Figures 5C and S4F; representative images in Figures S4G and S4I). In particular, intense and expanded labeling of inter-hemispheric projections from pre-motor cortex adjacent to the stroke to contralateral pre-motor cortex was observed as a result of CCR5 kd. CCR5 kd alone or stroke alone did not significantly change the pattern of contralateral projections when compared to normal contralateral cortex (p = 0.83, 0.8; Figures S4D and S4E). For maraviroc, animals that received maraviroc treatment showed an increase in axonal projections in the ipsilateral cortex that form a narrow band of unique projections in the peri-infarct zone when compared with animals that received stroke alone (p = 0.001; Figure 5B; representative image Figure S3C). In the contralateral hemisphere, treatment with maraviroc resulted in robust sprouting of axons where projections from ipsilateral pre-motor cortex were most prominent in the contralateral somatosensory area compared to stroke alone (Figure 5D; p = 0.039; representative image in Figure S4H). Similar to viral knockdown of CCR5, treatment with maraviroc led to outgrowth of projections to the pre-motor region in contralateral cortex; however, this effect was more pronounced with viral knockdown of CCR5.
Collectively, these results strongly indicate that viral or pharmacological CCR5 kd causes axonal sprouting in the projections between pre-motor areas in post-stroke conditions. The increase in axonal connections between bilateral pre-motor areas when CCR5 function is reduced after stroke suggests that this may be a mechanism for the enhanced functional recovery from stroke.
CCR5 kd Reduces Astrocyte Reactivity and Dampens Macrophage Recruitment
CCR5 signaling has been widely implicated in immune responses. Stroke leads to local (astrocytes, microglia) and peripheral (neutrophils, macrophages, monocytes) recruitment of immune or inflammatory cells. Interventions to modulate astrogliosis following stroke have been linked to improved stroke recovery (Adelson et al., 2012; Barreto et al., 2012). We determined if CCR5 kd alters local glial and inflammatory activation in peri-infarct cortex by measuring immunoreactivity for reactive microglia (IBA-1 positive) and reactive astrocytes (GFAP positive). We mapped spatial changes in immunoreactivity in peri-infarct cortex (Figures 6B and S5A), as well as measured overall changes in immunoreactivity (Figures S5B–S5F). At 7 days following stroke, overall astrocytic reactivity in tissue with stroke and CCR5 kd did not significantly differ from stroke and control AAV (Figure S5C). However, spatial changes in astrocytic reactivity were prominent between groups. Spatial reactivity maps show that CCR5 kd decreases astrocyte reactivity in cortical areas ventral to the stroke site (p = 0.007 versus stroke alone; p = 0.048 versus stroke control AAV; Figure 6B). This effect on reducing astrocytic reactivity was diminished at 2 months post stroke (p = 0.067 versus stroke + control AAV; Figure S5A). In contrast to astrocytic reactivity at 7 days, IBA-1 immunoreactivity at 7 days following CCR5 kd did not show any significant spatial or overall changes in reactivity compared to control AAV and stroke (p = 0.7;0.9 versus stroke + control AAV; Figures 6B and S5E). Next, we examined changes in glial reactivity following treatment with maraviroc. Overall astrocytic reactivity was reduced at 7 days with maraviroc treatment (p = 0.02 versus stroke alone; Figure S5C). Spatial reactivity maps show that astrocytic reactivity was substantially and significantly diminished in cortical areas dorsal and ventral to the stroke site when compared to stroke alone (p = 0.0089; Figure 6B). This effect from maraviroc treatment was comparable but more pronounced compared to viral CCR5 kd. Similar to viral CCR5 kd, treatment with maraviroc did not differentially alter IBA-1 reactivity at 7 days (p = 0.7 compared to stroke alone; Figure 6B). Moreover, no significant changes in astrocytic or IBA-1 immunoreactivity were observed at 2 months between control groups and viral or pharmacological inhibition of CCR5 (Figures S5A, S5D, and S5F). Also, treatment with maraviroc alone in healthy animals did not produce any changes in IBA-1 immunoreactivity (Figure S5B). In summary, these results show that CCR5 kd or pharmacological inhibition significantly reduces astrocytic reactivity in the first week after stroke.
Figure 6.

CCR5 kd Reduces Astrocyte Reactivity and Dampens Post-stroke Macrophage Recruitment
(A) Images represent differential immunoreactivity for astrocytic marker GFAP and macrophage or microglial marker IBA-1 in different treatment conditions at 7 days after stroke. Astrocytic reactivity is notably reduced in animals with maraviroc or shCCR5 AAV treatment. Dotted line denotes infarct border; asterisk denotes infarct. Scale bar, 250 μm.
(B) Filled contour plots show pixel intensity heatmap for quantification of changes in spatial reactivity across infarct to peri-infarct zones. Axes represent distance from midline in the medial-lateral (x axis) and dorsal-ventral (y axis) positions. See also data for overall pixel intensity in Figure S6. n = 5 stroke + shCCR5 AAV, stroke + maraviroc and n = 4 stroke alone, stroke + control AAV.
(C–E) CCR5 kd dampens macrophage recruitment. Representative dot plots from FACS analysis show events gated for Ly6G (neutrophils; upper-right quadrant), Ly6Clow (macrophages; lower-right quadrant), and Ly6Chigh (reactive monocytes) from animals treated with stroke + control AAV or stroke + CCR5 AAV at 7 days post stroke quantified in (D) and stroke + maraviroc or stroke alone at 1 month post stroke quantified in (E); n = 4 stroke + control AAV and n = 5 for all other groups. Data are mean ± SEM.
In additional to local immune responses, we determined if CCR5 kd alters peripheral recruitment of macrophages or monocytes and neutrophils, as dampening of peripheral immune responses has been shown to modulate stroke recovery (Lee et. al. 2016; Hammond et al., 2014; Horn et al., 2008). Cells from peri-infarct cortex were FACS isolated based on expression of Ly6C that binds monocytes or macrophages and Ly6G to detect neutrophils (Pösel et al., 2016). Macrophages were further distinguished from reactive monocytes based on fluorescence intensity of Ly6C (Ginhoux and Jung, 2014). At 7 days post stroke, the proportion of overall Ly6C+ve cells in the stroke area, as well as Ly6Clo macrophages, was significantly lower in animals that received CCR5 kd compared to control AAV and stroke (30.1 ± 2.9% versus 37.2 ± 1.95% for total Ly6C, p = 0.023; 26.9 ± 2.25% versus 35.2 ± 2.23% for Ly6Clo, p = 0.008; Figures 6C and 6E). Similarly, treatment with maraviroc resulted in a decline of Ly6Clo cells when compared to animals with stroke alone (43.9 ± 4.6% versus 52.5 ± 2.08%, marginally significant, p = 0.054; Figures 6C and 6D), while the proportion of overall Ly6C cells did not significantly differ. The proportion of Ly6Chi-reactive monocytes did not differ across groups that received CCR5 kd or maraviroc treatment when compared to either stroke alone or control treatment and stroke. Moreover, Ly6G-positive neutrophils were sparse (0.01%–0.03%) and did not significantly differ across groups. These results conform with previous reports on reduced monocyte or macrophage recruitment following downregulation of CCR5 (Martin-Blondel et al., 2016). Moreover, reduced infiltration of monocyte or macrophages has been associated with improved motor recovery (Lee et al., 2016; Hammond et al., 2014) and axonal growth (Horn et al., 2008). Taken together, these results suggest that CCR5 kd induces a conducive environment for neuronal repair partly through the downregulation of monocyte or macrophage recruitment into peri-infarct tissue.
We next examined if CCR5 kd exerts its effects on recovery through reducing lesion size. Infarct area did not differ across groups that received viral CCR5 kd or maraviroc treatment compared to control AAV and stroke or stroke alone (Figure S5G) and indicates that CCR5 kd does not promote motor recovery through processes that mediate neuroprotection and rather through enhanced cortical plasticity in pre-motor cortex.
CCR5Δ32 Deletion Improves Cognitive and Functional Outcomes in Human Stroke Patients: TABASCO Study
A human CCR5 gene mutation that involves a 32-bp deletion (CCR5-Δ32, rs333) and resultant loss of function in the receptor, rendering resistance to HIV infection, has been well characterized (Maayan et al., 2000; Samson et al.; 1996). Based on our results on stroke recovery in mice following CCR5 kd, we investigated the potential of CCR5 as a target in human stroke by studying recovery in patients with CCR5-Δ32 mutation. The Tel Aviv Brain Acute Stroke Cohort (TABASCO) study is an observational analysis of the long-term outcome in mild to moderate stroke (Ben-Assayag et al., 2012). We screened this cohort for the CCR5-Δ32 (rs333) mutation. In 446 study patients, who had their cognitive assessments available (Figure S6D), there were 68 total carriers (15.2%) (Table S1). 89.7% of the carriers were Ashkenazi in their origin, compared to 57.6% in non-carriers, as would be expected with the genetic association of this mutation. A summary of baseline characteristics of the participants who had CCR5 genotyped and cognitive assessments at baseline and at 1 year of follow up (n = 396) are presented in Table S2. No differences in CCR5-Δ32 distribution were observed across stroke subtypes or between stroke and transient ischemic attack (TIA) patients across carries and non-carriers. CCR5-Δ32 carriers were more educated (p < 0.001) but did not differ in cardiovascular risk factors and frequency of the ApoE4 allele than non-carriers. No relation was observed with lesion location, infarct volume, or stroke etiology between carriers and non-carriers (Table S2). CCR5-Δ32 carriers had better neurological scores (NIH stroke scale [NIHSS]) on admission compared to non-carriers (Table 1). However, the delta NIHSS—a measure of gross motor, language, and sensory recovery (Cramer et al., 2012) in their change over time after stroke—was significantly higher for carriers from admission to 6 months and 1 year (p = 0.024, p = 0.007; Table 1) compared to non-carriers, indicating better recovery in patients with this CCR5 loss of function mutation.
Table 1.
Cognitive and Functional Outcomes in CCR5-Δ32 Carriers versus Non-carriers
| Non-carriers | CCR5-Δ32 Carriers | p | |
|---|---|---|---|
| At Admission | |||
| N | 328 | 68 | |
| Cognitive Scores | |||
| Computerized total cognitive score (SD) | 92.1 (15) | 94.2 (13) | 0.400 |
| Memory score (SD) | 88 (9.1) | 91.5 (16.4) | 0.258 |
| Executive function score (SD) | 93.8 (14.4) | 95.7 (14) | 0.421 |
| Visuospatial score (SD) | 97.8 (18.2) | 101.5 (16.4) | 0.205 |
| Verbal functioning score (SD) | 89.6 (22.8) | 85.6 (24.9) | 0.301 |
| Attention score (SD) | 92.8 (19.3) | 96.7 (16.4) | 0.208 |
| MoCA score (SD) | 23.6 (3.5) | 24.5 (3.1) | 0.099 |
| 3 Months post Stroke | |||
| N | 314 | 52 | |
| Functional Scores | |||
| Poor functional outcome (modified Rankin scale >2), n (%) | 160 (51) | 18 (34.6) | 0.029 |
| Poor functional outcome (modified Rankin scale >3), n (%) | 81 (25.8) | 7 (13.5) | 0.054 |
| FIM (total) (SD) | 119.8 (12) | 122.4 (735) | 0.042 |
| 6 Months post Stroke | |||
| N | 338 | 63 | |
| Cognitive Scores | |||
| Computerized total cognitive score (SD) | 94.1 (13.0) | 97 (11.8) | 0.106 |
| Memory score (SD) | 93.3 (17.4) | 95.6 (17.4) | 0.347 |
| Executive function score (SD) | 95.3 (12.7) | 98.3 (11.4) | 0.089 |
| Visuospatial score (SD) | 96.7 (17.7) | 97.7 (17.4) | 0.698 |
| Verbal functioning score (SD) | 90.4 (21.7) | 92.2 (21.4) | 0.544 |
| Attention score (SD) | 94.6 (16.1) | 100.4 (11.9) | 0.002 |
| MoCA score (SD) | 24.9 (3.7) | 25.9 (2.7) | 0.017 |
| Functional Scores | |||
| NIHSS (SD) | 0.7 (1.3) | 0.4 (0.9) | 0.08 |
| Delta NIHSS from admission to 6 months | 2.2 (2.9) | 1.4 (1.9) | 0.024 |
| Poor functional outcome (modified Rankin scale >2), n (%) | 66 (19.5) | 7 (11.1) | 0.165 |
| Poor functional outcome (modified Rankin scale > 3), n (%) | 26 (7.7) | 0 | 0.052 |
| 1 Year post Stroke | |||
| N | 328 | 68 | |
| Cognitive Scores | |||
| Computerized total cognitive score (SD) | 95.5 (13.4) | 98.5 (10.2) | 0.047 |
| Memory score (SD) | 96.4 (16.5) | 100.6 (13.4) | 0.033 |
| Executive function score (SD) | 96.9 (12.9) | 98 (12.2) | 0.533 |
| Visuospatial score (SD) | 99.6 (17.8) | 98.3 (16.9) | 0.615 |
| Verbal functioning score (SD) | 89.1 (23.6) | 95.9 (17.5) | 0.011 |
| Attention score (SD) | 96.6 (14.7) | 100.4 (11.3) | 0.024 |
| MoCA score (SD) | 23.7 (4.2) | 24.5 (3.1) | 0.017 |
| Functional Scores | |||
| NIHSS 1 year post stroke (SD) | 0.7 (1.6) | 0.4 (0.9) | 0.08 |
| Delta NIHSS from admission to 1 year (SD) | 2.4 (3.1) | 1.4 (2.1) | 0.007 |
| Poor functional outcome (modified Rankin scale >2), n (%) | 40 (12.2) | 10 (14.7) | 0.594 |
| Poor functional outcome (modified Rankin scale >3), n (%) | 14 (4.2) | 4 (5.8) | 0.474 |
| 2 Years post Stroke | |||
| N | 285 | 49 | |
| Cognitive Scores | |||
| MoCA score (SD) | 25 (3.9) | 26.7 (2.4) | <0.001 |
| Functional Scores | |||
| NIHSS (SD) | 0.7 (1.3) | 0.3 (0.9) | 0.032 |
| Delta NIHSS from admission to 2 years | 2.2 (2.9) | 1.3 (2.1) | 0.059 |
| Poor functional outcome (modified Rankin scale >2), n (%) | 46 (16.2) | 9 (18.4) | 0.673 |
| Poor functional outcome (modified Rankin scale >3), n (%) | 23 (8.1) | 3 (6.2) | 0.748 |
Entries are mean (SD) or n and %, as indicated. Significant results are shown in bold (p < 0.05). SD, standard deviation; NIHSS, National Institutes of Health stroke scale; MoCA, Montreal cognitive assessment; FIM, functional independence measure.
For cognitive assessment, detailed computerized battery of cognitive testing (Neurotrax) showed no difference in baseline performance after stroke between CCR5-Δ32 and non-carriers immediately after stroke (Figure S6A). At 1 year, CCR5-Δ32 carriers showed better performance in memory, verbal function, attention, and total cognitive scores compared to non-carriers (p = 0.033, p = 0.011, p = 0.024, p = 0.047, respectively; Figure S6A; also significant after adjustment for age, gender, and education; Tables S3 and S4). There were no significant differences between carriers and non-carriers for executive functioning and visuospatial scores. In an additional measure of cognitive function (MoCA) test, carriers showed better scores in visuospatial or executive, attention, language, and naming domains and in total scores at 6 months (total score), 1 year, and 2 years compared to non-carriers (p = 0.047, p = 0.048, p < 0.001, p = 0.001, and p = 0.017, respectively; Table 1 and Figures S6B and S6C).
Functional outcomes were measured based on the modified Rankin’s scale (mRS), stroke impact scale (SIS), functional independence measure (FIM); dysexecutive questionnaire (DEX), and reintegration into normal living (RNL) in stroke patients from 3 months to up to 2 years from admission (Table S4). At 3 months, CCR5-Δ32 carriers had improved scores on mRS (p = 0.029), FIM (p = 0.042) (Table S4), and certain domains of SIS and RNL (Table S4) when compared to non-carriers. At 6 months and 1 year post stroke, scores for mRS did not significantly differ between CCR5-Δ32 carriers and non-carriers, but better scores on certain domains of SIS and RNL persisted, as well as an improved DEX (subjective) score (p = 0.012 for 6 months and 1 year).
Taken together, these results are consistent with the animal studies and support the hypothesis that a CCR5 loss of function enables better recovery in human stroke patients.
DISCUSSION
Current therapies for functional recovery following stroke and other adult acquired brain injuries are limited to physical medicine, such as with neurorehabilitation. Here, we report CCR5 as a promising molecular target for stroke and TBI recovery. CCR5 expression is well characterized in microglia, but not in neurons. Stroke induces expression of CCR5 in neurons, and expression persists during the period of functional recovery. Downregulation of CCR5 in microglia at similar time points when CCR5 expression is upregulated in neurons reflects complex cell-specific changes in CCR5 signaling after stroke. We show for the first time that CCR5 kd in pre-motor-motor cortex, as well as pharmacological knockdown of CCR5, promotes substantial motor recovery after stroke. The magnitude of this recovery effect exceeds the minimal clinically important difference for motor recovery in human stroke (Page et al., 2012; Sullivan et al., 2011; Wagner et al., 2008). The effect of CCR5 kd is generalizable in the adult, as it enhances cognitive recovery in a rodent TBI model and is associated with improved recovery in human stroke.
Stroke and TBI cause loss of connections in adjacent and interacting brain regions. A mechanism of action for CCR5 kd in recovery from brain injury may be in preventing the loss of synaptic connections in adjacent cortex or promoting the formation of new connections after brain injury. CCR5 kd induces recovery through two intracellular signaling cascades, CREB and DLK. Both targets mediate injury signals, dendritic spine morphogenesis, and axonal regeneration in other systems. We show that DLK signaling is an active component in the CCR5 signaling cascade after stroke. CCR5 kd stabilizes dendritic spines after stroke, during the period of maximal spine loss in tissue adjacent to the infarct. Dendritic spine loss tracks recovery: it occurs during the period of maximal behavioral deficits in stroke models and partially recovers during the period of behavioral recovery in brain lesions (Mostany et al., 2010; Brown et al., 2007, 2008). Stroke and TBI also cause a loss of axonal connections in adjacent brain areas (Li et al., 2010; 2015; Bigler, 2013). CCR5 kd induces a remarkable degree of axonal sprouting in the bihemispheric or callosal connections of pre-motor cortex after stroke. Neurological function in pre-motor cortex, such as movement preparatory signaling and task-specific responses, is dependent on this crossed input from the contralateral hemisphere for reconstitution after inactivation of pre-motor cortex on one side (Li et al., 2016). In humans, recovery after stroke is associated with plasticity in pre-motor cortex and is driven in part by bilateral connections (Kantak et al., 2012). By stimulating greater bilateral connectivity in pre-motor cortex after stroke, CCR5 kd may facilitate recovery of function in the tissue adjacent to the infarct.
CCR5 signaling has significant implications for human stroke recovery. In a large patient cohort, we find that a loss-of-function CCR5 mutation in human patients improves stroke recovery on distinct measures of cognitive, motor, and sensory function that includes memory, verbal functioning, and attention. Relatively strong verbal function may signal the presence of frontotemporal plasticity necessary for cognitive recovery after brain ischemia (Tarasenko et al., 2016; Xing et al., 2016; Fisher et al., 2009). Other genetic mutations have been associated with reduced recovery in stroke. Patients with the ApoE4 allele and with the BDNFval66met mutation may also have reduced recovery after stroke (Balkaya and Cho, 2018; Vilkki et al., 2008). The CCR5-Δ32 mutation is the first report of a human genetic variant with an improved recovery after stroke. In terms of overall cognitive recovery with human CCR5 loss of function, the improvement in recovery is significant across a large patient cohort (446 total patients, 68 carriers) similar in size to the only other positive recovery effect in stroke: fluoxetine administration (Chollet et al., 2011) (FLAME study, n = 57). Though this fluoxetine study only measured motor recovery, the CCR5- Δ32 mutation has a bigger effect on recovery of neurological impairments in the NIH stroke scale than does fluoxetine in this positive clinical trial. Our results strongly indicate that baseline CCR5 function plays a role in the normal process of impeding stroke recovery. Together with available clinical pharmacological antagonists to block CCR5, such as the drug maraviroc, the human and animal data point to this receptor system as a valid target for future clinical trials of a stroke and TBI recovery approach.
STAR★METHODS
CONTACT FOR REAGENT AND RESOURCE SHARING
Further information and requests for resources and reagents should be directed to and will be fulfilled by Lead Contact, S. Thomas Carmichael (scarmichael@mednet.ucla.edu).
EXPERIMENTAL MODEL AND SUBJECT DETAILS
In vivo animal studies
Animals for stroke studies were performed in accordance with the US National Institutes of Health Animal Protection Guidelines and the University of California Los Angeles Chancellor’s Animal Research Committee. Animals for TBI studies were approved by the Institutional Animal Ethics Committee of the Hebrew University and complied with the guidelines of the National Research Council Guide for the Care and Use of Laboratory Animals (NIH Publication no. 85– 23, revised 1996). Adult male (2–5 months, weight 25–30 g), C57/BL6 mice (JAX) housed under 12:12 hours light: dark cycles were used. For studies described in Figure 4, adult male Thy-1 YFP-H mice (2–3 months of age, JAX -B6.Cg-Tg(Thy1-YFP)HJrs/J, Stock No: 003782). Food and water were provided ad libitum.
Stroke model
Focal cortical strokes in adult (2–4 months) male C57/BL6 mice (Jackson Laboratories) were induced through photothrombosis using a well-established procedure (Clarkson et. al 2010; 2011; Overman et al., 2012). Briefly, under isoflurane anesthesia, mice were placed in a stereotactic apparatus (Model 900, David Kopf Instruments) with the skull exposed. A cold light source (KL1500 LCD; Carl Zeiss MicroImaging) attached to a 40 × objective, giving a 2-mm diameter illumination, was positioned 1.5 mm lateral from the bregma. Rose Bengal (10mg/mL) was administered at a dose of 0.3 mL per mouse of weight, 30 g. After 5 min, the brain was illuminated through the intact skull for 18 min to produce a focal stroke of 1.8mm diameter (~1.5mm3 volume) upon light illumination. Body temperature was maintained at 37.°C with a rectal probe. Following illumination, skin was surgically glued, and mice were allowed to recover.
TBI model
Experimental closed head injury (CHI) was induced under isoflurane anesthesia using a modified weight drop device technique (Flierl et al., 2009). Briefly, under isoflurane anesthesia, a midline longitudinal incision was performed, exposing the skull. A Teflon-tipped cone (2 mm diameter) was placed 1– 2 mm lateral to the midline in the mid-coronal plane. The head was held in place and a 95-g weight was allowed a free-fall on the cone from a pre-established height, resulting in focal injury to the left hemisphere.
Human subjects
This study was approved by registered as https://clinicaltrials.gov/ Identifier: NCT01926691. All participants signed informed consent forms, approved by the local ethics committee. Baseline characteristics of patients such as gender and age have been presented in Table S2.
METHOD DETAILS
FISH
Florescence in situ hybridization was performed in accordance with manufacturer’s instructions (ViewRNA ISH, Affymetrix). Briefly, brains were harvested from animals and 12 hours and 7-days post-stroke and from control animals (n = 4–5 per group). Fresh brain tissue was flash frozen and sectioned at 12μm, fixed with 4% PFA for 30 min, dehydrated in increasing gradients of ethanol and baked at 60°C for 1 hour. Sections were treated with protease for 8 min. Following washes, sections were hybridized with commercial oligo probes (Affymetrix) to CCR5 that bind between 1527–2772 bp of CCR5 and multiplexed with probes for either TUBB3 (neurons) or CX3CR1 (microglia). The hybridization reaction lasted 2 hours. Development of chromogenic/ fluorescence signal was carried out in accordance with manufacturer’s guidelines. The specificity of CCR5 probes were validated using tissue from CCR5 KO animals. Images were captured using a confocal microscope (Nikon-C2, NIS software).
FACS
Neuronal enrichment
Infarct and peri-infarct cortex was dissected from healthy animals and animals at 12 hours, 1,2 and 4 weeks following stroke. Tissue extracts were re-suspended into cells using an adult CNS Neurocult dissociation kit (STEMCELL). Cells suspension was filtered through a mesh of pore size 70 μm and 5 3 106 – 107 cells were re-suspended in Hibernate buffer (Brain bits). Suspensions were then treated with a biotin non-neuronal antibody cocktail (MACS neuronal isolation kit, Miltenyi Biotec) and additional biotin-GLAST and biotin-CD11b antibodies. Following incubation at 4°C, the cell suspension was washed and treated with anti-biotin magnetic microbeads and filtered through a magnetic column (Miltenyi Biotec). Antibody-bound non-neuronal cells were magnetically captured in the column and the neuronal-enriched flow-through was collected and treated with APC-conjugated NCAM for 20 min.
Microglia/macrophage enrichment
Cell suspension was processed as mentioned above with the exception that cells were treated with biotin-CD11b microbeads (MACS, Miltenyi Biotec) in place of the non-neuronal cocktail. Antibody bound-CD11b cells were capture by the magnetic column and flushed using buffer. The resultant suspension was further treated with CD11b-FITC (Miltenyi Biotec) for 20 min.
For FACS sorts, forward and side scatter were used to gate single cell viable events. Events with low forward scatter and high side scatter were excluded while gating to avoid collection of debris or dead cells in addition to excluding DAPI+ve events. Signal to noise was compared to cell suspensions that underwent the same tissue processing but were not treated with antibody or an isotype control. Neurons (APC+ve) or microglia (FITC+ve) were collected using ARIA, (Becton Dickinson, UCLA FACS Core) directly into 50 μL of lysis buffer for RNA isolation. Total RNA was extracted using RNA isolation kit (QIAGEN).
Flow analysis
To quantify monocyte/macrophages and neutrophil infiltration following stroke, cell suspensions from peri-infarct cortex were processed similarly to the neuronal enrichment protocol listed above. Glial cells captured in the magnetic columns were collected and treated with antibodies to Ly6G and Ly6C (Biolegend). FACS data from cell populations treated were analyzed using FCS express software.
Quantitative transcript expression
RNA was reverse transcribed (Ovation PicoSL WTA V2, Nugen) and quantified with qPCR [SYBR green, Roche lightcycler; PCR program- 95°C:10 s (95°C:10 s; 61°C:30sec; 72°C:15sec)x 45)] with primers designed for CCR5 (Key resources table). Delta Ct expression was computed in relation to housekeeping genes- UBC or GAPDH. Purity of microglial or neuronal samples were checked for contamination from other cell-types by measuring levels of GFAP, PSD95 and IBA-1 transcript expression. GFAP and IBA-1 expression were absent in FACS isolated neurons 12 hours following stroke and control tissue. Primer sequence for mouse genes are listed in the key resources table.
KEY RESOURCES TABLE.
| REAGENT or RESOURCE | SOURCE | IDENTIFIER |
|---|---|---|
| Antibodies | ||
| Anti-GLAST ASCA microbead kit | Miltenyi Biotec | 130-095-826 |
| Anti-CD11b microbead kit | Miltenyi Biotec | 120-005-959 |
| Mouse Neuronal isolation kit | Miltenyi Biotec | 130-0987-752 |
| Mouse-CD11b-FITC | Miltenyi Biotec | 130-098-085 |
| Mouse NCAM-1/CD56 APC-conjugated | R&D | FAB7820A |
| Rat-GFAP | Thermo Fisher | 13-0300 |
| Rabbit-IBA-1 | Wako Chemicals | 019-19741 |
| Rabbit-NeuN | Abcam | ab177487 |
| Rabbit-pCREB | Cell Signaling | 9197 |
| Rabbit-CREB | Cell Signaling | 9198 |
| Rabbit-JNK1/JNK2 | Cell Signaling | 9926 |
| Rabbit p38 MAPK | Cell Signaling | 9926 |
| Rabbit-GAP43 | Abcam | ab75810 |
| Rabbit-(MAP3K12) DLK | Abcam | ab37996 |
| Erk p42/p44 | Cell Signaling | 9926 |
| Anti-mouse Ly6G | Biolegend | 127625 |
| Anti-mouse Ly6C | Biolegend | 128015 |
| Bacterial and Virus Strains | ||
| AAV5-hU6-shCCR5-EF1-GFP | Zhou et al., 2016 | N/A |
| AAV5-hU6-dsRED-EF1-GFP | Zhou et al., 2016 | N/A |
| AAV5-hSYN1-mCherry-U6-m-MAP3K12-shRNA | Vector Biolabs | N/A |
| Chemicals, Peptides, and Recombinant Proteins | ||
| Maraviroc | Selleckchem | S2003 |
| Critical Commercial Assays | ||
| ViewRNA ISH FISH kit | Affymetrix | QVT-0012 |
| Experimental Models: Organisms/Strains | ||
| Thy-YFP-H | JAX | Stock No: 003782 |
| Oligonucleotides | ||
| CCR5 FISH probe | Affymetrix | VX-06; VB1-18681-VT |
| TUBB3 FISH probe | Affymetrix | VX-06;VB6-16302-VT |
| CX3CR1 FISH probe | Affymetrix | VX-06; VB6-17362-VT |
| CCR5 (NM_00917.5) forward primer 5′TGCTGCCTAAACCCTGTCAT3′ and reverse primer 5′CGATCAGGATTGTCTTGCTGGA3′ |
Thermo fisher | N/A |
| GAPDH forward primer AGGTCGGTGTGAACGGATTTG reverse primer TGTAGACCATGTAGTTGAGGT |
Thermo fisher | N/A |
| UBC forward primer CCAAGAAGGTCAAACAGGAAGA reverse primer CCCATCACACCCAAGAACAA |
Thermo fisher | N/A |
| GFAP Forward primer CACGAACGAGTCCCTAGAGC Reverse primer GTAGGTGGCCGATCTCGATGT |
Thermo fisher | N/A |
| IBA-1 Forward primer GGACAGACTGCCAGCCTAAG Reverse primer GACGGCAGATCCTCATCATT |
Thermo fisher | N/A |
| PSD95 Forward primer CCCCAACATGGACTGTCTCT Reverse primer ACTCCATCTCCCCCTCTGTT |
Thermo fisher | N/A |
| Software and Algorithms | ||
| Heatmap | Custom | Li et.al., 2010 |
Nanoimmunoassay/ capillary electrophoresis
FACS isolated neurons were collected in lysis buffer (Mammalian lysis buffer, GE-20mM Tris hydroxymethyl- aminomethane, 20mM sodium chloride,5% NP-40, 5% Triton X-100, 5% Tween 20) with phosphatase and protease inhibitor cocktail (Halt, Thermofisher). The lysate was then subjected to capillary electrophoresis and chemiluminescence quantified with Peggy Sue instrument from ProtienSimple at the Translational Application Service Centre-TASC, Stanford University. Antibodies were used at a dilution of 1:50 and are listed in the key resources table. The secondary antibody- HRP-anti rabbit IgG; goat (Cell signaling) was used at a dilution of 1:1000.
Viral delivery and Behavioral Assessment following stroke
Mice (n = 10–12 per group) were tested on the grid-walk and cylinder tasks as described previously (Clarkson et al. 2010, 2011). Baseline behavior was established one week prior to stroke. Knockdown of CCR5 (pTR-UF12_hU6_CCR5shRNA_EF1_EGFP-AAVtype5), dsred (control) or DLK (AAV5-hSYN1-mCherry-U6-m-MAP3K12-shRNA) was delivered via intracranial injections (1.5 mm A/P, 1mm M/L, 0.75 D/V) 3 days prior to the stroke (Experimental time line in Figure 2B). This is because CCR5 knockdown and associated GFP expression was detected 7–10 days post injection (Figure 2A) and was timed appropriately for adequate knockdown during the 5–7 day peak of glial proliferation following stroke. Knockdown of CCR5 was validated 4 days post-stroke through qPCR mediated transcript expression analysis in FACS sorted GFP+ve cells from peri-infarct cortex (Figure 2C).
Behavior was assessed 1, 3,6 and 9 weeks following stroke. For the gridwalk test, deficit was calculated as the fraction of the number of right foot faults (impaired limb) over total number of steps taken. For the cylinder task, deficit was calculated as difference between baseline bias and post-stroke bias. Bias was calculated as fraction of the difference between (time spent on right paw over sum of time spent on right, left and bilateral paws) and (time spent on left paw over sum of time spent on right, left and bilateral paws). Investigators were blinded to conditions during analysis.
Viral delivery and behavioral assessment following TBI
Injections of either CCR5 AAV to knockdown CCR5 or dsred (control AAV) into the CA1and CA3 area of the hippocampus were made at four points relative to bregma (mm) a: anteroposterior axis (AP): −1.6mm posterior to bregma; ± 0.9mm mediolateral axis (ML); dorso-ventral axis (DV) −2.3mm from dura mater. b. AP −2.3mm; ML ± 2mm and DV− 1.7mm. Two weeks after surgery mice were allocated to either sham procedure or CHI, followed by neuro-behavioral and cognitive testing as described.
a). Novel Object Recognition Test
The object recognition test was performed 2–4 days after injury as previously described (Ennaceur and Delacour, 1988) and is a sensitive and reproducible measure of cognitive abnormalities in this TBI model (Biegon et al., 2004; Yaka et al., 2007). Mice were placed for a 1h habituation period in an open glass aquarium-like transparent box, one at a time, in a sound isolated room. The next day they were reintroduced into the box for 5 min with 2 identical clean plaster objects, placed in 2 different corners of the box. Four hours later, one of the objects was replaced with a new one of the same size and the mice were reintroduced for additional 5 min to the same cage. Time spent by the mouse in object exploration was recorded manually by a person blinded to the different treatments, and the cumulative time spent at each of the objects was recorded. Exploration of an object was defined as directing the nose to the object at a distance of 2 cm and/or touching it with the nose. The percentage of the cumulative exploration time that the animal spent investigating the new object out of total exploration time is a measure of recognition memory (n = 8–10/group/ experiment).
b). Barnes maze
Barnes Maze tests spatial learning and memory, where animals escape from a brightly-lit exposed circular platform surface to a small dark recessed chamber located under one of the 20 holes around the perimeter of the platform. In the Barnes Maze, bright light and aversive noise (85dB) reinforces the animals to escape from the open platform surface and to find the hole under which the dark chamber (21 × 22 × 21 cm) called “target box” is located. From the center of the maze all holes look identical. Visual cues of different colors and shapes are placed around the room. Mice were placed in a cylindrical black start chamber at the center of the maze. After 10 s, the chamber was lift, the buzzer was switched on and the mouse was allowed to explore the maze for 3 min. The trial ended when the mouse has reached the target box or after 3 min have elapsed. Immediately after entering the target box, the buzzer was turned off and the mouse was allowed to stay there for 1 min. Animals received 4 trials per day with an inter-trial interval of 15 min during 4 days. Retention test was performed by a probe trial on day 5, 24 hours after the last training day. The target box was removed, the procedure was repeated as previously, and the mouse was allowed to explore the maze for 90 s. The retention test was terminated with the first nose-poke into the target hole or after 90 s have elapsed. The probe trial is done in order to determine whether the animal remembers where the hole leading to the target box is located. The Barnes Maze was performed between days 7–11 after injury (n = 8–10/group/experiment). Videos captured were analysed using Ethovison XP10 software (Noldus, Netherlands).
Maraviroc delivery and detection
Mice (n = 10 per group) were administered with 100mg/kg of maraviroc (Selleckchem) or vehicle (30% hydroxy-cyclo-beta-dextrin and 0.9% saline) intraperitoneally, once daily, for 8–11 weeks. For animals that were induced with TBI, maraviroc (Sigma Aldrich) was dissolved in sterile saline containing 10% DMSO. Maraviroc (20mk/kg) and vehicle were injected i.p. once daily for 4 days beginning 24 hours after TBI.
To detect presence of Maraviroc in CSF, 10 μL of CSF was collected using glass needles punctured into the cisterna magna of mice 45 min following maraviroc (n = 6)/vehicle (n = 3) injection and on the third consecutive day of Maraviroc treatment following stroke. CSF samples were processed for ultra-performance liquid chromatography using an adapted protocol. Briefly, untreated CSF samples were spiked with known standards that ranged from 100 to 0.1 μg/mL of maraviroc in methanol and 0.2M ammonium acetate. 5 μL of biologically treated CSF samples were mixed with 25 μL of dichloromethane, 25 μL of hexane and 0.2M ammonium acetate. The mixture was vortexed for 5 min and centrifuged at 3,500 g for 5 min. 10 μL of hexane that forms the top layer and separates from the bottom was removed and the resultant was air-dried. The mobile phase (25 μL water+25 μL methanol) was added to the resultant air-dried vial. Analyte was detected using LC-MS (Waters LCT Premier with ACQUITY LC and autosampler, Molecular Instrumentations Centre, UCLA). Data was calculated using the formula-Amount of sample = peak area/ response factor (RF) where RF = Peak area/ standard amount of analyte. RF from standard spiked with 0.01μg/mL was used for analysis (Figure S2A).
BDA-labeling and quantitative axonal mapping
9 weeks following stroke, 0.4 μL of 10% BDA (wt/vol, Sigma) was injected into pre-motor cortex (1.8mm A/P, 1.75mm M/L, 0.75mmD/V) (n = 5 per group). Animals were perfused with 4% PFA 8 days post-injection. The cortex was dissected, flattened and sectioned as previously described (5, 14). BDA was visualized by treatment with Streptavidin Alexa-flour 594. The consistency in placement of BDA injections were validated by measuring a) injection area by tracing around extracellular tracer deposition and b) M/L and A/P injection location by measuring the distance from the center of the injection site to the rostral edge of the tissue and the midline of the cortex, respectively (Figure S5H). The size and location of each BDA injection and stroke size did not vary significantly across individual animals or by treatment condition. Stroke infarct volume was calculated as follows- volume = (A1+A2..+An)t where A = lesion area from each tangential section collected from the entire flattened cortical tissue and t = thickness of each section (Figure S5G).
Axonal mapping was quantified using a well-established technique (Overman et al., 2012). Briefly, BDA-labeled axons were automatically traced using Neurolucida (MBF Biosciences) where x and y co-ordinates on each process relative to the center of the injection site were registered. The data points obtained were fed into a custom-built software – HeatMap (Li et.al., 2010) to produce axonal scatterplots of Cartesian coordinates relative to the injection site from all brain sections per treatment group. Spatial differences in the quantitative maps thus generated between two treatment conditions were computed for statistical significance using Hotelling’s t squared test. Polar plots were constructed with the x,y position of each BDA-labeled element plotted in relation to the tracer injection. The polar mapping shows both location and direction of axonal label.
Immunohistochemistry
Animals were transcardialy perfused with 4% PFA, brains harvested, sectioned at 40 μm and processed for immunohistochemistry. Neurons, microglia and astrocytes were detected using rabbit antibodies to NeuN, IBA-1 and GFAP respectively (Abcam-1:1000, Wako-1:500, Thermo Fisher-1:500). For pCREB immunostaining, sections were subjected to antigen retrieval with sodium citrate (pH-6.00) at 60°C for 20 min. pCREB antibody was used at a dilution of 1:200. Images were acquired either using an epiflourescent microscope (Leica, MBF software) or confocal microscope (Nikon, NIS software).
Image analysis for GFAP/IBA-1 immunoreactivity
Spatial changes in GFAP or IBA-1 immunoreactivity were analyzed by measuring pixel intensities in coronal brain sections from different groups. Images were captured using virtual tissue module Stereoinvestigator (MBF Biosciences). Imaging parameters were kept constant across all sections. Using a microarray plug in from Fiji, a grid of 300 ROIs were placed in the infarct and peri-infarct zone, that spanned 1.8mm from midline on each image captured. The location and number of ROIs on each section was kept constant across sections. Pixel intensities corresponding to each ROI were measured using Fiji. Pixel intensities from all animals per ROI per group were recorded and filled contour plots for individual groups were generated using Sigmaplot 13(Systat software). The x and y values corresponded to co-ordinates of each ROI whereas z corresponded to pixel intensity at the respective ROI; whereas the axes show positions with respect to the midline; y axis- Dorso-ventral axis x axis represents lateral positions from midline. Statistical significance was computed using mixed model-repeated-measures ANOVA.
Craniotomy and imaging of dendritic spines
Glass-covered cranial windows were implanted as previously described (Mostany et.al., 2010). Adult male Thy-1 YFP-H mice (2–3 months of age, Jackson Laboratories), were anaesthetized with 1.5% isoflurane, placed on a stereotaxic frame and body temperature was monitored and maintained using a rectal probe and heating pad. A 3-mm-diameter craniotomy was performed with a dental drill. The site was intermittently rinsed with 0.9% saline and lidocaine to prevent local tissue heating and edema. An access port was drilled into a sterile 3 mm glass coverslip (Warner Instruments) and was gently placed over the dura mater such that the port was positioned at 1mm M/L and 1.5mm A/P from Bregma. The coverslip was glued to the skull with cyanoacrylate-based glue (Vetbond, 3M). Dental acrylic was then applied throughout the skull surface and the edges of the coverslip. A titanium bar (0.125 × 0.375 × 0.05 inch) was embedded in the dental acrylic to secure the mouse on to the stage of the microscope for imaging.
Imaging was performed with a two-photon microscope using a Ti:Sapphire laser (Chameleon Ultra II; Coherent) tuned to 920 nm, Mai-Tai software, a 40 × 0.8 NA water-immersion objective (Olympus), two photomultiplier tubes (Hamamatsu) and Scan Image software written in MATLAB (MathWorks). Baseline imaging included selecting regions of interest based on landmarks for identification such as proximity to a blood vessel. Lower magnification images of ROIs that comprise sparse dendrites were taken and higher magnification images for analysis of dendritic spines were captured (512×512 pixels, 0.5 μm step size). 10–15 regions within 1–2 ROIs per animal were captured. Following baseline imaging, for groups with viral knockdown, animals received intracranial injections of shCCR5 AAV or control AAV through the access port followed by stroke induction 3 days later. Dendritic spines at selected ROIs were tracked at 4 days and 12 days post-stroke. The number of spines gained, lost and persisted in relation to baseline were counted. Survival fraction was calculated as the number of persistent spines at 4d or 12d/ total number of spines at baseline.
Human stroke study population
Patients were eligible for the present study if they had mild to moderate first-ever acute ischemic stroke or TIA and were participating in the prospective cohort TABASCO study (https://clinicaltrials.gov/NCT01926691). Selection process for the study was previously described (Ben Assayag et al., 2012). Patients were excluded if they had hemorrhagic stroke, stroke resulting from trauma or invasive procedures, severe aphasia, cognitive decline/dementia, or were unlikely to be discharged from hospital or to participate in followup. The neurological assessment included verification of stroke etiology and the NIH Stroke Scale (NIHSS). Detailed assessments are in supplementary methods.
Baseline and follow-up cognitive assessments
Cognitive impairment before the stroke determined in Informant Questionnaire on Cognitive Decline in the Elderly – IQCODE score ≥ 3.3 (Jorm et al., 2000). Patients completed a baseline neuropsychological assessment including the Montreal Cognitive Assessment (MoCA) (Nasreddine et al., 2005) and the NeuroTrax computerized cognitive testing (NeuroTrax, Bellaire, TX) (Doniger et al., 2006). These comprehensive neuropsychological evaluations were repeated 6, 12 and 24 months following the event. A Global Cognitive Score was computed as the average of the six index scores (memory, executive functions, visuo-spatial perception, verbal function, attention and motor skills). Data for each outcome parameter were normalized according to stratifications of age and education (≤12 years, > 12 years) to give a distribution with a mean of 100 and a standard deviation of 15 (i.e., an IQ-style scale).
Determination of CCR5 genotype
Genomic DNA was extracted from white blood cells taken from citrated blood and then amplified by polymerase chain reaction (PCR), as previously described (Lucotte, 1997) using 5′-CCTGGCTGTCGTCCATGCTG-3′ and 5′-CTGATCTAGAGCCATGTGCA CAACTCT-3′ as forward and reverse primers. These primers amplify a 735-bp fragment. Following PCR amplification of genomic DNA, the amplified products were digested using EcoRI (New England Biolabs), and the digested products were detected following electrophoresis on a 4% MetaPhor agarose gel stained with ethidium bromide. After restriction, the 735-bp PCR product was cleaved into a common band of 332 bp for both alleles, and into a 403-bp product for the wild-type and a 371-bp product for the mutant Δ 32 allele. Heterozygous individuals had wild-type and mutant alleles, and demonstrated three bands (403, 371, and 332 bp). The apolipoprotein E (APOE) genotype was also determined to verify any association between CCR5- Δ32 allele and APOE ε4 allele and post-stroke cognitive outcome.
MRI analyses
MRI images were acquired within 7 days of stroke onset on a 3T GE scanner (GE Signa EXCITE, Milwaukee, WI, USA). Imaging parameters were previously described (Ben Assayag et al., 2012).
Human Ischemic infarct identification
Presence of an acute ischemic infarct was assessed by a senior neuroradiologist, based on diffusion weighted imaging. Ischemic lesions were defined as cortical, sub-cortical or subtentorial infarct. Cortical infarcts were defined as any infarct that includes the cortex. Subtentorial infarcts were defined as cerebellar or brainstem infarction. The quantification of the ischemic and white matter lesion (WML) volumes was performed using an in-house method (Artzi et al., 2013).
Human white matter hyperintensities Score
White matter hyperintensities (WMH) were identified on fluid-attenuated inversion recovery (FLAIR) images and rated semiquantitatively based on a 4-point scale according to the periventricular score of Fazekas-Wahlund (Wahlund et al., 2001).
QUANTIFICATION AND STATISTICAL ANALYSIS
Sample size in behavioral studies, were assessed by power analysis using a significance level of α = 0.05 with 80% power to detect differences in ANOVA.
In stroke studies animals were randomly assigned to each experimental group so that equal numbers from original mouse cages were allocated to the different experimental groups in random order. In TBI studies, animals were assigned to each experimental group after the initial severity score was evaluated (NSS at 1 hr post injury) so that equal numbers with similar injury severity were allocated to the different experimental groups in random order. Blinding was done by coding animals and keeping the code and the corresponding experimental condition excluded from the rater for testing and for analyses. Statistical significance for data presented in Figures 2–3 was computed using repeated-measures ANOVA.
For data presented in Figures 3 and S4 scatterplots for cortical quantitative mapping were analyzed using Hotelling’s T2 test for spatial correlation and has been described in previous publications (Li et.al., 2015; Overman et.al., 2012)
For data presented in Figures 6 and S5 mean intensities were compared using a repeated-measure (mixed) analysis of variance model and quantile plots were examined to confirm that the residual errors had a normal distribution.
For expression studies (Figure 1) and spine imaging (Figure 4), statistical significance was computed using multiple comparisons 2-way ANOVA.
For the human stroke study (Figure S6 and Tables 1, S1, S2, S3, and S4), comparisons or distributions between categories were assessed using Student’s t test, the Mann–Whitney U or chi square test, as appropriate. Associations between numeric variables were determined using the Pearson or Spearman’s rank correlation analysis (coefficient estimate r). A p value < 0.05 was considered statistically significant for all analyses. SPSS/WIN (version 25.0, SPSS, Chicago, IL, USA) software was used for all statistical analyses.
Supplementary Material
Highlights.
CCR5 is differentially upregulated in neurons after stroke
Knockdown of CCR5 induces motor recovery after stroke and improves cognition after TBI
Treatment with an FDA-approved drug, maraviroc induces recovery after stroke and TBI
Human carriers for CCR5delta32 have better outcomes after stroke
ACKNOWLEDGMENTS
These studies were funded by Dr. Miriam and Sheldon G. Adelson Medical Research Foundation (S.T.C., E.S., and A.J.S.), American Heart Foundation (16POST27710039, M.T.J.), United States-Israel Binational Science Foundation (2011344, E.B.A.), Alzheimer’s Association (16-442861, EBA), and the American Federation for Aging Research (RAG11482, E.B.A.). We thank Rex Lee for dedicated technical assistance. We thank Dr. Greg Khitrov for technical assistance at UCLA MIC; Felicia Codrea, Jessica Scholes, and Jeff Calimlim at the UCLA FACS core (BSCRC); and Dr. Joanna Liliental at TASC core at Stanford University. We thank Sali Usher for her dedicated help in genetic analyses and Tal Adamit for comprehensive data collection from stroke patients at 3 months post stroke.
Footnotes
DECLARATION OF INTERESTS
The authors declare no competing interests.
SUPPLEMENTAL INFORMATION
Supplemental Information includes six figures and four tables and can be found with this article online at https://doi.org/10.1016/j.cell.2019.01.044.
REFERENCES
- Adelson JD, Barreto GE, Xu L, Kim T, Brott BK, Ouyang YB, Naserke T, Djurisic M, Xiong X, Shatz CJ, and Giffard RG (2012). Neuroprotection from stroke in the absence of MHCI or PirB. Neuron 73, 1100–1107. [DOI] [PMC free article] [PubMed] [Google Scholar]
- Artzi M, Aizenstein O, Jonas-Kimchi T, Myers V, Hallevi H, and Ben Bashat D (2013). FLAIR lesion segmentation: application in patients with brain tumors and acute ischemic stroke. Eur. J. Radiol 82, 1512–1518. [DOI] [PubMed] [Google Scholar]
- Balkaya M, and Cho S (2018). Genetics of stroke recovery: BDNF val66met polymorphism in stroke recovery and its interaction with aging. Neurobiol. Dis Published online August 15, 2019. 10.1016/j.nbd.2018.08.009. [DOI] [PMC free article] [PubMed] [Google Scholar]
- Barreto GE, White RE, Xu L, Palm CJ, and Giffard RG (2012). Effects of heat shock protein 72 (Hsp72) on evolution of astrocyte activation following stroke in the mouse. Exp. Neurol 238, 284–296. [DOI] [PMC free article] [PubMed] [Google Scholar]
- Ben Assayag E, Korczyn AD, Giladi N, Goldbourt U, Berliner AS, Shenhar-Tsarfaty S, Kliper E, Hallevi H, Shopin L, Hendler T, et al. (2012). Predictors for poststroke outcomes: the Tel Aviv Brain Acute Stroke Cohort (TABASCO) study protocol. Int. J. Stroke 7, 341–347. [DOI] [PubMed] [Google Scholar]
- Biegon A, Fry PA, Paden CM, Alexandrovich A, Tsenter J, and Shohami E (2004). Dynamic changes in N-methyl-D-aspartate receptors after closed head injury in mice: Implications for treatment of neurological and cognitive deficits. Proc. Natl. Acad. Sci. USA 101, 5117–5122. [DOI] [PMC free article] [PubMed] [Google Scholar]
- Bigler ED (2013). Traumatic brain injury, neuroimaging, and neurodegeneration. Front. Hum. Neurosci 7, 395. [DOI] [PMC free article] [PubMed] [Google Scholar]
- Brown CE, Li P, Boyd JD, Delaney KR, and Murphy TH (2007). Extensive turnover of dendritic spines and vascular remodeling in cortical tissues recovering from stroke. J. Neurosci 27, 4101–4109. [DOI] [PMC free article] [PubMed] [Google Scholar]
- Brown CE, Wong C, and Murphy TH (2008). Rapid morphologic plasticity of peri-infarct dendritic spines after focal ischemic stroke. Stroke 39, 1286–1291. [DOI] [PubMed] [Google Scholar]
- Caracciolo L, Marosi M, Mazzitelli J, Latifi S, Sano Y, Galvan L, Kawaguchi R, Holley S, Levine MS, Coppola G, et al. (2018). CREB controls cortical circuit plasticity and functional recovery after stroke. Nat. Commun 9, 2250. [DOI] [PMC free article] [PubMed] [Google Scholar]
- Chollet F, Tardy J, Albucher JF, Thalamas C, Berard E, Lamy C, Bejot Y, Deltour S, Jaillard A, Niclot P, et al. (2011). Fluoxetine for motor recovery after acute ischaemic stroke (FLAME): a randomised placebo-controlled trial. Lancet Neurol. 10, 123–130. [DOI] [PubMed] [Google Scholar]
- Clarkson AN, Huang BS, Macisaac SE, Mody I, and Carmichael ST (2010). Reducing excessive GABA-mediated tonic inhibition promotes functional recovery after stroke. Nature 468, 305–309. [DOI] [PMC free article] [PubMed] [Google Scholar]
- Clarkson AN, Overman JJ, Zhong S, Mueller R, Lynch G, and Carmichael ST (2011). AMPA receptor-induced local brain-derived neurotrophic factor signaling mediates motor recovery after stroke. J. Neurosci 31, 3766–3775. [DOI] [PMC free article] [PubMed] [Google Scholar]
- Cramer SC, Procaccio V, Americas G, and Investigators GIS; GAIN Americas; GAIN International Study Investigators (2012). Correlation between genetic polymorphisms and stroke recovery: analysis of the GAIN Americas and GAIN International Studies. Eur. J. Neurol 19, 718–724. [DOI] [PubMed] [Google Scholar]
- Di Lazzaro V, Profice P, Pilato F, Capone F, Ranieri F, Pasqualetti P, Colosimo C, Pravata E, Cianfoni A, and Dileone M (2010). Motor cortex plasticity predicts recovery in acute stroke. Cereb. Cortex 20, 1523–1528. [DOI] [PubMed] [Google Scholar]
- Doniger GM, Dwolatzky T, Zucker DM, Chertkow H, Crystal H, Schweiger A, and Simon ES (2006). Computerized cognitive testing battery identifies mild cognitive impairment and mild dementia even in the presence of depressive symptoms. Am. J. Alzheimers Dis. Other Demen 21, 28–36. [DOI] [PMC free article] [PubMed] [Google Scholar]
- Ennaceur A, and Delacour J (1988). A new one-trial test for neurobiological studies of memory in rats. 1: Behavioral data. Behav. Brain Res 31, 47–59. [DOI] [PubMed] [Google Scholar]
- Fisher M, Holland C, Merzenich MM, and Vinogradov S (2009). Using neuroplasticity-based auditory training to improve verbal memory in schizophrenia. Am. J. Psychiatry 166, 805–811. [DOI] [PMC free article] [PubMed] [Google Scholar]
- Flierl MA, Stahel PF, Beauchamp KM, Morgan SJ, Smith WR, and Shohami E (2009). Mouse closed head injury model induced by a weightdrop device. Nat. Protoc 4, 1328–1337. [DOI] [PubMed] [Google Scholar]
- Fu M, Yu X, Lu J, and Zuo Y (2012). Repetitive motor learning induces coordinated formation of clustered dendritic spines in vivo. Nature 483, 92–95. [DOI] [PMC free article] [PubMed] [Google Scholar]
- Ginhoux F, and Jung S (2014). Monocytes and macrophages: developmental pathways and tissue homeostasis. Nat. Rev. Immunol 14, 392–404. [DOI] [PubMed] [Google Scholar]
- Grafman J, and Salazar AM (2015). The ebb and flow of traumatic brain injury research. Handb. Clin. Neurol 128, 795–802. [DOI] [PubMed] [Google Scholar]
- Hammond MD, Taylor RA, Mullen MT, Ai Y, Aguila HL, Mack M, Kasner SE, McCullough LD, and Sansing LH (2014). CCR2+ Ly6C(hi) inflammatory monocyte recruitment exacerbates acute disability following intracerebral hemorrhage. J. Neurosci 34, 3901–3909. [DOI] [PMC free article] [PubMed] [Google Scholar]
- Horn KP, Busch SA, Hawthorne AL, van Rooijen N, and Silver J (2008). Another barrier to regeneration in the CNS: activated macrophages induce extensive retraction of dystrophic axons through direct physical interactions. J. Neurosci 28, 9330–9341. [DOI] [PMC free article] [PubMed] [Google Scholar]
- Huebner EA, and Strittmatter SM (2009). Axon regeneration in the peripheral and central nervous systems. Results Probl. Cell Differ. 48, 339–351. [DOI] [PMC free article] [PubMed] [Google Scholar]
- Jorm AF, Christensen H, Korten AE, Jacomb PA, and Henderson AS (2000). Informant ratings of cognitive decline in old age: validation against change on cognitive tests over 7 to 8 years. Psychol. Med 30, 981–985. [DOI] [PubMed] [Google Scholar]
- Kantak SS, Stinear JW, Buch ER, and Cohen LG (2012). Rewiring the brain: potential role of the premotor cortex in motor control, learning, and recovery of function following brain injury. Neurorehabil. Neural Repair 26, 282–292. [DOI] [PMC free article] [PubMed] [Google Scholar]
- Lee S, Mattingly A, Lin A, Sacramento J, Mannent L, Castel MN, Canolle B, Delbary-Gossart S, Ferzaz B, Morganti JM, et al. (2016). A novel antagonist of p75NTR reduces peripheral expansion and CNS trafficking of pro-inflammatory monocytes and spares function after traumatic brain injury. J. Neuroinflammation 13, 88. [DOI] [PMC free article] [PubMed] [Google Scholar]
- Li S, Overman JJ, Katsman D, Kozlov SV, Donnelly CJ, Twiss JL, Giger RJ, Coppola G, Geschwind DH, and Carmichael ST (2010). An age-related sprouting transcriptome provides molecular control of axonal sprouting after stroke. Nat. Neurosci 13, 1496–1504. [DOI] [PMC free article] [PubMed] [Google Scholar]
- Li S, Nie EH, Yin Y, Benowitz LI, Tung S, Vinters HV, Bahjat FR, Stenzel-Poore MP, Kawaguchi R, Coppola G, and Carmichael ST (2015). GDF10 is a signal for axonal sprouting and functional recovery after stroke. Nat. Neurosci 18, 1737–1745. [DOI] [PMC free article] [PubMed] [Google Scholar]
- Li N, Daie K, Svoboda K, and Druckmann S (2016). Robust neuronal dynamics in premotor cortex during motor planning. Nature 532, 459–464. [DOI] [PMC free article] [PubMed] [Google Scholar]
- Lucotte G (1997). Frequencies of the CC chemokine receptor 5 delta 32 allele in various populations of defined racial background. Biomed. Pharmacother 51, 469–473. [DOI] [PubMed] [Google Scholar]
- Ma VY, Chan L, and Carruthers KJ (2014). Incidence, prevalence, costs, and impact on disability of common conditions requiring rehabilitation in the United States: stroke, spinal cord injury, traumatic brain injury, multiple sclerosis, osteoarthritis, rheumatoid arthritis, limb loss, and back pain. Arch. Phys. Med. Rehabil 95, 986–995. [DOI] [PMC free article] [PubMed] [Google Scholar]
- Maayan S, Zhang L, Shinar E, Ho J, He T, Manni N, Kostrikis LG, and Neumann AU (2000). Evidence for recent selection of the CCR5-delta 32 deletion from differences in its frequency between Ashkenazi and Sephardi Jews. Genes Immun. 1, 358–361. [DOI] [PubMed] [Google Scholar]
- Martin-Blondel G, Brassat D, Bauer J, Lassmann H, and Liblau RS (2016). CCR5 blockade for neuroinflammatory diseases–beyond control of HIV. Nat. Rev. Neurol 12, 95–105. [DOI] [PubMed] [Google Scholar]
- Middei S, Spalloni A, Longone P, Pittenger C, O’Mara SM, Marie H, and Ammassari-Teule M (2012). CREB selectively controls learning-induced structural remodeling of neurons. Learn. Mem 19, 330–336. [DOI] [PubMed] [Google Scholar]
- Moore DL, and Goldberg JL (2011). Multiple transcription factor families regulate axon growth and regeneration. Dev. Neurobiol 71, 1186–1211. [DOI] [PMC free article] [PubMed] [Google Scholar]
- Mostany R, Chowdhury TG, Johnston DG, Portonovo SA, Carmichael ST, and Portera-Cailliau C (2010). Local hemodynamics dictate long-term dendritic plasticity in peri-infarct cortex. J. Neurosci 30, 14116–14126. [DOI] [PMC free article] [PubMed] [Google Scholar]
- Nasreddine ZS, Phillips NA, Bé dirian V, Charbonneau S, Whitehead V, Collin I, Cummings JL, and Chertkow H (2005). The Montreal Cognitive Assessment, MoCA: a brief screening tool for mild cognitive impairment. J. Am. Geriatr. Soc 53, 695–699. [DOI] [PubMed] [Google Scholar]
- Overman JJ, Clarkson AN, Wanner IB, Overman WT, Eckstein I, Maguire JL, Dinov ID, Toga AW, and Carmichael ST (2012). A role for ephrin-A5 in axonal sprouting, recovery, and activity-dependent plasticity after stroke. Proc. Natl. Acad. Sci. USA 109, E2230–E2239. [DOI] [PMC free article] [PubMed] [Google Scholar]
- Page SJ, Levine P, and Hade E (2012). Psychometric properties and administration of the wrist/hand subscales of the Fugl-Meyer Assessment in minimally impaired upper extremity hemiparesis in stroke. Arch. Phys. Med. Rehabil 93, 2373–2376. [DOI] [PMC free article] [PubMed] [Google Scholar]
- Paterno R, Folweiler KA, and Cohen AS (2017). Pathophysiology and treatment of memory dysfunction after traumatic brain injury. Curr. Neurol. Neurosci. Rep 17, 52. [DOI] [PMC free article] [PubMed] [Google Scholar]
- Pö sel C, Mö ller K, Boltze J, Wagner DC, and Weise G (2016). Isolation and Flow Cytometric Analysis of Immune Cells from the Ischemic Mouse Brain. J. Vis. Exp (108), 53658. [DOI] [PMC free article] [PubMed] [Google Scholar]
- Samson M, Libert F, Doranz BJ, Rucker J, Liesnard C, Farber CM, Saragosti S, Lapoumeroulie C, Cognaux J, Forceille C, et al. (1996). Resistance to HIV-1 infection in caucasian individuals bearing mutant alleles of the CCR-5 chemokine receptor gene. Nature 382, 722–725. [DOI] [PubMed] [Google Scholar]
- Schaechter JD (2004). Motor rehabilitation and brain plasticity after hemiparetic stroke. Prog. Neurobiol 73, 61–72. [DOI] [PubMed] [Google Scholar]
- Shin JE, Cho Y, Beirowski B, Milbrandt J, Cavalli V, and DiAntonio A (2012). Dual leucine zipper kinase is required for retrograde injury signaling and axonal regeneration. Neuron 74, 1015–1022. [DOI] [PMC free article] [PubMed] [Google Scholar]
- Sullivan KJ, Tilson JK, Cen SY, Rose DK, Hershberg J, Correa A, Gallichio J, McLeod M, Moore C, Wu SS, and Duncan PW (2011). Fugl-Meyer assessment of sensorimotor function after stroke: standardized training procedure for clinical practice and clinical trials. Stroke 42, 427–432. [DOI] [PubMed] [Google Scholar]
- Tarasenko M, Perez VB, Pianka ST, Vinogradov S, Braff DL, Swerdlow NR, and Light GA (2016). Measuring the capacity for auditory system plasticity: An examination of performance gains during initial exposure to auditory-targeted cognitive training in schizophrenia. Schizophr. Res 172, 123–130. [DOI] [PMC free article] [PubMed] [Google Scholar]
- Tennant A (2013). Epidemiology of neurologically disabling disorders. Handb. Clin. Neurol 110, 77–92. [DOI] [PubMed] [Google Scholar]
- Vilkki J, Lappalainen J, Juvela S, Kanarek K, Hernesniemi JA, and Siironen J (2008). Relationship of the Met allele of the brain-derived neurotrophic factor Val66Met polymorphism to memory after aneurysmal subarachnoid hemorrhage. Neurosurgery 63, 198–203, discussion 203. [DOI] [PubMed] [Google Scholar]
- Wagner JM, Rhodes JA, and Patten C (2008). Reproducibility and minimal detectable change of three-dimensional kinematic analysis of reaching tasks in people with hemiparesis after stroke. Phys. Ther. 88, 652–663. [DOI] [PubMed] [Google Scholar]
- Wahlund LO, Barkhof F, Fazekas F, Bronge L, Augustin M, Sjö gren M, Wallin, Ader H, Leys D, Pantoni L, et al. ; European Task Force on AgeRelated White Matter Changes (2001). A new rating scale for age-related white matter changes applicable to MRI and CT. Stroke 32, 1318–1322. [DOI] [PubMed] [Google Scholar]
- Wang L, Conner JM, Nagahara AH, and Tuszynski MH (2016). Rehabilitation drives enhancement of neuronal structure in functionally relevant neuronal subsets. Proc. Natl. Acad. Sci. USA 113, 2750–2755. [DOI] [PMC free article] [PubMed] [Google Scholar]
- Watkins TA, Wang B, Huntwork-Rodriguez S, Yang J, Jiang Z, Eastham-Anderson J, Modrusan Z, Kaminker JS, Tessier-Lavigne M, and Lewcock JW (2013). DLK initiates a transcriptional program that couples apoptotic and regenerative responses to axonal injury. Proc. Natl. Acad. Sci. USA 110, 4039–4044. [DOI] [PMC free article] [PubMed] [Google Scholar]
- Xing S, Lacey EH, Skipper-Kallal LM, Jiang X, Harris-Love ML, Zeng J, and Turkeltaub PE (2016). Right hemisphere grey matter structure and language outcomes in chronic left hemisphere stroke. Brain 139, 227–241. [DOI] [PMC free article] [PubMed] [Google Scholar]
- Yaka R, Biegon A, Grigoriadis N, Simeonidou C, Grigoriadis S, Alexandrovich AG, Matzner H, Schumann J, Trembovler V, Tsenter J, and Shohami E (2007). D-cycloserine improves functional recovery and reinstates long-term potentiation (LTP) in a mouse model of closed head injury. FASEB J. 21, 2033–2041. [DOI] [PubMed] [Google Scholar]
- Zhou M, Greenhill S, Huang S, Silva TK, Sano Y, Wu S, Cai Y, Nagaoka Y, Sehgal M, Cai DJ, Lee Y, Fox K, and Silva AJ (2016). CCR5 is a suppressor for cortical plasticity and hippocampal learning and memory. Elife 5. [DOI] [PMC free article] [PubMed] [Google Scholar]
Associated Data
This section collects any data citations, data availability statements, or supplementary materials included in this article.