

Abstract
STUDY QUESTION
What is the effect of saturated fat ingestion on mononuclear cell (MNC) TNFα, IL-6 and IL-1β secretion and circulating IL-6 levels in women with polycystic ovary syndrome (PCOS)?
SUMMARY ANSWER
Women with PCOS exhibit increases in MNC-derived TNFα, IL-6 and IL-1β secretion and circulating IL-6 following saturated fat ingestion even in the absence of obesity, and these increases are linked to metabolic aberration and androgen excess.
WHAT IS KNOWN ALREADY
Cytokine excess and metabolic aberration is often present in PCOS.
STUDY DESIGN, SIZE, DURATION
A cross-sectional design was used in this study of 38 reproductive-age women.
PARTICIPANTS/MATERIALS, SETTING, METHODS
Groups of 19 reproductive-age women with PCOS (10 lean, 9 obese) and 19 ovulatory controls (10 lean, 9 obese) participated in this study that was performed at a tertiary academic medical centre. TNFα, IL-6 and IL-1β secretion was measured from cultured MNC, and IL-6 was measured in plasma from blood sampling while fasting and 2, 3 and 5 h after saturated fat ingestion. Insulin sensitivity was determined using the Matsuda index following an oral glucose tolerance test. Androgen secretion was evaluated with blood sampling while fasting and 24, 48 and 72 h after an HCG injection.
MAIN RESULTS AND THE ROLE OF CHANCE
Lean and obese women with PCOS exhibited lipid-induced incremental AUC increases in MNC-derived TNFα (489–611%), IL-6 (333–398%) and IL-1β (560–695%) secretion and in plasma IL-6 levels (426–474%), in contrast with lean control subjects. In both PCOS groups, insulin sensitivity was lower (42–49%) and androgen secretion after HCG injection was greater (63–110%) compared with control subjects. The MNC-derived TNFα, IL-6 and IL-1β and circulating IL-6 responses were inversely associated with insulin sensitivity and directly associated with fasting lipids and androgen secretion after HCG injection.
LIMITATIONS, REASONS FOR CAUTION
The sample size of each of the four study groups was modest following group assignment of subjects by body mass.
WIDER IMPLICATIONS OF THE FINDINGS
This study showcases the unique pro-inflammatory contribution of circulating MNC in the development of metabolic aberration and androgen excess in PCOS.
STUDY FUNDING/COMPETING INTEREST(S)
This research was supported by grant R01 DK107605 to F.G. from the National Institutes of Health, the Indiana Clinical and Translational Sciences Institute Clinical Research Center which is funded in part by grant UL1TR002529 from the National Institutes of Health, National Center for Advancing Translational Sciences, Clinical and Translational Sciences Award, and the Indiana University Center for Diabetes and Metabolic Diseases funded by grant P30 DK097512 from the National Institutes of Health. The content is solely the responsibility of the authors and does not necessarily represent the official views of the National Institutes of Health. No conflicts of interest, financial or otherwise, are declared by the authors.
TRIAL REGISTRATION NUMBER
Keywords: polycystic ovary syndrome, saturated fat, cytokines, metabolic aberration, androgen excess
Introduction
Polycystic ovary syndrome (PCOS) can present with androgen excess, chronic oligo-anovulation and polycystic ovarian morphology, and affects 15–18% of premenopausal women (Fauser et al., 2012, March et al., 2010). Insulin resistance is a common feature in PCOS that is worsened by concomitant obesity (Dunaif et al., 1989; Morales, et al., 1996). Emerging evidence suggests that oxidative stress and chronic low-grade inflammation underpin the genesis of insulin resistance and accelerated atherogenesis in PCOS (Kelly et al., 2001; González et al., 2006a; González et al., 2013).
We have previously shown that nutrient ingestion triggers a prooxidant proinflammatory response from peripheral blood mononuclear cells (MNC) in women with PCOS in the absence of obesity (González et al., 2006a; González et al., 2006b; González et al., 2012b). Glucose and saturated fat ingestion stimulates reactive oxygen species (ROS) generation and nuclear factor κB (NFκB) activation in MNC of lean women with PCOS (González et al., 2006a; González et al., 2019b; González et al., 2020). NFκB regulates the transcription of cytokines such as TNFα, IL-6 and IL-1β. Positive feedback by these cytokines up-regulates inflammation, thereby contributing to insulin resistance and atherogenesis (Barnes and Karin, 1997; Rui et al., 2001).
In PCOS, hyperandrogenism may present as elevations in circulating androgens or as the skin manifestations of hirsutism and acne (Knochenhauer et al., 1998). Theca cells within the polycystic ovary have an increased capacity to produce androgens (Nelson et al., 1999). Women with PCOS exhibit ovarian androgen hypersecretion following HCG administration regardless of body weight (Koivunen et al., 2001; González et al., 2019a). Hyperinsulinemia resulting from insulin resistance is thought to promote hyperandrogenism in PCOS, since insulin may augment LH-induced androgen synthesis (Barbieri et al.,, 1983). However, physiological insulin infusion alone does not increase circulating androgens (Dunaif et al., 1989). Given that 30–50% of women with PCOS are lean and do not have insulin resistance, it is possible that some other factor can stimulate ovarian androgen hypersecretion in PCOS. MNC-derived macrophages are more abundant within the ovary after saturated fat ingestion (Thornton et al., 2015). Macrophage TNFα secretion may promote ovarian theca cell proliferation (Spazynsky et al., 1999) and increase serine phosphorylation to increase the 17,20-lyase activity of CYP17 (Zhang et al., 1995). Other proinflammatory stimuli such as lipopolysaccharide and IL-1β stimulate theca cell androgen production in vitro (Fox et al., 2019) and antioxidant treatment using resveratrol decreases circulating androgens in women with PCOS (Banaszewska et al., 2016). Thus, inflammation triggered by saturated fat ingestion may lead to ovarian androgen hypersecretion in PCOS.
We examined the effect of saturated fat ingestion on TNFα, IL-6 and IL-1β secretion from MNC and circulating IL-6 levels in women with PCOS. We hypothesized that women with PCOS have increased MNC-derived cytokine secretion and circulating IL-6 levels compared with ovulatory controls of similar age and weight class; and that these cytokine responses are related to adiposity, insulin sensitivity, levels of fasting lipids and ovarian androgen secretion. We separately evaluated lean women with PCOS who represent the authentic syndrome from obese women with PCOS who represent the overlying impact of obesity on this disorder.
Materials and Methods
Participants
Groups of 19 women with PCOS (10 lean; 9 obese; 18–36 years of age) and 19 control subjects (10 lean; 9 obese; 20–40 years of age) with a similar BMI participated in the current study that focused on cell culture experiments. Some of these subjects were involved in our previous work on lipopolysaccharide-mediated inflammation and lipid-induced oxidative stress in PCOS (González et al., 2019a; González et al., 2019b). Lean subjects had a BMI of 18–25 kg/m2 and obese subjects had a BMI of 30–40 kg/m2. The diagnosis of PCOS was based on National Institutes of Health (NIH) criteria, requiring the presence of oligo-amenorrhea and hyperandrogenemia, after excluding nonclassic congenital adrenal hyperplasia, Cushing syndrome, hyperprolactinemia and thyroid disease. Metabolic aberration is more prevalent in women with PCOS meeting NIH criteria (Wild et al., 2010), and inflammation has been shown to promote metabolic aberration in humans (Brewer et al.,, 1999; Rui et al., 2001). Polycystic ovaries were present on ultrasound in all subjects with PCOS, and thus, they also met the European Society of Human Reproduction and Embryology, American Society for Reproductive Medicine and Androgen Excess and PCOS Society diagnostic criteria for PCOS. Ovulation was documented in all control subjects based on regular menses every 25 to 35 days and a serum progesterone level in the luteal range (>5 ng/ml) (Abraham et al., 1974; Lynch et al., 2014). Control subjects lacked skin manifestations of androgen excess or polycystic ovaries on ultrasound and had normal androgen levels.
Diabetes and inflammatory illnesses were ruled out in all subjects, although three obese women with PCOS had impaired glucose tolerance and metabolic syndrome based on WHO and ATP III criteria, respectively (Modan et al., 1989; Adult Treatment Panel III, 2002). There were 15 women with PCOS (7 lean; 8 obese) and 11 control subjects (7 lean; 4 obese) who had a family history of type 2 diabetes. None of the subjects smoked tobacco or used medications that would impact carbohydrate metabolism or immune function for no less than 6 weeks before beginning the study. All subjects were weight stable within 2.5 kg and were either sedentary or lightly active during the six months before entering the study. Physical activity levels were similar among the study groups.
Ethical approval
The study was approved by the institutional review board on 8 September 2011. Written informed consent was obtained from all subjects in accordance with the institutional review board guidelines for the protection of human subjects.
Study design
All study subjects underwent a cream challenge test (CCT) between Days 5 and 8 after the onset of a spontaneous menses, or after a progestin-induced withdrawal bleed in three amenorrheic women with PCOS. All study subjects underwent an oral glucose tolerance test (OGTT) the following day. An overnight fast for ~12 h was required before subjects underwent both tests. All subjects were provided a healthy diet consisting of 50% carbohydrate, 35% fat and 15% protein for three consecutive days before the CCT and on the day preceding the OGTT after completing the CCT. A body composition assessment was performed on the same day as the CCT. All subjects subsequently underwent a human chorionic gonadotropin stimulation test (HCG-ST) over four days starting on the day of the OGTT.
CCT
As adapted from Deopurkar et al., (2010), all subjects consumed 100 ml of dairy cream (gourmet heavy whipping cream; Land O Lakes Inc., Arden Hills, MN) composed of 70% saturated fat content, 28% unsaturated fat, <2% protein and 0% glucose. Blood samples were obtained while fasting and 2, 3 and 5 h after cream ingestion to isolate plasma and MNC as previously described (González et al., 2014a). MNC were used to measure cytokine secretion. Plasma was stored at −80°C until assayed for IL-6 and fasting lipids.
OGTT
All subjects consumed a 75-g glucose beverage. Blood samples were obtained while fasting and 30, 60, 90, 120 and 180 min after glucose ingestion. For all blood samples, glucose was measured right away, and insulin was measured later from plasma stored at −80°C. Insulin sensitivity was derived from the OGTT (ISOGTT) using the Matsuda index formula: 10 000 divided by the square root of the fasting glucose level multiplied by the fasting insulin level, and that result multiplied by the product of the mean glucose level and mean insulin level (Matsuda and DeFronzo, 1999).
HCG-ST
As previously described (Koivunen et al., 2001), an IM injection of 5000 IU of HCG (Pregnyl; Merck & Co., Whitehouse Station, NJ) was administered after obtaining a baseline blood sample at 8 a.m. after an overnight fast of ~12 h. Blood samples were then obtained while fasting at 24, 48 and 96 h after the HCG injection. Serum isolated from these samples was stored at −80°C until assayed for testosterone (T), androstenedione (A) and 17-hydroxyprogesterone (17-OHP). Area under the curve (AUC) was calculated for androgens and 17-OHP using the trapezoidal rule (Yeh, 2002).
Body composition assessment
Height without shoes was measured to the nearest 1.0 cm. Body weight was measured to the nearest 0.1 kg. Dual-energy X-ray absorptiometry was performed to assess the percentage of total body fat, percentage of truncal fat and R1 central abdominal fat using a QDR 4500 Elite model scanner (Hologic Inc., Waltham, MA) as previously described (González et al., 2005; Carmina et al., 2007).
MNC culture
MNC isolated from samples obtained during the CCT were cultured for 24 h as previously described (González et al., 2014a). Culture supernatants were collected and stored at −80°C until being assayed for TNFα, IL-6 and IL-1β.
MNC supernatant, plasma and serum and measurements
MNC-derived TNFα, IL-6 and IL-1β and plasma IL-6 were measured by high sensitivity ELISA (Quantikine, R&D Systems, Minneapolis, MN; sensitivities, 0.1 pg/ml, 0.7 pg/ml, 1.0 pg/ml; intra-assay coefficient of variation [CV] 2.4–5.4%; interassay CV 6.4–8.3%). Plasma levels of glucose, insulin, total cholesterol, triglycerides, high-density lipoprotein (HDL) cholesterol and low-density lipoprotein (LDL) cholesterol, and serum levels of LH, T, A, dehydroepiandrosterone sulfate (DHEA-S) and 17-OHP were measured as previously described (González et al., 2019a). The radioimmunoassay used to measure T demonstrates good correlation with commercial liquid chromatography tandem mass spectrometry (Legro et al., 2010). All samples from each subject were measured in duplicate in the same assay at the end of the study.
Statistical analysis
Analyses were performed using the StatView software package (SAS Institute, Cary, NC). All values were examined graphically for departure from normality, which was subsequently confirmed using the Shapiro–Wilk test. The natural logarithm transformation was applied to total cholesterol and LH before the analysis since these values were not normally distributed. Treatment effects on lipid-induced cytokine secretion from MNC were determined by calculating the absolute change from baseline for each participant to account for inter-subject variability. In the case of plasma IL-6, percentage change from baseline was calculated due to the large magnitude of difference in absolute change values in obese subjects with PCOS compared with the other three groups. The trapezoidal rule was used to also calculate the incremental AUC (iAUC) for each cytokine response (Yeh, 2002). Given that previous studies by our group suggest that obesity increases inflammation and reduces insulin sensitivity in PCOS (González et al., 2006b; González et al., 2013; González et al., 2014a; González et al., 2019a), ANOVA was used to compare data from this study across groups (lean PCOS vs. lean control vs. obese PCOS vs. obese control) followed by Tukey’s honestly significant difference test to identify the source of significance. Differences across groups in cytokine responses over time during the CCT were analyzed using repeated measures ANOVA followed by post hoc analyses. Pearson product moment correlation coefficients were calculated for correlation analyses. Data are presented as mean ± SE, and results with a two-tailed α level of 0.05 were considered to be significant.
Results
Age, body composition and blood pressure
All four groups had similar age, height and systolic and diastolic blood pressures (Table I). Obese subjects with and without PCOS had significantly (P < 0.05) higher weight, body mass index (BMI), percent total body fat, percent truncal fat and R1 fat compared with lean subjects. However, there were no differences in these body composition measures between women with PCOS and control subjects of the same weight class.
Table I.
Age, body composition, inflammation, metabolic and endocrine parameters of subjects.
| CONTROLS | PCOS | |||
|---|---|---|---|---|
| Lean | Obese | Lean | Obese | |
| Age, years | 29 ± 2 | 32 ± 2 | 27 ± 1 | 28 ± 2 |
| Height, cm | 165.8 ± 1.3 | 163.5 ± 2.6 | 160.3 ± 1.9 | 159.7 ± 3.4 |
| Body weight, kg | 60.6 ± 2.4 | 91.3 ± 4.0a, b | 58.1 ± 2.2 | 88.1 ± 4.0c, d |
| Body mass index, kg/m2 | 22.0 ± 0.8 | 34.1 ± 0.7a, b | 22.5 ± 0.6 | 34.4 ± 0.9c, d |
| Total body fat, % | 29.5 ± 1.8 | 41.3 ± 0.7a, b | 31.9 ± 1.3 | 44.2 ± 1.3c, d |
| Truncal fat, % | 24.0 ± 2.3 | 40.5 ± 1.2a, b | 27.6 ± 1.5 | 43.3 ± 1.4c, d |
| Central fat (R1), g | 755 ± 84 | 2005 ± 113a, b | 865 ± 83 | 2157 ± 123c, d |
| Systolic blood pressure, mmHg | 115 ± 4 | 124 ± 2 | 112 ± 5 | 118 ± 5 |
| Diastolic blood pressure, mmHg | 72 ± 2 | 74 ± 3 | 67 ± 3 | 75 ± 2 |
| Fasting MNC-derived TNFα, pg/ml | 16.7 ± 3.9 | 15.4 ± 3.6 | 25.6 ± 7.8 | 24.0 ± 5.4 |
| Fasting MNC-derived IL-6, pg/ml | 9.5 ± 3.6 | 5.3 ± 2.1 | 9.7 ± 2.8 | 10.3 ± 3.2 |
| Fasting MNC-derived IL-1β, pg/ml | 47.2 ± 17.4 | 26.2 ± 11.9 | 45.8 ± 9.7 | 65.3 ± 18.9 |
| Fasting plasma IL-6, pg/ml | 0.9 ± 0.2 | 2.0 ± 0.4a | 1.6 ± 0.2 | 2.6 ± 0.4c, d |
| Fasting glucose, mg/dl | 89 ± 2 | 90 ± 2 | 87 ± 2 | 94 ± 3 |
| 2 h glucose, mg/dl | 94 ± 5 | 87 ± 9 | 101 ± 8 | 131 ± 8c, d, f |
| Fasting insulin, μU/ml | 3.4 ± 0.8 | 15.1 ± 3.0a, b | 6.0 ± 1.0 | 19.3 ± 4.1c, d |
| ISOGTT | 15.0 ± 1.8 | 5.3 ± 1.0 a | 8.3 ± 1.1e | 3.1 ± 0.4c, d |
| Total cholesterol, mg/dl | 138 ± 6 | 151 ± 11a | 174 ± 6e | 184 ± 10c, f |
| Triglycerides, mg/dl | 59 ± 6 | 91 ± 12 | 61 ± 6 | 136 ± 26c, d, f |
| HDL—cholesterol, mg/dl | 53 ± 3 | 48 ± 3 | 56 ± 2 | 49 ± 4 |
| LDL—cholesterol, mg/dl | 73 ± 6 | 85 ± 9b | 106 ± 6e | 110 ± 8c, f |
| LH, mIU/ml | 5.9 ± 0.5 | 5.2 ± 0.8b | 14.6 ± 1.3e | 14.0 ± 2.0c, f |
| Testosterone, ng/dl | 37.0 ± 4.5 | 21.6 ± 4.0b | 64.0 ± 4.2e | 70.1 ± 8.6c, f |
| Androstendione, ng/ml | 1.8 ± 0.8 | 2.0 ± 0.2b | 4.1 ± 0.4e | 3.8 ± 0.3c, f |
| DHEA-S, μg/dl | 215 ± 22 | 154 ± 30 | 248 ± 27 | 207 ± 30 |
| Testosterone, AUC | 3810 ± 363 | 3703 ± 201b | 6413 ± 629e | 7762 ± 1262c, f |
| Androstendione, AUC | 316 ± 24 | 314 ± 37b | 514 ± 29e | 562 ± 53c, f |
| 17OH-Progesterone, AUC | 9307 ± 1249 | 9868 ± 616b | 19 724 ± 3027e | 22 376 ± 3157c, f |
Values are expressed as means ± SE. Conversion factors to SI units: Testosterone ×3.467 (nmol/l), androstenedione ×3.492 (nmol/l), DHEA-S ×0.002714 (μmol/l), glucose ×0.0551 (mmol/l), insulin ×7.175 (pmol/l).
Abbreviations: IL-6, interleukin-6; ISOGTT, insulin sensitivity derived from an oral glucose tolerance test; DHEA-S, dehydroepiandrosterone-sulfate; AUC, HCG-stimulated area under the curve.
aObese control vs. lean control, P < 0.02
bObese control vs. lean PCOS, P < 0.05
cObese PCOS vs. lean control, P < 0.002
dObese PCOS vs. lean PCOS, P < 0.03
eLean PCOS vs. lean control, P < 0.004
fObese control vs. obese PCOS, P < 0.04
MNC-derived cytokine secretion and plasma IL-6 levels
At baseline, there were no significant differences among groups in the culture supernatant concentrations of MNC-derived TNFα, IL-6 and IL-1β from fasting samples (Table I). Baseline fasting plasma IL-6 levels were significantly (P < 0.03) higher in obese subjects with and without PCOS compared with lean control subjects and in women with PCOS who were obese compared with those who were lean. However, baseline fasting plasma IL-6 levels were similar in obese control subjects and lean women with PCOS.
In response to saturated fat ingestion, lean control subjects exhibited a decline from baseline in MNC-derived TNFα, IL-6 and IL-1β secretion and plasma IL-6 after 2 and 3 h, which was significantly (P < 0.05) different compared with the rise that occurred in lean and obese women with PCOS and obese control subjects (Figs 1 and 2). All four groups exhibited a maximum response in MNC-derived cytokine secretion and plasma IL-6 by 2 h. Both lean groups and obese control subjects demonstrated a return to baseline in all four inflammation markers after 5 h. On the other hand, obese women with PCOS showed a persisting response in all four inflammation markers after 5 h that was significantly (P < 0.05) higher compared with the other three groups.
Figure 1.
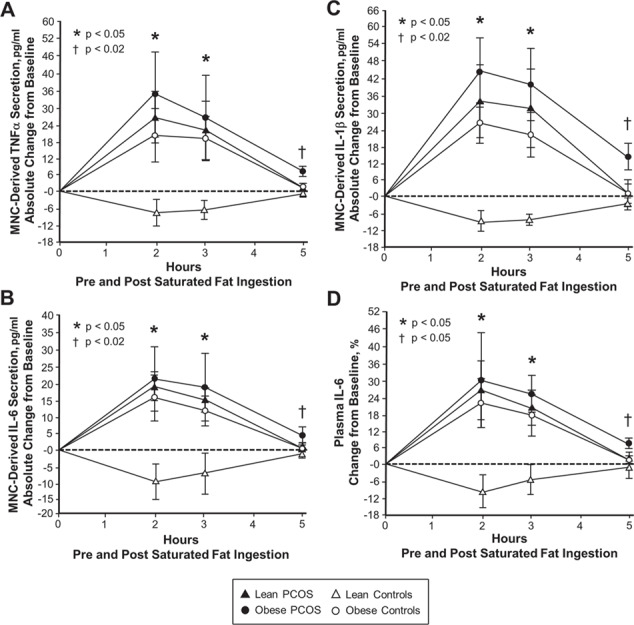
Lipid-induced cytokine responses in mononuclear cells and plasma. Comparison of the four study groups (lean PCOS, n = 10 vs. lean control, n = 10 vs. obese PCOS, n = 9 vs. obese control, n = 9) of the absolute change from baseline in the mononuclear cell (MNC) secretion of the cytokines (A) TNFα, (B) IL-6 and (C) IL-1β, and (D) the change from baseline (%) in plasma IL-6 from blood samples collected while fasting and 2, 3 and 5 h after saturated fat ingestion, using repeated measures ANOVA followed by post hoc analyses to identify the source of significance. *Response in obese women with PCOS, lean women with PCOS and obese control subjects was significantly higher compared with lean control subjects, P < 0.05. †Residual response in obese women with PCOS was significantly higher compared with the other three groups. (A, B and C) P < 0.02 and (D) P < 0.05.
Figure 2.
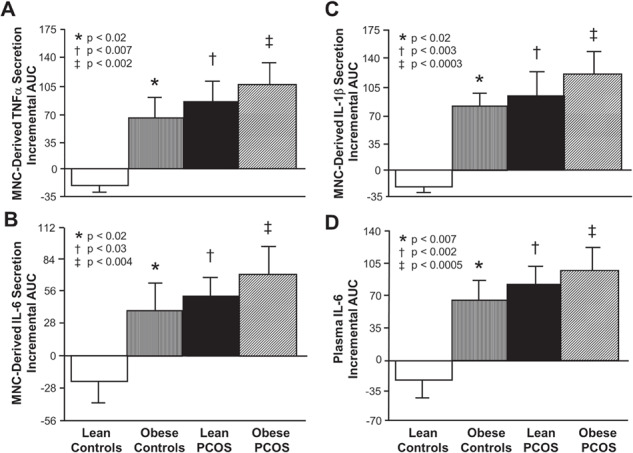
Incremental area under the curve for lipid-induced cytokine responses. Comparison of the four study groups (lean PCOS, n = 10 vs. lean control, n = 10 vs. obese PCOS, n = 9 vs. obese control, n = 9) of the incremental area under the curve (iAUC) in response to saturated fat ingestion for mononuclear cell (MNC) secretion of the cytokines (A) TNFα, (B) IL-6 and (C) IL-1β, and for (D) plasma IL-6 levels using ANOVA followed by post-hoc analyses to identify the source of significance. The iAUC in lean control subjects was significantly lower compared with * obese control subjects. (A, B, C and D) P < 0.02, † lean women with PCOS (A) P < 0.007, (B) P < 0.03, (C) P < 0.003 and (D) P < 0.002, and ‡ obese women with PCOS (A) P < 0.002, (B) P < 0.004, (C) P < 0.0003 and (D) P < 0.0005.
Lean control subjects exhibited a decrease in the iAUC for MNC-derived TNFα, IL-6 and IL-1β secretion and plasma IL-6 that was significantly (P < 0.02) different compared with the increase that occurred in the other three groups (Fig. 2).
Insulin sensitivity and fasting lipids
ISOGTT was significantly (P < 0.02) lower in obese women with PCOS compared with lean subjects with and without PCOS and in obese control subjects and lean women with PCOS compared with lean control subjects (Table I). Regardless of weight class, women with PCOS had significantly (P < 0.05) higher plasma cholesterol and LDL levels than control subjects. Obese women with PCOS had significantly (P < 0.04) higher plasma triglycerides than those of the other three groups. All four groups have similar plasma HDL levels. This notwithstanding, the mean LDL level (>100 mg/dl) in both PCOS groups was the only clinically abnormal plasma lipid.
Basal hormone levels and HCG-stimulated androgen and 17-OHP responses
Both lean and obese women with PCOS had significantly (P < 0.05) higher serum levels of LH, T and A compared with control subjects. All four groups had similar DHEA-S levels (Table I).
Regardless of weight class, women with PCOS had significantly (P < 0.05) higher AUC for the HCG-stimulated responses of T, A and 17-OHP.
Correlations
For the combined groups, there was an inverse association between ISOGTT and BMI (r = −0.61, P < 0.0001), percent total body fat (r = −0.62, P < 0.0001), percent truncal fat (r = −0.66, P < 0.0001) and R1 fat (r = −0.65, P < 0.0001). The iAUC for MNC-derived TNFα, IL-6 and IL-1β secretion and plasma IL-6 was directly associated with these same adiposity measures, and negatively correlated with ISOGTT (Table II).
Table II.
Pearson correlations of cytokine incremental area under the curve during the cream challenge test with measures of adiposity, insulin sensitivity, lipids, LH and androgens for the combined groups.
| TNFα Secretion iAUC | IL-6 Secretion iAUC | IL-1β Secretion iAUC | Plasma IL-6 iAUC | |
|---|---|---|---|---|
| Adiposity and insulin sensitivity vs. cytokines | ||||
| BMI (kg/m2) | 0.321* | 0.356* | 0.417† | 0.343* |
| Total body fat (%) | 0.362* | 0.352* | 0.469† | 0.363* |
| Truncal fat (%) | 0.375† | 0.400† | 0.429† | 0.322* |
| Central fat—R1 (gm) | 0.379† | 0.352* | 0.353* | 0.383 † |
| ISOGTT | -0.513‡ | -0.423† | -0.451† | -0.341* |
| Fasting lipids vs. cytokines | ||||
| Total cholesterol (mg/dl) | 0.157 | 0.136 | 0.387* | 0.396† |
| Triglycerides (mg/dl) | 0.147 | 0.366* | 0.387† | 0.362* |
| HDL—cholesterol (mg/dl) | -0.050 | -0.144 | -0.101 | -0.194 |
| LDL—cholesterol (mg/dl) | 0.136 | 0.338* | 0.354* | 0.349* |
| LH and androgens vs. cytokines | ||||
| LH (iU/ml) | 0.348* | 0.178 | 0.341* | 0.529* |
| Testosterone (ng/dl) | 0.371† | 0.343 * | 0.422 * | 0.370 |
| Androstenedione (ng/ml) | 0.377† | 0.383† | 0.539‡ | 0.330* |
| DHEA-S (μg/dl) | 0.099 | 0.340* | 0.032 | 0.051 |
| Testosterone AUC | 0.353 | 0.207 | 0.375* | 0.426† |
| Androstenedione AUC | 0.257 | 0.366* | 0.398† | 0.384† |
| 17OH-Progesterone AUC | 0.083 | 0.231 | 0.362* | 0.236 |
TNFα, tumor necrosis factor α; IL-6, interleukin-6; IL-1β, interleukin-1β; ISOGTT, insulin sensitivity derived from an oral glucose tolerance test; HDL, high-density lipoprotein; LDL, low density lipoprotein; DHEA-S, dehydroepiandrosterone-sulfate; AUC, HCG-stimulated area under the curve. Statistically significant correlations are represented by
* P < 0.05,
† P < 0.02 and
‡ P < 0.002.
For the combined groups, the iAUC for MNC-derived IL-1β secretion and plasma IL-6 was positively correlated with plasma total cholesterol and LDL; and the iAUC for MNC-derived IL-6 secretion was positively correlated with triglycerides and LDL (Table II). The iAUC for MNC-derived TNFα and IL-1β secretion and plasma IL-6 was positively correlated with basal levels of LH, testosterone and androstenedione and the HCG-stimulated testosterone AUC. The MNC-derived IL-6 response was positively correlated with basal levels of testosterone, androstenedione and DHEA-S and the HCG-stimulated androstenedione AUC. The MNC-derived IL-1β response was positively correlated with the HCG-stimulated 17OHP AUC.
In women with PCOS, the iAUC for MNC-derived TNFα secretion was positively correlated with percent truncal fat (r = 0.42, P < 0.05) and R1 fat (r = 0.47, P < 0.04), and negatively correlated with ISOGTT (r = 0.49, P < 0.04). Plasma total cholesterol was positively correlated with the iAUC for MNC-derived IL-6 secretion (r = 0.46, P < 0.05), and plasma triglycerides were positively correlated with the iAUC for MNC-derived IL-6 (r = 0.58, P < 0.02) and IL-1β secretion (r = 0.50, P < 0.05) and plasma IL-6 (r = 0.50, P < 0.04).
In women with PCOS, there were also positive correlations between basal LH and the iAUC for MNC-derived IL-1β secretion (r = 0.61, P < 0.02) and plasma IL-6 (r = 0.58, P < 0.02), basal testosterone and the MNC-derived responses of TNFα (r = 0.53, P < 0.03) and IL-1β (r = 0.57, P < 0.03), HCG-stimulated testosterone AUC and the iAUC for MNC-derived TNFα secretion (r = 0.53, P < 0.04) and plasma IL-6 (r = 0.51, P < 0.05), and HCG-stimulated androstenedione AUC and the MNC-derived IL-6 response (r = 0.51, P < 0.05).
Discussion
Our data are the first to show clearly in PCOS that cytokines secreted by MNC and in the circulation following saturated fat ingestion are increased in the absence of obesity. Lean and obese women with PCOS both show a rise in lipid-induced TNFα, IL-6 and IL-1β secretion from MNC and plasma IL-6 compared with lean control subjects. These cellular and circulating cytokine responses to saturated fat ingestion are inversely related to insulin sensitivity, and directly related to basal and HCG-stimulated androgen secretion, thereby upholding the view that lipid-stimulated inflammation may underpin insulin resistance and androgen excess in PCOS. Furthermore, the direct relationship between these lipid-induced cytokine responses and measures of adiposity raises the possibility that in PCOS, adiposity is an additional source of inflammation that modulates insulin action.
MNC-derived TNFα, IL-6 and IL-1β secretion and plasma IL-6 are suppressed in lean control subjects following saturated fat ingestion, in keeping with our previous studies showing an attenuated MNC cytokine response and lower plasma cytokines following glucose ingestion in ovulatory women (González et al., 2014a; González et al., 2014b; González et al., 2014c; González et al., 2019a). These observations are important because TNFα, IL-6 and IL-1β mediate insulin resistance and atherogenesis (Barnes and Karin 1997; Rui et al., 2001). Thus, the limited cytokine response to saturated fat ingestion in lean women may serve to maintain insulin sensitivity and preserve blood vessel integrity.
In contrast, MNC-derived TNFα, IL-6 and IL-1β secretion and plasma IL-6 increase following saturated fat ingestion in lean and obese women with PCOS compared with lean control subjects, in line with our previous reports of MNC preactivation in the fasting state and glucose-stimulated increases in cytokines from MNC and plasma in women with PCOS (González et al., 2007; González et al., 2014a; González et al., 2014b; González et al., 2014c; González et al., 2019a). Notably, these studies highlight the contribution of circulating MNC in establishing a proinflammatory state that may underpin the development of insulin resistance and atherogenesis in women with PCOS. The similar degree in baseline plasma IL-6 elevation in lean women with PCOS and obese control subjects also suggests that systemic inflammation related to PCOS per se may raise the risk of metabolic aberrations to that seen in obesity. Protein ingestion also provokes a proinflammatory MNC response (Mohanty et al., 2002) suggesting that feeding itself can induce an inflammatory response that may promote metabolic aberration in PCOS even in the absence of adiposity. The reduction in inflammation in normal humans following a two-day fast, as well as the negative association between insulin sensitivity and the lipid-stimulated cytokine responses in the current study further support this concept (Dandona et al., 2001).
Lipid-induced inflammation and adiposity are linked in PCOS. In the current study, cytokine responses following saturated fat ingestion are directly related to measures of adiposity including abdominal fat, for the combined groups and in women with PCOS. Hypoxia-related adipocyte death causes oxidative stress due to phagocytic activity of resident macrophages emanating from MNC trafficking into the stromal-vascular compartment of excess adipose tissue (Weisberg et al., 2003; Cinti et al., 2005). Oxidative stress activates NFκB in macrophages which in turn upregulates their cytokine production (Barnes and Karin 1997). Macrophage cytokines stimulate adipocyte cytokine production through a paracrine effect perpetuated by lipid-induced cytokine secretion from MNC which promotes insulin resistance and atherogenesis (Barnes and Karin 1997; Fain et al., 2004; Nov et al., 2013). In fact, measures of adiposity are inversely related to insulin sensitivity. Thus, circulating MNC and adiposity together elicit systemic inflammation and metabolic aberration when obesity is present in PCOS.
Lipid-induced inflammation and dyslipidemia are linked in PCOS as total cholesterol, triglycerides and LDL are positively associated with cytokine responses in MNC and plasma following saturated fat ingestion for the combined groups and in women with PCOS. LDL is also directly related to these lipid-induced cytokine responses for the combined groups. Cytokines promote hepatic fatty acid synthesis and adipose tissue lipolysis, providing substrates for hepatic triglyceride and triglyceride-rich VLDL production (Brewer et al., 1999). VLDL triglyceride is transferred to LDL and hydrolyzed by hepatic lipase to proatherogenic small dense LDL, which is oxidized and transported into foamy macrophages of atherosclerotic lesions (Khovidhunkit et al., 2004). In the current study, cholesterol and LDL are elevated in both lean and obese women with PCOS, while triglycerides are elevated distinctly in obese women with PCOS. Thus, inflammation triggered by saturated fat ingestion may be a powerful provoker of dyslipidemia when obesity is present in PCOS, with inflammation and lipid abnormalities acting together to prematurely drive atherogenesis.
Lipid-induced inflammation may directly stimulate androgen excess in PCOS. In the current study, basal LH and androgen concentrations and HCG-stimulated androgen secretion are directly related to cytokine responses in MNC and plasma following saturated fat ingestion for the combined groups and in women with PCOS. We have reported similar findings in response to glucose ingestion (González et al., 2006b; González et al., 2012b; González et al., 2013; González et al., 2014a). The link with LH suggests that inflammation may exert a central effect to promote androgen production. Nevertheless, local effects of inflammation may also exist given that intake of saturated fat increases MNC-derived macrophages within the ovary (Thornton et al., 2015) and macrophage TNFα stimulates theca cell proliferation (Spazynsky et al., 1999) and promotes serine phosphorylation which may increase 17,20-lyase activity (Zhang et al., 1995). We recognize that the link between lipid-induced cytokine secretion and HCG-stimulated androgen secretion does not prove cause and effect. However, in lean women with PCOS, chronic androgen suppression does not decrease inflammation (González et al., 2012a), while long-term salicylate treatment to reduce inflammation lowers basal and HCG-stimulated androgen secretion (González et al., 2015). Thus, MNC migration into the polycystic ovary following saturated fat ingestion may incite local cytokine secretion to increase ovarian androgen production by stimulating theca cells to proliferate and ramp up steroidogenic activity. Further research with a greater number of subjects is warranted to confirm whether inflammation influences ovarian androgen secretion in PCOS.
In conclusion, MNC-derived TNFα, IL-6 and IL-1β secretion and circulating IL-6 are increased in PCOS following saturated fat ingestion even in the absence of obesity. The ensuing proinflammatory state may contribute to insulin resistance, dyslipidemia and androgen excess in PCOS. The link between lipid-induced cytokine secretion and measures of adiposity suggests that excess adipose tissue also stimulates inflammation in this disorder. Thus, circulating MNC and adiposity may be separate and distinct contributors to the metabolic aberration and endocrine dysfunction in PCOS.
Acknowledgements
The authors are grateful to the nursing staff of the Indiana Clinical and Translational Sciences Institute Clinical Research Center for assisting with implementing the study and collecting the data. We also thank Merck Sharp & Dohme for the generous Pregnyl donation utilized in this study.
Portions of this work were reported at the 11th meeting of the Androgen Excess and Polycystic Ovary Syndrome Society, Newport Beach, RI, 17–18 October 2013, and the 72nd meeting of the American Society for Reproductive Medicine, Salt Lake City, UT, 15–19 October 2016.
Authors’ roles
F.G. conceived and designed the study; O.A.A., A.J.A and F.G executed the laboratory assays; F.G. analyzed the data; F.G. and R.V.C. interpreted the experimental results; F.G. drafted the manuscript; F.G., R.V.C., O.A.A. and A.J.A assisted with study organization and manuscript editing and approved the final version of the manuscript.
Funding
Financial support for this research was provided by grant R01 DK107605 to F.G. from the National Institutes of Health, the Indiana Clinical and Translational Sciences Institute Clinical Research Center which is funded in part by grant UL1TR002529 from the National Institutes of Health, National Center for Advancing Translational Sciences, Clinical and Translational Sciences Award, and the Indiana University Center for Diabetes and Metabolic Diseases funded by grant P30 DK097512 from the National Institutes of Health. The content is solely the responsibility of the authors and does not necessarily represent the official views of the National Institutes of Health.
Conflict of interest
The authors have no conflicts of interest, financial or otherwise, to declare.
References
- Abraham GE, Maroulis GB, Marshall JR. Evaluation of ovulation and corpus luteum function using measurements of plasma progesterone. Obstet Gynecol 1974;44:522–525. [PubMed] [Google Scholar]
- Banaszewska B, Wrotyńska-Barczyńska J, Spaczynski RZ, Pawelczyk L, Duleba AJ. Effects of resveratrol on polycystic ovary syndrome: a double-blind, randomized, placebo-controlled trial. J Clin Endocrinol Metab 2016;101:4322–4328. [DOI] [PubMed] [Google Scholar]
- Barbieri RL, Makris A, Ryan KJ. Effects of insulin on steroidogenesis in cultured porcine ovarian theca. Fertil Steril 1983;40:237–241. [PubMed] [Google Scholar]
- Barnes PJ, Karin M. Nuclear factor-κB: a pivotal transcription factor in chronic inflammatory diseases. N Engl J Med 1997;336:1066–1071. [DOI] [PubMed] [Google Scholar]
- Brewer HB., Jr Hypertriglyceridemia: changes in the plasma lipoproteins associated with an increased risk of cardiovascular disease. Am J Cardiol 1999;83:3F–12F. [DOI] [PubMed] [Google Scholar]
- Carmina E, Bucchieri S, Esposito A, Del Puente A, Mansueto P, Orio F, Di Fede G, Rini G. Abdominal fat quantity and distribution in women with polycystic ovary syndrome and extent of its relation to insulin resistance. J Clin Endocrinol Metab 1997;92:2500–2505. [DOI] [PubMed] [Google Scholar]
- Cinti S, Mitchell G, Barbatelli G, Murano I, Ceresi E, Faloia E, Wang S, Fortier M, Greenberg AS, Obin MS. Adipocyte death defines macrophage localization and function in adipose tissue of obese mice and humans. J Lipid Res 2005;46:2347–2355. [DOI] [PubMed] [Google Scholar]
- Dandona P, Mohanty P, Hamouda W, Ghanim H, Aljada A, Garg R, Kumar V. Inhibitory effect of a two day fast on reactive oxygen species (ROS) generation by leucocytes and plasma ortho-tyrosine and meta-tyrosine concentrations. J Clin Endocrinol Metab 2001;86:2899–2902. [DOI] [PubMed] [Google Scholar]
- Deopurkar R, Ghanim H, Friedman J, Abuaysheh S, Sia CL, Mohanty P, Chaudhuri A, Dandona P. Differential effects of cream, glucose, and orange juice on inflammation, endotoxin, and the expression of toll-like receptor-4 and suppressor of cytokine signaling-3. Diabetes Care 2010;33:991–997. [DOI] [PMC free article] [PubMed] [Google Scholar]
- Dunaif A, Segal KR, Futterweit W, Dobrjansky A. Profound insulin resistance, independent of obesity in polycystic ovary syndrome. Diabetes 1989;38:1165–1174. [DOI] [PubMed] [Google Scholar]
- Fain JN, Bahouth SW, Madan AK. TNFα release by nonfat cells of adipose tissue. Int J Obes (Lond) 2004;28:616–622. [DOI] [PubMed] [Google Scholar]
- Fauser BC, Tarlatzis BC, Rebar RW, Legro RS, Balen AH, Lobo R, Carmina E, Chang RJ, Yildiz BO, Laven JS et al. Consensus on women’s health aspects of polycystic ovary syndrome (PCOS): the Amsterdam ESHRE/ASRM-sponsored 3rd PCOS consensus workshop group. Fertil Steril 2012;97:28–38.e25. [DOI] [PubMed] [Google Scholar]
- Fox CW, Zhang L, Sohni A, Doblado M, Wilkinson MF, Chang RJ, Duleba AJ. Inflammatory stimuli trigger increased androgen production and shifts in gene expression in theca-interstitial cells. Endocrinology 2019;160:2946–2958. [DOI] [PMC free article] [PubMed] [Google Scholar]
- González F, Rote NS, Minium J, Kirwan JP. Hyperglycemia alters tumor necrosis factor-α release from mononuclear cells in women with polycystic ovary syndrome. J Clin Endocrinol Metab 2005;90:5336–5342. [DOI] [PubMed] [Google Scholar]
- González F, Rote NS, Minium J, Kirwan JP. Reactive oxygen species-induced oxidative stress in the development of insulin resistance and hyperandrogenism in polycystic ovary syndrome. J Clin Endocrinol Metab 2006a;91:336–340. [DOI] [PubMed] [Google Scholar]
- González F, Rote NS, Minium J, Kirwan JP. Increased activation of nuclear factor κB triggers inflammation and insulin resistance in polycystic ovary syndrome. J Clin Endocrinol Metab 2006b;91:1508–1512. [DOI] [PubMed] [Google Scholar]
- González F, Rote NS, Minium J, Kirwan JP. Insulin sensitivity and hyperandrogenism in polycystic ovary syndrome are related to activated nuclear factor κB from mononuclear cells in the fasting state. Endocr Rev 2007;28(3 Suppl):142. [Google Scholar]
- González F, Sia CL, Stanczyk FZ, Blair HE, Krupa ME. Hyperandrogenism exerts an anti-inflammatory effect in obese women with polycystic ovary syndrome. Endocrine 2012a;42:726–735. [DOI] [PMC free article] [PubMed] [Google Scholar]
- González F, Sia CL, Shepard MK, Rote NS, Minium J. Inflammation in response to glucose ingestion is independent of excess abdominal adiposity in normal weight women with polycystic ovary syndrome. J Clin Endocrinol Metab 2012b;97:4071–4079. [DOI] [PMC free article] [PubMed] [Google Scholar]
- González F, Rote NS, Minium J, Kirwan JP. Glucose ingestion stimulates atherothrombotic inflammation in polycystic ovary syndrome. Am J Physiol Endocrinol Metab 2013;304:E375–E383. [DOI] [PMC free article] [PubMed] [Google Scholar]
- González F, Sia CL, Shepard MK, Rote NS, Minium J. The altered mononuclear cell-derived cytokine response to glucose ingestion is not regulated by excess adiposity in polycystic ovary syndrome. J Clin Endocrinol Metab 2014a;99:E2244–E2251. [DOI] [PMC free article] [PubMed] [Google Scholar]
- González F, Kirwan JP, Rote NS, Minium J, O’Leary VB. Glucose and lipoplysaccharide regulate proatherogenic cytokine release from mononuclear cells in women with polycystic ovary syndrome. J Reprod Immunol 2014b;103:38–44. [DOI] [PMC free article] [PubMed] [Google Scholar]
- González F, Sia CL, Bearson DM, Blair HE. Hyperandrogenism induces a proinflammatory TNFα response to glucose ingestion in a receptor-dependent fashion. J Clin Endocrinol Metab 2014c;99:E848–E854. [DOI] [PMC free article] [PubMed] [Google Scholar]
- González F, Mather KJ, Considine RV, Pardue SL, Acton AJ. Suppression of nutrient-induced inflammation with a nonsteroidal anti-inflammatory agent ameliorates ovarian dysfunction in lean insulin-sensitive women with polycystic ovary syndrome. Fertil Steril 2015;104(3 Suppl):e21. [Google Scholar]
- González F, Considine RV, Abdelhadi OA, Acton AJ. Saturated fat ingestion promotes lipopolysaccharide-mediated inflammation and insulin resistance in polycystic ovary syndrome. J Clin Endocrinol Metab 2019a;104:934–946. [DOI] [PMC free article] [PubMed] [Google Scholar]
- González F, Considine RV, Abdelhadi OA, Acton AJ. Oxidative stress in response to saturated fat ingestion is linked to insulin resistance and hyperandrogenism in polycystic ovary syndrome. J Clin Endocrinol Metab 2019b;104:5360–5370. [DOI] [PMC free article] [PubMed] [Google Scholar]
- González F, Considine RV, Abdelhadi OA, Acton AJ. Inflammation triggered by saturated fat ingestion is linked to insulin resistance and hyperandrogenism in polycystic ovary syndrome. J Clin Endocrinol Metab. March 6 2020. doi: 10.1210/clinem/dgaa108 [Epub ahead of print]. [DOI] [PMC free article] [PubMed] [Google Scholar]
- Khovidhunkit W, Kim MS, Memon RA, Shigenaga JK, Moser AH, Feingold KR, Grunfeld C. Effects of infection and inflammation on lipid and lipoprotein metabolism: mechanisms and consequences to the host. J Lipid Res 2004;45:1169–1196. [DOI] [PubMed] [Google Scholar]
- Kelly CC, Lyall H, Petrie JR, Gould GW, Connell JMC, Sattar N. Low grade chronic inflammation in women in women with polycystic ovary syndrome. J Clin Endocrinol Metab 2001;86:2453–2455. [DOI] [PubMed] [Google Scholar]
- Koivunen RM, Morin-Papunen LC, Ruokonen A, Tapanainen JS, Martikainen HK. Ovarian steroidogenic response to human chorionic gonadotrophin in obese women with polycystic ovary syndrome: effect of metformin. Hum Reprod 2001;16:2546–2551. [DOI] [PubMed] [Google Scholar]
- Knochenhauer ES, Key TJ, Kahser-Miller M, Waggoner W, Boots LR, Azziz R. Prevalence of the polycystic ovary syndrome in unselected black and white women of the southeastern unites states: a prospective study. J Clin Endocrinol Metab 1998;83:3078–3082. [DOI] [PubMed] [Google Scholar]
- Legro RS, Schlaff WD, Diamond MP, Coutifaris C, Casson PR, Brzyski RG, Christman GM, Trussell JC, Krawetz SA, Snyder PJ et al. Reproductive medicine network. Total testosterone assays in women with polycystic ovary syndrome: precision and correlation with hirsutism. J Clin Endocrinol Metab 2010;95:5305–5313. [DOI] [PMC free article] [PubMed] [Google Scholar]
- Lynch KE, Mumford SL, Schliep KC, Whitcomb BW, Zarek SM, Pollack AZ, Bertone-Johnson ER, Danaher M, Wactawski-Wende J, Gaskins AJ et al. Assessment of anovulation in eumenorrheic women: comparison of ovulation detection algorithms. Fertil Steril 2014;102:511–518.e2. [DOI] [PMC free article] [PubMed] [Google Scholar]
- March WA, Moore VM, Willson KJ, Phillips DIW, Normal RJ, Davies MJ. The prevalence of polycystic ovary syndrome in a community sample assessed under contrasting diagnostic criteria. Hum Reprod 2010;25:544–551. [DOI] [PubMed] [Google Scholar]
- Matsuda M, DeFronzo R. Insulin sensitivity indices obtained from oral glucose tolerance testing. Diabetes Care 1999;22:1462–1470. [DOI] [PubMed] [Google Scholar]
- Modan M, Harris MI, Halkin H. Evaluation of WHO and NDDG criteria for impaired glucose tolerance. Results from two national samples. Diabetes 1989;38:1630–1635. [DOI] [PubMed] [Google Scholar]
- Mohanty P, Ghanim H, Hamouda W, Aljada A, Garg R, Dandona P. Both lipid and protein intakes stimulate increased generation of reactive oxygen species by polymorphonuclear leukocytes and mononuclear cells. Am J Clin Nutr 2002;75:767–772. [DOI] [PubMed] [Google Scholar]
- Morales AJ, Laughlin GA, Bützow T, Maheshwari H, Baumann G, Yen SS. Insulin, somatotropic, and luteinizing hormone axes in lean and obese women with polycystic ovary syndrome: common and distinct features. J Clin Endocrinol Metab 1996;81:2854–2864. [DOI] [PubMed] [Google Scholar]
- National Cholesterol Education Program (NCEP) Expert Panel on Detection, Evaluation, and Treatment of High Blood Cholesterol in Adults (Adult Treatment Panel III) Third report of the national cholesterol education program (NCEP) expert panel on detection, evaluation, and treatment of high blood cholesterol in adults (adult treatment panel III) final report. Circulation 2002;106:3143–3421. [PubMed] [Google Scholar]
- Nelson VL, Legro RS, Strauss JF 3rd, McAllister JM. Augmented androgen production is a stable steroidogenic phenotype of propagated theca cells from polycystic ovaries. Mol Endocrinol 1999;13:946–957. [DOI] [PubMed] [Google Scholar]
- Nov O, Shapiro H, Ovadia H, Tarnovscki T, Dvir I, Shemesh E, Kovsan J, Shelef I, Carmi Y, Voronov E et al. Interleukin-1β regulates fat-liver crosstalk in obesity by auto-paracrine modulation of adipose tissue inflammation and expandability. PLoS One 2013;8:e53626. [DOI] [PMC free article] [PubMed] [Google Scholar]
- Rui L, Aguirre V, Kim JK, Shulman GI, Lee A, Corbould A, Dunaif A, White MF. Insulin/IGF-1 and TNF-α stimulate phosphorylation of IRS-1 at inhibitory Ser307 via distinct pathways. J Clin Invest 2001;107:181–189. [DOI] [PMC free article] [PubMed] [Google Scholar]
- Spazynsky RZ, Arici A, Duleba AJ. Tumor necrosis factor alpha stimulates proliferation of rat ovarian theca-interstitial cells. Biol Reprod 1999;61:993–998. [DOI] [PubMed] [Google Scholar]
- Thornton K, Asemota O, Jindal S, Charron M, Buyuk E. High fat diet and aging are associated with macrophage infiltration in mice ovaries. Fertil Steril 2015;104(3 Suppl):e104. [Google Scholar]
- Weisberg SP, McCann D, Desai M, Rosenbaum M, Leibel RL, Ferrante AW Jr. Obesity is associated with macrophage accumulation in adipose tissue. J Clin Invest 2003;112:1796–1808. [DOI] [PMC free article] [PubMed] [Google Scholar]
- Wild RA, Carmina E, Diamanti-Kandarakis E, Escobar-Morreale HF, Futterweit W, Lobo R, Norman RJ, Talbott E, Dumesic DA. Assessment of cardiovascular risk and prevention of cardiovascular disease in women with the polycystic ovary syndrome: a consensus statement by the androgen excess and polycystic ovary syndrome (AE-PCOS) society. J Clin Endocrinol Metab 2010;95:2038–2049. [DOI] [PubMed] [Google Scholar]
- Yeh ST. Using a trapezoidal rule for the area under a curve calculation – SAS advanced tutorial Proceedings of the 27th Annual Conference of SAS Users Group International, Orlando, FL 2002; abstract 229.
- Zhang LH, Rodriguez H, Ohno S, Miller WL. Serine phosphorylation of human P450c17 increases 17,20 lyase activity: implications for adrenarche and the polycystic ovary syndrome. Proc Natl Acad Sci U S A 1995;92:10619–10623. [DOI] [PMC free article] [PubMed] [Google Scholar]