Supplemental Digital Content is available in the text.
Keywords: decision-making, facial expression, facial recognition, information entropy, intuition, stress
Abstract
Objectives:
To determine whether time-series analysis and Shannon information entropy of facial expressions predict acute clinical deterioration in patients on general hospital wards.
Design:
Post hoc analysis of a prospective observational feasibility study (Visual Early Warning Score study).
Setting:
General ward patients in a community hospital.
Patients:
Thirty-four patients at risk of clinical deterioration.
Interventions:
A 3-minute video (153,000 frames) for each of the patients enrolled into the Visual Early Warning Score study database was analyzed by a trained psychologist for facial expressions measured as action units using the Facial Action Coding System.
Measurements and Main Results:
Three-thousand six-hundred eighty-eight action unit were analyzed over the 34 3-minute study periods. The action unit time variables considered were onset, apex, offset, and total time duration. A generalized linear regression model and time-series analyses were performed. Shannon information entropy (Hn) and diversity (Dn) were calculated from the frequency and repertoire of facial expressions. Patients subsequently admitted to critical care displayed a reduced frequency rate (95% CI moving average of the mean: 9.5–10.9 vs 26.1–28.9 in those not admitted), a higher Shannon information entropy (0.30 ± 0.06 vs 0.26 ± 0.05; p = 0.019) and diversity index (1.36 ± 0.08 vs 1.30 ± 0.07; p = 0.020) and a prolonged action unit reaction time (23.5 vs 9.4 s) compared with patients not admitted to ICU. The number of action unit identified per window within the time-series analysis predicted admission to critical care with an area under the curve of 0.88. The area under the curve for National Early Warning Score alone, Hn alone, National Early Warning Score plus Hn, and National Early Warning Score plus Hn plus Dn were 0.53, 0.75, 0.76, and 0.81, respectively.
Conclusions:
Patients who will be admitted to intensive care have a decrease in the number of facial expressions per unit of time and an increase in their diversity.
We previously reported how certain facial expressions, identifiable as specific action units (AUs), could be used to identify general ward patients at risk of clinical deterioration requiring admission to intensive care (1).
The duration (time) of facial expressions induced by stress could relate to the load on the body. This load depends on factors such as the resilience of the subject (age, genotype, comorbidities), the strength of the stimulus (e.g., shock state) and the organs affected (2). Our aim in this post hoc analysis was to investigate whether the range and duration of facial expressions would add further useful predictive information. As sick patients are generally less expressive and mobile, this could explain the strong “gut feeling” held by experienced nurses and doctors in identifying clinical deterioration simply by looking at the patient (1).
Biological systems can be considered as waves of variables (e.g., representing events of outcomes) projecting into the time domain (3) with continuously changing probabilities reflecting their information content or entropy (4). Life in general not only carries energy but also information. The randomness of the information content associated with facial expressions maybe relevant and warrant further investigation (4).
Time-series analysis (5) is a key statistical tool to monitor time varying data. Time-series analysis has previously been applied successfully to patients in intensive care, for example, in cardiovascular physiology (6). In this study, time variables, Shannon information entropy (Hn) and diversity (Dn) (7) of facial expressions were studied in general ward patients to determine their utility in predicting admission to intensive care.
MATERIALS AND METHODS
The Visual Early Warning Score (VIEWS) study is described in detail elsewhere (1). In brief, it was an observational study approved by the U.K. Health Research Authority (IRAS 165739, REC 16/LO/0365) and performed in a Community Hospital in London, United Kingdom. Patients included in the study were clinically deteriorating general ward patients who triggered a critical care outreach review. Patients were asked to participate if they were 1) awake (Alert, Voice, Pain, and Unresponsive score = 0) and able to provide informed consent; 2) 18 years of age or older; 3) had a National Early Warning Score (NEWS) greater than or equal to 5 or scored 3 points in any one single NEWS variable (abnormalities in respiratory rate, oxygen saturation, temperature, systolic blood pressure, heart rate and level of consciousness, and use of oxygen; the total score could range between 0 and 20) or if the nurse was concerned about the patient; and 4) patients were breathing room air or receiving oxygen via nasal cannula or face mask.
Patients were excluded if they were less than 18 years old, were receiving sedatives or drugs in doses high enough to interfere with their conscious level, had anatomical face impediments such as previous facial surgery, prominent beards, and eye abnormalities, or could not give written informed consent.
After enrollment in the original VIEWS study, a 5-minute video at a speed of 25 frames/s (7,500 images per patient) was recorded by a camera (Electro-Optical System 7D with an Electro-Focus Short 18–135 lens [Canon, Tokyo, Japan]) placed on a tripod at the foot of the patient’s bed. A lateral position was used when a better view of the lips and jaw was required in patients receiving oxygen through a face mask. Patients were instructed to look forward.
Facial expressions were assessed manually and “off-line” using the Facial Action Coding System (FACS), a comprehensive, anatomically based system for measuring visually discernible facial expressions or AUs (8). This was performed by a single trained psychologist blinded to the patient outcome.
The primary response variables were binary: Group admitted to ICU versus Group not admitted to ICU. Hospital mortality was a secondary outcome.
Explanatory variables investigated include baseline data (age, sex, ethnicity, NEWS score), frequency of each AU, time variables, and duration of the different phases of the AU expression.
Time variables considered were onset-time duration (ONTD, the length of time from the start of the movement until it reached a plateau where no further increase in muscular action could be observed), apex-time duration (ATD, the duration of that plateau), offset-time duration (OFTD, the length of time from the end of the apex to the point where the muscle was no longer acting), and total time duration (TTD, the sum of ONTD, ATD, and OFTD) (9). The time duration of each AU was calculated in milliseconds (ms) using the frame count equivalents (available in the GitHub repository https://github.com/jerrybrownhill/VIEWS/blob/master/sample.txt) identified by manual inspection of the videos with an in-built frame clock (Quick-Time 7; Apple, Cupertino, CA) and considering the speed of video recording (25 frames/s) (Supplemental Fig. 1, Supplemental Digital Content 1, http://links.lww.com/CCX/A164; legend: procedure to calculate time variables). The first 70 frames of each video were discarded to allow patients to stabilize from any start-up perturbation yielding a consistent recording and the next 3 minutes used for subsequent analysis. To normalize and simplify data analysis, the first 3-minute window was interrogated from the original 5-minute recording made in the VIEWS study. The 3-minute segments were spontaneous facial expressions without dynamic person-to-person interaction.
Other explanatory variables were the Shannon information entropy and diversity coefficients. Shannon information entropy was calculated as described by Scheider et al (7). In brief, frequency (f, or the total number of facial expressions produced independently of their type in each group) and repertoire (r, or number of different types of facial expressions observed during the recording time in each group) was first examined. Shannon information entropy (Hn, in natural units or nats) was calculated as: Hn = – p × log (p) where p = r/f. Higher information entropy (Hn) means the signal is less predictable (i.e., there is greater uncertainty) and therefore the information content is lower. Finally, a derived value of Hn, known as diversity (Dn) of facial expressions was calculated as Dn = eHn. A time-series analysis was used after ordering the AU database by frame number.
Descriptive analyses were undertaken to characterize the study sample using mean and sd or median and interquartile range, as appropriate. Statistical modeling took into consideration the distribution of the variables (normality), type of response variable, and repeated measures of AU within the same patient.
The original video library was used to create a new database where the mean of repeated AU within patients was calculated to prevent bias associated with repeated measures (https://github.com/jerrybrownhill/VIEWS/blob/master/b34.txt).
Time variables were investigated with a generalized linear model (GLM, family = quasi, link = identity) for non-normal distribution errors. A GLM with a binary family distribution and a logistic function as a link was used to predict admission to intensive care using continuous variables such as NEWS score, frequency of AU, Hn and Dn. A receiver operating characteristic (ROC) curve was displayed to demonstrate the accuracy of the model.
Time-series graphs were employed for overall representation of the AU frequency within the 3-minute study interval using the original database (sample.txt) ordered by frame time. AU were measured in 100 windows of 47 frames each (equivalent to 1.88 s) starting from frame 70 until frame 4,770 in the video recording.
Mann-Whitney U comparisons were performed for the Shannon and diversity coefficients between study groups. A two-tailed p value of less than 0.05 was taken as showing statistical significance. The R package was used for statistical analysis (R Foundation for Statistical Computing, Vienna, Austria).
RESULTS
Baseline data for patients admitted or not admitted to ICU were similar (Supplemental Table 1, Supplemental Digital Content 2, http://links.lww.com/CCX/A165). Measures for location and spread of time variables in patients either admitted or not admitted to the ICU are presented in Supplemental Table 2 (Supplemental Digital Content 3, http://links.lww.com/CCX/A166).
Analysis of deviance using a GLM for ONTD, ATD, OFTD, and TTD by AU and its relationship to ICU admission did not demonstrate any explanatory influence (Supplemental Table 3, Supplemental Digital Content 4, http://links.lww.com/CCX/A167). A binary analysis, performed to ascertain if a time variable alone (ONTD, ATD, OFTD, TTD) predicted admission to intensive care also did not indicate any influence on ICU admission (Supplemental Table 4, Supplemental Digital Content 5, http://links.lww.com/CCX/A168).
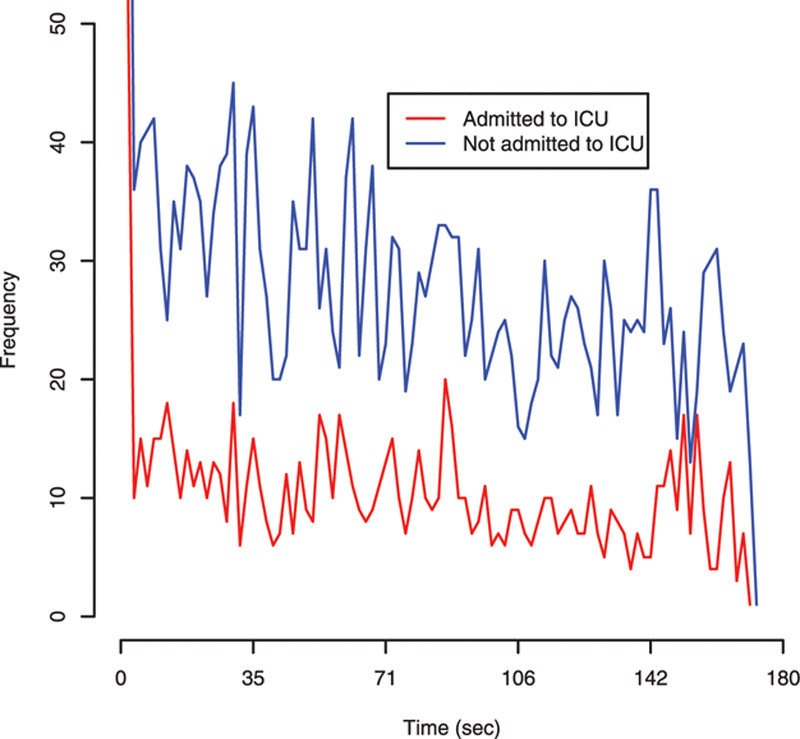
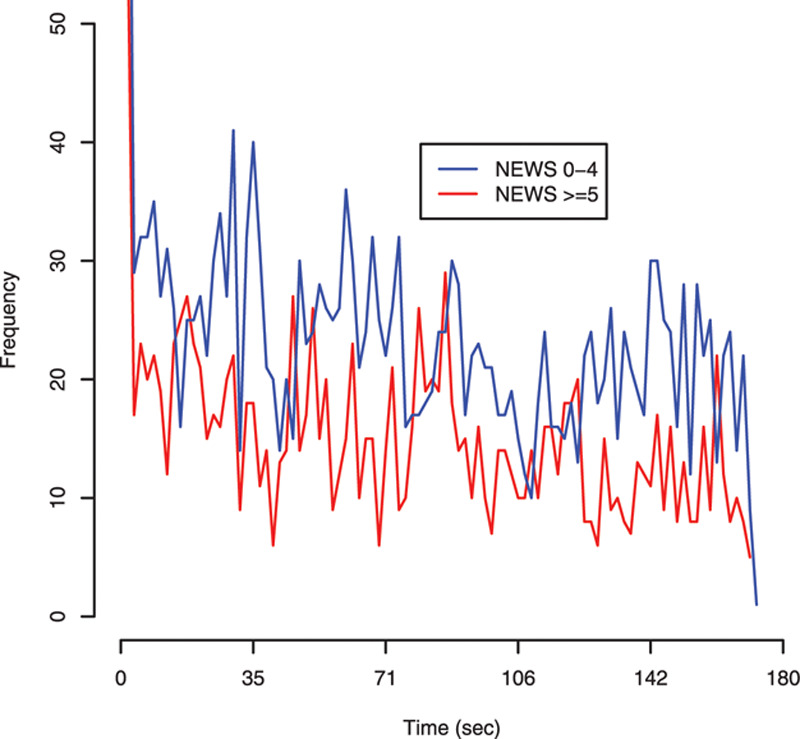
Time-series graphs for AU frequency by admission to ICU and by NEWS score (0–4 vs ≥ 5) are shown in Figures 1 and 2, respectively. The frequency of AU against time could identify patients who were subsequently admitted to ICU, but not between patients with different NEWS scores. The 95% CI for the moving average of the mean of the time-series based upon 10,000 bootstrapping replicates was 9.5–10.9 for patients admitted to ICU versus 26.1–28.9 in those not admitted. Trend of the time-series in Figure 1 was investigated using a linear regression model (Supplemental Table 5, Supplemental Digital Content 6, http://links.lww.com/CCX/A169). The AU frequency for the admitted group decreased by 0.08 AU per unit of time (47 frames) or 1 AU per 587.5 frames (equivalent to 23.5 s). This change (AU reaction time) was 2.5 times slower (23.5 vs 9.4 s) in those admitted to ICU compared with those that were not.
Figure 1.

Time-series data using the frequency of action units (AUs) by admission or not to intensive care. AUs were measured in 100 windows of 47 frames each (equivalent to 1.88 s) starting from frame 70 until frame 4,770 in the video.
Figure 2.

Time-series data using the frequency of action units (AUs) by National Early Warning Score (NEWS) score. AUs were measured in 100 windows of 47 frames each (equivalent to 1.88 s) starting from frame 70 until frame 4,770 in the video.
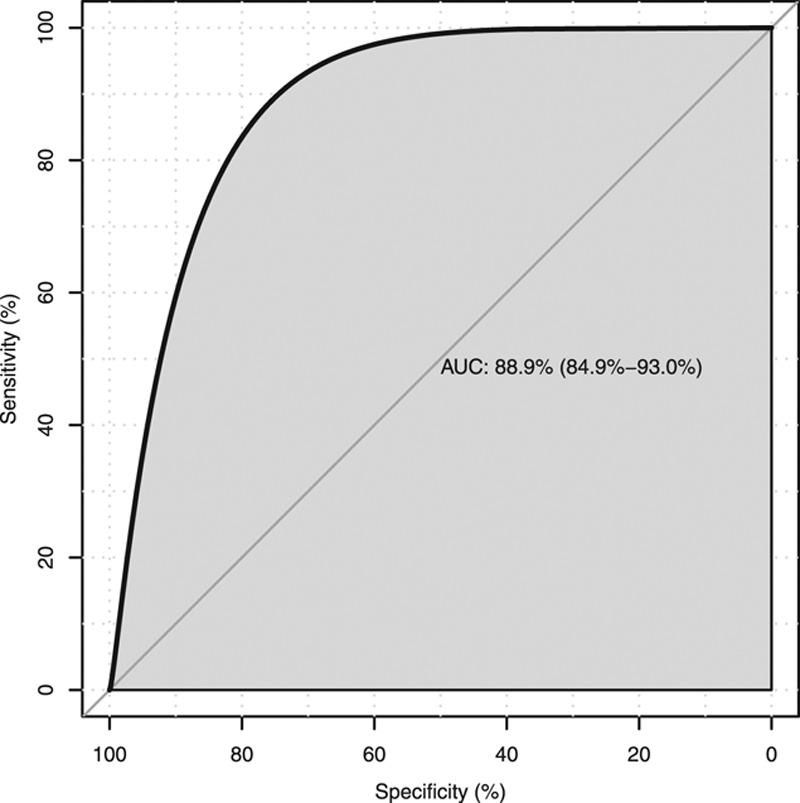
A logistic regression to determine if the number of AU identified per window in the time-series analysis was able to predict admission to intensive care is displayed in Figure 3. The area under the curve (AUC) for the ROC was 0.88 (95% CI, 0.84–0.93).
Figure 3.

Receiver operating characteristic curve to determine if the number of action units identified per window in the time-series analysis was able to predict admission to intensive care. AUC = area under the curve.
Supplemental Table 6 (Supplemental Digital Content 7, http://links.lww.com/CCX/A170) shows the frequency, repertoire, the Shannon information entropy and diversity by admission to ICU, NEWS score, sex, presence of sepsis and outcome. Patients who were ultimately admitted to ICU had a higher Shannon information entropy value than those not admitted (0.30 ± 0.06 vs 0.26 ± 0.05; p = 0.019). Higher Shannon and diversity coefficients were also associated with death at hospital discharge (Supplemental Table 6, Supplemental Digital Content 7, http://links.lww.com/CCX/A170).
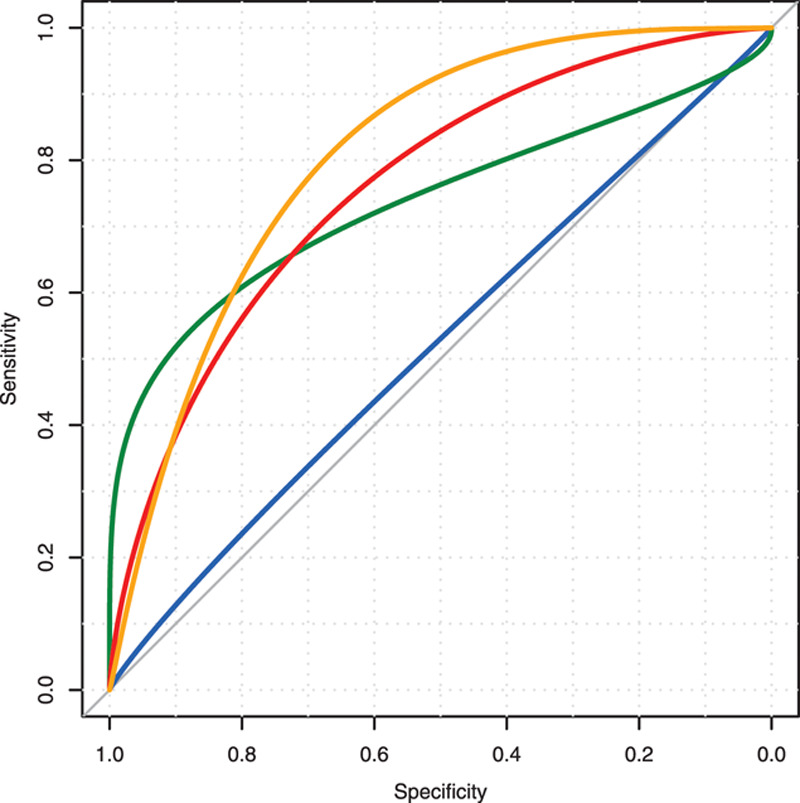
A logistic regression to determine if Hn and Dn were able to predict admission to ICU over and above the NEWS score is presented in Figure 4. The AUC for NEWS alone, Hn alone, NEWS plus Hn and, finally, NEWS plus Hn plus Dn were 0.53, 0.75, 0.76, and 0.8, respectively.
Figure 4.

Receiver operating characteristic curves for predicting admission to intensive care. Blue = National Early Warning Score (NEWS) alone, green = entropy (Hn) alone, red = NEWS plus Hn, and orange = NEWS plus Hn plus diversity (Dn).
DISCUSSION
In the present study, we found that deteriorating ward patients who required admission to intensive care displayed a reduced frequency rate and a higher Shannon information entropy in their facial expressions than patients not admitted to ICU. Time duration variables of AUs did not predict admission to ICU independently, but their duration and reaction time were prolonged in patients who were admitted.
Our findings are consistent with our prior research (1), where a set of combined AU increased the predictive power of the NEWS score for ICU admission. We did not determine AU duration in our previous work. Our current study has shown that not only the type of AU but also frequency over time and the associated Shannon information entropy may be a useful tool in predicting ICU admission.
Time is an important parameter and was identified early on within experimental psychology (10). Vital signs are measured in relation to time, for example, breaths per minute or heart beats per minute. Therefore, it is unsurprising that AU frequency per unit of time may predict outcome. Reaction time is a construct that may inform understanding of some body conditions, including external (type and strength of stimulus) and internal factors (11). We followed this approach to consider AU within the context of critical illness (2). AU duration may be related to both the stimulus and the body’s response to the external stressor, in this case, clinical deterioration. Of note, we found the frequency of these AU over a short period of time using time-series analysis was enough to classify patients as being at risk of critical care admission. In other words, time is dilated in facial expressions in such patients (Supplemental Table 2, Supplemental Digital Content 3, http://links.lww.com/CCX/A166) and, consequently, AU frequency decreases (Fig. 1). This situation is in accord with current models of clinical deterioration, particularly the hibernation hypothesis which states that an organism submitted to a stressful overload will develop a host response that expresses an ancient phenotype of organ preservation (2). This phenotype will slow down reactions within the whole body. The CNS will be affected with facial expressions that are prolonged in time and decreased in frequency, with the aim of saving vital energy for perhaps more important body systems.
Hibernation was only recently described in primates, particularly in lemurs (12). It is likely that ancient mammals were selectively developing under evolutionary pressures, a survival strategy to conserve energy in unfavorable conditions (12). This ancient phenotype has persisted in many mammals and some primates. Humans may express this phenotype only in extreme conditions such as critical illness (2). Torpor (12), a light form of hibernation, could be the initial response in facial expressions, producing an increased AU duration and a decrease in frequency.
The diversity of expression index (repertoire weighted by the rate of use for each type of facial expression) (7) was higher in patients who died (Supplemental Table 6, Supplemental Digital Content 7, http://links.lww.com/CCX/A170), in other words, patients who died had more different types of facial expressions and more uniformly distributed.
The main limitation of our study is the limited number of patients studied (34 patients) and the lack of a control group. We limited our study to facial expressions though other channels such as voice and posture may offer further predictive information of clinical deterioration (13). Medicine has traditionally concentrated on information coming from the autonomic nervous system such as heart rate, respiratory rate, blood pressure, oxygen saturation, temperature, and conscious level. Scarce attention has been paid to other channels such as facial expression, voice, or posture though medical decisions routinely utilize multiple channels of information (14). Finally, the trained psychologist performing the FACS coding was blinded to the patient outcome; however, there were no inter-rater reliability methods for the single coder.
To our knowledge, our study is the most comprehensive research performed to date on facial expressions in deteriorating patients in a hospital environment. It supports our and others’ research (1, 14, 15) that the face is an important marker for advertising clinical deterioration.
CONCLUSIONS
Patients who will be admitted to intensive care have a decrease in the number of facial expressions per unit of time and an increase in their diversity.
Supplementary Material
Footnotes
Supplemental digital content is available for this article. Direct URL citations appear in the HTML and PDF versions of this article on the journal’s website (http://journals.lww.com/ccejournal).
The authors have disclosed that they do not have any potential conflicts of interest.
REFERENCES
- 1.Madrigal-Garcia MI, Rodrigues M, Shenfield A, et al. What faces reveal: A novel method to identify patients at risk of deterioration using facial expressions. Crit Care Med. 2018; 46:1057–1062 [DOI] [PubMed] [Google Scholar]
- 2.Cuesta JM, Singer M. The stress response and critical illness: A review. Crit Care Med. 2012; 40:3283–3289 [DOI] [PubMed] [Google Scholar]
- 3.Lynn LA. Artificial intelligence systems for complex decision-making in acute medicine: A review. Pat Saf Surgery. 2019; 13:6. [DOI] [PMC free article] [PubMed] [Google Scholar]
- 4.Boregowda S, Handy R, Sleeth D, et al. Measuring entropy change in a human physiology system. J Thermodyn. 20162016:4932710 [Google Scholar]
- 5.Imhoff M, Bauer M, Gather U, et al. Statistical pattern detection in univariate time series of intensive care on-line monitoring data. Intensive Care Med. 1998; 24:1305–1314 [DOI] [PubMed] [Google Scholar]
- 6.Bradley B, Green GC, Batkin I, et al. Feasibility of continuous multiorgan variability analysis in the intensive care unit. J Crit Care. 2012; 27:218.e9–e20 [DOI] [PubMed] [Google Scholar]
- 7.Scheider L, Liebal K, Oña L, et al. A comparison of facial expression properties in five hylobatid species. Am J Primatol. 2014; 76:618–628 [DOI] [PubMed] [Google Scholar]
- 8.Ekman P, Friesen W, Hager J. Facial Action Coding System: The Manual. 2002, Salt Lake City, UT: Nexus Division of Network Information Research Corporation [Google Scholar]
- 9.Ekman P, Friesen W, Hager J. Facial Action Coding System: Investigator’s Guide. 2002, Salt Lake City, UT: Nexus Division of Network Information Research Corporation [Google Scholar]
- 10.Woodworth RS, Schlosberg H. Experimental Psychology. 1938, New York, NY: Holt, Rinehart and Winston [Google Scholar]
- 11.Dausmann KH, Warnecke L. Primate Torpor expression: Ghost of the climatic past. Physiology (Bethesda). 2016; 31:398–408 [DOI] [PubMed] [Google Scholar]
- 12.Archer D, Lansley C. Public appeals, news interviews and crocodile tears: An argument for multi-channel analysis. Corpora. 2015; 10:231–258 [Google Scholar]
- 13.Boyd EA, Lo B, Evans LR, et al. “It’s not just what the doctor tells me:” Factors that influence surrogate decision-makers’ perceptions of prognosis. Crit Care Med. 2010; 38:1270–1275 [DOI] [PMC free article] [PubMed] [Google Scholar]
- 14.Axelsson J, Sundelin T, Olsson MJ, et al. Identification of acutely sick people and facial cues of sickness. Proc R Soc B. 2018; 285:20172430. [DOI] [PMC free article] [PubMed] [Google Scholar]
- 15.Davoudi A, Malhotra KR, Shickel B, et al. Intelligent ICU for autonomous patient monitoring using pervasive sensing and deep learning. Sci Rep. 2019; 9:8020. [DOI] [PMC free article] [PubMed] [Google Scholar]
Associated Data
This section collects any data citations, data availability statements, or supplementary materials included in this article.


