

Abstract
Multiple phylogenetic studies of HIV in sub-Saharan Africa (SSA) have shown that mobility-driven transmission frequently occurs: many communities “export” and “import” strains. Mobility-driven transmission can result in source-sink dynamics: one community can sustain a micro-epidemic in another community where transmission is too low to be self-sustaining. In epidemiology, the Basic Reproduction Number () is used to specify the sustainability threshold. represents the average number of secondary infections generated by one infected individual in a community where everyone is susceptible. If is greater than one, transmission is high enough to sustain an epidemic; if is less than one, it is not. Here, we discuss the conditions that are needed (in terms of ) for source-sink transmission dynamics to occur in generalized HIV epidemics in SSA, present an example of where these conditions may occur (specifically, we use Namibia), and discuss the necessity of taking mobility-driven transmission into consideration when designing control strategies. Additionally, we discuss the need for a new generation of HIV transmission models that are more realistic than the current models. The new models should reflect, not only geographic variation in epidemiology and demography, but also the spatial-temporal complexity of population-level movement patterns.
Introduction:
The HIV pandemic is concentrated in sub-Saharan Africa (SSA), where ~25·5 million people are living with HIV (PLHIV).1 In countries in this region, HIV epidemics are driven by heterosexual transmission and generalized: populations are predominantly rural and highly mobile. When populations are mobile, transmission networks can be extremely complex. Individuals can become infected in their own communities by other residents, in their own communities by visitors from other communities, or during visits to other communities. Multiple phylogenetic studies of HIV in SSA have shown that communities “export” and “import” strains, demonstrating that mobility-driven transmission frequently occurs.2–4 This type of transmission could potentially result in source-sink dynamics:5 i.e., in a community sustaining a micro-epidemic in another community where transmission is too low to be self-sustaining. In epidemiology, the Basic Reproduction Number () is used to specify the sustainability threshold.6 is defined as the average number of secondary infections generated by one infected individual (over their lifetime) in a community where all individuals are susceptible. If is greater than one, transmission is high enough to sustain an epidemic; if is less than one, it is not. Here, we discuss the conditions that are needed (in terms of ) for source-sink transmission dynamics to occur in generalized HIV epidemics in SSA, present an example of where these conditions may occur, and discuss the necessity of taking mobility-driven transmission into consideration when designing HIV control strategies. To do so, we present a simple mathematical framework for modeling generalized epidemics in SSA: this is the first HIV model that includes mobility-driven transmission, allows viral introductions to occur, and is capable of demonstrating the occurrence of source-sink dynamics.
The term source-sink dynamics, was first used in the 1980’s in the context of an ecological theory to explain how a species can persist in places where the population growth rate is negative.5The theory was described by quantitatively defining demographic sources and sinks. The environment was assumed to consist of patches that differed in their quality to support population growth, and the species to be capable of dispersing. In a patch that functions as a source the birth rate is greater than the death rate, in a patch that functions as a sink the death rate is greater than the birth rate. By framing the theory in mathematical terms, it was shown that, under certain conditions, a source could maintain the persistence of the species in a demographic sink. The conditions were shown to depend upon four factors: the population growth rates in the source and the sink, the relative size of the source and sink, and the dispersal rate. The theory has been used to understand the geographic range of a variety of species, from butterflies7 to giraffes.8
In 2004, Smith and colleagues introduced the concept of source-sink dynamics to the field of modeling the transmission dynamics of infectious diseases.9 They used the concept to understand, and to predict, the regional spread of hospital-acquired infections. In their model a source is defined as a hospital that can sustain transmission of the infection, and a sink is a hospital that cannot. More recently, mathematical models that include source-sink transmission dynamics have been used to understand the spatial epidemiology of malaria,10–12 polio,13 and plague.14 These multi-patch models are often referred to as meta-population models.
The Classic Model:
In the classic model of HIV transmission dynamics only a single community is considered;6 the equations that specify this model are given in the appendix (p 1). Standard methods15 can be used to analyze the model and derive an expression for .
where β is the average probability of transmission per partnership, c the average rate of acquisition of sex partners, μ the per capita background death rate, and σ the per capita death rate due to AIDS.
If > 1, the level of sexual activity within the community is high enough to sustain transmission, hence a micro-epidemic (i.e., a community-level epidemic) can occur.6 If < 1, the level of sexual activity within the community is too low to sustain transmission, hence a micro-epidemic cannot occur.
The Mobility Model:
The classic model of the sexual transmission of HIV can straightforwardly be extended to include two connected communities that are linked by mobility; the equations that specify this new model (that we subsequently refer to as the mobility model), are given in the appendix (p 1). The for the mobility model (that we subsequently refer to as the mobility-linked ) was derived using standard methods15 (appendix, p 2). The mobility-linked is defined as the average number of secondary HIV infections that one infected individual generates (over their lifetime) in a susceptible population with two linked communities.
The structure of the mobility model reflects results from phylogenetic studies of HIV in SSA that have shown that viral introductions frequently occur within communities that are linked by individuals moving between them.2–4 In addition, the structure reflects the results from multiple epidemiological studies that have shown that individuals spend a great deal of time outside their home communities, and acquire HIV infection when away from home.16–18
In the mobility model, residents of each community spend a certain proportion of their time in the other community. Therefore, there are three pathways by which sexual transmission can occur: (1) an individual can acquire HIV in their home community from another resident of their home community (localized transmission), (2) an individual can acquire HIV in their home community from a visitor from another community (visitor transmission), and (3) an individual can acquire HIV in a community that they visit (external-community transmission). Viral introductions can occur due to visitor transmission or external-community transmission.
Each community can function as a source or a sink. A community is a source if, when unlinked, the frequency and patterns of sexual contacts within the community are enough to sustain transmission in that community: i.e., the in the unlinked source is greater than one. A community is a sink if, when unlinked, the sexual contacts within the community cannot sustain transmission in that community: i.e., the in the unlinked sink is less than one. The mathematical expression for the for the source or the sink, when unlinked, is the same as for the classic model.
The mathematical expression for the mobility-linked is complex (appendix p 2). This is because it reflects three possible transmission pathways that occur within each community, or between the two communities, A and B: i.e., localized transmission can occur in community A, localized transmission can occur in community B, visitor transmission can occur if a resident of A (who is a PLHIV) visits community B, visitor transmission can occur if a resident of B (who is a PLHIV) visits community A, external-community transmission can occur if a resident of A acquires HIV infection when visiting community B, and external-community transmission can occur if a resident of B acquires infection when visiting community A.
If the mobility-linked is greater than one, the overall level of sexual transmission is high enough to sustain micro-epidemics in both communities. If the mobility-linked is less than one, the overall level of sexual transmission is too low to sustain a micro-epidemic in either community. In this case, due to mobility, the source is no longer able to sustain a micro-epidemic in its’ own community because its’ residents spend some of their time in the sink community.
Conditions for Sources and Sinks:
We propose that two conditions are needed for source-sink transmission dynamics to occur in generalized HIV epidemics in SSA: substantial geographic heterogeneity in HIV prevalence and a highly mobile population that connects high-prevalence and low-prevalence areas.
Multiple geospatial mapping studies have shown that there is considerable geographic variation in HIV prevalence in countries in SSA.19–24 These studies have used georeferenced HIV-testing data collected in Demographic and Health Surveys,25 to construct Epidemic Surface prevalence (ESP) maps.23 Figure 1A shows, as an example, the ESP map for Namibia. The map was constructed using HIV-testing data from 9,309 individuals (15—64 years old) who participated in the 2013 Namibian Demographic and Health Survey.28 The average prevalence in Namibia is 14%, but the ESP map shows that it varies geographically from 0% to 32%. Notably, there is considerable variation in prevalence within some of the 13 regions of Namibia (regions are delimited by thin black lines in Figure 1A); however, at a smaller scale (i.e., within constituencies) there is very little variation. On a temporal scale, HIV prevalence in Namibia has remained stable for several years; this is because incidence, and AIDS mortality, rates are fairly low.
Figure 1: HIV prevalence map and mobility network for Namibia.
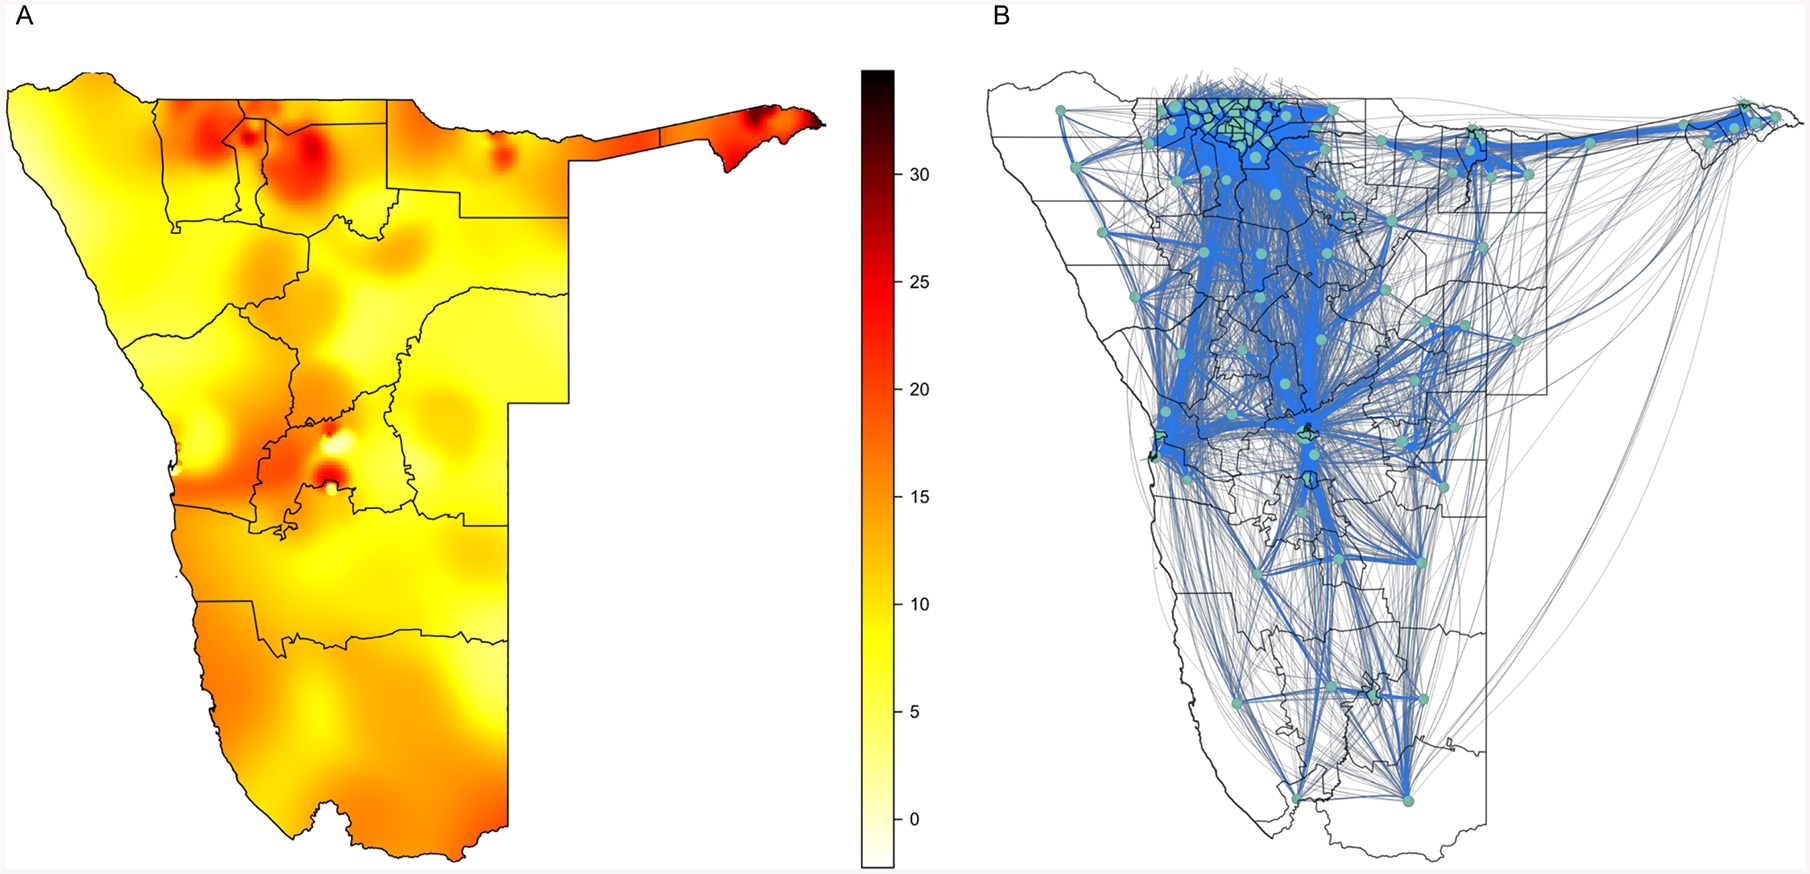
(A) ESP map, the color scale indicates HIV prevalence (%) in 15—64 year olds. The map was constructed by using an adaptive bandwidth kernel density estimation method26 to smooth and spatially interpolate the HIV-testing data from the NDHS; the R programming package prevR was used for implementation.27 (B) Network constructed from the CDR dataset.
It is well known that population mobility is very high throughout SSA.17,18 However to determine whether individuals move between high-prevalence and low-prevalence areas, it is necessary to identify population-level movement patterns. These patterns can be identified by analyzing large datasets of Call Detail Records (CDRs) collected from mobile phones. The availability of this new type of data has transformed the study of infectious diseases.29 CDR datasets have been used to identify population-level movement patterns in several African countries: Kenya,30 Senegal,31,32 the Ivory Coast,33 and Namibia.11 The CDR dataset for Namibia was collected between October 2010 and September 2011, and is based on nine billion calls/texts from 1·19 million unique SIM cards. Data were collected from ~90% of cell phone subscribers in Namibia. Population-level movement patterns in Namibia have been shown to be fairly similar from year to year, over a four-year time period.34
The Namibian data were used by Ruktanonchai and colleagues11 to construct a mobility network, shown in figure 1B, that they used to study the transmission dynamics of malaria. In the network, nodes (circles) represent constituencies and blue lines show the mobility-links between pairs of constituencies: 96 of the 106 constituencies in Namibia are included in the network, the remaining 10 do not contain cell phone towers. The thickness of the blue lines indicates the fraction of time spent, over a year, by the average resident of one constituency in the linked constituency. The data reveal that residents of Namibia spend (over a twelve-month time span) ~22% (median, Interquartile range (IQR): 18—26%) of time outside their home constituency. Notably, a visual comparison of the mobility network in figure 1B with the ESP map in figure 1A suggests that the movement patterns in Namibia may result in some strong linkages between constituencies where the prevalence of HIV is high and constituencies where the prevalence is low.
An Example:
To see whether it is possible that source-sink transmission dynamics could occur in SSA, we used Namibia as an example, and calculated values for the mobility-linked for the case of two communities connected by mobility. To make these calculations, we assumed that: (i) one community was a transmission source and the other a transmission sink, and (ii) an infected resident, in the sink community (when the sink is not connected to the source), could only cause (on average) between 0·50 to 0·95 secondary infections, over their lifetime. We then conducted an uncertainty analysis35–37 in order to calculate the potential values, given these assumptions, for a mobility-linked in Namibia. We used Latin Hypercube Sampling and specified parameter ranges to reflect the geographic variation in HIV prevalence shown in figure 1A, and the variation in time spent by individuals outside their home community, which was based on the mobile phone data; ranges are given in the appendix (p 2).
To conduct the uncertainty analysis we calculated 10,000 values of the mobility-linked . These values are shown in the form of a histogram in figure 2A; the median value is 1·08, with an IQR of 1·01—1·15. The light blue data in figure 2A show the values of the mobility-linked that are greater than one, the green data show the values that are less than one. Notably, ~80% of the values are greater than one. This signifies that many communities in Namibia are capable of functioning as a transmission source and sustaining an HIV micro-epidemic in a transmission sink. However, this analysis does not demonstrate that transmission sinks exist in Namibia.
Figure 2: Source-sink transmission dynamics in Namibia.
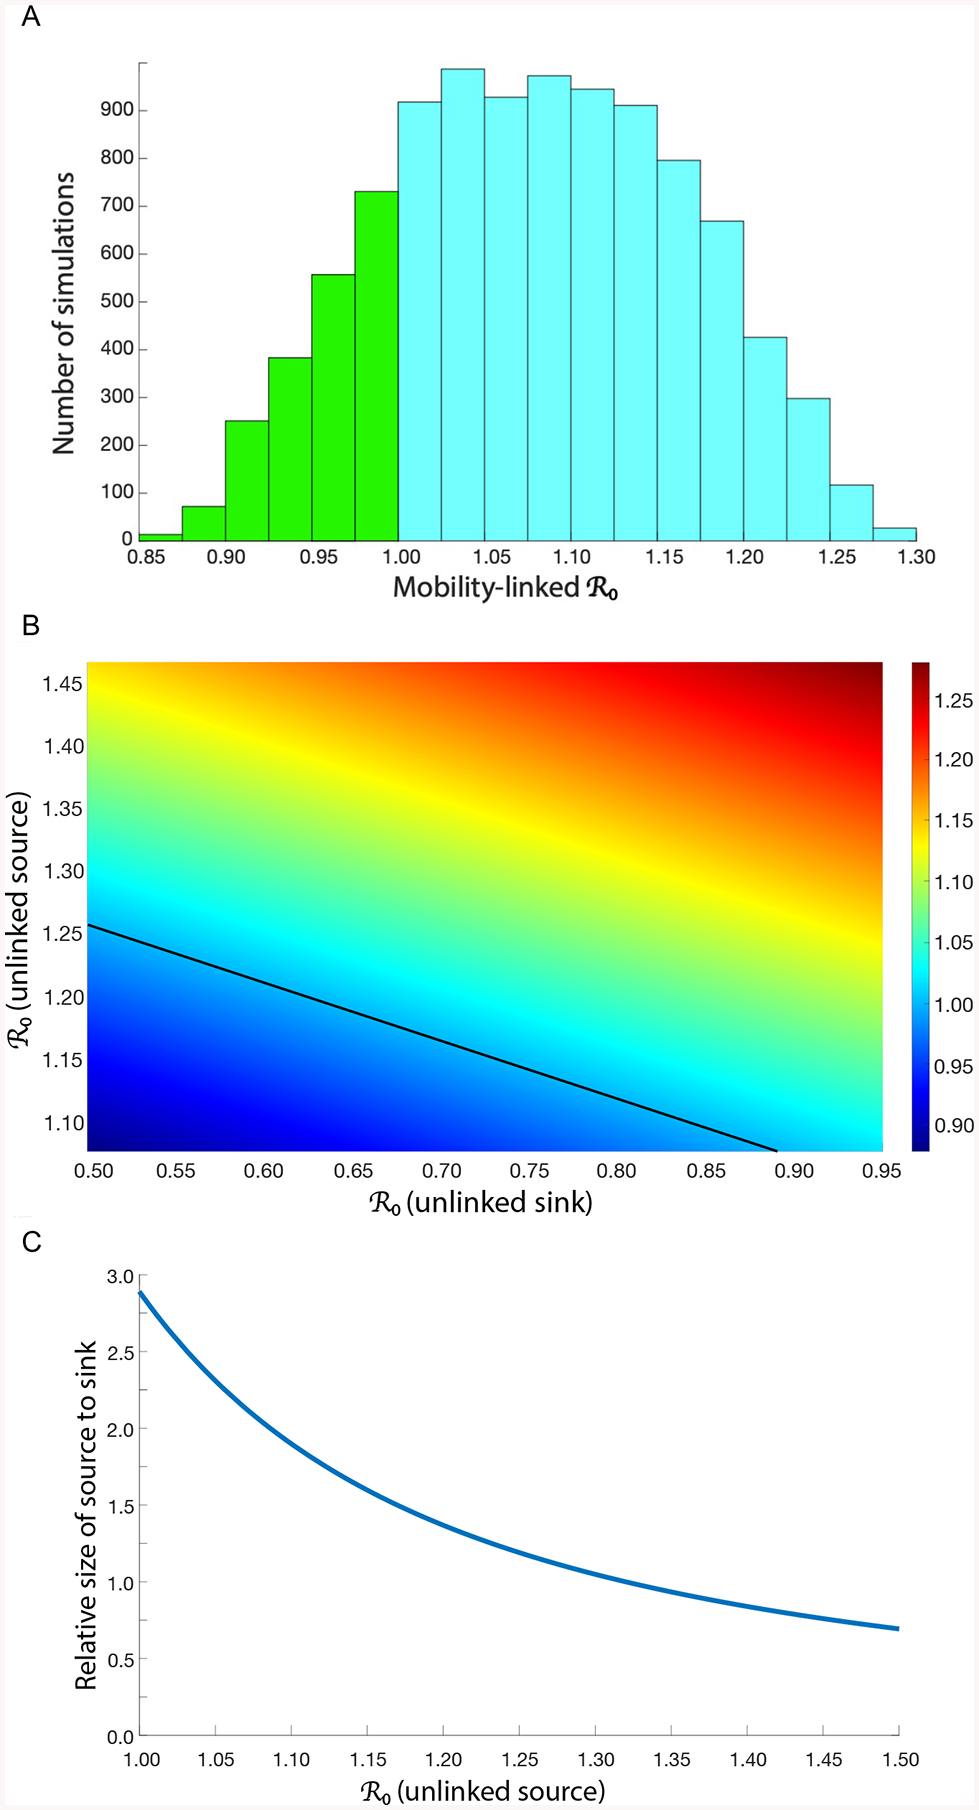
(A) Results from the uncertainty analysis, frequency distribution of 10,000 values of the mobility-linked (B) Response hypersurface showing the outcome of linking a source to a sink. The source is 1·25 times the size of the sink. Black line shows the sustainability threshold at which the mobility-linked equals one; at this threshold, a source can sustain a micro-epidemic in a linked sink. (C) The graph shows the effect of the relative size of the source versus the sink on the sustainability threshold; the blue line shows the threshold. The y-axis shows the relative size: the source is larger than the sink when the ratio is above one, the sink is larger than the source when the ratio is below one. The in the unlinked sink is 0·50.
We used the results of the uncertainty analysis to determine the possible epidemiological outcomes of linking a source to a sink. To make this determination we plotted the 10,000 values of the mobility-linked in the form of a response hypersurface,38 shown in figure 2B: the mobility-linked is the response variable. The y-axis shows the for a source (when it is not linked to a sink), the x-axis shows the for a sink (when it is not linked to a source). The black line shows the sustainability threshold: the threshold at which the mobility-linked equals one. Above the threshold, the mobility-linked is greater than one and the source can sustain a micro-epidemic in the sink. Below the threshold, the mobility-linked is less than one and sustainability is not possible in either the source or the sink. Figure 2A shows that some sources can sustain micro-epidemics in sinks where transmission is extremely low. For example, a source with an (when unlinked) of ~1·25 (which is equivalent to an HIV prevalence of ~20%) can sustain a micro-epidemic in a sink where a resident (on average) only generates 0·50 secondary infections.
Whether, or not, a source is able to sustain a micro-epidemic in a sink also depends upon the relative size of the source in comparison to the sink; size is defined as the number of individuals living in the community. The larger the source than the sink, the easier it is for the source to sustain a micro-epidemic in the sink, figure 2C. The blue line shows the threshold at which the mobility-linked equals one, the source cannot sustain a micro-epidemic below this threshold. Whether, or not, a source can sustain a micro-epidemic in a sink also depends upon the time spent in each community: the more time residents of the source spend in the sink, the harder it is for the source to sustain a micro-epidemic in the sink.
Data Quality:
Modeling is never based on perfect data. All published HIV (and TB/HIV) models have problems with data quality, representativeness, and granularity. For example, data on sexual behavior are notoriously inaccurate and unreliable, there are no complete (or even partially complete) datasets for specifying countrywide sexual mixing patterns. Notably, for TB even the basic transmission probabilities and other biological parameters that reflect the natural history of the disease are unknown and “guesstimates” are used. Because data are never perfect, modelers use uncertainty analyses35–37 when making predictions. In our modeling we have used an uncertainty analysis to predict the outcome of linking a transmission source to a transmission sink;35–37 this has enabled us to predict outcomes, even though the specific values of the mobility and epidemiological parameters are unknown. It has also enabled us to show that source-sink transmission dynamics can occur under a wide range of conditions.
Next-generation transmission models:
We believe that there is a need for a new generation of HIV (and HIV/TB) transmission models that are more realistic than the current models. The underlying structure of HIV (and HIV/TB) transmission models has remained the same for decades. Models have increased in complexity, but only in terms of modeling sexual behavior. These complex models39,40 can give a misleading sense of certainty and are often more imprecise than simpler models. This is because they are based on multiple assumptions (many of which are unverifiable), and often require data for parameterization that do not exist. Notably, current HIV transmission models are based on the assumptions, that: (i) individuals are immobile, (ii) only localized transmission can occur, and (iii) viral introductions are not possible. Clearly, these assumptions are unrealistic; they go against all of the evidence shown by the multiple phylogenetic studies and epidemiological studies that have been conducted in SSA. As a consequence, current HIV (and HIV/TB) models do not provide an adequate representation of generalized HIV epidemics in SSA.
We believe that it is essential to develop a new generation of HIV transmission models that allow for countrywide “spatial mixing”. These models should include mobility-driven transmission and allow for the occurrence of source-sink dynamics. They should be data-intensive and reflect, not only geographic variation in prevalence, but geospatial heterogeneity in demography23 and the spatial-temporal complexity of population-level movement patterns. The mobility model, presented in this paper, could be used as a foundation for building more realistic models. These more realistic models would result in more accurate predictions and enable the design of more cost-effective control strategies for HIV epidemics in SSA.
Real-World Implications:
The results from phylogenetic,2–4 and epidemiological,16–18 studies of HIV in SSA have shown that strain exportation and importation occurs, and that mobility-driven transmission is important. However, to date, no phylogenetic or epidemiologically study of HIV in SSA has demonstrated that source-sink dynamics exist. We propose that, in SSA, source-sink dynamics may be occurring in areas where urban centers are tightly connected, by mobility-linked transmission, to rural communities. In this case, urban centers would function as transmission sources and rural communities as transmission sinks. The necessary conditions for source-sink dynamics exist in many places in SSA: HIV prevalence in urban centers is often substantially greater than in surrounding rural areas,21 and there is frequent urban-rural and rural-urban travel.18 However, the mobility networks that link communities are extremely complex and therefore transmission sources and sinks will be very hard to identify. We suggest that the methodologies30,41 that have been developed to identify sources and sinks for malaria transmission in SSA should be used to identify sources and sinks (if they exist) within generalized HIV epidemics in SSA.
In order to design cost-effective HIV control strategies for SSA, it is essential to understand the transmission dynamics of generalized epidemics. The current global health policy for controlling HIV is to use geographic and behavioral targeting:42–44 specifically, to target highly sexually active individuals living in high-prevalence areas that are defined as “Hot-Spots”. Results from mathematical models have shown that this type of targeting would be the most cost-effective strategy for controlling HIV.39,40 However, we believe that the cost-effectiveness of targeting Hot-Spots should be re-evaluated using more realistic transmission models that consist of multiple communities connected by a mobility network: such models will have multiple Hot-Spots. We predict that Hot-Spot targeting will be cost-effective for reducing transmission in some of the Hot-Spots, but not in others. For example, “treatment as prevention”45 could be cost-effective in Hot-Spots where incidence is mainly due to localized transmission, but not in Hot-Spots where a high proportion of new infections are due to mobility-driven transmission. We recommend that, in order to identify cost-effective strategies, both localized transmission and mobility-driven transmission need to be taken into consideration.
Designing and implementing new HIV prevention strategies that take into account mobility will be extremely challenging. One such approach, that is a current focus of our research, is to integrate mobility and prevalence data in order to construct country-level gender-specific risk networks. These networks can be used to determine, for each community in the country, whether it exports or imports risk. A community exports risk if their residents have the potential to infect residents of other communities, a community imports risk if their residents can potentially be infected by residents of other communities. The risk networks could be used to design and implement prevention strategies. The communities that are the most important exporters of risk, and those that are the most vulnerable to the importation of risk, are the communities that should be targeted. Notably, the communities that are the most important exporters of risk may not be those with the highest prevalence of HIV. High levels of mobility are proving to be a substantial obstacle to the global attempt to eliminate malaria;46 it is possible that they will also be a substantial obstacle to the global attempt to eliminate HIV.
Supplementary Material
Acknowledgements
The authors are grateful to Carlos Castillo-Chavez for discussions and to the National Institute of Health (R01 AI116493) for financial support.
Footnotes
Declaration of interests
The authors declare that they have no conflicts of interest.
References
- 1.UNAIDS. AIDS by the numbers. Geneva, Switzerland: UNAIDS, 2016. [Google Scholar]
- 2.Grabowski MK, Lessler J, Redd AD, et al. The role of viral introductions in sustaining community-based HIV epidemics in rural Uganda: evidence from spatial clustering, phylogenetics, and egocentric transmission models. PLoS Med 2014; 11(3): e1001610. [DOI] [PMC free article] [PubMed] [Google Scholar]
- 3.Kiwuwa-Muyingo S, Nazziwa J, Ssemwanga D, et al. HIV-1 transmission networks in high risk fishing communities on the shores of Lake Victoria in Uganda: a phylogenetic and epidemiological approach. PLoS ONE 2017; 12(10): e0185818. [DOI] [PMC free article] [PubMed] [Google Scholar]
- 4.Abeler-Dorner L, Grabowski MK, Rambaut A, Pillay D, Fraser C. PANGEA-HIV 2: Phylogenetics and networks for generalised epidemics in Africa. Curr Opin HIV AIDS 2019; 14(3): 173–80. [DOI] [PMC free article] [PubMed] [Google Scholar]
- 5.Pulliam H . Sources, sinks and population regulation. Am Nat 1988; 132(5): 652–61. [Google Scholar]
- 6.Anderson R, May R. Infectious Diseases of Humans: Dynamics and Control. Oxford: Oxford University Press; 1991. [Google Scholar]
- 7.Boughton DA. Empirical evidence for complex source–sink dynamics with alternative states in a butterfly metapopulation. Ecology 1999; 80(8): 2727–39. [Google Scholar]
- 8.Lee DE, Bolger DT. Movements and source–sink dynamics of a Masai giraffe metapopulation. Popul Ecol 2017; 59(2): 157–68. [Google Scholar]
- 9.Smith DL, Dushoff J, Perencevich EN, Harris AD, Levin SA. Persistent colonization and the spread of antibiotic resistance in nosocomial pathogens: resistance is a regional problem. Proc Natl Acad Sci USA 2004; 101(10): 3709–14. [DOI] [PMC free article] [PubMed] [Google Scholar]
- 10.Prosper O, Ruktanonchai N, Martcheva M. Assessing the role of spatial heterogeneity and human movement in malaria dynamics and control. J Theor Biol 2012; 303: 1–14. [DOI] [PubMed] [Google Scholar]
- 11.Ruktanonchai NW, DeLeenheer P, Tatem AJ, Alegana VA, Caughlin TT, Zu Erbach-Schoenberg E, Lourenco C, Ruktanonchai CW, Smith DL. Identifying malaria transmission foci for elimination using human mobility data. PLoS Comput Biol 2016; 12(4): e1004846. [DOI] [PMC free article] [PubMed] [Google Scholar]
- 12.Ruktanonchai NW, Smith DL, De Leenheer P. Parasite sources and sinks in a patched Ross-Macdonald malaria model with human and mosquito movement: implications for control. Math Biosci 2016; 279: 90–101. [DOI] [PubMed] [Google Scholar]
- 13.Martinez-Bakker M, King AA, Rohani P. Unraveling the transmission ecology of polio. PLoS Biol 2015; 13(6): e1002172. [DOI] [PMC free article] [PubMed] [Google Scholar]
- 14.Zeppelini CG, de Almeida AM, Cordeiro-Estrela P. Zoonoses as ecological entities: a case review of Plague. PLoS Negl Trop Dis 2016; 10(10): e0004949. [DOI] [PMC free article] [PubMed] [Google Scholar]
- 15.Van den Driessche P, Watmough J. Reproduction numbers and subthreshold endemic equilibria for compartmental models of disease transmission. Math Biosci 2002; 180: 29–48. [DOI] [PubMed] [Google Scholar]
- 16.Dobra A, Bärnighausen T, Vandormael A, Tanser F. Space-time migration patterns and risk of HIV acquisition in rural South Africa. AIDS 2017; 31(1):137–45. [DOI] [PMC free article] [PubMed] [Google Scholar]
- 17.Palk L, Blower S. Mobility and circular migration in Lesotho: implications for transmission, treatment, and control of a severe HIV epidemic. J Acquir Immune Defic Syndr 2015; 68(5): 604–8. [DOI] [PMC free article] [PubMed] [Google Scholar]
- 18.Dzomba A, Tomita A, Govender K, Tanser F. Effects of migration on risky sexual behavior and HIV acquisition in South Africa: A systematic review and meta-analysis, 2000–2017. AIDS Behav 2019; 23(6): 1396–430. [DOI] [PubMed] [Google Scholar]
- 19.Cuadros DF, Li J, Branscum AJ, Akullian A, Jia P, Mziray EN, Tanser F. Mapping the spatial variability of HIV infection in Sub-Saharan Africa: Effective information for localized HIV prevention and control. Sci Rep 2017; 7(1): 9093. [DOI] [PMC free article] [PubMed] [Google Scholar]
- 20.Cuadros DF, Li J, Mukandavire Z, Musuka GN, Branscum AJ, Sartorius B, Mugurungi O, Tanser F. Towards UNAIDS Fast-Track goals: targeting priority geographic areas for HIV prevention and care in Zimbabwe. AIDS 2019; 33(2): 305–14. [DOI] [PubMed] [Google Scholar]
- 21.Dwyer-Lindgren L, Cork MA, Sligar A, et al. Mapping HIV prevalence in sub-Saharan Africa between 2000 and 2017. Nature 2019; 570(7760): 189–93. [DOI] [PMC free article] [PubMed] [Google Scholar]
- 22.Coburn BJ, Blower S. Mapping HIV epidemics in sub-Saharan Africa with use of GPS data. Lancet Glob Health 2013; 1(5): e251–3. [DOI] [PMC free article] [PubMed] [Google Scholar]
- 23.Coburn BJ, Okano JT, Blower S. Using geospatial mapping to design HIV elimination strategies for sub-Saharan Africa. Sci Transl Med 2017; 9(383). [DOI] [PMC free article] [PubMed] [Google Scholar]
- 24.Blower S, Okano JT. Precision public health and HIV in Africa. Lancet Inf Dis 2019; 19(10): 1050–52. [DOI] [PMC free article] [PubMed] [Google Scholar]
- 25.ICF. The DHS Program Spatial Data Repository. Funded by USAID. https://spatialdata.dhsprogram.com/ Accessed 25 June 2019.
- 26.Larmarange J, Vallo R, Yaro S, Msellati P, Meda N. Methods for mapping regional trends of HIV prevalence from Demographic and Health Surveys (DHS). Cybergeo Europ J Geo 2011; 558. [Google Scholar]
- 27.R Development Core Team. R: A language and environment for statistical computing. 2.15.3 ed. Vienna: R foundation for Statistical Computing; 2013. [Google Scholar]
- 28.The Namibia Ministry of Health and Social Services (MoHSS) and ICF International. The Namibia Demographic and Health Survey 2013. Windhoek, Namibia, and Rockville, Maryland, USA: MoHSS and ICF International, 2014. [Google Scholar]
- 29.Wesolowski A, Buckee CO, Engø-Monsen K, Metcalf CJE. Connecting mobility to infectious diseases: The promise and limits of mobile phone data. J Infect Dis 2016; 214(suppl_4):S414–S420 [DOI] [PMC free article] [PubMed] [Google Scholar]
- 30.Wesolowski A, Eagle N, Tatem AJ, Smith DL, Noor AM, Snow RW, Buckee CO. Quantifying the impact of human mobility on malaria. Science 2012; 338(6104): 267–70. [DOI] [PMC free article] [PubMed] [Google Scholar]
- 31.Finger F, Genolet T, Mari L, de Magny GC, Manga NM, Rinaldo A, Bertuzzo E. Mobile phone data highlights the role of mass gatherings in the spreading of cholera outbreaks. Proc Natl Acad Sci USA 2016; 113(23): 6421–6. [DOI] [PMC free article] [PubMed] [Google Scholar]
- 32.Mari L, Gatto M, Ciddio M, Dia ED, Sokolow SH, De Leo GA, Casagrandi R. Big-data-driven modeling unveils country-wide drivers of endemic schistosomiasis. Sci Rep 2017; 7(1): 489. [DOI] [PMC free article] [PubMed] [Google Scholar]
- 33.Lima A, De Domenico M, Pejovic V, Musolesi M. Disease containment strategies based on mobility and information dissemination. Sci Rep 2015; 5: 10650. [DOI] [PMC free article] [PubMed] [Google Scholar]
- 34.Wesolowski A, Zu Erbach-Schoenberg E, Tatem AJ, Lourenço C, Viboud C, Charu V, Eagle N, Engø-Monsen K, Qureshi T, Buckee CO, Metcalf CJE. Multinational patterns of seasonal asymmetry in human movement influence infectious disease dynamics. Nat Comm 2017; 8(1):2069. [DOI] [PMC free article] [PubMed] [Google Scholar]
- 35.Blower S, Dowlatabadi H. Sensitivity and uncertainty analysis of complex models of disease transmission: An HIV model, as an example. Int Stat Rev 1994; 62(2):229–243. [Google Scholar]
- 36.Blower S, Hartel D, Dowlatabadi H, Anderson RM, May RM. Drugs, sex and HIV: a mathematical model for New York City. Philos Trans R Soc Lond B 1991; 331(1260):171–87. [DOI] [PubMed] [Google Scholar]
- 37.Sanchez MA, Blower S. Uncertainty and sensitivity analysis of the basic reproductive rate. Tuberculosis as an example. Am J Epidemiol 1997; 145(12):1127–37. [DOI] [PubMed] [Google Scholar]
- 38.Supervie V, Garcia-Lerma JG, Heneine W, Blower S. HIV, transmitted drug resistance, and the paradox of preexposure prophylaxis. Proc Natl Acad Sci USA 2010; 107(27): 12381–6. [DOI] [PMC free article] [PubMed] [Google Scholar]
- 39.Anderson SJ, Cherutich P, Kilonzo N, Cremin I, Fecht D, Kimanga D, Harper M, Masha RL, Ngongo PB, Maina W, Dybul M, Hallett TB. Maximising the effect of combination HIV prevention through prioritisation of the people and places in greatest need: a modelling study. Lancet 2014; 384(9939): 249–56. [DOI] [PubMed] [Google Scholar]
- 40.Kerr CC, Stuart RM, Gray RT, Shattock AJ, Fraser-Hurt N, Benedikt C, Haacker M, Berdnikov M, Mahmood AM, Jaber SA, Gorgens M, Wilson DP. Optima: a model for HIV epidemic analysis, program prioritization, and resource optimization. J Acquir Immune Defic Syndr 2015; 69(3): 365–76. [DOI] [PubMed] [Google Scholar]
- 41.Ihantamalala FA, Herbreteau V, Rakotoarimanana FMJ, Rakotondramanga JM, Cauchemez S, Rahoilijaona B, Pennober G, Buckee CO, Rogier C, Metcalf CJE, Wesolowski A. Estimating sources and sinks of malaria parasites in Madagascar. Nat Commun 2018; 9(1): 3897. [DOI] [PMC free article] [PubMed] [Google Scholar]
- 42.UNAIDS. Location, location: connecting people faster to HIV services. UNAIDS; 2013. http://www.unaids.org/sites/default/files/media_asset/LocationLocation_en.pdf Accessed 25 June 2019. [Google Scholar]
- 43.UNAIDS. On the fast-track to ends AIDS by 2030: focus on location and population. UNAIDS; 2015. http://www.unaids.org/sites/default/files/media_asset/WAD2015_report_en_part01.pdf Accessed 25 June 2019. [Google Scholar]
- 44.UNAIDS. Strategy for 2016–2021: on the fast-track to end AIDS. UNAIDS; 2015. http://www.unaids.org/sites/default/files/media_asset/20151027_UNAIDS_PCB37_15_18_EN_rev1.pdf Accessed 25 June 2019. [Google Scholar]
- 45.Tanser F, Barnighausen T, Grapsa E, Zaidi J, Newell ML. High coverage of ART associated with decline in risk of HIV acquisition in rural KwaZulu-Natal, South Africa. Science 2013; 339(6122): 966–71. [DOI] [PMC free article] [PubMed] [Google Scholar]
- 46.Feachem RGA, Chen I, Akbari O, Bertozzi-Villa A, Bhatt S, Binka F, et al. Malaria eradication within a generation: ambitious, achievable, and necessary. Lancet; 395(10203):1056–112 [DOI] [PubMed] [Google Scholar]
Associated Data
This section collects any data citations, data availability statements, or supplementary materials included in this article.