. 2020 May 21;9:e50138. doi: 10.7554/eLife.50138

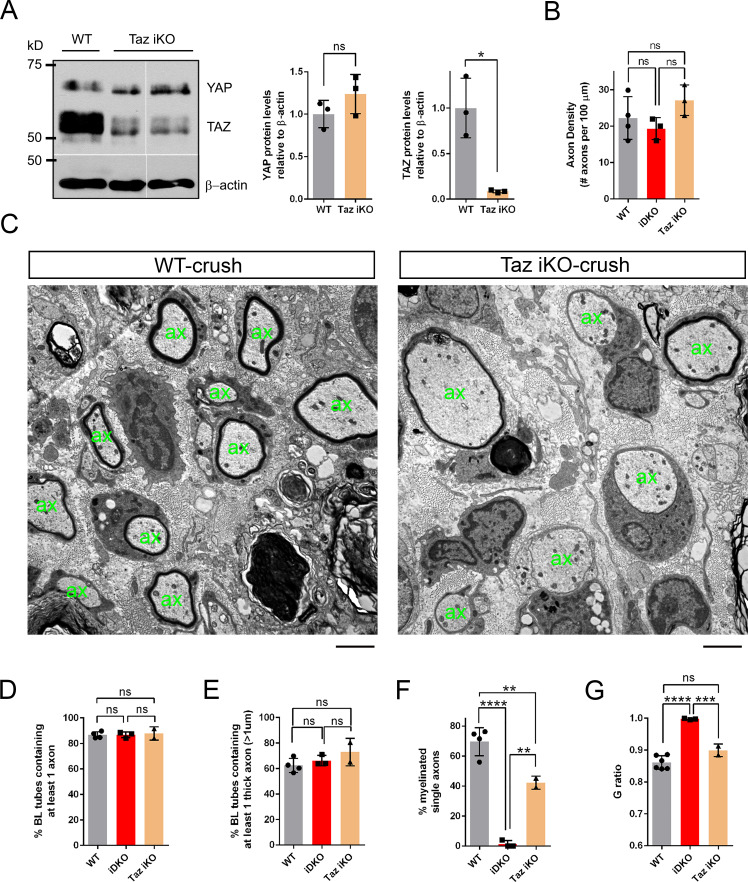
Figure 8. YAP and TAZ are redundantly required for optimal remyelination.

(A) Western blotting of intact sciatic nerve lysates, showing markedly reduced TAZ in Taz iKO, whereas YAP levels remain relatively unchanged. YAP band is tighter and faster migrating in Taz iKO, than in WT, indicative of reduced phosphorylation. Quantification of Yap and Taz in WT and Taz iKO, n = 3 mice per genotype. YAP: ns, not significant, p=0.2752, Mann-Whitney. TAZ: *p=0.0495, Mann-Whitney. (B) Quantification of axon density in WT, Yap/Taz iDKO and Taz iKO nerves at 12 dpi, 8–10 mm distal to crush site (also see Figure 5B,F and Figure 8—figure supplement 1B, (E). n = 4 mice for WT, three mice for iDKO and Taz iKO: WT vs iDKO, p=0.72; WT vs iKO, p=0.41; iDKO vs iKO, p=0.18, all not significant, one-way ANOVA with Tukey’s multiple comparison test. (C–G) Comparative analysis of axon regeneration and remyelination in WT and Taz iKO, 12–13 days after nerve crush. (C) Representative TEM images of WT and Taz iKO nerves, taken at 5 mm distal to the crush site, showing numerous axons that regenerated within basal lamina tubes in Taz iKO, as in WT. ‘ax’ denotes a single axon. Some large axons are myelinated in Taz iKO. (D) Quantification of the percentage of BL tubes containing axons of any diameter in WT, Taz iKO and Yap/Taz iDKO nerves. n = 4 mice for WT, three mice for iDKO and two mice for Taz iKO: WT vs. iDKO, p=0.99; WT vs. iKO, p=0.90; iDKO vs. Taz iKO, p=0.92, all not significant, one-way ANOVA with Tukey’s multiple comparison test. (E) Quantification of the percentage of BL tubes containing at least one axon larger than 1 μm in diameter in WT, Taz iKO and Yap/Taz iDKO nerves. n = 4 mice for WT, three mice for iDKO and two mice for Taz iKO: WT vs. iDKO, p=0.73; WT vs. iKO, p=0.22; iDKO vs. iKO, p=0.52, all not significant, one-way ANOVA with Tukey’s multiple comparison test. (F) Quantification of the percentage of single axons that are remyelinated in WT, Taz iKO and Yap/Taz iDKO nerves. n = 4 mice for WT, three mice for iDKO and two mice for Taz iKO: WT vs. iDKO, ****p<0.0001; WT vs. iKO, **p=0.0094; iDKO vs. Taz iKO, **p=0.0016, one-way ANOVA with Tukey’s multiple comparison test. (G) G-ratios of remyelinated axons in WT and Taz iKO nerves, compared to unmyelinated axons in Yap/Taz iDKO nerve. WT and Taz iKO remyelinated axons have equivalent G-ratios. n = 6 mice for WT, three mice for iDKO and two mice for iKO: WT vs. iDKO, ****p<0.0001; WT vs. iKO, not significant, p=0.074; iDKO vs. iKO, ***p=0.0008, one-way ANOVA with Tukey’s multiple comparison test. Scale bar = 2 μm (C).

Figure 8—source data 1. Source files for TEM data.
This zip archive contains the TEM images for one WT and one Taz iKO used for quantitative analysis shown in Figure 8D–G. Images were taken using a JEOL 1010 electron microscope fitted with a Hamamatsu digital camera and AMT Advantage image capture software. Contrast of the images was adjusted using Photoshop software.
Figure 8—source data 2. Source files for graphs quantifying Yap and Taz levels.
This zip archive contains the raw data for WT and iDKO used for the quantitative analysis shown in Figure 8A. The data are contained in both a text document and an Excel file, both labeled as Mann Whitney data. These files also contain data for Figure 3—figure supplement 1, Figures 3, 4, 6, 7, 8, Figure 8—figure supplement 1E.
Figure 8—source data 3. Source files for graphs quantifying axon density and TEM data.
This zip archive contains the raw data for WT, iDKO and Taz iKO used for the quantitative analysis shown in Figure 8B, D, E, F and G. The data are contained in GraphPad Prism files, as indicated.
Figure 8—source data 4. Loss of TAZ protein expression in sciatic nerves of Taz iKO mice.
Uncropped Western blots of images used to make Figure 8A. Individually processed samples from 3 WT mice (#208,#211,#213) and 3 Taz iKO mice (#210,#216,#249) are shown and used for quantification. X…….X denotes the line along which membranes were cut prior to probing with the relevant antibodies. The following figure supplements are available for Figure 8.

Figure 8.

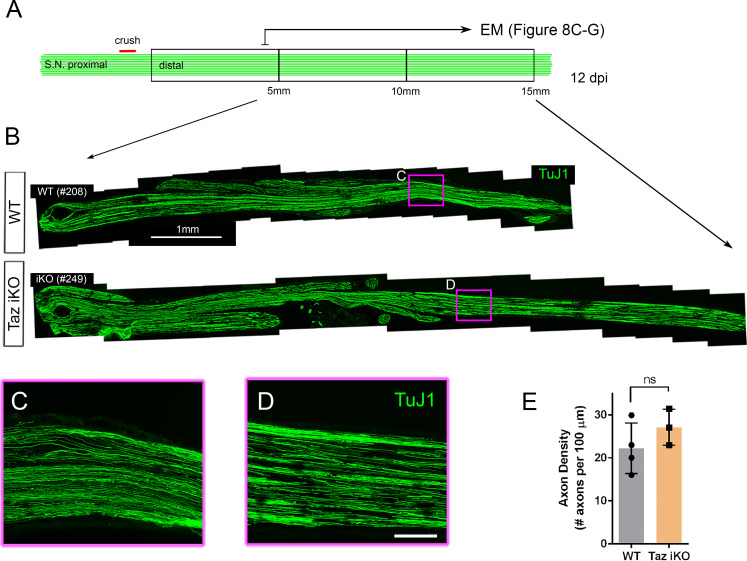
Figure 8—figure supplement 1. Schwann cells expressing YAP (but lacking TAZ) support axon regeneration.

Figure 8—figure supplement 1.

(A) Schematic showing relative locations and sizes of the distal nerve segments used for light microscopic and TEM analysis of axon regeneration in WT or Taz iDKO, 12 days after nerve crush. (B) Low magnification views of longitudinal nerve sections beginning 5 mm distal to the crush site, showing regenerated axons in iKO as abundant as in WT. Axons are marked by TuJ1. (C, D) High magnification views of boxed areas in (B). Scale bars = 1 mm (B) and 100 μm (C, D). (E) Quantification of axon density measured at ~10 mm distal to the crush site. n = 3 mice per genotype. ns, not significant, p=0.2118, Mann-Whitney.
Figure 8—figure supplement 1—source data 1. Source files for graph quantifying axon density.
This zip archive contains the raw data for WT and Taz iKO used for the quantitative analysis shown in Figure 8—figure supplement 1E. The data are contained in both a text document and an Excel file, both labeled as Mann Whitney data. These files also contain data for Figure 3—figure supplement 1, Figures 3, 4, 6, 7, 8.