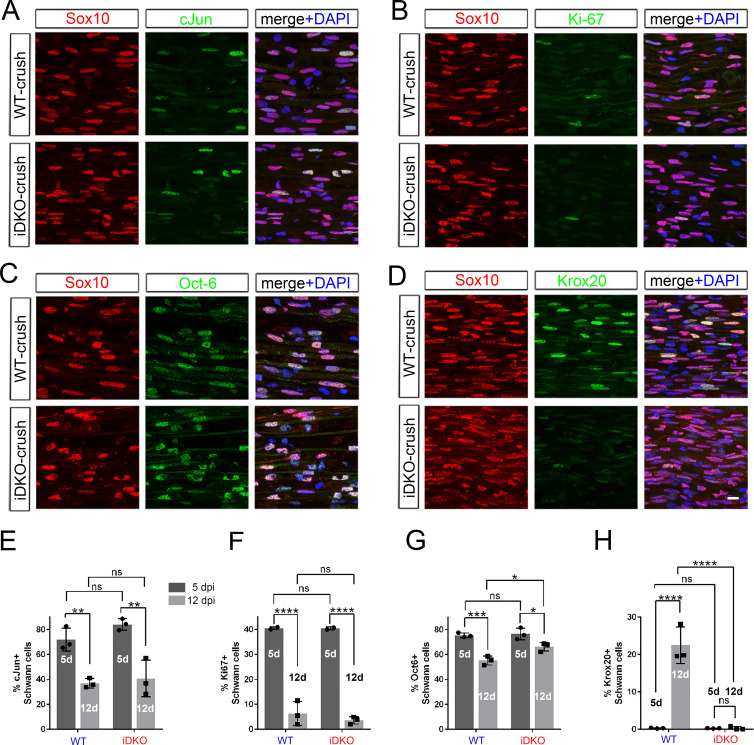
Figure 9. Redifferentiation of Schwann cells lacking YAP/TAZ.
Longitudinal sections of crushed nerves of WT and Yap/Taz iDKO at 12 dpi, immunostained by various markers of SC dedifferentiation (c-Jun and Oct-6), proliferation (Ki67) and redifferentiation (Krox20). SCs are marked by Sox10. (A) Representative sections showing c-Jun+ SCs markedly reduced in iDKO, as in WT. (B) Representative sections showing rarely observed Ki67+ proliferating SCs in iDKO, as in WT. (C) Representative sections showing Oct-6+ SCs reduced in iDKO, as in WT. (D) Representative sections showing failed upregulation of Krox20 in iDKO SCs. (E) Quantitative comparison of c-Jun+ SCs at 5 and 12 dpi, showing similar downregulation of c-Jun in WT and iDKO SC. n = 3 mice per genotype, 2-way ANOVA, ns = not significant. WT five dpi vs WT 12 dpi, **p=0.0069; WT five dpi vs iDKO five dpi, p=0.4260; WT 12 dpi vs iDKO 12 dpi, p=0.9574; iDKO five dpi vs iDKO 12 dpi, **p=0.0018. (F) Quantitative comparison of Ki67+ SCs, showing similar reduction in proliferating SCs in WT and iDKO nerves between 5 dpi and 12 dpi. n = 3 mice per genotype, 2-way ANOVA, ns = not significant. WT five dpi vs WT 12 dpi, ****p<0.0001; WT five dpi vs iDKO five dpi, p>0.9999; WT 12 dpi vs iDKO 12 dpi, p=0.6775; iDKO five dpi vs iDKO 12 dpi, ****p<0.0001. (G) Quantitative comparison of Oct-6+ SCs, showing significant downregulation of Oct-6 in WT and iDKO SCs between 5 dpi and 12 dpi. n = 3 mice per genotype, ns = not significant, 2-way ANOVA. WT five dpi vs WT 12 dpi, ***p=0.0005; WT five dpi vs iDKO five dpi, p=0.9817; WT 12 dpi vs iDKO 12 dpi, *p=0.0221; iDKO five dpi vs iDKO 12 dpi, *p=0.0299. (H) Quantitative comparison of Krox20+ SCs, showing upregulation of Krox20 in WT SCs, but not in iDKO SCs between 5 dpi and 12 dpi. n = 3 mice per genotype, 2-way ANOVA, ns = not significant. WT five dpi vs WT 12 dpi, ****p<0.0001; WT five dpi vs iDKO five dpi, p>0.9999; WT 12 dpi vs iDKO 12 dpi, ****p<0.0001; iDKO five dpi vs iDKO 12 dpi, p>0.9999. Scale bar = 10 μm (A–D).

