

Abstract
As treatment of the early, inflammatory phase of sepsis improves, post-sepsis immunosuppression and secondary infection have increased in importance. How early inflammation drives immunosuppression remains unclear. Although IFN-γ typically helps microbial clearance, we found that increased plasma IFN-γ in early clinical sepsis was associated with the later development of secondary Candida infection. Consistent with this observation, we found that exogenous IFN-γ suppressed macrophage phagocytosis of zymosan in vivo, and antibody blockade of IFN-γ after endotoxemia improved survival of secondary candidemia. Transcriptomic analysis of innate lymphocytes during endotoxemia suggested that NKT cells drove IFN-γ production by NK cells via mTORC1. Activation of invariant NKT (iNKT) cells with glycolipid antigen drove immunosuppression. Deletion of iNKT cells in Cd1d–/– mice or inhibition of mTOR by rapamycin reduced immunosuppression and susceptibility to secondary Candida infection. Thus, although rapamycin is typically an immunosuppressive medication, in the context of sepsis, rapamycin has the opposite effect. These results implicated an NKT cell/mTOR/IFN-γ axis in immunosuppression following endotoxemia or sepsis. In summary, in vivo iNKT cells activated mTORC1 in NK cells to produce IFN-γ, which worsened macrophage phagocytosis, clearance of secondary Candida infection, and mortality.
Keywords: Immunology, Infectious disease
Keywords: Fungal infections, Macrophages, NK T cells

Introduction
In sepsis, an excessive inflammatory response to infection leads to end organ damage (1). After surviving the early, inflammatory phase of sepsis, previously healthy patients can develop post-sepsis immunosuppression and susceptibility to opportunistic secondary infection (2). Since treatment of the inflammatory phase of sepsis has improved, now 70% of mortality occurs after the first 72 hours of sepsis. Post-sepsis immunosuppression and secondary infection play a major role in later deaths (3). However, the master regulators of post-sepsis immunosuppression are incompletely defined, and there are no clinical therapies for post-sepsis immunosuppression. Candida is a major cause of secondary infections in septic patients and is the fourth most common bloodstream infection in intensive care unit (ICU) patients. Candidemia causes greater than 50% mortality, even with antifungal treatment (4). However, the mechanisms that regulate the clearance of secondary Candida infection are unknown, and, more broadly, the events in early sepsis that drive sepsis-induced immunosuppression are poorly understood.
Post-sepsis immunosuppression is due to deficits in immune cell function and increased activity by regulatory cells, such as regulatory T cells (2). In sepsis, monocytes become “deactivated,” with decreased expression of HLA-DR and decreased expression of inflammatory cytokines (5). In addition, T cells have reduced capacity to produce IFN-γ, a potent activator of macrophages (6). The field lacks definitive clinical data on whether a deficiency in IFN-γ production during later sepsis increases the risk of secondary infections. However, a series of clinical trials were inspired by the hypothesis that exogenous treatment with IFN-γ would reverse markers of monocyte deactivation and ameliorate post-sepsis immunosuppression. In these studies, septic patients (7, 8) and volunteers challenged with endotoxemia (9) were treated with exogenous IFN-γ. Treatment with IFN-γ increased monocyte expression of HLA-DR and in vitro production of inflammatory cytokines. However, these prior studies did not explore whether exogenous IFN-γ treatment reduced susceptibility to secondary infection or affected antimicrobial functions like phagocytosis.
Despite clinical trials of exogenous IFN-γ in post-sepsis immunosuppression, the field has a gap in knowledge regarding the relationship of endogenous IFN-γ levels and susceptibility to secondary infection. To answer this question, we examined a clinical cohort of septic patients prospectively enrolled during early sepsis (within 48 hours of their admission to the ICU). We measured plasma IFN-γ levels during early sepsis and grouped patients by absence of or later development of secondary Candida infection. Surprisingly, increased levels of plasma IFN-γ in early clinical sepsis correlated with later development of secondary Candida infection. This finding raised the hypothesis that excessive IFN-γ in early sepsis promotes immunosuppression. To explore this clinical finding, we made what we believe to be a new 2-hit mouse model of primary endotoxemia followed by secondary candidemia. Global transcriptomic analysis of endotoxemia led to the finding that an NKT cell/mTOR/IFN-γ axis drives post-sepsis immunosuppression. Invariant NKT (iNKT) cells are a subset of innate T cells and are best known as “cellular adjuvants” that boost antimicrobial responses during infection. Unlike adaptive T cells that recognize peptide antigens, iNKT cells recognize endogenous and microbial glycolipid antigens presented by CD1d, a homolog of MHC I. iNKT cells express an invariant T cell receptor–α (TCRα) chain — Vα24–Jα18 in humans and Vα14–Jα18 in mice. Correspondingly, all iNKT cells are activated by the same antigens, such as the lipid antigen α-galactosylceramide (αGalCer). αGalCer is a powerful experimental reagent to selectively activate iNKT cells in vivo. After stimulation, iNKT cells are fully activated within minutes and jump-start the broader immune response by recruiting and activating other leukocyte subsets. For example, NKT cells stimulate IFN-γ production by NK cells, bacterial phagocytosis by macrophages, and neutrophil recruitment (10). We validated that the NKT/mTOR axis drives immunosuppression and susceptibility to secondary candidemia in 2 complementary models: selective iNKT cell activation with the lipid antigen αGalCer to isolate iNKT cell–dependent mechanisms and a second model of cecal slurry peritonitis, a preclinical model of sepsis (11). Notably, treatment with rapamycin after the initiation of sepsis reduced susceptibility to secondary candidemia. Here, we find that, in contrast to their usual antimicrobial roles, an NKT cell/mTOR/IFN-γ axis drives post-sepsis immunosuppression and susceptibility to secondary Candida infection (scheme in Supplemental Figure 1; supplemental material available online with this article; https://doi.org/10.1172/JCI128075DS1).
Results
IFN-γ drives immunosuppression during endotoxemia.
Prior investigators had hypothesized that macrophage deactivation in post-sepsis immunosuppression could be corrected by treatment with exogenous IFN-γ. In prior studies, septic patients (7, 8) and human volunteers challenged with LPS (9) were treated with exogenous IFN-γ to reverse markers of immunosuppression. Treatment with IFN-γ increased macrophage expression of MHC II and production of cytokines in vitro. However, these studies did not assess the effect of IFN-γ treatment on antimicrobial functions (like phagocytosis), and the effect of IFN-γ treatment on susceptibility to secondary infection was not assessed. Further, the field has not defined the relationship of endogenous IFN-γ levels to secondary infection. To help guide immunomodulatory therapies in post-sepsis immunosuppression, we characterized the prospective association between plasma IFN-γ levels and secondary infection in clinical sepsis. We focused on secondary Candida infections, since Candida infections are difficult to detect early and have poor outcomes even with antifungal treatment (12). We prospectively enrolled critically ill patients with early sepsis (within 48 hours of their admission to the ICU and sepsis diagnosis), and we collected plasma at the time of enrollment. In these registries, we retrospectively identified septic patients with culture-proven secondary Candida infection (n = 12). Secondary Candida infection was defined as candidemia (i.e., blood cultures positive for Candida) or invasive candidiasis (i.e., abdominal or pleural drain culture positive for Candida), along with clinical diagnosis of Candida infection. We excluded patients who already had Candida infection at the time of plasma collection. Thus, we captured plasma samples from septic patients before development of secondary Candida. In our registry, we identified control patients with primary sepsis who did not later develop secondary Candida infection. These controls were matched to cases by age and absence or presence of hypotension.
We measured plasma IFN-γ levels during early sepsis (within 48 hours of sepsis diagnosis and ICU admission) before secondary Candida infection. Increased plasma IFN-γ levels during early sepsis significantly correlated with later development of secondary Candida infection (Figure 1A). Septic patients who later developed secondary Candida infection had more than 4-fold higher median plasma IFN-γ levels compared with septic patients who did not go on to develop secondary Candida infection (median [IQR] pg/mL: 13.6 [4.0–20] vs. 3.2 [1.9–4.9], respectively; P < 0.001). Septic patients with secondary Candida infection did not significantly differ from septic patients without secondary Candida infection in demographics, hypotension, severity of illness (i.e., APACHE II and SOFA score), vital signs (except maximum heart rate), white blood cell count, lactate (Supplemental Table 1), or organism causing primary sepsis (Supplemental Table 2). The most common sources of infection for primary sepsis were pneumonia (42%–63%) followed by abdominal infection (21%–33%).
Figure 1. Early IFN-γ correlates with susceptibility to secondary Candida infection in clinical sepsis and experimental endotoxemia.

(A) Plasma IFN-γ levels in early clinical sepsis (within 48 hours of diagnosis). Patients are grouped by absence of secondary Candida infection (n = 19) or later development of secondary Candida infection (n = 12). (B) Survival curve for WT mice (n = 10–16 per group) after primary endotoxemia followed by secondary low-dose Candida i.v. at 1, 3, or 7 days after LPS. (C) Survival curve for WT mice (n = 10 per group) treated with higher- or lower-dose endotoxemia followed by secondary low-dose Candida i.v. (D) K-means clustering of transcriptomic (RNA-Seq) analysis of splenic Ly6c+ and Ly6c– macrophages from WT mice during endotoxemia (n = 2, not repeated). (E) Mean expression of transcripts from clusters from D with increased expression at 3 or 18 hours after endotoxemia. (F) Correlation of the transcriptomes of endotoxemia and IFN-γ response. Using RNA-Seq data from D for splenic Ly6c+ macrophages, the fold change in expression at 3 hours after LPS in vivo versus naive was calculated for each gene. The fold change in gene expression at 2 hours after IFN-γ treatment of macrophages in vitro versus untreated was calculated. The fold changes for 2 hours post–IFN-γ/naive versus 3 hours post-LPS/naive are plotted (left). A similar analysis for 18 hours is shown (right). Median ± IQR (A) and mean ± SEM (E) are shown. (A) Mann-Whitney test. (B and C) Log-rank test. *P < 0.05; ***P < 0.001.
Prior clinical trials treated septic patients with exogenous IFN-γ to try to reverse post-sepsis immunoparalysis (7, 8). However, our clinical cohort showed an association between increased IFN-γ levels and secondary Candida infection. We entertained the hypothesis that, although IFN-γ is generally antimicrobial, excessive IFN-γ drives immunosuppression in the setting of sepsis. To explore this hypothesis, we developed what we believe to be a new mouse model of postinflammatory immunosuppression and superinfection. In this mouse model, primary endotoxemia is followed by secondary Candida i.v. infection. For exploratory studies, endotoxemia allows a precise dissection of postinflammatory immunosuppression over time, as infectious sepsis models have a less synchronized immune response over time. We treated wild-type (WT) mice with the maximum dose of LPS i.v. that allowed 100% survival (2 mg/kg body weight of ultrapure LPS from E. coli O111:B4). After endotoxemia, mice were challenged with a secondary infection of low-dose Candida albicans i.v. (2 × 10⁴ CFU). Clinically, Candida bloodstream infections occur due to mucocutaneous entry from the gastrointestinal tract or i.v. entry (12, 13). We used i.v. inoculation of Candida to model entry via central venous catheter. By eliminating the confounding effects of mucosal immunity on Candida entry, the i.v. model of Candida infection emphasizes the determinants of Candida clearance rather than mucosal translocation. Naive mice have greater than 80% survival of low-dose candidemia alone. However, during endotoxemia, mice became profoundly susceptible to secondary Candida infection at 1 or 3 days after LPS treatment (Figure 1B). Susceptibility resolved by 7 days after LPS. These data illustrate that postinflammatory immunosuppression was time-dependent and underscored the value of examining a synchronized immune response in the endotoxemia model, which allowed the dissection of dynamic immune responses. Immunosuppression was unique to higher-dose endotoxemia (2 mg/kg body weight), as there was no susceptibility with lower-dose LPS (0.5 mg/kg, 25% of the high dosage; Figure 1C).
We examined the splenic compartment to model the systemic immune response. Along with kidney and liver, the spleen has the highest Candida burden in early invasive candidiasis (14, 15). To determine mechanisms of post-sepsis immunosuppression, we performed ex vivo global transcriptomic RNA-Seq analysis of splenic macrophages from naive WT mice and WT mice at 3, 18, and 72 hours after i.v. LPS. We compared Ly6c+ inflammatory macrophages, a key part of the clearance of primary Candida infection (16, 17), with Ly6c– macrophages (Figure 1D). Given the susceptibility to secondary candidemia at earlier time points (day 1 and day 3 of endotoxemia; Figure 1B), we focused on gene clusters that were upregulated during early endotoxemia (i.e., 3 and 18 hours after LPS). These early-upregulated genes were clusters 1, 4, 6, and 7 (Figure 1, D and E). They were particularly upregulated in our cell of interest, Ly6c+ macrophages, as compared with Ly6c– macrophages. Gene set enrichment analysis identified IFN-γ responses in clusters 1 and 6, which contained known IFN-γ response genes like Irf1, Irf7, Socs3, Stat1, and Tap1 (Table 1; complete gene lists in supplemental material). Next, we quantified the IFN-γ response signature in the transcriptomic data by comparing our data set of Ly6c+ macrophages in endotoxemia with published transcriptomic data sets of macrophages treated in vitro with IFN-γ (18, 19). Multiple known IFN-γ–induced genes were also increased during endotoxemia, such as CXCL10 and others highlighted in Figure 1F. Quantification of the correlation between LPS and IFN-γ treatment data sets revealed that the IFN-γ response signature occurs very early during endotoxemia in macrophages. Global transcriptomic analysis showed a significant IFN-γ response signature during early endotoxemia, at 3 hours after LPS, with R value 0.34 and P value 1.6 × 10⁻²⁷. Notably, as early as 18 hours after LPS, there was little correlation to the IFN-γ signature, with R value 0.04 (Table 2). This early IFN-γ signature in the mouse model paralleled our clinical finding, in which increased early IFN-γ associated with the later development of secondary Candida infection (Figure 1A).
Table 1. Gene clusters with early upregulation in endotoxemia in splenic macrophages.
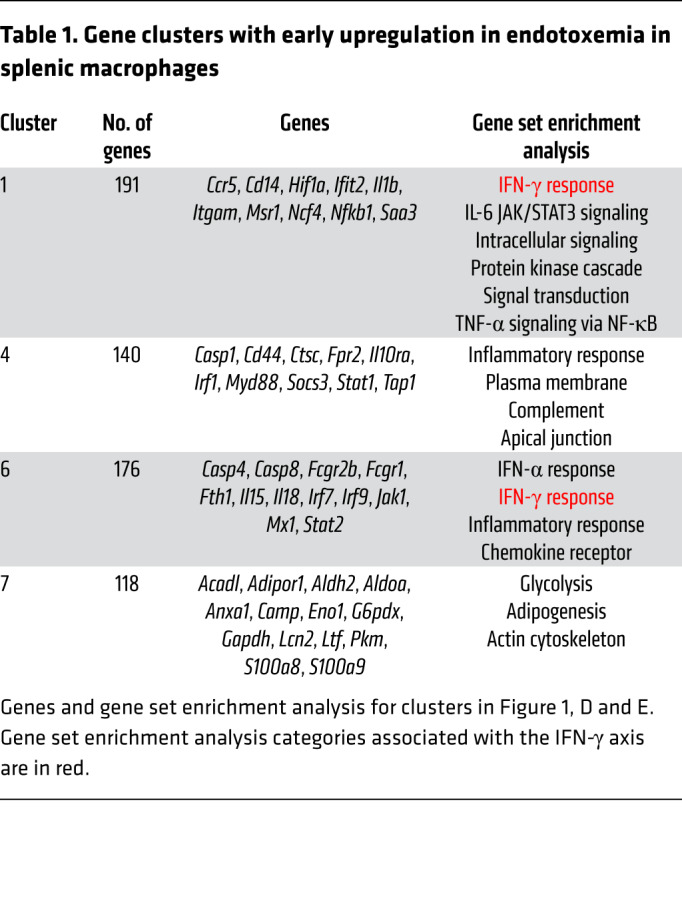
Table 2. Correlation of the global transcriptomes of endotoxemia and IFN-γ response.

To test the hypothesis that early IFN-γ is causative rather than merely correlative with immunosuppression, we administered exogenous IFN-γ to WT mice. Treatment with exogenous IFN-γ 1 μg i.p. was sufficient to suppress the in vivo phagocytosis of opsonized zymosan fungal particles by splenic macrophages and neutrophils by 66% or more (Figure 2A; macrophage flow cytometry gating strategy in Supplemental Figure 2A). In line with these results, Ifng–/– (IFN-γ–KO) mice had significantly improved survival of secondary candidemia during endotoxemia (Figure 2C). These effects were due to endotoxemia, since IFN-γ–KO and WT mice had similar susceptibility to low-dose candidemia alone (Figure 2B). We confirmed a pathogenic role of IFN-γ by treating with anti–IFN-γ blocking antibody after onset of endotoxemia but before secondary Candida infection. IFN-γ blockade after endotoxemia improved survival of secondary candidemia (Figure 2D). Thus, increased IFN-γ drove immunosuppression, which is one possible explanation of the association of increased IFN-γ and increased secondary Candida infection in septic patients (Figure 1A).
Figure 2. IFN-γ drives post-endotoxemia immunosuppression.

(A) In vivo phagocytosis assay. WT mice (n = 3 per group) received IFN-γ i.p. (or vehicle) followed 18 hours later by opsonized zymosan-FITC i.v. Thirty minutes after zymosan, flow cytometry assessed percentage of splenic macrophages that ingested zymosan-FITC. (B) Survival curve for WT or IFN-γ–KO mice (n = 8 per group) treated with Candida i.v. only. (C) Survival curve for WT or IFN-γ–KO mice (n = 11–13 per group) treated with endotoxemia followed 18 hours later by Candida i.v. (D) Survival curve of WT mice (n = 14 per group) treated with endotoxemia followed by anti–IFN-γ blocking mAb or isotype control mAb at 3 and 15 hours after LPS i.v. Then mice were infected with low-dose candidemia at 18 hours after LPS. In bar graphs, mean ± SEM is shown. (A) One-way ANOVA. (B–D) Log-rank test. **P < 0.001.
iNKT cells drive post-endotoxemia immunosuppression.
From other disease models, likely sources for IFN-γ during early inflammation include innate T cells (e.g., NKT cells and γδ cells) and innate lymphoid cells (NK cells, ILCs). Given that NKT cells can both secrete high levels of IFN-γ and powerfully stimulate other immune cells during early inflammation (10), we hypothesized that iNKT cells were a master regulator of IFN-γ production in endotoxemia. We assessed iNKT cell activation by measuring surface expression of CD69. iNKT cells were activated within the first 3 hours of endotoxemia and reached peak activation by 12 hours after LPS (Figure 3A; flow cytometry gating strategy in Supplemental Figure 2B). Peak activation of iNKT cells coincided with the peak immunosuppression and susceptibility to secondary candidemia seen in vivo during endotoxemia (Figure 1B). Cd1d-deficient (CD1d-KO) mice lack NKT cells. Quantitative PCR of splenocytes from WT and CD1d-KO mice showed that NKT cells drive a 3-fold increase in IFN-γ production during endotoxemia (Figure 3B). To identify the cellular sources of IFN-γ induced by NKT cells, we sorted splenic cell subsets from WT mice and CD1d-KO mice during endotoxemia (flow cytometry gating strategy in Supplemental Figure 2, B and C). This comparison demonstrated that NK cells were the dominant source of NKT cell–dependent IFN-γ, as NKT cells induced a 3-fold increase in Ifng expression by NK cells (defined as lineage–CD127[IL-7R]–NK1.1+) (ref. 18 and Figure 3C). NKT cells also induced Ifng expression in γδ T cells (Figure 3C) and a nonsignificant trend in NK1.1+ ILCs (defined as lineage–IL-7R+NK1.1+) (20). Earlier, we had shown that IFN-γ impaired the phagocytic function of macrophages and increased susceptibility to secondary candidemia (Figure 2). In line with our finding that NKT cells increased production of immunosuppressive IFN-γ, CD1d-KO (NKT cell–deficient) mice had improved in vivo phagocytosis of zymosan particles by splenic macrophages during endotoxemia compared with WT mice (2.5-fold improvement in Figure 3, D and E, with additional flow cytometry plots in Supplemental Figure 3). NKT cell–deficient (CD1d-KO) mice had improved macrophage function but decreased number of splenic Ly6c+ macrophages after endotoxemia (Supplemental Figure 4A), with no difference in splenic Ly6c– and neutrophil number between WT and CD1d-KO. CD1d-KO mice are deficient in both the invariant (type 1) and diverse (type 2) subsets of NKT cells. Ja18-deficient (Jα18-KO) mice lack the Jα18 segment of the TCRα chain required by invariant NKT cells, so Jα18-KO mice lack invariant NKT cells but have diverse NKT cells. Like WT mice, CD1d-KO and Jα18-KO mice displayed little susceptibility to low-dose Candida i.v. alone (Figure 3F). Both CD1d-KO and Jα18-KO mice had improved survival of secondary candidemia during endotoxemia compared with WT mice (Figure 3F). Both CD1d-KO mice and Jα18-KO mice had improved clearance of Candida, with at least a 50% reduction in peak Candida colony-forming units (CFU) in kidney (Figure 3G). Kidney is a key site of Candida infection that leads to septic shock and mortality in mouse models of Candida infection (21, 22). The similar behavior of CD1d-KO and Jα18-KO mice indicated that invariant NKT cells, not diverse NKT cells, drove post-sepsis immunosuppression.
Figure 3. iNKT cells drive IFN-γ production and post-endotoxemia immunosuppression.

(A) Flow cytometry plots and mean fluorescence intensity (MFI) of CD69 on splenic iNKT cells from WT mice during endotoxemia (LPS i.v.) (n = 5–6 per group). (B) Quantitative PCR (qPCR) of Ifng in splenocytes from WT and CD1d-KO mice 18 hours after LPS (naive, n = 4–7; LPS, n = 9–10 per group). (C) Total Ifng mRNA by qPCR (mRNA per cell × number of cells) in splenic cell subsets sorted from WT or CD1d-KO mice 18 hours after LPS (n = 3 per group, not repeated). (D) Flow cytometry plot of splenic Ly6c+ macrophages for in vivo phagocytosis assay. WT and CD1d-KO mice were treated with saline (naive) or LPS i.v., then 18 hours later with opsonized zymosan-FITC i.v. (E) Percentage of zymosan-FITC+ splenic cell subsets in D (naive, n = 5; LPS, n = 6 per group). (F) Survival curves for WT, CD1d-KO, or Jα18-KO mice treated with Candida i.v. alone (1° candidemia); or mice treated with LPS i.v., then 18 hours later with Candida i.v. (1° endotoxemia and 2° candidemia) (n = 8–9 per group). (G) Candida CFU in kidney for WT, CD1d-KO, and Jα18-KO mice treated with LPS i.v., then 18 hours later with Candida i.v. (n = 5 per group). In bar graphs, mean ± SEM is shown. (A) One-way ANOVA; (B) unpaired t test; (C) Mann-Whitney test; (E) 1-way ANOVA except unpaired t test for Ly6c+ macrophages/LPS; (F) log-rank test; (G) 1-way ANOVA. *P < 0.05; **P = 0.01; ****P < 0.0001.
LPS directly activates several cell types. To isolate the effect of iNKT cells, we administered the glycolipid antigen α-galactosylceramide (αGalCer) i.p. to WT mice. αGalCer specifically activates iNKT cells but has no effect on other leukocytes (23). Selective activation of iNKT cells with αGalCer induced Ifng expression by iNKT cells. In turn, iNKT cells transactivated NK cells and NK1.1+ ILCs to produce Ifng (Figure 4, A and B). After selective activation of iNKT cells by αGalCer, Ly6c+ and Ly6c– macrophages in spleen and kidney had impaired in vivo phagocytosis of zymosan, with function impaired by more than 50% (Figure 4, C and D, with additional flow cytometry plots in Supplemental Figure 5). The numbers of splenic Ly6c+ macrophages and neutrophils were unaffected by iNKT cell activation, with a reduction in Ly6c– macrophages (Supplemental Figure 4B). Next, we demonstrated that activation of iNKT cells is sufficient to drive immunosuppression in vivo. Administration of αGalCer caused susceptibility to secondary Candida infection (Figure 4E). This susceptibility was more transient than endotoxemia, as mortality from secondary Candida infection peaked at day 1 after αGalCer but returned to baseline by day 3 (Figure 4E). Activation of iNKT cells with αGalCer caused a 25-fold increase in peak Candida CFU in kidney (Figure 4F). In the αGalCer model of NKT cell–dependent immunosuppression and secondary Candida infection, IFN-γ–KO mice had improved survival (Figure 4G) and a 13-fold improvement in Candida clearance (Figure 4H) compared with WT mice. Thus, IFN-γ drove susceptibility to secondary candidemia after both endotoxemia and selective activation of iNKT cells by lipid antigen.
Figure 4. Selective activation of iNKT cells with glycolipid antigen (αGalCer) drives IFN-γ production and immunosuppression.

(A) WT mice (n = 6–7 per group except n = 4 for γδ T cells) were treated with vehicle or αGalCer i.p., followed 3 hours later by brefeldin A i.p. IFN-γ was assessed by flow cytometry 6 hours later. (B) Percent IFN-γ+ in splenic cell subsets from A. (C) In vivo phagocytosis. WT mice were treated with vehicle (naive) or αGalCer 1 μg i.p., then 18 hours later with opsonized zymosan-FITC i.v. Flow cytometry plots for percentage zymosan-FITC+ Ly6c+ macrophages are shown. (D) Percent zymosan-FITC+ splenic and kidney cell subsets from C (naive, n = 4–5; αGalCer, n = 4–6). (E) Survival curves for WT mice treated with αGalCer i.p. only; vehicle and then Candida i.v. only; or αGalCer 1 μg i.p., followed 18 hours later (day –1) or 3 days later (day –3) by Candida i.v. (n = 7 per group). (F) Candida CFU in kidney of WT mice treated with αGalCer (or vehicle) followed 18 hours later by Candida i.v. (n = 5 per group). (G) Survival curves for WT or IFN-γ–KO mice treated with αGalCer i.p., followed 18 hours later by Candida i.v. (n = 12 per group). (H) Candida CFU in kidney (n = 5 per group). In bar graphs, mean ± SEM is shown. (B, D, F, and H) Unpaired t tests. (E and G) Log-rank test. *P < 0.05; **P < 0.01; ***P < 0.001; ****P < 0.0001.
IFN-γ and IL-17 are both important cytokines for clearance of primary candidiasis, but the roles of IFN-γ and IL-17 in secondary Candida infection are unknown. IFN-γ can suppress Th17 responses (24, 25), in part by activation of STAT1 (26). Clinically, a gain-of-function mutation in STAT1 can cause chronic mucocutaneous candidiasis disease, in part due to impaired IL-17 responses (27). IFN-γ suppresses the IL-17 response in other disease models, such as arthritis (28), but the interaction of IFN-γ and IL-17 in endotoxemia was unknown. We compared production of IL-17A in vivo in WT mice and IFN-γ–KO mice during endotoxemia (Supplemental Figure 6). Compared with WT mice, IFN-γ–KO mice had increased production of IL-17A by γδ T cells during endotoxemia. These results underscore that, during endotoxemia, NKT cells and IFN-γ likely have complex roles that go beyond impairment of macrophage function.
iNKT cells regulate IFN-γ production by NK cells via mTORC1.
To understand how IFN-γ production is regulated, we turned to global transcriptomic analysis of endotoxemia. In the context of the Immunological Genome Project’s goal of determining the broad landscape of immune gene expression by comparison of multiple cell types and contexts (29), we focused on RNA-Seq analysis of the 3 innate lymphocyte subsets responsible for iNKT cell–dependent IFN-γ production (Figure 5A). We examined splenic iNKT cells, γδ T cells, and NK cells at baseline and 3, 18, and 72 hours after i.v. administration of LPS. Given the early upregulation of IFN-γ production, we focused on gene clusters that were upregulated at 3 hours after endotoxemia (clusters 1, 3, 4, and 7 in Figure 5, A and B, and Table 3). Cluster 3 contained the cytokines IL-17 and IL-22 (and, as expected, IFN-γ). IL-17 and IL-22 are known to protect against primary mucocutaneous candidiasis (30, 31), but their roles in secondary candidemia are unknown. IL-17A and IL-22 had no role in NKT cell–driven immunosuppression, since both Il17a–/– (IL-17A–KO) mice and Il22–/– (IL-22–KO) mice had the same susceptibility as WT mice to secondary candidemia after activation of iNKT cells with αGalCer (Supplemental Figure 7). These results do not exclude a role for IL-17A and IL-22 in NKT cell–independent immunosuppression.
Figure 5. iNKT cells regulate mTOR/IFN-γ in NK cells during endotoxemia.

(A) K-means clustering of RNA-Seq transcriptomic analysis of splenic cell subsets from WT mice during endotoxemia (n = 2, experiment not repeated). (B) Mean expression of transcripts from clusters from A. Expression is increased at 3 hours after LPS i.v. (C) Flow cytometry plots for phosphorylated S6 kinase (p-S6) in splenic iNKT cells from WT or CD1d-KO mice 3 hours after LPS i.v. or vehicle. (D) MFI of p-S6 of splenic cell subsets in C (n = 6 per group). (E and F) WT or CD1d-KO mice were treated with rapamycin (rapa) i.p. (or vehicle) and then 3 hours later received LPS i.v. (or vehicle). Three hours later, mice were given i.p. brefeldin A. At 6 hours after brefeldin, percentage IFN-γ+ cells was assessed by flow cytometry in spleen (n = 5) (E) and blood and kidney (n = 3–6) (F). Nv, naive. In bar graphs, mean ± SEM is shown. (D and E) Unpaired t test. (F) One-way ANOVA. *P < 0.05; **P < 0.01; ***P < 0.001; ****P < 0.0001.
Table 3. Gene clusters with early upregulation in endotoxemia in splenic innate lymphocytes and lymphoid cells.
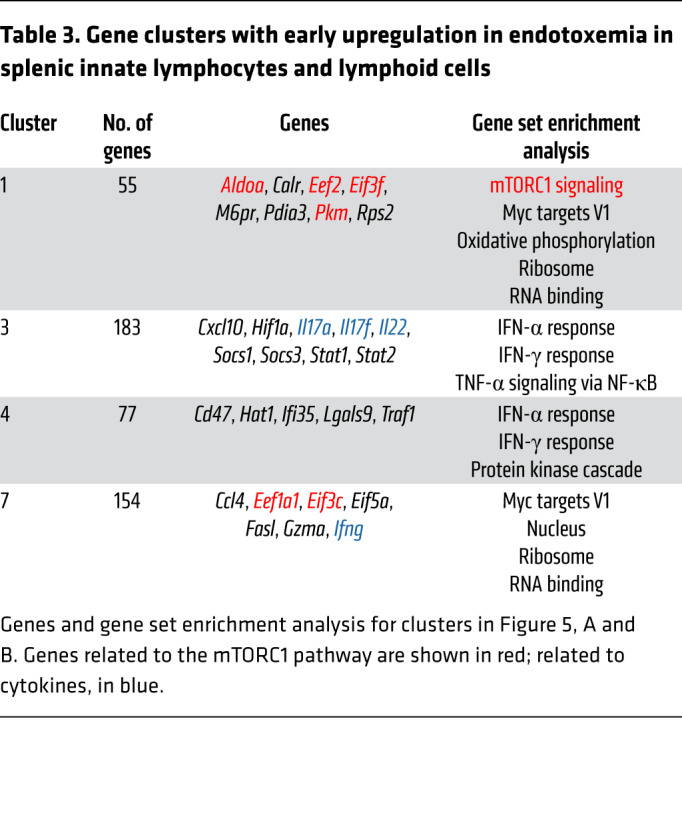
We next focused on a possible role for mTORC1, as gene set enrichment analysis (GSEA) highlighted mTORC1 signaling during endotoxemia in cluster 1 (Table 3). Cluster 1 contained several targets of the mTORC1 pathway (e.g., Eef2, ref. 32; and Eif3f, ref. 33) and metabolic genes (e.g., Aldoa, Pkm) (Table 3, red). Expression of cluster 1 was increased in iNKT cells and NK cells (but not in γδ T cells) in early endotoxemia (Figure 5B). Cluster 7 also contained genes known to interact with the mTORC1 pathway (Eef1a1, Eif3c; Table 3). NKT cell control of mTOR signaling had not been examined in the context of endotoxemia, sepsis, immunosuppression, or opportunistic fungal infection. We measured activation of mTORC1 ex vivo by quantifying phosphorylation of S6 kinase (phospho-S6) by flow cytometry (34). Compared with CD1d-KO mice during endotoxemia or naive mice, WT mice during endotoxemia had increased mTORC1 signaling in NK cells and NK1.1+ ILCs (Figure 5, C and D). We hypothesized that a key functional consequence of mTORC1 activation in NK cells was IFN-γ production, since NK cells were a key source of IFN-γ during endotoxemia (Figure 3C) and mTOR activation drives IFN-γ production by NK cells in other contexts (35, 36). We administered LPS to mice and treated them with rapamycin i.p. (or vehicle). Rapamycin, which blocks mTORC1 signaling, reduced the percentage of IFN-γ–producing splenic NK cells and NK1.1+ ILCs to similar levels in WT mice and CD1d-KO mice during endotoxemia (Figure 5E, with flow cytometry plots in Supplemental Figure 8A). IFN-γ production was reduced by more than 50%. These results suggested that mTORC1 mediated both NKT cell–dependent and NKT cell–independent IFN-γ production. We also examined the role of mTOR in blood and kidney. Kidney is a key site of persistent Candida infection in mice that succumb to secondary Candida infection (21, 22). During endotoxemia, rapamycin reduced IFN-γ production by NK cells in kidney but had no effect in blood (Figure 5F and Supplemental Figure 8B).
Since LPS can act directly on downstream cells to activate mTOR (37), we turned to the reductionist model of αGalCer administration to isolate NKT cell–dependent activation of mTORC1. Activation of iNKT cells by i.p. αGalCer activated mTOR in vivo in splenic iNKT cells, NK cells, and NK1.1+ ILCs (Figure 6A). During selective activation of iNKT cells, rapamycin treatment reduced IFN-γ production by at least 50% in iNKT cells and at least 66% in NK cells, NK1.1+ ILCs, and γδ T cells (Figure 6B). The reduction in IFN-γ production by NK cells and ILCs could reflect rapamycin acting directly on these cell subsets, or rapamycin could be acting on upstream cells (like iNKT cells). In naive mice, rapamycin treatment reduced phagocytosis by Ly6c+ macrophages in spleen (Figure 6, C and D, “Naive”), which matches in vitro studies in which rapamycin treatment impaired the phagocytic function of naive macrophages (38). However, in the context of NKT cell–dependent immunosuppression, rapamycin treatment had the opposite effect on splenic macrophages. During selective activation of NKT cells by αGalCer, rapamycin treatment in vivo improved phagocytic function by more than 50% in Ly6c+ macrophages in spleen, compared with vehicle (Figure 6, C and D). If WT mice were treated with rapamycin before administration of exogenous recombinant IFN-γ i.p., rapamycin did not ameliorate suppression of macrophage phagocytosis (Supplemental Figure 9). This result suggested that rapamycin acted, in part, through an upstream effect on IFN-γ production.
Figure 6. Selective activation of iNKT cells by the glycolipid antigen αGalCer drives immunosuppression via mTOR.

(A) Flow cytometry plots and MFI of phosphorylated S6 kinase (p-S6) in splenic cell subsets from WT mice 3 hours after αGalCer i.v. (or vehicle) (n = 6 per group). (B) Mice were treated with rapamycin i.p. (or vehicle), then 3 hours later with αGalCer i.p. (or vehicle). Three hours after αGalCer (or vehicle), mice were given brefeldin A i.p., and 6 hours later, IFN-γ was assessed by flow cytometry. Plots and percentage IFN-γ+ are shown (n = 5 per group). (C) In vivo phagocytosis assay. WT mice received αGalCer i.p. (or vehicle), then 3 and 15 hours later were treated with rapamycin i.p. (or vehicle). At 18 hours after αGalCer, opsonized zymosan-FITC was administered. Flow cytometry plots for splenic Ly6c+ macrophages are shown. (D and E) Percentage of zymosan+ macrophages in the spleen (n = 6) (D) and kidney (naive, n = 4–8; αGalCer, n = 9–11) (E) is shown. (F) In vivo phagocytosis assay. WT mice were treated with αGalCer and then rapamycin as in C. At 18 hours after αGalCer, mice were infected with Candida i.v. In vivo phagocytosis assay of opsonized zymosan-FITC was assessed at day 1 after Candida infection in kidney (n = 6). In bar graphs, mean ± SEM is shown. (A–E) Unpaired t test. (F) Kruskal-Wallis test. *P < 0.05; **P ≤ 0.01; ***P < 0.001.
We next examined the functional effects of the iNKT cell/mTOR axis in the kidney, an important site of persistent infection in invasive Candida infection (21, 22). As expected, selective activation of iNKT cells by αGalCer administration caused severe impairment of phagocytic function in kidney macrophages, to less than 15% of the level in naive mice (Figure 6E, with flow cytometry plots in Supplemental Figure 10A). We then assessed the role of mTOR activation. In contrast to spleen, rapamycin treatment had no effect on macrophage phagocytosis in the kidney during selective iNKT cell activation by αGalCer (Figure 6E, “Post-1° αGalCer only”). During invasive candidiasis, the leukocyte population of the kidney changes, including a significant accumulation of Ly6c+ macrophages (15). In some disease models, iNKT cells have different effects on macrophages that infiltrate an organ during an infection (compared with their effect on tissue-resident macrophages; ref. 39). So, we investigated the effect of rapamycin treatment on kidney macrophages after secondary Candida infection. After administration of αGalCer i.p., WT mice were treated with rapamycin i.p. and then infected with secondary candidemia i.v. One day after secondary candidemia, mice were challenged with FITC-labeled zymosan i.v., and in vivo phagocytosis was assessed. Rapamycin treatment improved the phagocytic function of Ly6c+ macrophages that accumulated in the kidney 1 day after candidemia (Figure 6F; flow cytometry plots in Supplemental Figure 10B). In summary, the iNKT cell/mTOR axis impaired macrophage phagocytosis function in both spleen and kidney, although the kinetics of immunosuppression differed between organs.
The iNKT cell/mTOR axis drives susceptibility to secondary candidemia.
We continued to examine the functional effects of the NKT cell/mTOR axis in early inflammation and sepsis. In line with the beneficial effect of rapamycin on macrophage function, treatment with rapamycin at 3 and 15 hours after administration of αGalCer (before secondary infection) led to improved survival of secondary candidemia (Figure 7B). Similarly, treatment with rapamycin at 3 hours and 15 hours after the initiation of endotoxemia (before secondary infection) improved survival of secondary candidemia (Figure 7C). As expected, rapamycin had no effect on survival of αGalCer or endotoxemia alone (Figure 7A). Endotoxemia has a severe (but time-limited) inflammatory phase that excels at modeling intense activation of innate immunity, while allowing the mice to survive and undergo secondary infection. However, as noted by the international consensus group Minimum Quality Threshold in Pre-clinical Sepsis Studies (MQTiPSS), mouse models such as cecal ligation and puncture, cecal slurry, or bacterial pneumonia are preferred preclinical models of sepsis (11). We confirmed the effect of the NKT cell/mTOR axis in what we believe is a new model of post-sepsis immunosuppression. Here, cecal slurry peritonitis (treated with i.p. antibiotics ceftriaxone and metronidazole; refs. 40, 41) is followed by secondary candidemia. For primary sepsis alone, we titrated the dose of cecal slurry and timing of antibiotics to 100% survival to ensure that mortality was due to secondary candidemia (Figure 7D). During sepsis due to cecal slurry peritonitis, CD1d-KO mice had improved survival of secondary candidemia compared with WT mice (Figure 7E). Treatment with rapamycin at 3 and 15 hours after initiation of sepsis improved survival of secondary candidemia (Figure 7F). Clinically, rapamycin is typically used as an immunosuppressive medication. However, in the context of iNKT cell activation, rapamycin prevented immunosuppression and protected against opportunistic infection.
Figure 7. NKT cells and mTORC1 drive post-sepsis immunosuppression and susceptibility to secondary candidemia.

(A) Survival curves for WT mice treated with αGalCer i.p. or LPS i.v. followed by rapamycin i.p. or vehicle at 3 and 15 hours later (n = 6 per group). (B and C) Survival curves for WT mice after administration of αGalCer i.p. (B) or LPS i.v. (C). At 3 and 15 hours after these primary challenges, mice were treated with rapamycin i.p. (or vehicle). At 18 hours after primary challenge, mice received secondary infection with Candida i.v. (n = 13–15 per group). (D) Survival curves for WT mice and CD1d-KO mice infected with cecal slurry peritonitis i.p. A subset of WT mice (WT + rapamycin) were treated at 3 and 15 hours after cecal slurry with rapamycin i.p. (n = 6–12). (E) Survival curves for WT mice and CD1d-KO mice infected with cecal slurry peritonitis i.p. followed 18 hours later with secondary Candida i.v. (n = 10–13). (F) Survival curves for WT mice infected with cecal slurry peritonitis i.p. and then treated 3 and 15 hours later with rapamycin i.p. or vehicle. Eighteen hours after cecal slurry, mice received secondary infection with Candida i.v. (n = 19). (A–F) Log-rank test. *P < 0.05; ****P < 0.0001.
Discussion
In this study, we examined the innate immune response to sepsis and identified a mechanism that predicted susceptibility to secondary infection. Increased plasma IFN-γ levels in early clinical sepsis were associated with subsequent development of secondary Candida infection. We entertained the hypothesis that the early cytokine response drives sepsis-induced immunosuppression. In the mouse model of endotoxemia, global transcriptomic analysis led to the finding that iNKT cells are major regulators of IFN-γ production by NK cells via mTORC1. NKT cells and IFN-γ suppress the phagocytic function of splenic macrophages and increase susceptibility to secondary Candida infection. To isolate the effect of iNKT cells, we selectively activated iNKT cells with their specific glycolipid antigen (αGalCer) and recapitulated the findings in endotoxemia. We next demonstrated that rapamycin treatment reverses NKT cell–dependent immunosuppression. After selective activation of iNKT cells with αGalCer, rapamycin treatment restored the in vivo phagocytic function of macrophages and reduced susceptibility to secondary candidemia. We then confirmed the effect of the NKT cell/mTOR axis in what we believe to be a new model of post-sepsis immunosuppression — cecal slurry peritonitis followed by secondary candidemia. NKT cells, mTOR, and IFN-γ typically mediate host defense in primary infections. However, in an extreme state like sepsis, we find that the iNKT cell/mTOR axis has a “paradoxical” effect and contributes to immunosuppression.
The role of mTOR in iNKT cells has been examined in models of development (42, 43), lineage commitment (44, 45), and hepatitis (44) and asthma (43), but not in sepsis. Further, the role of mTORC1 in crosstalk between iNKT cells and other innate immune subsets had not been elucidated in other disease models. We found that iNKT cells activated mTORC1 in NK cells and NK1.1+ ILCs. Although rapamycin (which blocks mTOR) is used clinically as an immunosuppressive medication, here rapamycin treatment improved resistance to secondary Candida infection after inflammation and sepsis.
Our study shows how the early immune response can cause susceptibility to secondary Candida infection. In contrast, prior studies focused on the opposite phenomenon — how primary exposure to Candida or β-glucan can trigger protective secondary responses. Primary exposure to β-glucan triggers “trained innate immunity” in monocytes via mTOR (46). In that study, activation of mTOR was protective against secondary infection, the opposite of our findings. These results show that the nature and context of the primary insult determines different roles for mTOR. Studies of protective, trained immunity used a primary stimulus of lower-dose β-glucan and modeled commensal infection. In contrast, we modeled the extreme stimulus of sepsis. In the literature, primary challenge with β-glucan induced trained immunity independently of lymphocytes. In our study, innate T cells take a central role. This difference suggests that innate T cells may help determine whether a primary immunological stimulus induces protective trained immunity or immunosuppressive programs.
Our study has several caveats. The molecular mechanisms driving impaired macrophage phagocytosis remain incompletely defined. Altered surface expression of receptors for uptake of opsonized zymosan did not mediate the immunosuppressive effect of the NKT cell/mTOR axis. Activation of iNKT cells with αGalCer did not affect the expression of the high-affinity Fc receptor (CD64, FcGRI) (Supplemental Figure 11). NKT cell activation reduced the expression of the low-affinity Fc receptor (CD16-32, FcGRIII) by only 10%, and rapamycin treatment had no effect. The in vivo phagocytosis assays in our study used opsonized zymosan-FITC, as uptake of opsonized pathogen is a major host-defense function of macrophages and helps clearance of disseminated candidiasis in vivo (47). iNKT cell activation also suppressed phagocytosis of non-opsonized zymosan by splenic Ly6c+ macrophages by 66% (Supplemental Figure 12A). Similar to uptake of opsonized zymosan, expression of surface receptors did not explain how iNKT cells suppress uptake of non-opsonized zymosan. After iNKT cell activation, the dectin-1 receptor had increased surface expression, and surface expression of the mannose receptor did not change with rapamycin treatment (Supplemental Figure 11). Together, these results suggest that the defect in zymosan phagocytosis is more complex than changes in the expression of surface uptake receptors. iNKT cell activation also reduced phagocytosis of non-opsonized killed Staphylococcus aureus by more than 33% but had no effect on non-opsonized killed E. coli (Supplemental Figure 12B). Thus, NKT cells may play different roles depending on type of secondary infection.
The next caveat is that mTOR and IFN-γ mediated only part of NKT cell–dependent immunosuppression. Rapamycin treatment reduced but did not abrogate IFN-γ production; and rapamycin treatment did not completely reverse susceptibility to secondary candidemia. Blockade of IFN-γ production itself also did not completely prevent susceptibility to secondary candidemia. We demonstrated the effect of NKT cells, rapamycin, and exogenous IFN-γ on macrophage function. However, we did not separate the effects of IFN-γ directly binding to macrophages and the effects of IFN-γ acting indirectly via another cell subset. Second, just as mTOR and IFN-γ only mediated part of NKT cell–dependent immunosuppression, NKT cells themselves only drive part of post-sepsis immunosuppression, as CD1d-KO (NKT cell–deficient) mice had only partial restoration of resistance to secondary infection. The need to place the NKT cell/mTOR axis in a larger context of other important mechanisms is unsurprising, given the complexity of post-sepsis immunosuppression, which spans many immune cell types. Furthermore, the role of mTOR is not limited to immunosuppression. mTOR has pleiotropic effects in other end organs during sepsis, ranging from myocardial dysfunction in clinical sepsis (48) to cognitive impairment in experimental sepsis (49). The effect of the NKT cell/mTOR axis on other sepsis phenotypes is undefined. In another caveat, we focused on the effect of iNKT cells on macrophage function. Given the well-established role of macrophages in clearance of Candida infection, it is likely that the immunosuppressive effects of iNKT cells on macrophages play a key role in the overall response to secondary infection. However, the iNKT cell/mTOR axis likely affects other cell subsets. For example, IFN-γ suppressed production of IL-17A during endotoxemia, which could impair neutrophil recruitment. The immunosuppressive effect of IFN-γ was unexpected, but our findings build on prior reports of immunosuppression by IFN-γ. In influenza and secondary streptococcal pneumonia, IFN-γ suppressed macrophage phagocytosis by downregulating expression of the scavenger receptor MARCO (50, 51). The immunosuppressive mechanisms driven by mTOR and IFN-γ must vary by context, since in our study the expression of surface receptors did not explain impaired phagocytosis.
The role of iNKT cells in clinical sepsis is incompletely defined. In clinical sepsis, an increased percentage of iNKT cells in peripheral circulation correlated with increased mortality in some, but not all, studies (52–54), and mortality due to primary sepsis was not distinguished from secondary infection. The immune system evolved to amplify responses to early infection. However, amplification can be deleterious during the massive inflammation of sepsis. Although maladaptive in sepsis, the immunosuppressive NKT cell/mTOR/IFN-γ axis could be a helpful brake to restore homeostasis in other inflammatory illnesses. Alternatively, a maladaptive NKT cell response may persist because of a lack of evolutionary pressure on sepsis, which has been survivable only in the modern era.
Several approaches could therapeutically target the NKT cell/mTOR/IFN-γ axis. Treatment with lipid antigens can modify iNKT cell function. For example, OCH, an analog of αGalCer, skews iNKT cells toward an NKT2 phenotype and less production of IFN-γ (55, 56). OCH treatment improved survival in a sepsis model (33), but its effect on post-sepsis immunosuppression is unknown. PD-1 and C5a were required for iNKT cell recruitment and activity in sepsis models (57, 58), so these pathways might be targeted. Given the clinical trials of PD-1/PD-L1 blockade in sepsis, understanding the effect of immune checkpoint therapy on innate T cell function may be relevant. Our intervention with rapamycin was within hours after the initiation of sepsis. Very early intervention in sepsis may be clinically feasible. The Surviving Sepsis Campaign guidelines call for clinical interventions, such as antibiotics, within 3 hours of sepsis onset (59). In summary, we demonstrated that an iNKT cell/mTOR/IFN-γ axis determines macrophage dysfunction and susceptibility to opportunistic infection during sepsis. Targeting this axis may be a therapeutic approach to post-sepsis immunosuppression.
Methods
Experimental design.
Sample size was determined by power calculations (significance 5%, power 80%). Estimated effect size was based on preliminary experiments. All data are included. The primary endpoints (e.g., IFN-γ plasma levels) were prospectively selected. Statistical corrections were applied for multiple comparisons.
The clinical study used patient registries described in the next section. The experimental mouse models were laboratory experiments with control and intervention arms. Assays measured transcription (RNA-Seq, quantitative PCR), survival, Candida CFU, in vivo phagocytosis of zymosan, and protein expression by flow cytometry. The clinical study was not an interventional trial, and so the subjects were not randomized. The mouse models had mice randomly assigned to groups. The clinical studies were blinded for the personnel measuring the results. Experiments were repeated at least once, unless otherwise noted. Data represent biological replicates (individual human subjects or mice), not technical replicates.
Clinical study design and patient population.
This study used 2 Brigham and Women’s Hospital (BWH) registries of critically ill patients. Patients admitted to the ICU within the past 48 hours were enrolled under 2 clinical research protocols approved by the Partners Healthcare Institutional Review Board: protocols 2008P000495 (n = 563; described in refs. 60, 61) and 2007P000894 (n = 400; described in refs. 62, 63). Patients in these ICU registries were retrospectively reviewed independently by a board-certified pulmonary and critical care attending physician and a board-certified pulmonary and board-eligible critical care fellow physician. The inclusion criteria were (a) enrollment and plasma sample within 48 hours of ICU admission, (b) new diagnosis of sepsis within 48 hours of enrollment, and (c) secondary Candida infection proved by cultures and clinical diagnosis (n = 27). Secondary Candida infection included candidemia (i.e., positive blood cultures) and invasive candidiasis (e.g., positive abdominal drain cultures). Patients were excluded if they lacked primary sepsis (e.g., hemorrhagic shock, n = 4), already had Candida infection (or other fungal infection) at the time of enrollment (primary Candida infection, n = 5; secondary Candida infection, n = 2), or had been transferred from outside the hospital ICU and so did not have early sepsis (n = 3). For 1 patient, the day 1 plasma sample could not be located. After exclusion of these 15 patients, we had 12 patients with primary sepsis and secondary Candida infection. For the comparison cohort, we selected 24 patients listed as having primary sepsis without secondary Candida for a 2:1 control/case ratio (matched for age and absence or presence of hypotension). After independent review by 2 critical care physicians, 5 patients were excluded because their primary event was not sepsis, so our control cohort had 19 patients. Sepsis was defined as a culture-proven or suspected infection that caused organ dysfunction. APACHE II (64) and SOFA (65) assessed disease severity and organ failure, respectively. The plasma drawn at time of enrollment (i.e., early sepsis) was tested for IFN-γ by ELISA (R&D Systems; Abcam) with a limit of detection of 2 pg/mL.
Mice.
We studied 10-week-old mice on a C57BL/6J background, with all strains backcrossed at least 10 generations. Initial experiments used male mice. To confirm that our findings were independent of sex, the experiments shown in Figure 7 used female mice. We confirmed that the effects of NKT cells on phagocytosis were independent of sex in additional experiments with female mice (Figure 4C and Supplemental Figure 12). The Jackson Laboratory provided the initial breeding pairs for these mice: C57BL/6J mice, Ifng–/– mice [IFN-γ–KO; C.129S7(B6)-Ifng(tm1Ts)/J], Il17a–/– mice (IL-17A–KO; C57BL/6Il17<atm1Bcgen>/J), and Il22–/– mice [IL-22–KO; C57BL/6-Il22<tm1.1(icre)Stck>/J]. Cd1d1–/– (CD1d-KO; B6.129S6-Cd1d1/Cd1d2tm1Spb/J) mice and Ja18–/– (Jα18-KO; B6.129S6-Tcra-Jtm1Tgi/J) mice were provided by Mark Exley (Beth Israel Deaconess Medical Center and Harvard Medical School, Boston, Massachusetts, USA). Mice were bred and cohoused in specific pathogen–free animal facilities at the BWH Center for Comparative Medicine on protocols approved by the BWH IACUC. For the endotoxemia, αGalCer, and cecal slurry peritonitis models, the mice did not undergo a surgical procedure and so were not given periprocedural analgesia. The mice were monitored daily (or twice per day if ill) for morbidity (i.e., loss of righting reflex, abnormal posture, rough hair coat, increased skin turgor, difficulty with ambulation, decreased food or water intake, skin lesions or wounds, or abnormal respiration). If showing morbidity or greater than 20% weight loss, the mice were humanely euthanized by ketamine/xylazine i.p. anesthesia followed by cervical dislocation. Actual death was not used as an endpoint. The IACUC approved observation without analgesia or opiates.
Mouse models of endotoxemia, αGalCer treatment, sepsis, and secondary candidemia.
For endotoxemia, mice were treated i.v. with ultrapure LPS from E. coli O111:B4 (InvivoGen) at 2 mg/kg body weight. To selectively activate iNKT cells, αGalCer lipid antigen (Avanti Polar Lipids) was resuspended in DMSO, diluted to 10% (vol/vol) in PBS, and sonicated. Mice were treated i.p. with 1 μg αGalCer. For cecal slurry peritonitis, cecal slurry was prepared from the cecal feces of C57BL/6J male mice as described by Starr et al. (40). One gram feces was diluted with HBSS and filtered; glycerol was added to a final concentration of 16.7%; and the slurry was frozen in an insulated container with a final concentration of 267 mg feces/mL. The equivalent of 1.3 mg feces/g body weight was injected i.p. Antibiotics (ceftriaxone 25 μg and metronidazole 12.5 μg/g body weight; ref. 66) and 0.5 mL warmed normal saline were administered i.p. at 3, 24, and 48 hours after cecal slurry.
Eighteen hours after endotoxemia, αGalCer administration, or cecal slurry peritonitis (unless otherwise noted), mice were treated with Candida albicans i.v. at 2 × 10⁴ CFU (strain SC5314, ATCC). This is a lower-dose Candida i.v. infection with 90%–100% survival when given alone to WT mice. C. albicans was grown to log phase in YPD media (67) and washed in HBSS. For antibody blockade of IFN-γ, mice were treated with InVivo rat anti–mouse IFN-γ mAb (clone XMG1.2) or InVivo rat IgG1 isotype control mAb at 250 μg i.p. at 3 hours after endotoxemia (ultralow endotoxin grade; Bio X Cell). Mice were treated with rapamycin (LC Laboratories) 150 μg i.p. or vehicle at 3 and 15 hours after the primary insult and then treated 18 hours after the primary insult with Candida i.v.
Cell isolation for ex vivo assays.
For splenocyte isolation, the spleen was injected with 100 μL PBS, chopped, and then passed through a 70-μm cell strainer. RBCs were lysed by ACK lysing buffer (Thermo Fisher Scientific) for 3 minutes on ice. Blood was aspirated from the right ventricle and then RBCs lysed. For kidney, the right ventricle was perfused with 1 mL of ice-cold PBS and then the left kidney resected. After fine chopping, the kidney was digested in collagenase 1 (1.5 mg/mL; Worthington Biochemical), DNase I (100 U/mL; Thermo Fisher Scientific), and hyaluronidase (20 μg/mL; Worthington Biochemical) at 37°C for 30 minutes with aspiration of dissociated cells and replacement of media after 15 minutes and gentle agitation throughout (adapted from ref. 68) and then filtered through a 70-μm cell strainer.
RNA sequencing.
RNA-Seq data were uploaded to the NCBI’s Gene Expression Omnibus database (GSE143943). Splenic Ly6c+ macrophages (CD11b+F4/80+), Ly6c– macrophages, iNKT cells, γδ T cells, and NK cells from WT mice were isolated in TRIzol (Life Technologies) by 2 successive flow cytometry sorts to greater than 95% purity. Lysate from 1000 cells was processed for low-input RNA-Seq by the Immunological Genome Project protocol (www.immgen.org). Reads were mapped to the mouse genome (mm10) using HISAT 0.1.6-beta (69). BAM files were sorted and indexed by SAMtools 1.2 (70). Assembly, quantification, and normalization were performed using CuffLinks 1.2 (71), according to the Tuxedo pipeline (72). A merged transcriptome constructed from all samples of all data sets was used as a reference annotation for quantification (by CuffQuant) and normalization (by CuffNorm). Normalized fragments per kilobase of exon per million reads mapped (FPKM) values that were lower than 1 were replaced by 1, and all values were log2-transformed. To reduce noise and maximize power, only genes with a log2 expression higher than 7 (noise threshold) in at least 2 samples (minimal number of replicates in each cell type) were considered expressed and included in downstream analyses. The expressed genes were normalized by subtracting the mean and dividing by SD for each gene. K-means clustering was done by MATLAB command kmeans with parameter EmptyAction set to “drop - Remove any clusters that become empty.” Functional enrichment of the genes in each k-means cluster for each set of genes in msigDB was calculated using the hypergeometric distribution, with a background of all the genes in all clusters (73–75). A Benjamini-Hochberg false discovery rate (FDR) threshold of 0.1 across all clusters and sets was used (76).
The transcriptome of splenic Ly6c+ macrophages from WT mice at 3 and 18 hours after endotoxemia was compared with the transcriptome of bone marrow–derived macrophages at 2 hours (19) and 18 hours (18) after treatment in vitro with IFN-γ. For Ly6c+ macrophages during endotoxemia, we selected the 11,980 genes for which log2(expression value) was greater than 3 for at least 2 samples. Fold change over naive was calculated for the 3 and 18 hours post-LPS time points. The fold change of genes at 3 hours after LPS was compared with the fold change of genes from a previously published data set of genes upregulated at 2 hours after IFN-γ in vitro compared with untreated (GSE84517) (19). There are 24,422 genes in this data set, 9384 of which were also measured in our data set. These 9384 genes served as background for the calculation of intersection significance. The 18-hour fold change was compared with published data of fold change at 18 hours after IFN-γ treatment in vitro (GSE60290) (18). There are 11,800 genes in this data set. The 5170 genes measured in both data sets were background for the intersection significance calculation. Hypergeometric probability density function was used to estimate whether the size of the intersection between the genes whose absolute fold change was 2 in LPS and those whose absolute fold change was 2 in IFN-γ was bigger than expected by chance.
Flow cytometry.
Cells were incubated with Fc receptor–blocking antibody (14-0161-82, eBioscience/Thermo Fisher Scientific) and fixable viability dye eFluor 780 (eBioscience/Thermo Fisher Scientific) in DMEM with 2% FBS for 15 minutes at 4°C. Cells were incubated with mouse-specific antibodies for 30 minutes at 4°C. For intracellular staining of phospho-S6, cells were fixed and permeabilized with the FoxP3/Transcription Factor Staining Buffer Set (eBioscience, Thermo Fisher Scientific). For intracellular staining for cytokines or CD68, cells were fixed with 4% paraformaldehyde and then permeabilized with permeability buffer (Thermo Fisher Scientific). Spherotech AccuCount Fluorescent particles were added to count cell number. Data were acquired on a BD Fortessa flow cytometer using FACSDiva software and analyzed by FlowJo 10.4.2 software. Cell subsets were defined by FSC/SSC, CD45+viability dye–, and as follows: iNKT cells (TCRβ+CD1d tetramer+γδ TCR–CD19–), γδ T cells (γδ TCR+TCRβ–CD19–), NK cells (NK1.1+CD127[IL-7R]–TCRβ–γδ TCR–CD19–), NK1.1+ ILCs (NK1.1+CD127[IL-7R]+TCRβ–γδ TCR–CD19–), NK1.1– ILCs (NK1.1–CD127[IL-7R]+TCRβ–γδ TCR–CD19–), CD4–CD8– T cells (TCRβ+γδ TCR–CD19–CD4–CD8–), CD8+ T cells (TCRβ+γδ TCR–CD19–CD4–CD8+), CD4+ T cells (TCRβ+γδ TCR–CD19–CD4+CD8–), Ly6c+ macrophages (Ly6c+CD68+CD11b+F4/80+Ly6g[clone 1A8]–), Ly6c– macrophages (Ly6c–CD68+CD11b+F4/80+Ly6g[clone 1A8]–), and neutrophils (CD11b+Ly6g[clone 1A8]+).
Recombinant CD1d tetramer loaded with PBS-57, an analog of αGalCer, was provided by the NIH Tetramer Facility. Anti-CD45 (clone 30-F11), anti-CD69 (FN50), anti-CD127 (A019D5), anti-CD4 (RM4-5), anti-CD8a (53-6.7), anti-TCRβ (H57-597), anti-Ter119 (TER-119), anti-F4/80 (BM8), anti-CD19 (ID3), anti–γδ TCR (GL3), anti-CD3ε (500A2), anti-Ly6g (1A8), anti-Ly6c (HK1.4), anti-CD68 (FA-11), and anti-CD11b (M1/70) were from BioLegend. Anti–phospho-S6 ribosomal protein Ser240/244 (D68F8) mAb was from Cell Signaling Technology.
Quantitative PCR.
Single-cell suspensions were sorted by flow cytometry into TRIzol or total splenocytes were lysed into TRIzol (Life Technologies/Thermo Fisher Scientific). Lysate was passed through QIAShredder (Qiagen) and then mixed with chloroform (5:1). The upper aqueous phase was mixed 1:1 with 70% EtOH. RNA was extracted by RNeasy Mini Kits (Qiagen). cDNA was prepared using Quantitect RT-PCR (Qiagen) for TaqMan Gene Expression Assays run on an AriaMx (Agilent). Relative expression was normalized to the housekeeping gene Hprt. For Figure 3C, total relative Ifng mRNA units was calculated for each cell type without normalization to Hprt. Primer/probe sets from Life Technologies were Hprt (Mm03024075_m1) and Ifng (Mm01168134_m1).
In vivo phagocytosis.
FITC-conjugated zymosan A from Saccharomyces cerevisiae (Thermo Fisher Scientific) was opsonized with Zymosan A BioParticles Opsonizing Reagent (Thermo Fisher Scientific) — a rabbit polyclonal IgG antibody. Thirty minutes after mice were injected with opsonized zymosan 0.2 mg i.v., organs were harvested and macrophages analyzed by flow cytometry for ingestion of zymosan. For Supplemental Figure 12, non-opsonized FITC-conjugated bioparticles of zymosan A, E. coli, and S. aureus (Thermo Fisher Scientific) were used.
Ex vivo Candida CFU measurement.
Kidneys were resected, mechanically dissociated in HBSS, and incubated overnight on YPD plates.
IFN-γ and IL-17A.
For assessment of in vivo cytokine production by splenocytes (77), 3 hours after primary insult, mice were treated with brefeldin A 250 μg i.p. (LC Laboratories). After 6 hours, mice were sacrificed and cells harvested for cytokine assessment by intracellular flow cytometry. For blood and kidney, brefeldin was not given in vivo. Instead, cells were incubated in vitro with PMA/ionomycin/brefeldin A (Cell Stimulation Cocktail, eBioscience) for 4 hours at 37°C and analyzed by flow cytometry.
Statistics.
For survival curves, data were analyzed by log-rank. For other assays (e.g., phagocytosis), data were assessed for normality by the Shapiro-Wilk test. If data were normal, 1-way ANOVA was used if more than 2 groups were compared, and 2-tailed, unpaired Student’s t test was used if 2 groups were compared. For non-normal data, Kruskal-Wallis test was used if more than 2 groups were compared, and Mann-Whitney test was used if 2 groups were compared. For all analyses, α equals 0.05, and P values less than 0.05 are significant unless corrected for multiple comparisons. All data are representative of 2 or more experiments unless noted. For continuous variables, normally distributed data are represented as mean ± SEM, and skewed data shown as median (interquartile range). Survival curves are Kaplan-Meier curves. GraphPad Prism 8.3.0 was used.
Study approval.
The Brigham and Women’s Hospital IACUC approved our mouse studies in accordance with the NIH Guide for the Care and Use of Laboratory Animals (National Academies Press, 2011) and our institution’s American Association for Laboratory Animal Science certification. All human studies were approved by the Partners Healthcare Institutional Review Board (Boston, Massachusetts, USA). For human studies, informed consent was received from participants or legal surrogates before inclusion in the study.
Author contributions
EYK and MBB conceived and supervised the project and wrote the manuscript. EYK, AMC, JG, JC, AAR, and TT designed, performed, and analyzed experiments. HNG performed RNA-Seq analysis (supervised by TS). DBB, AH, MPV, SAPS, and JV enrolled patients, isolated clinical plasma, and analyzed clinical data (supervised by RMB, DEL, or EYK).
Supplementary Material
Acknowledgments
Sushrut S. Waikar (BWH/Harvard Medical School) provided access to clinical cohorts. Bing Lu (BWH/Harvard Medical School) provided independent statistical review. The NIH Tetramer Core Facility provided CD1d tetramers. Adam T. Chicoine (BWH Human Immunology Center) provided flow cytometry expertise. Christophe Benoist and the Immunological Genome Project provided technical support. This work was supported by American Heart Association Award 2014D007100 (to EYK), NIH grant 5T32HL007633 (to EYK), and NIH grant R24-AI072073 to the Immunological Genome Project.
Version 1. 03/10/2020
In-Press Preview
Version 2. 05/11/2020
Electronic publication
Version 3. 06/01/2020
Print issue publication
Footnotes
Conflict of interest: The authors have declared that no conflict of interest exists.
Copyright: © 2020, American Society for Clinical Investigation.
Reference information: J Clin Invest. 2020;130(6):3238–3252.https://doi.org/10.1172/JCI128075.
Contributor Information
Edy Y. Kim, Email: edyyongkim@gmail.com.
Hadas Ner-Gaon, Email: nergaon@bgu.ac.il.
Jack Varon, Email: jvaron1@bwh.harvard.edu.
Aidan M. Cullen, Email: amcullen@bwh.harvard.edu.
Jingyu Guo, Email: guojy54321@gmail.com.
Jiyoung Choi, Email: lizchoi807@gmail.com.
Diana Barragan-Bradford, Email: dbarraganbradford@partners.org.
Angelica Higuera, Email: angelica.hmo@gmail.com.
Mayra Pinilla-Vera, Email: mapinillavera@bwh.harvard.edu.
Samuel A.P. Short, Email: samuel.short@med.uvm.edu.
Tomoyoshi Tamura, Email: ttamura3@bwh.harvard.edu.
David E. Leaf, Email: deleaf@bwh.harvard.edu.
Rebecca M. Baron, Email: rbaron@partners.org.
Tal Shay, Email: talshay@bgu.ac.il.
Michael B. Brenner, Email: mbrenner@rics.bwh.harvard.edu.
References
- 1.Gaieski DF, Edwards JM, Kallan MJ, Carr BG. Benchmarking the incidence and mortality of severe sepsis in the United States. Crit Care Med. 2013;41(5):1167–1174. doi: 10.1097/CCM.0b013e31827c09f8. [DOI] [PubMed] [Google Scholar]
- 2.Hotchkiss RS, Monneret G, Payen D. Sepsis-induced immunosuppression: from cellular dysfunctions to immunotherapy. Nat Rev Immunol. 2013;13(12):862–874. doi: 10.1038/nri3552. [DOI] [PMC free article] [PubMed] [Google Scholar]
- 3.Daviaud F, et al. Timing and causes of death in septic shock. Ann Intensive Care. 2015;5(1):16. doi: 10.1186/s13613-015-0058-8. [DOI] [PMC free article] [PubMed] [Google Scholar]
- 4.Calandra T, Roberts JA, Antonelli M, Bassetti M, Vincent JL. Diagnosis and management of invasive candidiasis in the ICU: an updated approach to an old enemy. Crit Care. 2016;20(1):125. doi: 10.1186/s13054-016-1313-6. [DOI] [PMC free article] [PubMed] [Google Scholar]
- 5.Munoz C, Carlet J, Fitting C, Misset B, Blériot JP, Cavaillon JM. Dysregulation of in vitro cytokine production by monocytes during sepsis. J Clin Invest. 1991;88(5):1747–1754. doi: 10.1172/JCI115493. [DOI] [PMC free article] [PubMed] [Google Scholar]
- 6.Boomer JS, et al. Immunosuppression in patients who die of sepsis and multiple organ failure. JAMA. 2011;306(23):2594–2605. doi: 10.1001/jama.2011.1829. [DOI] [PMC free article] [PubMed] [Google Scholar]
- 7.Döcke WD, et al. Monocyte deactivation in septic patients: restoration by IFN-gamma treatment. Nat Med. 1997;3(6):678–681. doi: 10.1038/nm0697-678. [DOI] [PubMed] [Google Scholar]
- 8.Kox WJ, et al. Interferon γ-1b in the treatment of compensatory anti-inflammatory response syndrome. A new approach: proof of principle. Arch Intern Med. 1997;157(4):389–393. [PubMed] [Google Scholar]
- 9.Leentjens J, et al. Reversal of immunoparalysis in humans in vivo: a double-blind, placebo-controlled, randomized pilot study. Am J Respir Crit Care Med. 2012;186(9):838–845. doi: 10.1164/rccm.201204-0645OC. [DOI] [PubMed] [Google Scholar]
- 10.Brennan PJ, Brigl M, Brenner MB. Invariant natural killer T cells: an innate activation scheme linked to diverse effector functions. Nat Rev Immunol. 2013;13(2):101–117. doi: 10.1038/nri3369. [DOI] [PubMed] [Google Scholar]
- 11.Osuchowski MF, et al. Minimum Quality Threshold in Pre-Clinical Sepsis Studies (MQTiPSS): an international expert consensus initiative for improvement of animal modeling in sepsis. Shock. 2018;50(4):377–380. doi: 10.1097/SHK.0000000000001212. [DOI] [PMC free article] [PubMed] [Google Scholar]
- 12.Epelbaum O, Chasan R. Candidemia in the intensive care unit. Clin Chest Med. 2017;38(3):493–509. doi: 10.1016/j.ccm.2017.04.010. [DOI] [PubMed] [Google Scholar]
- 13.Tang HJ, Liu WL, Lin HL, Lai CC. Clinical manifestations and prognostic factors of central line-associated candidemia. Am J Infect Control. 2014;42(11):1238–1240. doi: 10.1016/j.ajic.2014.07.015. [DOI] [PubMed] [Google Scholar]
- 14.McCarty TP, Pappas PG. Invasive candidiasis. Infect Dis Clin North Am. 2016;30(1):103–124. doi: 10.1016/j.idc.2015.10.013. [DOI] [PubMed] [Google Scholar]
- 15.Lionakis MS, Lim JK, Lee CC, Murphy PM. Organ-specific innate immune responses in a mouse model of invasive candidiasis. J Innate Immun. 2011;3(2):180–199. doi: 10.1159/000321157. [DOI] [PMC free article] [PubMed] [Google Scholar]
- 16.Domínguez-Andrés J, Feo-Lucas L, Minguito de la Escalera M, González L, López-Bravo M, Ardavín C. Inflammatory Ly6Chigh monocytes protect against Candidiasis through IL-15-driven NK cell/neutrophil activation. Immunity. 2017;46(6):1059–1072.e4. doi: 10.1016/j.immuni.2017.05.009. [DOI] [PubMed] [Google Scholar]
- 17.Lavigne LM, Schopf LR, Chung CL, Maylor R, Sypek JP. The role of recombinant murine IL-12 and IFN-γ in the pathogenesis of a murine systemic Candida albicans infection. J Immunol. 1998;160(1):284–292. [PubMed] [Google Scholar]
- 18.Hoeksema MA, et al. IFN-γ priming of macrophages represses a part of the inflammatory program and attenuates neutrophil recruitment. J Immunol. 2015;194(8):3909–3916. doi: 10.4049/jimmunol.1402077. [DOI] [PubMed] [Google Scholar]
- 19.Piccolo V, et al. Opposing macrophage polarization programs show extensive epigenomic and transcriptional cross-talk. Nat Immunol. 2017;18(5):530–540. doi: 10.1038/ni.3710. [DOI] [PMC free article] [PubMed] [Google Scholar]
- 20.Klose CSN, et al. Differentiation of type 1 ILCs from a common progenitor to all helper-like innate lymphoid cell lineages. Cell. 2014;157(2):340–356. doi: 10.1016/j.cell.2014.03.030. [DOI] [PubMed] [Google Scholar]
- 21.MacCallum DM. Massive induction of innate immune response to Candida albicans in the kidney in a murine intravenous challenge model. FEMS Yeast Res. 2009;9(7):1111–1122. doi: 10.1111/j.1567-1364.2009.00576.x. [DOI] [PMC free article] [PubMed] [Google Scholar]
- 22.Spellberg B, Ibrahim AS, Edwards JE, Filler SG. Mice with disseminated candidiasis die of progressive sepsis. J Infect Dis. 2005;192(2):336–343. doi: 10.1086/430952. [DOI] [PubMed] [Google Scholar]
- 23.Cohen NR, Garg S, Brenner MB. Antigen presentation by CD1 lipids, T cells, and NKT cells in microbial immunity. Adv Immunol. 2009;102:1–94. doi: 10.1016/S0065-2776(09)01201-2. [DOI] [PubMed] [Google Scholar]
- 24.Park H, et al. A distinct lineage of CD4 T cells regulates tissue inflammation by producing interleukin 17. Nat Immunol. 2005;6(11):1133–1141. doi: 10.1038/ni1261. [DOI] [PMC free article] [PubMed] [Google Scholar]
- 25.Harrington LE, et al. Interleukin 17-producing CD4+ effector T cells develop via a lineage distinct from the T helper type 1 and 2 lineages. Nat Immunol. 2005;6(11):1123–1132. doi: 10.1038/ni1254. [DOI] [PubMed] [Google Scholar]
- 26.Villarino AV, Gallo E, Abbas AK. STAT1-activating cytokines limit Th17 responses through both T-bet-dependent and -independent mechanisms. J Immunol. 2010;185(11):6461–6471. doi: 10.4049/jimmunol.1001343. [DOI] [PMC free article] [PubMed] [Google Scholar]
- 27.Liu L, et al. Gain-of-function human STAT1 mutations impair IL-17 immunity and underlie chronic mucocutaneous candidiasis. J Exp Med. 2011;208(8):1635–1648. doi: 10.1084/jem.20110958. [DOI] [PMC free article] [PubMed] [Google Scholar]
- 28.Chu CQ, Swart D, Alcorn D, Tocker J, Elkon KB. Interferon-gamma regulates susceptibility to collagen-induced arthritis through suppression of interleukin-17. Arthritis Rheum. 2007;56(4):1145–1151. doi: 10.1002/art.22453. [DOI] [PubMed] [Google Scholar]
- 29.Benoist C, Lanier L, Merad M, Mathis D, Immunological Genome Project Consortium biology in immunology: the perspective from the Immunological Genome Project. Nat Rev Immunol. 2012;12(10):734–740. doi: 10.1038/nri3300. [DOI] [PubMed] [Google Scholar]
- 30.Goupil M, et al. Defective IL-17- and IL-22-dependent mucosal host response to Candida albicans determines susceptibility to oral candidiasis in mice expressing the HIV-1 transgene. BMC Immunol. 2014;15:49. doi: 10.1186/s12865-014-0049-9. [DOI] [PMC free article] [PubMed] [Google Scholar]
- 31.Mosci P, et al. Involvement of IL-17A in preventing the development of deep-seated candidiasis from oropharyngeal infection. Microbes Infect. 2014;16(8):678–689. doi: 10.1016/j.micinf.2014.06.007. [DOI] [PubMed] [Google Scholar]
- 32.Redpath NT, Foulstone EJ, Proud CG. Regulation of translation elongation factor-2 by insulin via a rapamycin-sensitive signalling pathway. EMBO J. 1996;15(9):2291–2297. doi: 10.1002/j.1460-2075.1996.tb00582.x. [DOI] [PMC free article] [PubMed] [Google Scholar]
- 33.Holz MK, Ballif BA, Gygi SP, Blenis J. mTOR and S6K1 mediate assembly of the translation preinitiation complex through dynamic protein interchange and ordered phosphorylation events. Cell. 2005;123(4):569–580. doi: 10.1016/j.cell.2005.10.024. [DOI] [PubMed] [Google Scholar]
- 34.Pollizzi KN, et al. Asymmetric inheritance of mTORC1 kinase activity during division dictates CD8(+) T cell differentiation. Nat Immunol. 2016;17(6):704–711. doi: 10.1038/ni.3438. [DOI] [PMC free article] [PubMed] [Google Scholar]
- 35.Donnelly RP, et al. mTORC1-dependent metabolic reprogramming is a prerequisite for NK cell effector function. J Immunol. 2014;193(9):4477–4484. doi: 10.4049/jimmunol.1401558. [DOI] [PMC free article] [PubMed] [Google Scholar]
- 36.Nandagopal N, Ali AK, Komal AK, Lee SH. The critical role of IL-15-PI3K-mTOR pathway in Natural Killer cell effector functions. Front Immunol. 2014;5:187. doi: 10.3389/fimmu.2014.00187. [DOI] [PMC free article] [PubMed] [Google Scholar]
- 37.Covarrubias AJ, Aksoylar HI, Horng T. Control of macrophage metabolism and activation by mTOR and Akt signaling. Semin Immunol. 2015;27(4):286–296. doi: 10.1016/j.smim.2015.08.001. [DOI] [PMC free article] [PubMed] [Google Scholar]
- 38.Fox R, Nhan TQ, Law GL, Morris DR, Liles WC, Schwartz SM. PSGL-1 and mTOR regulate translation of ROCK-1 and physiological functions of macrophages. EMBO J. 2007;26(2):505–515. doi: 10.1038/sj.emboj.7601522. [DOI] [PMC free article] [PubMed] [Google Scholar]
- 39.Kim EY, et al. Persistent activation of an innate immune response translates respiratory viral infection into chronic lung disease. Nat Med. 2008;14(6):633–640. doi: 10.1038/nm1770. [DOI] [PMC free article] [PubMed] [Google Scholar]
- 40.Starr ME, Steele AM, Saito M, Hacker BJ, Evers BM, Saito H. A new cecal slurry preparation protocol with improved long-term reproducibility for animal models of sepsis. PLoS One. 2014;9(12):e115705. doi: 10.1371/journal.pone.0115705. [DOI] [PMC free article] [PubMed] [Google Scholar]
- 41.Steele AM, Starr ME, Saito H. Late therapeutic intervention with antibiotics and fluid resuscitation allows for a prolonged disease course with high survival in a severe murine model of sepsis. Shock. 2017;47(6):726–734. doi: 10.1097/SHK.0000000000000799. [DOI] [PMC free article] [PubMed] [Google Scholar]
- 42.Wei J, Yang K, Chi H. Cutting edge: Discrete functions of mTOR signaling in invariant NKT cell development and NKT17 fate decision. J Immunol. 2014;193(9):4297–4301. doi: 10.4049/jimmunol.1402042. [DOI] [PMC free article] [PubMed] [Google Scholar]
- 43.Wu J, et al. iNKT cells require TSC1 for terminal maturation and effector lineage fate decisions. J Clin Invest. 2014;124(4):1685–1698. doi: 10.1172/JCI69780. [DOI] [PMC free article] [PubMed] [Google Scholar]
- 44.Shin J, Wang S, Deng W, Wu J, Gao J, Zhong XP. Mechanistic target of rapamycin complex 1 is critical for invariant natural killer T-cell development and effector function. Proc Natl Acad Sci U S A. 2014;111(8):E776–E783. doi: 10.1073/pnas.1315435111. [DOI] [PMC free article] [PubMed] [Google Scholar]
- 45.Zhang L, et al. Mammalian target of rapamycin complex 1 orchestrates invariant NKT cell differentiation and effector function. J Immunol. 2014;193(4):1759–1765. doi: 10.4049/jimmunol.1400769. [DOI] [PubMed] [Google Scholar]
- 46.Cheng SC, et al. mTOR- and HIF-1α-mediated aerobic glycolysis as metabolic basis for trained immunity. Science. 2014;345(6204):1250684. doi: 10.1126/science.1250684. [DOI] [PMC free article] [PubMed] [Google Scholar]
- 47.Han Y, Cutler JE. Antibody response that protects against disseminated candidiasis. Infect Immun. 1995;63(7):2714–2719. doi: 10.1128/IAI.63.7.2714-2719.1995. [DOI] [PMC free article] [PubMed] [Google Scholar]
- 48.Cheng W, Long Y, Wang H, Han W, Zhang J, Cui N. Role of the mTOR signalling pathway in human sepsis-induced myocardial dysfunction. Can J Cardiol. 2019;35(7):875–883. doi: 10.1016/j.cjca.2019.03.022. [DOI] [PubMed] [Google Scholar]
- 49.Liu W, Guo J, Mu J, Tian L, Zhou D. Rapamycin protects sepsis-induced cognitive impairment in mouse hippocampus by enhancing autophagy. Cell Mol Neurobiol. 2017;37(7):1195–1205. doi: 10.1007/s10571-016-0449-x. [DOI] [PMC free article] [PubMed] [Google Scholar]
- 50.Sun K, Metzger DW. Inhibition of pulmonary antibacterial defense by interferon-gamma during recovery from influenza infection. Nat Med. 2008;14(5):558–564. doi: 10.1038/nm1765. [DOI] [PubMed] [Google Scholar]
- 51.Breslow-Deckman JM, et al. Linezolid decreases susceptibility to secondary bacterial pneumonia postinfluenza infection in mice through its effects on IFN-γ. J Immunol. 2013;191(4):1792–1799. doi: 10.4049/jimmunol.1300180. [DOI] [PMC free article] [PubMed] [Google Scholar]
- 52.Anantha RV, et al. T helper type 2-polarized invariant natural killer T cells reduce disease severity in acute intra-abdominal sepsis. Clin Exp Immunol. 2014;178(2):292–309. doi: 10.1111/cei.12404. [DOI] [PMC free article] [PubMed] [Google Scholar]
- 53.Heffernan DS, Monaghan SF, Chung CS, Cioffi WG, Gravenstein S, Ayala A. A divergent response of innate regulatory T-cells to sepsis in humans: circulating invariant natural killer T-cells are preserved. Hum Immunol. 2014;75(3):277–282. doi: 10.1016/j.humimm.2013.11.004. [DOI] [PubMed] [Google Scholar]
- 54.Grimaldi D, et al. Specific MAIT cell behaviour among innate-like T lymphocytes in critically ill patients with severe infections. Intensive Care Med. 2014;40(2):192–201. doi: 10.1007/s00134-013-3163-x. [DOI] [PubMed] [Google Scholar]
- 55.Miyamoto K, Miyake S, Yamamura T. A synthetic glycolipid prevents autoimmune encephalomyelitis by inducing TH2 bias of natural killer T cells. Nature. 2001;413(6855):531–534. doi: 10.1038/35097097. [DOI] [PubMed] [Google Scholar]
- 56.Yu KO, et al. Modulation of CD1d-restricted NKT cell responses by using N-acyl variants of α-galactosylceramides. Proc Natl Acad Sci U S A. 2005;102(9):3383–3388. doi: 10.1073/pnas.0407488102. [DOI] [PMC free article] [PubMed] [Google Scholar]
- 57.Heffernan DS, et al. Inflammatory mechanisms in sepsis: elevated invariant natural killer T-cell numbers in mouse and their modulatory effect on macrophage function. Shock. 2013;40(2):122–128. doi: 10.1097/SHK.0b013e31829ca519. [DOI] [PMC free article] [PubMed] [Google Scholar]
- 58.Fusakio ME, Mohammed JP, Laumonnier Y, Hoebe K, Köhl J, Mattner J. C5a regulates NKT and NK cell functions in sepsis. J Immunol. 2011;187(11):5805–5812. doi: 10.4049/jimmunol.1100338. [DOI] [PMC free article] [PubMed] [Google Scholar]
- 59.Rhodes A, et al. Surviving Sepsis Campaign: International Guidelines for Management of Sepsis and Septic Shock 2016. Crit Care Med. 2017;45(3):486–552. doi: 10.1097/CCM.0000000000002255. [DOI] [PubMed] [Google Scholar]
- 60.Dolinay T, et al. Inflammasome-regulated cytokines are critical mediators of acute lung injury. Am J Respir Crit Care Med. 2012;185(11):1225–1234. doi: 10.1164/rccm.201201-0003OC. [DOI] [PMC free article] [PubMed] [Google Scholar]
- 61.Rogers AJ, et al. Metabolomic derangements are associated with mortality in critically ill adult patients. PLoS One. 2014;9(1):e87538. doi: 10.1371/journal.pone.0087538. [DOI] [PMC free article] [PubMed] [Google Scholar]
- 62.Leaf DE, et al. Fibroblast growth factor 23 levels associate with AKI and death in critical illness. J Am Soc Nephrol. 2017;28(6):1877–1885. doi: 10.1681/ASN.2016080836. [DOI] [PMC free article] [PubMed] [Google Scholar]
- 63.Leaf DE, Croy HE, Abrahams SJ, Raed A, Waikar SS. Cathelicidin antimicrobial protein, vitamin D, and risk of death in critically ill patients. Crit Care. 2015;19:80. doi: 10.1186/s13054-015-0812-1. [DOI] [PMC free article] [PubMed] [Google Scholar]
- 64.Knaus WA, Draper EA, Wagner DP, Zimmerman JE. APACHE II: a severity of disease classification system. Crit Care Med. 1985;13(10):818–829. doi: 10.1097/00003246-198510000-00009. [DOI] [PubMed] [Google Scholar]
- 65.Vincent JL, et al. The SOFA (Sepsis-related Organ Failure Assessment) score to describe organ dysfunction/failure. On behalf of the Working Group on Sepsis-Related Problems of the European Society of Intensive Care Medicine. Intensive Care Med. 1996;22(7):707–710. doi: 10.1007/BF01709751. [DOI] [PubMed] [Google Scholar]
- 66.Jung E, et al. Cecal ligation and puncture followed by methicillin-resistant Staphylococcus aureus pneumonia increases mortality in mice and blunts production of local and systemic cytokines. Shock. 2012;37(1):85–94. doi: 10.1097/SHK.0b013e3182360faf. [DOI] [PMC free article] [PubMed] [Google Scholar]
- 67. Du C, Calderone RA. Phagocytosis and killing assays for Candida species. In: Cihlar RL, Calderone RA, eds. Candida albicans: Methods and Protocols. Totowa, New Jersey, USA: Springer; 2009:17–26. [DOI] [PubMed] [Google Scholar]
- 68.Adam M, Potter AS, Potter SS. Psychrophilic proteases dramatically reduce single-cell RNA-seq artifacts: a molecular atlas of kidney development. Development. 2017;144(19):3625–3632. doi: 10.1242/dev.151142. [DOI] [PMC free article] [PubMed] [Google Scholar]
- 69.Kim D, Langmead B, Salzberg SL. HISAT: a fast spliced aligner with low memory requirements. Nat Methods. 2015;12(4):357–360. doi: 10.1038/nmeth.3317. [DOI] [PMC free article] [PubMed] [Google Scholar]
- 70.Li H, et al. The Sequence Alignment/Map format and SAMtools. Bioinformatics. 2009;25(16):2078–2079. doi: 10.1093/bioinformatics/btp352. [DOI] [PMC free article] [PubMed] [Google Scholar]
- 71.Trapnell C, et al. Transcript assembly and quantification by RNA-Seq reveals unannotated transcripts and isoform switching during cell differentiation. Nat Biotechnol. 2010;28(5):511–515. doi: 10.1038/nbt.1621. [DOI] [PMC free article] [PubMed] [Google Scholar]
- 72.Trapnell C, et al. Differential gene and transcript expression analysis of RNA-seq experiments with TopHat and Cufflinks. Nat Protoc. 2012;7(3):562–578. doi: 10.1038/nprot.2012.016. [DOI] [PMC free article] [PubMed] [Google Scholar]
- 73.Liberzon A, Subramanian A, Pinchback R, Thorvaldsdóttir H, Tamayo P, Mesirov JP. Molecular signatures database (MSigDB) 3.0. Bioinformatics. 2011;27(12):1739–1740. doi: 10.1093/bioinformatics/btr260. [DOI] [PMC free article] [PubMed] [Google Scholar]
- 74.Liberzon A, Birger C, Thorvaldsdóttir H, Ghandi M, Mesirov JP, Tamayo P. The Molecular Signatures Database (MSigDB) hallmark gene set collection. Cell Syst. 2015;1(6):417–425. doi: 10.1016/j.cels.2015.12.004. [DOI] [PMC free article] [PubMed] [Google Scholar]
- 75.Subramanian A, et al. Gene set enrichment analysis: a knowledge-based approach for interpreting genome-wide expression profiles. Proc Natl Acad Sci U S A. 2005;102(43):15545–15550. doi: 10.1073/pnas.0506580102. [DOI] [PMC free article] [PubMed] [Google Scholar]
- 76.Benjamini Y, Hochberg Y. Controlling the false discovery rate: a practical and powerful approach to multiple testing. J Royal Stat Soc. 1995;57(1):289–300. [Google Scholar]
- 77.Liu F, Whitton JL. Cutting edge: Re-evaluating the in vivo cytokine responses of CD8+ T cells during primary and secondary viral infections. J Immunol. 2005;174(10):5936–5940. doi: 10.4049/jimmunol.174.10.5936. [DOI] [PubMed] [Google Scholar]
Associated Data
This section collects any data citations, data availability statements, or supplementary materials included in this article.