

Abstract
Glioblastoma multiforme (GBM) contains a subpopulation of cells, GBM stem cells (GSCs), that maintain the bulk tumor and represent a key therapeutic target. Norrin is a Wnt ligand that binds Frizzled class receptor 4 (FZD4) to activate canonical Wnt signaling. Although Norrin, encoded by NDP, has a well-described role in vascular development, its function in human tumorigenesis is largely unexplored. Here, we show that NDP expression is enriched in neurological cancers, including GBM, and its levels positively correlated with survival in a GBM subtype defined by low expression of ASCL1, a proneural factor. We investigated the function of Norrin and FZD4 in GSCs and found that it mediated opposing tumor-suppressive and -promoting effects on ASCL1lo and ASCL1hi GSCs. Consistent with a potential tumor-suppressive effect of Norrin suggested by the tumor outcome data, we found that Norrin signaling through FZD4 inhibited growth in ASCL1lo GSCs. In contrast, in ASCL1hi GSCs Norrin promoted Notch signaling, independently of WNT, to promote tumor progression. Forced ASCL1 expression reversed the tumor-suppressive effects of Norrin in ASCL1lo GSCs. Our results identify Norrin as a modulator of human brain cancer progression and reveal an unanticipated Notch-mediated function of Norrin in regulating cancer stem cell biology. This study identifies an unanticipated role of Norrin in human brain cancer progression. In addition, we provide preclinical evidence suggesting Norrin and canonical Wnt signaling as potential therapeutic targets for GBM subtype–restricted cancer stem cells.
Keywords: Oncology, Stem cells
Keywords: Brain cancer, Neuronal stem cells, Oncogenes

Introduction
Glioblastoma multiforme (GBM) is the most common malignant brain cancer in adults (1, 2). Consistent with its progressive nature, GBM remains significantly refractory to current therapeutic strategies (3, 4). Temozolomide is the main chemotherapeutic agent for the management of GBM; however, it has been shown to be beneficial in a small subset of patients and usually only induces transient effects (5–7). Despite the urgent need for new treatment approaches for GBM, developing such therapies is challenging due to the complex biology of GBM, the difficulty in delivering drugs across the blood-brain barrier, and the remarkable heterogeneity of GBM tumors (8–10).
GBMs contain a subpopulation of cells with neural stem cell–like (NSC-like) properties, GBM stem cells (GSCs) (11–14), that can propagate tumors and are thought to be the source of tumor recurrence and treatment resistance (15, 16). Thus, targeting the GSC population presents a potentially effective therapeutic approach to overcome the problems facing traditional GBM therapies (17, 18). To achieve this end, a better understanding of GSC biology is required. The Wingless (Wnt) signaling pathway is a major regulator of stem cell growth in normal and tumorigenic contexts (19–21) and several Wnt pathway components are reported to regulate GBM progression through effects on GSCs (22). Surprisingly, both inhibition and activation of Wnt signaling have been proposed as therapeutic strategies in GBM (22–26). Although this discrepancy can be attributed in part to different culture systems, models, and experimental conditions used in the different studies, these variable results also highlight the complexity of the Wnt pathway and GBM biology.
Norrin, the protein product of the Norrie disease protein (NDP) gene, is an atypical Wnt ligand that binds the Frizzled class receptor 4 (FZD4) and low-density lipoprotein receptor–related protein 5 (LRP5) receptor complex in the presence of tetraspanin 12 (TSPAN12) to activate canonical (β-catenin–dependent) Wnt signaling (27–29). Activation of the Norrin/FZD4 signaling axis in endothelial cells has a well-described role in regulating angiogenesis and blood-brain barrier formation in the cortex, cerebellum, retina, and inner ear (30–33). Paracrine Norrin/FZD4 signaling extends to tumorigenesis, as activation of this pathway in the endothelium has recently been shown to inhibit medulloblastoma initiation in mice (34). More recently, Norrin has been implicated in astroglial regulation of neuronal function in the cortex, pointing to a role for Norrin beyond the vasculature (35). However, direct evidence for a functional role for Norrin/FZD4 in human brain tumor progression is lacking.
In this study, we show that NDP is widely expressed in a range of neurological and nonneurological cancers, and its expression level correlates with patient survival in neurological cancers. Our in vitro and in vivo analyses using human fetal NSCs (hNSCs) and primary patient-derived GSCs reveals an endothelial cell–independent role for NDP in regulating GSC proliferation, cell cycle progression, and tumorigenicity. Interestingly, our data show that NDP function and the growth-modulatory effects of canonical Wnt signaling stratify based on GBM molecular subtype as defined by ASCL1 expression level, highlighting the importance of targeted therapy informed by molecular subtyping of tumor cells. In addition, we reveal a previously unexplored aspect of Norrin signaling, which is mediated through Notch, to maintain stemness of GSCs.
Results
NDP expression is enriched in GBM and correlates with survival in neurological cancers.
To survey the distribution of NDP expression in human tissues, we queried the human protein atlas (HPA, www.proteinatlas.org) (36), and found that NDP expression, but not that of its receptor FZD4, is enriched in several tissues, including the brain and cerebellum (Supplemental Figure 1A; supplemental material available online with this article; https://doi.org/10.1172/JCI128994DS1). A similar survey of cancer cell lines (CCLE, https://portals.broadinstitute.org/ccle) (37) and primary tumors (The Cancer Genome Atlas [TCGA]), shows that NDP is expressed in a variety of tumor types and is highly enriched in glioma cell lines (Supplemental Figure 1B, boxed) and primary human gliomas, including low-grade glioma (LGG) and GBM (Figure 1A, boxed). In addition, gene set enrichment analysis (GSEA) on GBM showed that NDP expression levels significantly correlate with classical GBM and aging-brain gene sets (Figure 2A). FZD4 is also expressed in different cancer types; however, its expression in GBM is comparable to other cancers (Figure 1B and Supplemental Figure 1, A and B) and not as highly enriched as NDP. The discordance between NDP and FZD4 expression in brain tumors could indicate that NDP, but not FZD4, levels are functionally limiting or that NDP is FZD4 independent. Consistent with the latter possibility, FZD4-independent and nonvascular functions of NDP have been reported in other contexts (38–41).
Figure 1. NDP is expressed in a wide range of cancers, and is enriched in CNS tumors.

(A and B) Analysis of NDP (A) and FZD4 (B) expression levels in primary human tumors from TCGA using the cBioportal web server. NDP expression was significantly enriched in GBM and lower-grade glioma relative to the average of all cancer types (upper graph), while FZD4 expression was comparable to other tumor types. ACC, adrenocortical carcinoma; AML, acute myeloid leukemia; DLBC, lymphoid neoplasm diffuse large B cell lymphoma; PCPG, pheochromocytoma and paraganglioma; CS, carcinosarcoma; ccRCC, clear cell renal cell carcinoma; chRCC, chromophobe renal cell carcinoma; pRCC, papillary renal cell carcinoma; VUS, variant of uncertain significance.
Figure 2. NDP is expressed in GSCs and correlates with survival in neurological tumors.

(A) Gene set enrichment analysis reveals correlation between NDP expression and “Glioblastoma Classical” and “Aging Brain” gene sets. (B) Kaplan-Meier analysis correlating NDP expression with patient survival in neurological cancers. (C) Expression of components of the NDP/FZD4 signaling axis in a panel of 9 patient-derived GSCs (left) and 3 primary fetal hNSC lines (right). Blue boxes, ASCL1lo GSC lines; red, ASCL1hi GSC lines indicate the GSC lines selected for functional analysis.
Next, we found that NDP expression correlates with survival in GBM, neuroblastoma, and brain astrocytoma (LGG) (Figure 2B). Because transcriptomic data are derived from whole tissue and tumor samples, they do not resolve the cell-type specificity of gene expression, including expression within the tumor stem cell compartment. Therefore, we analyzed gene expression in hNSCs and primary patient-derived GSCs, which were maintained in vitro using an established GSC culture protocol (42). Quantitative real-time PCR (qRT-PCR) revealed that NDP, FZD4, LRP5, and TSPAN12 are expressed in hNSCs and in the majority of the GSC lines we surveyed (Figure 2C). The enrichment of NDP expression in brain tumors, expression of Norrin/FZD4 signaling components in primary GSCs, and the association between NDP expression level and survival in GBM suggest the possibility that NDP has a function in normal and transformed NSCs.
NDP function stratifies with ASCL1 expression levels.
To investigate the role of NDP and FZD4 in growth and clonogenicity of nontransformed hNSCs and GSCs we generated lentiviral constructs to express gene-specific shRNA oligonucleotides (2/gene) for knockdown, or full-length cDNAs for overexpression. In these and subsequent experiments we confirmed the efficiency of knockdown and overexpression by qRT-PCR and Western blotting, respectively (Supplemental Figure 2). NDP and FZD4 knockdown in 2 hNSC lines significantly inhibited growth, whereas overexpression of these genes had the opposite effect, indicating that activation of the Norrin/FZD4 signaling pathway is growth promoting in hNSCs (Supplemental Figure 2) and could play a direct physiological role in NSC growth that is independent of its function in endothelial cells.
The function of developmental signaling pathways, such as Notch and canonical Wnt, on GBM growth have been shown to differ based on ASCL1 expression levels (43, 44). ASCL1 is a basic helix-loop-helix (bHLH) transcription factor that is critically involved in regulating neuronal differentiation (45–47). ASCL1hi and ASCL1lo GBM exhibit different differentiation and invasion dynamics, and ASCL1hi GBM requires Notch signaling for maintaining the GSC pool (44). Based on these observations, we compared the effects of NDP/FZD4 gain and loss of function on growth and sphere formation in 2 ASCL1lo (G411, G564) and 2 ASCL1hi GSC lines (G523, G472) (ref. 44 and Figure 3). ASCL1 expression status was confirmed in all GSC lines using qRT-PCR (Supplemental Figure 3A) and the canonical Wnt-inducing capacity of NDP transgenes was confirmed using the TOP-FLASH luciferase reporter assay in HEK293T cells (Supplemental Figure 3B). The efficiencies of knockdown and overexpression in all lines were confirmed by qRT-PCR and Western blotting, respectively (Supplemental Figure 3, C–F). NDP and FZD4 knockdown in both ASCL1lo GSC lines increased growth (Figure 3A) and sphere formation (Figure 3B), whereas overexpression had the opposite effects (Figure 3, C and D). These observations indicate that NDP/FZD4 expression suppresses growth and self-renewal in ASCL1lo GSCs.
Figure 3. ASCLI subtype–dependent effects of NDP and FZD4 on proliferation and sphere formation.

(A and B) Effect of NDP or FZD4 knockdown (2 independent shRNAs/gene) on growth using the trypan blue proliferation assay (A) after 3 and 6 days in culture. (B) Sphere formation using the ELDA assay after 2 weeks in suspension culture (n = 3). Note that both shNDP constructs behaved similarly in G472 cells, so representative lines almost overlap on the graph. (C and D) Effect of NDP and FZD4 overexpression on GSC proliferation (C) and sphere formation (D) (n = 3). *P < 0.05 by 1-way ANOVA for the proliferation assay and χ2 for ELDA. Data are presented as mean ± SEM. (E) Kaplan-Meier survival analysis correlating NDP expression with patient survival in ASCL1lo GBM, ASCL1hi GBM, and in GBM stratified for NDP/ASCL1 and NDP/FZD4 expression.
In contrast, in both ASCL1hi GSC lines, NDP knockdown resulted in a striking inhibition of proliferation and sphere formation (Figure 3, A and B). Notably, ASCL1hi GSCs with NDP knockdown appeared to have a cell-autonomous growth disadvantage relative to controls, as they were depleted in spheres (Supplemental Figure 3G). To validate the effects of NDP knockdown on the growth of ASCL1hi GSCs, we designed a degenerate-codon-modified NDP construct (MOD-NDP) and confirmed that this version could rescue the growth-inhibitory effect of shRNA-mediated NDP knockdown in ASCL1hi GSCs (Supplemental Figure 4). Interestingly, manipulating FZD4 in either ASCL1hi GSC line failed to produce a significant phenotype. FZD4 knockdown with 1 of the 2 shFZD4 constructs (shFZD4-2) had a modest effect on proliferation, but not on sphere formation, in one of the ASCL1hi GSC lines (G523) (Figure 3, A and B), but this effect was not reproducible with the other shFZD4 construct (shFZD4-4) (Figure 3, A and B) and was not observed in the other ASCL1hi GSC line (Figure 3, A and B). Moreover, FZD4 overexpression had no effect on proliferation or sphere formation in either ASCL1hi GSC line (Figure 3, C and D). In summary, these experiments in patient-derived GSCs (summarized in Supplemental Table 1) indicate that the function of Norrin stratifies with ASCL1 expression level. In ASCL1lo GSCs, Norrin/FZD4 is growth suppressing and in ASCL1hi GSCs, Norrin is growth promoting and independent of FZD4.
Based on our in vitro observations, we asked whether the correlation between NDP expression and survival was associated with ASCL1 expression levels in GBM tumors. Therefore, we stratified GBM patient data on the basis of ASCL1 expression and then performed a new Kaplan-Meier survival analysis. Strikingly, we found that the survival advantage of NDP expression stratified with tumors that had low levels of ASCL1 expression, while tumors with high ASCL1 levels did not show any correlation between NDP expression level and survival outcomes (Figure 3E). Thus, the survival advantage of ASCL1lo GBM with higher NDP expression is consistent with the growth-inhibitory effect of NDP/FZD4, as we observed in ASCL1lo GSCs. To further validate this conclusion, we stratified GBM patient samples based on both NDP and ASCL1 expression levels simultaneously (Figure 3E). Interestingly, there was no survival advantage of patients with NDP/ASCL1-high versus NDP/ASCL1-low GBMs. This observation is consistent with our in vitro evidence (Figure 3, A–D) that low NDP expression in ASCL1lo GSCs induces effects on tumor progression (growth promoting) similar to those of high NDP expression in ASCL1hi GSCs (Figure 3E). We also stratified patient samples based on combined NDP and FZD4 expression and then applied the same survival analysis (Figure 3E). Similarly, the addition of FZD4 expression resulted in compromising the survival advantage of NDP expression alone (Figure 2, B and C), supporting the uncoupled functions of NDP and FZD4, at least in a subset of the GSCs.
NDP affects proliferation index and rate in GSCs.
To understand the cell biological basis for the effects of NDP on GSC growth we examined the expression of proliferation, stemness, and cell death markers in the cultures after NDP knockdown. We first determined the proliferation index (e.g., the frequency of cycling progenitors) in the cultures by quantifying the proportion of Ki67+ cells. In parallel with our in vitro observations, we found that the proliferation index was increased in ASCL1lo GSCs (Figure 4, A and C), and reduced in ASCL1hi GSCs (Figure 4, B and D) after NDP knockdown. Thus, in both GSC types NDP affects growth by regulating the maintenance of cycling cells. To validate our results, we overexpressed NDP in 2 ASCL1lo GSC lines (G411 and G564), which resulted in significant reduction of the Ki67+ population (Supplemental Figure 5). Consistent with a role for NDP in progenitor maintenance, we found that NDP knockdown reduced the proportion of ASCL1hi GSCs that express SOX2, a stemness marker (Figure 4, B and D).
Figure 4. Divergent effects of NDP and FZD4 knockdown on the proliferation indices of GSC cultures.

(A and B) Representative images of ICC staining for Ki67 (red) and SOX2 (green) after NDP or FZD4 knockdown in ASCL1lo (G564) (A) and ASCL1hi (G472) (B) GSCs. Scale bars: 50 μm. (C and D) Quantification of the frequency of Ki67+ and SOX2+ cells after NDP and FZD4 knockdown in G564 (C) and G472 (D) GSCs. n = 3 (with the exception of Ki67 in G564; n = 9 because the cells are very large and the number of cells per field or vessel was quite small). Data are presented as mean ± SEM. *P < 0.05 by 1-way ANOVA.
The proliferation index only provides information about the relative proliferative status of a mixed cell population but does not indicate how quickly or slowly the cells are cycling (48). Therefore, to investigate the effect of NDP on proliferation rate we quantified the frequency of progenitors in S-phase. Control and NDP-knockdown GSC cultures were exposed to a short pulse of EdU, a thymidine analog that is incorporated into the DNA of cells in S-phase, and the proliferation rate was determined by quantifying the proportion of EdU+/Ki67+ cells. Interestingly, the proliferation rate was significantly reduced in both ASCL1lo (Supplemental Figure 6A) and ASCL1hi GSCs (Supplemental Figure 6B) following NDP knockdown. Finally, we also assessed the effects of NDP knockdown on apoptosis by staining for cleaved caspase-3 (Casp-3) (Supplemental Figure 7). NDP knockdown resulted in a significant increase in the frequency of cleaved Casp-3+ cells in ASCL1hi (Supplemental Figure 7B) but not ASCL1lo (Supplemental Figure 7A) GSCs. Taken together, the growth and cell cycle analyses indicate that in ASCL1hi GSCs NDP expression stimulates proliferation by sustaining the progenitor pool and by promoting cell cycle progression and, in the case of ASCL1hi GSCs, through effects on cell survival. In contrast, in ASCL1lo GSCs NDP affects growth via independent, but competing, mechanisms; it promotes cell cycle progression but reduces the cycling progenitor pool, with the latter having the dominant effect on growth of the population.
NDP regulates common and divergent transcriptional programs in ASCL1lo and ASCL1hi GSCs.
To identify the downstream transcription profiles that mediate the proliferative effects of NDP in GSCs we performed RNA sequencing (RNA-Seq) analysis on 1 ASCL1lo (G411) and 1 ASCL1hi GSC line (G523), after NDP knockdown with 2 different shRNA constructs (Figure 5 and Supplemental Figure 8). After filtering the data for gene expression changes common to both short hairpins (adjusted FDR and adjusted P values <0.05) we found that NDP knockdown resulted in overlapping and unique sets of altered transcripts between ASCL1lo and ASCL1hi GSCs (Figure 5A, Supplemental Figure 8, C–E, and Supplemental Tables 2–4), indicating that NDP regulates common and unique downstream targets in both GSC subtypes. Interestingly, GSEA performed using the same strict criteria revealed a similar pattern of overlapping gene sets between both GSC subtypes; however, there were unique gene sets only in ASCL1lo GSCs (Figure 5, B and C, Supplemental Figure 8F, and Supplemental Table 5). The majority of the overlapping differentially expressed genes and enriched gene sets were related to cell cycle and cell division and included downregulation of cell cycle regulators, including cyclins A2, G1, E2, B1, and B2 (Supplemental Figure 8C and Supplemental Tables 5 and 6). We validated the downregulation of cell cycle regulators following NDP knockdown in both GSC subtypes by Western blot analysis for CCNE2 and CCNA2 (Figure 5D). Based on these data, we suggest that NDP regulates the expression of a cell cycle progression program common to ASCL1lo and ASCL1hi GSCs, which is consistent with the observation that NDP knockdown in both types of GSCs has similar effects on cell cycle progression (Supplemental Figure 6). GSEA results also support a model where NDP regulates a second, independent gene expression program in ASCL1lo GSCS. For example, while all of the significantly enriched gene sets in ASCL1hi GSCs after NDP knockdown overlapped entirely with the enriched genes sets in ASCL1lo GSCs, there were additional enriched gene sets exclusive to ASCL1lo GSCs after NDP knockdown (Figure 5, B and C, and Supplemental Figure 8F).
Figure 5. RNA-Seq analysis reveals divergent and overlapping effects of NDP knockdown on gene expression in ASCL1lo and ASCL1hi GSCs.

(A) Venn diagram representing the number of overlapping and common differentially expressed genes in each cell line. Roughly half of G523 hits and one-third of G411 hits are overlapping. Notably, the number of hits in G411 is higher than in G523. (B) Unbiased enrichment maps of the identified hits in both lines (the blue circles represent G411, red circles represent G523). The overlapping sets predominantly center on cell cycle, cell division, and proliferation, while G411 unique sets are related to cytoskeletal rearrangement and movement. Refer to Supplemental Figure 6 for more details. (C) Venn diagram representing the number of unique and common enriched gene sets. (D) Western blot validation of CCNE2 and CCNA2 expression in G411 and G523 cells with NDP knockdown. (E) Log2(fold change) values for selected Wnt targets from the RNA-Seq library results. The selected genes were significantly differentially expressed after NDP knockdown in G411 but not G523 cells. Bars show the average fold change of selected hits for 2 shNDP (shNDP-A, shNDP-C) constructs in each cell line.
Of the unique ASCL1lo GSC RNA-Seq hits, many were related to migration, invasion, metastasis, epithelial-mesenchymal transition (EMT), and extracellular matrix modulation (Supplemental Figure 8D and Supplemental Table 2). Similarly, unique ASCL1lo GSC gene sets included cell movement and cytoskeletal organization (Figure 5B, Supplemental Figure 8F, and Supplemental Table 5). In contrast, the unique hits in ASCL1hi GSCs were primarily related to cell cycle, proliferation, differentiation, and DNA repair (Supplemental Figure 8E and Supplemental Table 3). One potential regulator of this divergent NDP-regulated program in ASCL1lo GSCs is the Wnt pathway, as NDP function in this subset was FZD dependent. Consistent with this possibility, we found that expression of selected Wnt targets was significantly changed in the RNA-Seq library after NDP knockdown in ASCL1lo GSCs, and unchanged in ASCL1hi GSCs (Figure 5E). We propose that the regulation of genes associated with tumor-promoting processes and the Wnt pathway support the existence of a competing mechanism mediating NDP function in ASCL1lo GSCs and explains the dominant growth-promoting effect of NDP knockdown in ASCL1lo GSCs.
Growth-inhibiting effects of canonical Wnt pathway activation segregate with ASCL1 status.
We show that in ASCL1lo GSCs the phenotypic effect of NDP and FZD4 manipulation on growth and self-renewal are the same, whereas in ASCL1hi GSCs manipulating NDP, but not FZD4 expression, affects growth and self-renewal. Moreover, NDP knockdown is associated with altered expression of Wnt target genes in ASCL1lo but not ASCL1hi GSCs. Thus, we hypothesized that in ASCL1lo GSCs, Norrin/FZD4-mediated growth-suppressive effects require canonical Wnt pathway activation, whereas in ASCL1hi GSCs, Norrin-mediated effects on growth are canonical Wnt pathway independent. To test this hypothesis, we overexpressed NDP in ASCL1lo and ASCL1hi GSCs and treated them with Wnt inhibitors. In control assays we confirmed that treatment with a function-blocking anti-FZD4 antibody (49), tankyrase inhibitor (XAV939), which stimulates β-catenin degradation and blocks canonical Wnt signaling downstream of FZD receptors, and IWP2, which inhibits Wnt secretion, all inhibited Wnt3-stimulated induction of a TOP-FLASH luciferase reporter (Supplemental Figure 9). Treatment with Wnt inhibitors increased growth in NDP-expressing and control lentivirus–infected ASCL1lo GSCs (Figure 6A). These observations are consistent with endogenous and NDP-induced growth-suppressive effects of FZD4 and Wnt/β-catenin signaling in ASCL1lo GSCs. In contrast, inhibiting canonical Wnt signaling had no effect on proliferation of ASCL1hi GSCs with or without NDP overexpression, indicating that NDP function in these cells is independent of canonical Wnt signaling (Figure 6B). To confirm these findings, we examined the effects of Wnt agonists, recombinant human WNT3a (rhWNT3a) and CHIR, a GSK3 inhibitor, on the proliferation of ASCL1lo and ASCL1hi GSCs. In parallel with our observations in NDP-overexpressing GSCs, activation of the canonical Wnt pathway inhibited proliferation of ASCL1lo GSCs (Figure 6C) but had no effect on proliferation of ASCL1hi GSCs (Figure 6D). Additionally, we found that modulating NDP affected the levels of active β-catenin (Figure 6, E and F) and the levels of Wnt targets CDK1 and phospho–NF-κB p65 (50–53) only in ASCL1lo GSCs (Figure 6G). Taken together, these results show that Norrin/FZD4 signaling stimulates the canonical Wnt pathway to suppress growth in ASCL1lo but not in ASCL1hi GSCs.
Figure 6. NDP function is Wnt dependent in ASCL1lo and Wnt independent in ASCL1hi cells.

(A and B) Effects of canonical Wnt pathway inhibitors on proliferation of control and NDP-overexpressing G411 (ASCL1lo) GSCs (A) and G523 (ASCL1hi) GSCs (B) after 6 days (n = 3). †P < 0.05 within experimental groups; *P < 0.05 between groups by 1-way ANOVA with multiple comparisons. (C and D) Effects of Wnt agonists WNT3a and CHIR on proliferation of G411 (C) and G523 (D) GSC cells after 6 days (n = 3). *P < 0.05 by 1-way ANOVA with multiple comparisons. (E and F) Representative Western blot analysis and quantitation of the levels of active (nonphosphorylated) and total β-catenin in NDP-knockdown G411 and G523 GSCs (E) and NDP-overexpressing G411 and G523 GSCs (F). Quantification was performed using the Image Studio Lite software analysis package (n = 3). *P < 0.05 by 1-way ANOVA. Data are presented as mean ± SEM. (G) Representative Western blot analysis (n = 3) of selected Wnt targets following NDP knockdown G411 and G523 GSCs.
Norrin promotes Notch signaling and inhibits differentiation in ASCL1hi GSCs.
To address the mechanism underlying Wnt-independent effects of Norrin on promoting ASCL1hi GSC progression, we started by asking whether Norrin’s function in this context is cell autonomous. Norrin is reported to function as a short-range paracrine signal, where Norrin secreted from one cell can activate FZD4/canonical Wnt signaling in a neighboring cell (27), which we confirmed in reporter assays in HEK293T cells (Supplemental Figure 10D). However, the growth disadvantage of ASCL1hi GSCs with NDP knockdown in spheres (Supplemental Figure 3G) suggested an autocrine or juxtacrine requirement for NDP expression, because it does not appear to be rescued by Norrin provided by neighboring wild-type cells. To investigate this possibility, we first treated cells with recombinant human Norrin protein (rhNorrin) and observed effects on proliferation in vitro. Interestingly, rhNorrin treatment replicated the effects of NDP overexpression only in ASCL1lo but not ASCL1hi GSCs (Figure 7A). Next, we performed a competition assay, where we mixed equivalent numbers of ASCL1hi GSCs infected with Lenti-shNDP-GFP or Lenti-shScrambled-GFP with cells infected with Lenti-mCherry and measured the mCherry+/GFP+ cell ratio over time. If Norrin functions as an autocrine signal, the ratio of mCherry+/Norrin-deficient GFP+ cells should increase, owing to a cell-autonomous growth disadvantage of cells with NDP knockdown. Equal seeding of the cultures at day 1 was confirmed by flow cytometric analysis (Supplemental Figure 10, A and B) and then reassessed after 6 days. Interestingly, the mCherry+/GFP+ cell ratio remained nearly equivalent in cultures expressing the scrambled short hairpin control, whereas the ratio shifted dramatically toward the mCherry+ cohort in the NDP-knockdown cultures (Supplemental Figure 10, A–C). Given that the 2 populations were intermixed, this result strongly supports an autocrine or at least juxtaparacrine function for Norrin in ASCL1hi GSCs.
Figure 7. NDP knockdown inhibits Notch signaling in ASCL1hi GSCs.

(A) Effects of recombinant Norrin treatment on the proliferation of G411 and G523 GSCs after 6 days in culture (n = 3). (B) Representative Western blot analysis for the indicated Notch pathway components in G411 and G523 GSCs after NDP knockdown. (C) Effects of Notch inhibition on the growth-promoting effects of NDP overexpression (OE) in G411 and or G523 GSCs after 6 days in culture (n = 3). (D) Effect of NDP knockdown (KD) on the proliferation of G564 (ASCL1lo) GSCs after ASCL1 overexpression (n = 3). *P < 0.05 by Student’s t test (A) or 1-way ANOVA (C and D). Data are presented as mean ± SEM.
Notch, which functions via juxtaparacrine signaling, is considered one of the master regulators of cancer stem cells (54). Previously, Park et al. reported that Notch inhibition leads to differentiation in ASCL1hi but not ASCL1lo GSCs (44) mediated, in part, through ASCL1-dependent chromatin remodeling of differentiation genes. Interestingly, the growth disadvantage of NDP knockdown in ASCL1hi but not ASCL1lo GSC lines suggests effects on differentiation as a possible underlying mechanism. Given the phenotypic similarity between NDP knockdown and Notch inhibition, we assessed the impact of NDP manipulation on Notch signaling in GSCs. We found that NDP knockdown resulted in a marked downregulation of Notch signaling in ASCL1hi and ASCL1lo GSCs, as shown by the reduction of cleaved (activated) Notch1 and Notch targets (Figure 7B), demonstrating that Norrin is required to maintain Notch signaling. Consistent with a role for Notch function downstream of Norrin in ASCL1hi cells, we found that treatment with the Notch inhibitor GSI (γ-secretase inhibitor) abrogated the effect of NDP overexpression in ASCL1hi but had no effect on ASCL1lo GSCs (Figure 7C) and that NDP knockdown promoted expression of neuronal differentiation markers in ASCL1hi GSCs (Figure 8).
Figure 8. NDP knockdown leads to differentiation in ASCL1hi GSCs.

(A) Representative images from ICC staining of βIII-tubulin, SOX2, GFAP, and MAP2 in G523 cells 3 weeks after NDP knockdown. Scale bars: 50 μm. (B) Quantification of respective stains. Data are presented as mean ± SEM (n = 3). *P < 0.05 by 1-way ANOVA.
ASCL1 functions as a pioneer factor to promote accessibility of differentiation-inducing targets in response to Notch inhibition (44), which raises the possibility that ASCL1lo cells were unaffected by loss of Notch signaling after Norrin depletion because of insufficient ASCL1 activity. To test this hypothesis, we stably transduced ASCL1lo (G564) cells with human ASCL1, and then knocked down NDP to see if ASCL1 overexpression is able to reverse the effects of NDP knockdown. Strikingly, ASCL1 overexpression in ASCL1lo cells resulted in a complete reversal of the effects of NDP knockdown on proliferation (Figure 7D) and induced a phenotype similar to ASCL1hi GSC lines (Figure 3A). Collectively, these findings provide evidence for Norrin as a modulator of Notch signaling, and show that ASCL1 levels are the reason for the opposing effects of Norrin depletion in ASCL1hi and ASCL1lo GSCs.
NDP modulation affects tumorigenicity in xenografted ASCL1lo and ASCL1hi GSCs.
To validate whether the growth-inhibitory effects of NDP manipulation we observed in vitro translate to the complex environment of tumor growth in vivo, we orthotopically xenografted Nod-SCID gamma (NSG) mice with ASCL1lo or ASCL1hi GSCs with NDP and FZD4 (in the case of ASCL1lo GSCs only) overexpression or knockdown (Figures 9 and 10). Overexpression of NDP or FZD4 in ASCL1lo GSCs, which inhibit growth in vitro, significantly prolonged survival in xenografted mice (Figure 9D). The tumors that did form were reduced in GFP+ cells relative to tumors with control Lenti-GFP infection (despite being grafted with cells that were over 90% GFP+), suggesting that there was a selection bias against NDP- or FZD4-overexpressing cells during tumor progression (Figure 10B). NDP or FZD4 knockdown in ASCL1lo GSCs, which promotes growth in vitro, did not have a significant effect on survival, likely because the strikingly rapid kinetics of tumor formation (3–4 weeks) of this GSC line would make it difficult to detect faster tumor formation (Figure 9C and Figure 10A). NDP knockdown in ASCL1hi GSCs, which inhibits proliferation in vitro, significantly prolonged survival in mice grafted with ASCL1hi GSCs (Figure 9E) and overexpressing NDP in this GSC line, which is growth promoting in vitro, significantly shortened survival (Figure 9F). Similar to our observations with ASCL1lo xenografts, human tumors derived from ASCL1hi GSCs with NDP knockdown were depleted of GFP+ cells, despite the grafts containing over 90% GFP+ cells at the time of transplantation (Figure 10C). This observation suggests that NDP knockdown in ASCL1hi GSCs results in a selective growth disadvantage during tumor progression. Combined, these data demonstrate that NDP manipulations in ASCL1lo and ASCL1hi GSCs strongly affect the dynamics of overall tumor progression in a complex in vivo environment and confirm our in vitro observations.
Figure 9. Effects of NDP on progression of GBM in vivo depend on ASCL1 expression status.

(A and B) Representative H&E staining of orthotopically xenografted G411 (ASCL1lo) (A) and G523 (ASCL1hi) GSC (B) tumors (dotted line, tumor outline). Shown are tile scans taken at ×2.5 magnification (left) and boxed regions are shown at higher magnification (×20) on the right. G411 GSCs form localized and G523 GSCs form diffuse tumors. Scale bars: 10 μm and 50 μm, respectively. (C and D) Kaplan-Meier survival analysis of mice orthotopically transplanted with G411 GSCs after NDP or FZD4 knockdown (C) and overexpression (D). (E and F) Kaplan-Meier survival analysis of mice orthotopically transplanted with G523 GSCs after NDP knockdown (E) and overexpression (F). P < 0.05 by log-rank test (C–F).
Figure 10. NDP modulation results in selective advantage or disadvantage in xenografted tumors depending on ASCL1 expression status.

(A and B) Representative IHC images of G411-derived tumors with NDP or FZD4 knockdown (A) or overexpression (B). Scale bars: 50 μm. (C and D) Representative IHC images of G523-derived tumors with NDP knockdown (C) or overexpression (D). Scale bars: 50 μm.
Last, we used serum-induced differentiation to examine the effects of NDP knockdown on differentiated GSCs. Interestingly, serum differentiation abrogated the phenotypic divergence of NDP knockdown between ASCL1lo and ASCL1hi GSCs and resulted in a similar phenotype in both (Supplemental Figure 11), supporting the correlation between Norrin functional divergence and tumor stem cell biology in this context.
Discussion
GBM remains one of the most lethal malignancies because it is largely refractory to the current standard treatment approaches. Owing to the well-defined cellular hierarchy in GBM, targeting the GSC population has been suggested as a promising treatment strategy; however, there is a critical need for a better understanding of the biological pathways that control this population and how these pathways are affected in GBM subtypes. Canonical Wnt signaling is one of the most heavily studied pathways in the context of normal and cancer stem cells; however, there is a paucity of studies characterizing the role of the atypical Wnt ligand, Norrin, in primary tumors, likely because of the historical link of this gene to congenital eye disease (30, 31, 55). Analysis of tumor databases revealed that NDP expression is widespread across several tumor types and is enriched in and associated with increased survival in several neurological cancers, including GBM. Our gain- and loss-of-function studies in primary patient-derived GSCs revealed that NDP has opposite effects on GSC growth, where it is growth inhibitory in ASCL1lo GSCs and growth promoting in ASCL1hi GSCs. Moreover, we show that the requirement for FZD4 and canonical Wnt signaling also segregates with ASCL1 status, such that Norrin acts through FZD4 and the canonical Wnt pathway in ASCL1lo GSCs but is FZD4/canonical Wnt independent in ASCL1hi GSCs. To the best of our knowledge, this is the first demonstration that Norrin exhibits context-specific canonical Wnt pathway activation in human tumor stem cells.
There is extensive evidence for tumor-promoting mutations in Wnt pathway components in several cancers (20, 21, 56). Although Wnt pathway genes are rarely mutated in GBM, canonical Wnt signaling is frequently deregulated in GBM, typically through repression of secreted Wnt inhibitors (43, 57) or genetic alterations that promote β-catenin activity (19, 58, 59). The functional observations from these and other studies have led to the general conclusion that canonical Wnt signaling is tumor promoting in GBM through effects on stemness, proliferation, and invasion (60). However, Wnt activation has been reported to attenuate growth and tumor progression in primary GSCs and GBM cell lines (23, 26). Although the basis for this discrepancy is not clear, it does highlight a possible context-dependent function for canonical Wnt signaling in GBM, which is consistent with previously published data from studies on untransformed NSCs and neural progenitors, where Wnt can promote opposing effects on growth, stemness, and differentiation (61). By targeting endogenously expressed Wnt pathway ligands and receptors we show that there are context-specific functions of canonical Wnt signaling on the growth of GBM. Our results showing that canonical Wnt signaling is exclusively growth suppressive in ASCL1lo GBM also have important clinical significance, as we show that XAV939 (tankyrase inhibitor), a compound that is currently being considered for treatment of CNS and non-CNS tumors (62, 63), might stimulate rather than inhibit the growth of ASCL1lo GSCs. However, because of the heterogeneity of ASCL1lo GSCs in terms of growth properties, further validation of our observation in a larger cohort of ASCL1lo GSCs would be beneficial. Notably, our data do not exclude the potential therapeutic advantage of Wnt inhibition in GBM but rather highlight the critical need for considering the molecular and cellular context in targeting responsive tumors. In parallel with our observations, it was recently reported that HIF1A/Wnt signaling strongly stimulates neuronal differentiation under hypoxic conditions, further supporting the significance of cellular and molecular contexts in determining responsiveness to Wnt (64).
We also show that NDP is a potent upstream regulator of Notch signaling. NDP knockdown results in a loss of Notch activation and the growth-promoting effect of NDP overexpression in ASCL1hi GSCs requires active Notch signaling. A role for Norrin in modulating Notch signaling adds an exciting axis to the current knowledge about the noncanonical function ascribed to Norrin in several cellular contexts (38–41). Notch inhibition is a potent promoter of neuronal, but not astrocyte, differentiation, which has therapeutic relevance because neuronal differentiation is terminal and leads to permanent cell cycle exit (44). Therefore, NDP knockdown might present an exciting differentiation-therapy approach to target ASCL1hi GBM. Norrin function has also been implicated in the maintenance of the blood-brain barrier, pathological neovascularization, neuron survival (reviewed in ref. 65), and cortical neuron dendritic morphology (35) in the adult brain. However, developing localized and FZD4-independent approaches to Norrin targeting could help circumvent potential brain toxicity of general Norrin/FZD4 disruption.
Despite differences in the phenotypes produced by manipulating NDP in both GSC subtypes, our immunocytochemistry (ICC) experiments uncovered a surprising overlap in its cell biological effects. In both GSC subtypes, NDP knockdown reduced the proliferation rate, indicating a slower cell cycle, and was associated with overlapping changes in cell cycle gene expression and gene set enrichment. This phenotype in ASCL1lo GSCs is particularly notable because the net effect of NDP knockdown is growth promoting, suggesting the existence of other Norrin-dependent growth-inhibiting pathways in this GSC subtype. This interpretation is consistent with the observation that NDP knockdown in ASCL1lo GSCs was associated with gene expression and gene set enrichment changes related to invasion, migration, metastasis, and extracellular matrix modulation that were unique to this subtype. This competition between the Wnt-dependent and -independent Norrin functions result in the overall phenotype after manipulating this gene in ASCL1lo GSC lines. The underlying basis for the effects of NDP on growth in ASCL1lo and ASCL1hi GSCs is mediated, at least in part, by ASCL1, because reintroducing ASCL1 expression reverses the effect of NDP knockdown on the growth of ASCL1lo GSCs.
In this study, we focused our experiments on GSCs; however, further studies are required to assess the role of NDP in maintaining the pool of tumor differentiated cells and for interactions with the stroma in particular, as Norrin/FZD4 signaling is required for establishment of the blood-brain barrier in several regions of the brain (66). In addition to these observations in GBM, our analysis of publicly available tumor databases suggests that the role of NDP might extend to several other non-CNS cancers including breast, prostate, and reproductive organ tumors, which could reflect physiological roles for Norrin in these tissues, particularly in the female reproductive system where Norrin is essential for embryo implantation (67). Although our primary focus in this study was GSCs, we show that the Norrin/FZD4 signaling axis also significantly controls the proliferation of primary fetal hNSC cells in vitro. It would be interesting to follow up on this observation and investigate how Norrin functions in this context. Ultimately, these observations can serve as an initiative for investigating Norrin function in regenerative medicine applications.
In summary, we uncover a previously undefined role of NDP in regulating the progression of GBM through effects on proliferation and self-renewal of GSCs, and a striking mechanism in which Norrin harbors tumor-suppressor functions by activating Wnt signaling in GBM with low levels of ASCL1, and oncogenic functions through Wnt-independent mechanisms in GBM with high levels of ASCL1. Additionally, we provide evidence of Norrin function in modulating Notch signaling, which has significant impacts on several cellular contexts.
Methods
Computational and in silico analysis.
TCGA data are publicly available from the Genomic Data Commons (GDC) data portal (http://gdc.nci.nih.gov). The gene expression data sets were measured using the Illumina Hiseq RNASeqV2 and log2 transformed by the UCSC Cancer Browser team. NDP gene expression (box-and-whisker plots) across cancers was queried using cBioPortal — a public online database. Correlation between gene expression and survival was produced by the Kaplan-Meier method using Partek Genomics Suite software and a log-rank test was performed to calculate P values (0.05 was considered as the threshold for significance). For the GSEA, we compared NDP low versus high expression (in isocitrate dehydrogenase [IDH] wild-type GBM) after data were normalized and differential expression was used to perform pathway analysis. Statistical significance was determined based on the following criteria: FDR less than 0.05 and fold change greater than 1.7 or less than –1.7. We also used the web-based servers of the Cancer Cell Line Encyclopaedia (CCLE) (37) and the human protein atlas (HPA) (36) to assess NDP expression levels in different contexts.
Primary tumor cell lines and culture.
All GSC and hNSC lines used in this study were obtained under an MTA from the laboratory of Peter Dirks at SickKids Hospital, Toronto, Canada. These GSC lines were derived from primary tumors, as previously described (42), in accordance with the Research Ethics Board at The Hospital for Sick Children (Toronto, Canada). Primary tumor–derived GSC and hNSC lines were cultured in neural expansion conditions to promote and maintain the stem cell phenotype (42). Briefly, cells were cultured on laminin-coated surfaces in Neurocult media (StemCell Technologies), supplemented with BSA (Life Technologies) and 5 mL of 200 mM L-glutamine (Wisent) per 500 mL bottle of media. This base was then supplemented with an in-house equivalent to N2 hormone mix, 10 ng/mL recombinant human epidermal growth factor (EGF) (Sigma-Aldrich), 10 ng/mL recombinant human basic fibroblast growth factor (bFGF) (StemCell Technologies), 2 μg/mL heparin (Sigma-Aldrich), and 1× B-27 Supplement (Life Technologies), and cells were passaged for a maximum of 20 passages to maintain the stem cell phenotype, as described in Pollard et al. (42). To dissociate and split cells, we used brief Accutase (Sigma-Aldrich) treatment (5 minutes, 37°C). In this study we used 3 ASCL1hi GSC (G523, G472, G440), 2 ASCL1lo GSC (G411, G564), and 2 hNSC (hNSC-1, hNSC-3) lines. GSC lines were tested periodically for the expression of a panel of stem cell and differentiation markers, including SOX2, O4, TU-J, MAP2, GFAP, and Nestin, using ICC to ensure the maintenance of the stem cell phenotype. For lentiviral production, dual-luciferase reporter system assay, and proof-of-concept experiments, we used a human embryonic kidney cell line (HEK293T) obtained from ATCC.
Recombinant DNA, plasmids, and cloning.
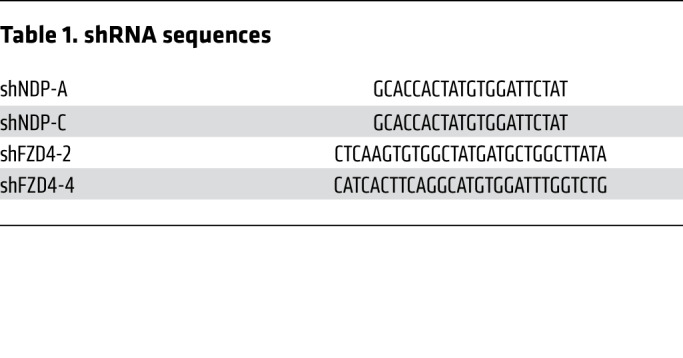
NDP- and FZD4-specific shRNAs were subcloned into the pGFP-C-shLenti plasmid by its provider (Origene). Gene knockdown and overexpression were confirmed by qRT-PCR and Western blotting, respectively. Sequences of shRNA constructs are shown in Table 1.
Table 1. shRNA sequences.
The negative control plasmid pGFP-C-shLenti containing scrambled noneffective shRNA was obtained from Origene (catalog TR30021). To rescue the effects of short hairpin NDP knockdown, a degenerate-codon NDP transgene (Mod-NDP) was subcloned into the pLV-mCherry plasmid (Addgene) by GeneArt services (Thermo Fisher Scientific). pLV-mCherry was a gift from Pantelis Tsoulfas (Addgene plasmid 36084; http://n2t.net/addgene:36084; RRID: Addgene plasmid 36084). Briefly, we subcloned a version of the NDP coding sequence consisting of degenerate codons (Mod-NDP), which is not complementary to the shNDP targeting sequences, into a lentiviral vector that expresses mCherry as a fluorescence marker. Next, we cotransduced G523 cells with Mod-NDP and shScrambled, shNDP-A, or shNDP-C (with GFP marker). The expression and function of Norrin from Mod-NDP was confirmed by Western blotting and by TOP-FLASH reporter assay.
The sequence of Mod-NDP was ATGAGAAAACATGTACTAGCTGCATCCTTTTCTATGCTCTCCCTGCTGGTGATAATGGGAGATACAGACAGTAAAACGGACAGCTCATTCATAATGGACTCGGACCCTCGACGCTGCATGAGACATCATTACGTAGACAGCATTTCACATCCGCTATATAAATGCTCATCAAAGATGGTGCTCCTGGCCAGGTGCGAGGGGCACTGCAGCCAGGCGTCACGCTCCGAGCCTTTGGTGTCGTTCAGCACTGTCCTCAAGCAACCCTTCCGTTCCTCCTGTCACTGCTGCCGGCCCCAGACTTCCAAGCTGAAGGCACTGCGGCTGCGATGCTCAGGGGGCATGCGACTCACTGCCACCTACCGGTACATCCTCTCCTGTCACTGCGAGGAATGCAATTCCTG.
The sequence of wild-type human NDP was ATGAGAAAACATGTACTAGCTGCATCCTTTTCTATGCTCTCCCTGCTGGTGATAATGGGAGATACAGACAGTAAAACGGACAGCTCATTCATAATGGACTCGGACCCTCGACGCTGCATGAGGCACCACTATGTGGATTCTATCAGTCACCCATTGTACAAGTGTAGCTCAAAGATGGTGCTCCTGGCCAGGTGCGAGGGGCACTGCAGCCAGGCGTCACGCTCCGAGCCTTTGGTGTCGTTCAGCACTGTCCTCAAGCAACCCTTCCGTTCCTCCTGTCACTGCTGCCGGCCCCAGACTTCCAAGCTGAAGGCACTGCGGCTGCGATGCTCAGGGGGCATGCGACTCACTGCCACCTACCGGTACATCCTCTCCTGTCACTGCGAGGAATGCAATTCCTG.
For ectopic NDP and FZD4 overexpression experiments, we used TrueORF cDNA clones from Origene. pLenti-C-mGFP was used for NDP and pLenti-C-MYC-DDK was used for FZD4.
To overexpress hASCL1, the cDNA was PCR amplified from pTight-hAscl1-N174 (Addgene 31876; a gift from Jerry Crabtree) and then subcloned into pLenti-CAG-P2A-GFP plasmid vector (modified from pLenti-CAG-IRES-GFP; Addgene 69047; a gift from William Kaelin).
Preparation of lentiviral particles and infection.
We used a third-generation lentiviral transduction system to knock down or overexpress genes of interest. To produce virus particles, HEK293T cells were cultured in 15-cm dishes (BD Falcon) and allowed to adhere for 24 hours. The following day, cells were cotransfected with the lentiviral expression vector in combination with plasmids expressing virus coat and assembly proteins (REV, RRE, and VSVG) using Lipofectamine 3000 reagent (Life Technologies). Conditioned media containing virus particles were collected 24 and 48 hours after transfection. Virus-conditioned medium was passed through 0.45-μm low protein binding membranes (Sarstedt) and then concentrated by ultracentrifugation at 22,000 g for 2 hours. Virus pellets were then reconstituted in PBS. To assess virus titer, we infected a series of HEK293T culture vessels with 1 μL of a dilution series of the reconstituted virus pellet (1 × 100, 1 × 10⁻¹, 1 × 10⁻², 1 × 10⁻³, etc.). Forty-eight hours after the infection cells were analyzed using fluorescence microscopy and infectious particle titer was assessed by manual counting of cells expressing the fluorescent protein reporter. For lentiviral plasmids that do not express fluorescence proteins, we performed qRT-PCR using a LentiX qRT-PCR kit (Clontech, Takara).
In vitro cell proliferation assay.
Cells were counted and seeded in coated 24-well plates at a density of 20,000 cells/well for more slowly growing GSC lines, and 10,000 cells/well for faster-growing GSC lines. Cells were quantified at 2 time points (3 and 6 days), or after 6 days for more complex experiments. To quantify absolute cell numbers, cells were incubated with Accutase for 5 minutes at 37°C and then live cells were counted using a hemocytometer after addition of trypan blue exclusion dye (Sigma-Aldrich). Cell numbers were normalized to the seeding density of the first day in culture to assess percentage of cell proliferation. At least 3 or 4 technical replicate wells were seeded for each sample.
In vitro extreme limiting dilution assay.
To assess sphere formation ability, we used the in vitro extreme limiting dilution assay (ELDA), as previously described (68). Briefly, cells were dissociated using Accutase and thorough pipetting to ensure the formation of single-cell suspensions. After counting, cells were seeded in suspension-culture 96-well plates (Sarstedt) at a density of 4000 cells/well, with a minimum of 3 or 4 replicates per sample. Peripheral rows and columns of the plate were filled with PBS and not included in the experiment to reduce variability associated with plate position effects. Cells in the first column (4000 cells/well) were then serially diluted from one column to the next until cell density reached 4 cells/well in the last column. Plates were incubated for 2 weeks at 37°C, and sphere forming wells were scored at these time points, as per the protocol instructions. Scoring results were then analyzed using ELDA software (http://bioinf.wehi.edu.au/software/elda) from Walter and Eliza Hall Institute for Medical Research (WEHI), according to the developer’s instructions. Secondary sphere assays were performed as a proof of concept to confirm our results.
Cell and tissue immunostaining and microscopy.
Cells were seeded at least 24 hours before the staining procedure on 8-well chamber slides (BD Falcon) coated with poly-L-ornithine (Sigma-Aldrich) and laminin, as described above. Once the cells reached the appropriate confluence and/or intended time point, the culture media were removed and cells were washed briefly with PBS. Cells were fixed by incubation with electron microscopy–grade 4% paraformaldehyde (PFA) (Bio-Rad) for 10 minutes, permeabilized in 0.1% Triton X-100 in PBS (PBST) for 5 minutes, and blocked in 5% BSA in PBST, all at room temperature. Cells were incubated overnight at 4°C with primary antibodies diluted in blocking solution. After washing 3 times with PBS (5 minutes each), cells were incubated for 1 hour at room temperature with secondary antibodies and DAPI (nuclear stain) diluted in blocking solution, followed by 3 washes with PBS (5 minutes each), mounting in mounting medium (DAKO), and storing at 4°C. Cells were imaged at ×20 magnification on a Zeiss M2 epifluorescence microscope with ApoTome or by confocal microscopy unless otherwise indicated. Zeiss software was then used to analyze the images, which were then quantified manually. Cells were pulsed with 10 μM EdU for 3 hours before harvesting and signals developed with the Click-iT kit (Life Technologies), according to the manufacturer’s instructions. For immunostaining in tissue sections, animals were perfused transcardially. Briefly, animals were injected with 10 mL PBS into the heart to clear the circulatory system, followed by 10 mL 4% PFA injection. Then, the brain was dissected and fixed in 4% PFA overnight at 4°C. Tissues were washed in PBS and cryoprotected in 30% sucrose/PBS overnight at 4°C. After cryoprotection, tissues were equilibrated in a 50:50 mixture of optimal cutting temperature (OCT) compound/30% sucrose, embedded into plastic molds, and snap-frozen in liquid nitrogen. Brain sections were taken at 16 μm in the coronal plane using a Leica CM1850 cryostat, air dried (1–2 hours) on Superfrost Plus positively charged slides (Thermo Fisher Scientific), and stored with desiccant at −20°C. Slides were washed in PBS and permeabilized in PBST followed by blocking with 10% donkey serum (Sigma-Aldrich) in PBS for 30 minutes at room temperature. Primary antibodies were diluted in 10% donkey serum and incubated with the slides overnight at 4°C. The next day, sections were incubated with secondary antibodies (Molecular Probes) diluted at 1:1000 for 1 hour at room temperature, and nuclei were stained with Hoechst and a coverslip was attached with fluorescence mounting medium (Dako S3023). Fluorescence images of the tumors were captured using an LSM 780 confocal microscope (Zeiss) at ×20 magnification.
Cell competition assay.
Cells were divided into 2 groups; one was infected with a lentivirus expressing mCherry only (pLV-mCherry), while the other was infected with a lentivirus expressing GFP in addition to shRNA oligonucleotide. After both groups expressed the fluorescent reporters, mCherry+ and GFP+ cells were mixed in 1:1 ratio and a sample of the resulting cell mixture was directly analyzed by flow cytometry to determine the seeding density and ratio. Next, mixed cells were cultured on precoated 24-well plates (BD Falcon) for 6 days at 37°C. After 6 days, cells were dissociated using Accutase and analyzed by flow cytometry to determine the mCherry+/GFP+ cell ratio. Additionally, cell mixtures were cultured on precoated 8-well chamber slides (BD Flacon) and analyzed under the fluorescence microscope for visual inspection and imaging. The assay was repeated in 2 independent biological replicates.
Cell lysis and Western blotting.
For preparation of cell lysates, cells were incubated with RIPA buffer (Cell Signaling Technology) supplemented with protease inhibitor complex (Roche) and phosphatase inhibitor complex (Cell Signaling Technology) for 5 minutes, followed by sonication and then centrifuged (13,000 g, 15 minutes) to remove nucleic acids and cell debris. A Bradford assay was used according to the manufacturer’s instructions (Sigma-Aldrich) to assess protein concentration. Protein concentrations were measured using a benchtop spectrophotometer (Eppendorf). After addition of Laemmli loading buffer (Sigma-Aldrich), lysates were incubated at 95°C to ensure complete protein denaturation. Western blotting was performed according to standard protocols (wet transfer, PVDF membranes), and images were developed using Odyssey fluorescence scanner system. BLUeye prestained protein ladder (GeneDireX) was used as a marker to identify the molecular weights of target proteins. One representative blot of the loading control GAPDH (housekeeping gene) is shown for each Western blotting experiment.
Small molecules, recombinant proteins, and antibodies.
For cell treatments we used anti-FZD4 blocking antibody (Lexicon Pharmaceuticals); anti-KLH blocking antibody (Lexicon Pharmaceuticals); IWP-2 (Sigma-Aldrich, I0536); XAV939 (Sigma-Aldrich, X3004); rhNorrin (R&D Systems, 3014-NR); rhWNT3a (R&D Systems, 5036-WN); DKK1 (R&D Systems, 5439-DK); DAPT (GSI; Sigma-Aldrich, D5942); CHIR (CHIR 99021: 6-[[2-[[4-(2,4-dichlorophenyl)-5-(5-methyl-1H-imidazol-2-yl)-2-pyrimidinyl]amino]ethyl]amino]-3 pyridinecarbonitrile; Axon Medchem, CT99021); and BIO ((2′Z,3′E)-6-bromoindirubin-3′-oxime; Sigma-Aldrich, B1686). The following primary antibodies were used for Western blotting and IHC: anti-GAPDH (MilliporeSigma, CB1001, 1:5000), anti-Norrin (R&D Systems, AF3014, 1:500), anti-MYC (Abcam, ab9106, 1:1000), anti–β-catenin (Cell Signaling Technology, 9562, 1:1000), anti–non-phospho (active) β-catenin (Cell Signaling Technology, 8814, 1:1000), anti-CCNA2 (Abcam, ab32286, 1:10,000), anti-CCNE2 (Abcam, ab32103, 1:500), anti-CDK1 (Abcam, ab18, 1:1000), anti–NF-κB p65 (Cell Signaling Technology, 8242, 1:1000), anti–phospho-NF-κB p65 (Cell Signaling Technology, 3033, 1:1000), anti-NICD1 (Cell Signaling Technology, 4147, 1:1000), anti-Hes1 (Abcam, ab71559, 1:200), anti-HEYL (Abcam, ab26138, 1:1000), anti-Ki67 (BD Biosciences, 550609, 1:100), anti-Sox2 (Abcam, ab97959, 1:1000), anti-HuNu (MilliporeSigma, MAB1281, 1:1000), anti–cleaved caspase-3 for IHC (BD Pharmingen, 559565), and anti–cleaved caspase-3 for ICC (Cell Signaling Technology, 9661, 1:400). Sections were counterstained with H&E (Sigma-Aldrich, MHS16), and nuclei (Hoechst 33342; Life Technologies, 3570).
Dual-luciferase reporter assay system.
To assess Wnt activity, we used the Dual-Luciferase Reporter Assay System (Promega) to detect the signal produced by TOP-FLASH (with a β-catenin–activated promoter) reporter plasmid. Briefly, HEK293T cells were transiently transfected with a plasmid mixture containing NDP, FZD4, LRP5, TSPAN12, TOP-FLASH, and Renilla as a transfection control. These plasmids were a gift from H. Junge (University of Minnesota, Minneapolis, Minnesota, USA). We used rhNorrin (R&D Systems), rhWNT3a (R&D Systems), WNT3a overexpression, NDP overexpression, or small-molecule GSK3 inhibitors (CHIR or BIO) as positive controls to activate canonical Wnt signaling in different experiments. Cells were incubated for 24 or 48 hours and cell lysates were prepared by passive lysis according to the manufacturer’s instruction. Luminescence signals were measured and normalized to the Renilla internal control using a bench-top luminometer.
Flow cytometric analysis.
Flow cytometric analysis was used to quantify the percentage of mCherry+ and GFP+ cells for the competition assay. Cells were lifted using Accutase, washed with PBS, and then fixed using 4% PFA. Wild-type and single fluorescent marker cells were used as controls for each experiment. The flow cytometric run, analysis, and quantification were performed at SickKids-UHN Flow and Mass Cytometry Facility, and results were visualized using FlowJo software.
RNA extraction and qRT-PCR.
RNA was extracted using the RNeasy mini-prep (Qiagen), according to the manufacturer’s instructions. The concentration and purity of RNA were assessed using a bench-top Nanodrop. First-strand complementary cDNA was reverse transcribed using a QuantiTect (Qiagen) kit, according to the manufacturer’s instructions. All samples included a no–reverse transcriptase negative control to ensure total elimination of genomic DNA. The resulting cDNA was stored at –20°C. For the qRT-PCR analyses, we used the iQ SYBR Green Supermix (Bio-Rad), as per the manufacturer’s instructions. Results were statistically analyzed according to standard protocols to generate ΔΔCT values and comparative fold changes in gene expression relative to the controls. All qRT-PCR products were confirmed by gel electrophoresis, sequencing, as well as the existence of only 1 melting curve peak per gene product.
PCR primers.
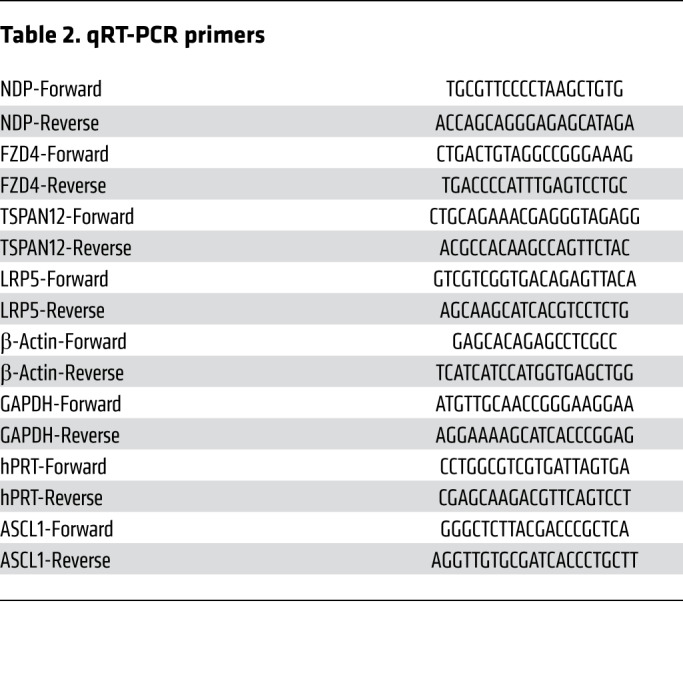
qRT-PCR primers were generated using the NCBI primer blast tool with standard parameters, and specifically designed to span an exon-exon junction to avoid genomic gDNA amplification. Primers were synthesized by ACGT Corp and are listed in Table 2.
Table 2. qRT-PCR primers.
RNA-Seq analysis.
Cells were infected with shScrambled-, shNDP-A–, or shNDP-C–expressing lentiviruses and after 48 hours GFP reporter expression was confirmed and RNA was extracted using the RNeasy Mini Kit (Qiagen). A portion of each sample was used to synthesize cDNA and confirm NDP knockdown efficiency using qRT-PCR, as described above. Samples were submitted to the Genome Quebec center, where RNA quality was confirmed using Bioanalyzer (Agilent), and then RNA-Seq libraries were run. The screen consisted of 2 GSC lines: G523 and G411. Each GSC line had 9 samples: 3 biological replicates of shScrambled controls, 3 biological replicates of shNDP-A–, and 3 biological replicates of shNDP-C–transduced cells. Sample extracts were enriched for stranded poly(A) mRNA and sequenced on an Illumina HiSeq 4000 PE100. Bioinformatics analysis was carried out using the GenPipes RNA-Seq pipeline (69). Briefly, paired-end sequencing reads were clipped for adapter sequence, trimmed for minimum quality (Q30) in 3′, and filtered for a minimum length of 32 bp using Trimmomatic (70). Surviving read pairs were aligned to the Ensembl release 87 GRCh38 Homo sapiens genome assembly using the STAR (71) 2-pass method. Exploratory analysis was conducted using various functions and packages from R and the Bioconductor project (72). A gene-level count-based gene quantification against Ensembl annotations was performed using HT-seq count (73) in the intersection-nonempty mode. Differential expression analysis was conducted using both edgeR (74) and DEseq (75). Terms from Gene Ontology were tested for enrichment with the GOseq (76) R package. Transcript-level assembly, quantification, and differential expression analysis was performed using Cufflinks (77) and Cuffdiff (78). GSEA was carried out using fGSEA (79). The results of the enrichment analysis were used to create an enrichment map using the Enrichment Map (80) application for Cytoscape (81). RNA-Seq data were deposited in the NCBI’s Gene Expression Omnibus database (GEO GSE128255).
Animals.
For in vivo transplantation experiments we used 5- to 8-week-old NOD.Cg-PrkdcscidIl2rgtm1Wjl/SzJ (NSG) female mice. All mice were purchased from the Animal Research Center (ARC), UHN, Toronto, Canada. Experimental groups consisted of at least 5 mice/ group. Randomization was not performed. Mice were housed in our facility located at the Krembil Discovery Tower, Toronto Western Hospital.
Orthotopic xenografting.
Lentivirus-infected GSCs were dissociated using Accutase, and then reconstituted to a concentration of 50,000 cells/μL in PBS. Mice were anesthetized with ketamine/medetomidine and immobilized using a stereotaxic head frame. After shaving the head, an incision was made at the midline, and then a bore hole was drilled in the skull 1 mm lateral and 2 mm posterior to Bregma. Using a Hamilton syringe with a 27-G round-bottom needle, cells were uniformly injected with an automated nanoinjector over a 3-minute period. After injection, the needle was left in place for 5 minutes to avoid cell reflux, and then removed slowly. Finally, the skull was covered with bone wax and the incision was closed with sutures (size 5.0) followed by reversal of the anesthetic. Tramadol (Sigma-Aldrich) was used for analgesia according to the ethics board protocols and recommendations for major surgeries. After surgery, animals were observed on a daily basis until they developed symptomatic tumors. Upon tumor formation, mice were sacrificed, perfused with PBS and 4% PFA, and brains were collected and fixed according to protocols for IHC analysis, as described above. Mice that developed complications due to surgery were removed from the study.
Statistics.
Unless otherwise is indicated, all experiments were repeated at least 3 independent times (3 biological replicates); each of them included at least 3 technical replicates. All groups in each experiment were matched in regard to number of biological and technical replicates. In addition, cells were matched in regard to passage number and culture conditions, as well as chemical and reagent stocks. Quantification of IHC marker staining was performed manually with the assistance of Zeiss software by visually detecting and marking positive cells, and then manually counting them. Quantification of qRT-PCR experiments was performed using the standard ΔΔCT method, comparing the expression levels of experimental samples to internal controls of housekeeping genes and then experimental control of untreated or unmodified cells. Statistical significance was tested using unpaired 2-tailed Student’s t test when comparing 2 groups, and 1-way analysis of variance (ANOVA) when performing multiple comparisons. Significance of in vivo transplantation and survival experiments was assessed using the log-rank test. P less than 0.05 was considered statistically significant.
Study approval.
Primary tumor–derived GNS and hNSC lines were obtained, derived, and maintained under the Research Ethics Board at the Hospital for Sick Children (Toronto, Canada) and all animal experimental protocols were approved by the ethics and biosafety board of the ARC, UHN (Toronto, Canada).
Author contributions
AES, HS, PD, KA, and VAW conceptualized the study. AES, HS, LL, N Pokrajic, N Park, NT, KR, YM, and VAW developed methodology. AES, YM, N Pokrajic, NT, and VAW performed investigations. AES, YM, and VAW carried out formal analysis. AOM, AES, and VAW were responsible for visualization of data. AES and VAW wrote the original draft of the manuscript, and YM, HS, AES, and VAW revised and edited. KA, PD, and VAW acquired funding, provided resources, and supervised.
Supplementary Material
Acknowledgments
We thank C. Schuurmans, H. Junge, M. Taylor, and L. Megeney for helpful discussions and comments on the manuscript, as well as Emily Reddy of the SickKids-UHN Flow and Mass Cytometry Facility for her assistance. We also thank H. Junge for reagents and technical advice and François Lefebvre and Jose Hector Galvez at the Canadian Centre for Computational Genomics (C3G) for their help with the RNA-Seq analysis. The C3G is a Node of the Canadian Genomic Innovation Network and is supported by the Canadian Government through Genome Canada. This work was supported by operating grants to VAW from the Cancer Research Society and the Canadian Institutes of Health Research.
Version 1. 03/17/2020
In-Press Preview
Version 2. 05/11/2020
Electronic publication
Version 3. 06/01/2020
Print issue publication
Footnotes
Conflict of interest: The authors have declared that no conflict of interest exists.
Copyright: © 2020, American Society for Clinical Investigation.
Reference information: J Clin Invest. 2020;130(6):3069–3086.https://doi.org/10.1172/JCI128994.
See the related Commentary at Norrin mediates opposing effects on tumor progression of glioblastoma stem cells.
Contributor Information
Ahmed El-Sehemy, Email: elsehemy@ualberta.ca.
Arturo Ortin-Martinez, Email: Arturo.OrtinMartinez@uhnresearch.ca.
Yasin Mamatjan, Email: ymamatjan@gmail.com.
Nobuhiko Tachibana, Email: Nobuhiko.Tachibana@uhnresearch.ca.
Lilian Lee, Email: lilian.lee@sickkids.ca.
Peter Dirks, Email: peter.dirks@sickkids.ca.
Valerie A. Wallace, Email: valerie.wallace@uhnresearch.ca.
References
- 1.Tykocki T, Eltayeb M. Ten-year survival in glioblastoma. A systematic review. J Clin Neurosci. 2018;54:7–13. doi: 10.1016/j.jocn.2018.05.002. [DOI] [PubMed] [Google Scholar]
- 2.Wen PY, Kesari S. Malignant gliomas in adults. N Engl J Med. 2008;359(5):492–507. doi: 10.1056/NEJMra0708126. [DOI] [PubMed] [Google Scholar]
- 3.Carlsson SK, Brothers SP, Wahlestedt C. Emerging treatment strategies for glioblastoma multiforme. EMBO Mol Med. 2014;6(11):1359–1370. doi: 10.15252/emmm.201302627. [DOI] [PMC free article] [PubMed] [Google Scholar]
- 4.von Neubeck C, Seidlitz A, Kitzler HH, Beuthien-Baumann B, Krause M. Glioblastoma multiforme: emerging treatments and stratification markers beyond new drugs. Br J Radiol. 2015;88(1053):20150354. doi: 10.1259/bjr.20150354. [DOI] [PMC free article] [PubMed] [Google Scholar]
- 5.Hegi ME, et al. MGMT gene silencing and benefit from temozolomide in glioblastoma. N Engl J Med. 2005;352(10):997–1003. doi: 10.1056/NEJMoa043331. [DOI] [PubMed] [Google Scholar]
- 6.Cloughesy TF, Cavenee WK, Mischel PS. Glioblastoma: from molecular pathology to targeted treatment. Annu Rev Pathol. 2014;9:1–25. doi: 10.1146/annurev-pathol-011110-130324. [DOI] [PubMed] [Google Scholar]
- 7.Thomas A, Tanaka M, Trepel J, Reinhold WC, Rajapakse VN, Pommier Y. Temozolomide in the era of precision medicine. Cancer Res. 2017;77(4):823–826. doi: 10.1158/0008-5472.CAN-16-2983. [DOI] [PMC free article] [PubMed] [Google Scholar]
- 8.Brennan CW, et al. The somatic genomic landscape of glioblastoma. Cell. 2013;155(2):462–477. doi: 10.1016/j.cell.2013.09.034. [DOI] [PMC free article] [PubMed] [Google Scholar]
- 9.Meyer M, et al. Single cell-derived clonal analysis of human glioblastoma links functional and genomic heterogeneity. Proc Natl Acad Sci U S A. 2015;112(3):851–856. doi: 10.1073/pnas.1320611111. [DOI] [PMC free article] [PubMed] [Google Scholar]
- 10.Patel AP, et al. Single-cell RNA-seq highlights intratumoral heterogeneity in primary glioblastoma. Science. 2014;344(6190):1396–1401. doi: 10.1126/science.1254257. [DOI] [PMC free article] [PubMed] [Google Scholar]
- 11.Singh SK, et al. Identification of human brain tumour initiating cells. Nature. 2004;432(7015):396–401. doi: 10.1038/nature03128. [DOI] [PubMed] [Google Scholar]
- 12.Lan X, et al. Fate mapping of human glioblastoma reveals an invariant stem cell hierarchy. Nature. 2017;549(7671):227–232. doi: 10.1038/nature23666. [DOI] [PMC free article] [PubMed] [Google Scholar]
- 13.Tirosh I, et al. Single-cell RNA-seq supports a developmental hierarchy in human oligodendroglioma. Nature. 2016;539(7628):309–313. doi: 10.1038/nature20123. [DOI] [PMC free article] [PubMed] [Google Scholar]
- 14.Chen J, et al. A restricted cell population propagates glioblastoma growth after chemotherapy. Nature. 2012;488(7412):522–526. doi: 10.1038/nature11287. [DOI] [PMC free article] [PubMed] [Google Scholar]
- 15.Batlle E, Clevers H. Cancer stem cells revisited. Nat Med. 2017;23(10):1124–1134. doi: 10.1038/nm.4409. [DOI] [PubMed] [Google Scholar]
- 16.Nassar D, Blanpain C. Cancer stem cells: Basic concepts and therapeutic implications. Annu Rev Pathol. 2016;11:47–76. doi: 10.1146/annurev-pathol-012615-044438. [DOI] [PubMed] [Google Scholar]
- 17.Bradley CA. Glioblastoma: Stem cells - masters of their fates. Nat Rev Cancer. 2017;17(10):574–575. doi: 10.1038/nrc.2017.88. [DOI] [PubMed] [Google Scholar]
- 18.Seton-Rogers S. Glioblastoma: Cancer stem cell knockout. Nat Rev Cancer. 2014;14(7):452–453. doi: 10.1038/nrc3771. [DOI] [PubMed] [Google Scholar]
- 19.Zhang N, et al. FoxM1 promotes β-catenin nuclear localization and controls Wnt target-gene expression and glioma tumorigenesis. Cancer Cell. 2011;20(4):427–442. doi: 10.1016/j.ccr.2011.08.016. [DOI] [PMC free article] [PubMed] [Google Scholar]
- 20.de Sousa E Melo F, Vermeulen L. Wnt signaling in cancer stem cell biology. Cancers (Basel) 2016;8(7):E60. doi: 10.3390/cancers8070060. [DOI] [PMC free article] [PubMed] [Google Scholar]
- 21.Clevers H, Nusse R. Wnt/β-catenin signaling and disease. Cell. 2012;149(6):1192–1205. doi: 10.1016/j.cell.2012.05.012. [DOI] [PubMed] [Google Scholar]
- 22.McCord M, Mukouyama YS, Gilbert MR, Jackson S. Targeting WNT signaling for multifaceted glioblastoma therapy. Front Cell Neurosci. 2017;11:318. doi: 10.3389/fncel.2017.00318. [DOI] [PMC free article] [PubMed] [Google Scholar]
- 23.Rampazzo E, et al. Wnt activation promotes neuronal differentiation of glioblastoma. Cell Death Dis. 2013;4:e500. doi: 10.1038/cddis.2013.32. [DOI] [PMC free article] [PubMed] [Google Scholar]
- 24.De Robertis A, et al. Identification and characterization of a small-molecule inhibitor of Wnt signaling in glioblastoma cells. Mol Cancer Ther. 2013;12(7):1180–1189. doi: 10.1158/1535-7163.MCT-12-1176-T. [DOI] [PMC free article] [PubMed] [Google Scholar]
- 25.Suwala AK, Hanaford A, Kahlert UD, Maciaczyk J. Clipping the wings of glioblastoma: modulation of WNT as a novel therapeutic strategy. J Neuropathol Exp Neurol. 2016;75(5):388–396. doi: 10.1093/jnen/nlw013. [DOI] [PubMed] [Google Scholar]
- 26.Wang J, et al. DACH1 inhibits glioma invasion and tumor growth via the Wnt/catenin pathway. Onco Targets Ther. 2018;11:5853–5863. doi: 10.2147/OTT.S168314. [DOI] [PMC free article] [PubMed] [Google Scholar]
- 27.Xu Q, et al. Vascular development in the retina and inner ear: control by Norrin and Frizzled-4, a high-affinity ligand-receptor pair. Cell. 2004;116(6):883–895. doi: 10.1016/S0092-8674(04)00216-8. [DOI] [PubMed] [Google Scholar]
- 28.Junge HJ, et al. TSPAN12 regulates retinal vascular development by promoting Norrin- but not Wnt-induced FZD4/beta-catenin signaling. Cell. 2009;139(2):299–311. doi: 10.1016/j.cell.2009.07.048. [DOI] [PubMed] [Google Scholar]
- 29.Ke J, et al. Structure and function of Norrin in assembly and activation of a Frizzled 4-Lrp5/6 complex. Genes Dev. 2013;27(21):2305–2319. doi: 10.1101/gad.228544.113. [DOI] [PMC free article] [PubMed] [Google Scholar]
- 30.Richter M, Gottanka J, May CA, Welge-Lüssen U, Berger W, Lütjen-Drecoll E. Retinal vasculature changes in Norrie disease mice. Invest Ophthalmol Vis Sci. 1998;39(12):2450–2457. [PubMed] [Google Scholar]
- 31.Rehm HL, et al. Vascular defects and sensorineural deafness in a mouse model of Norrie disease. J Neurosci. 2002;22(11):4286–4292. doi: 10.1523/JNEUROSCI.22-11-04286.2002. [DOI] [PMC free article] [PubMed] [Google Scholar]
- 32.Ye X, et al. Norrin, frizzled-4, and Lrp5 signaling in endothelial cells controls a genetic program for retinal vascularization. Cell. 2009;139(2):285–298. doi: 10.1016/j.cell.2009.07.047. [DOI] [PMC free article] [PubMed] [Google Scholar]
- 33.Wang Y, Rattner A, Zhou Y, Williams J, Smallwood PM, Nathans J. Norrin/Frizzled4 signaling in retinal vascular development and blood brain barrier plasticity. Cell. 2012;151(6):1332–1344. doi: 10.1016/j.cell.2012.10.042. [DOI] [PMC free article] [PubMed] [Google Scholar]
- 34.Bassett EA, et al. Norrin/Frizzled4 signalling in the preneoplastic niche blocks medulloblastoma initiation. Elife. 2016;5:e16764. doi: 10.7554/eLife.16764. [DOI] [PMC free article] [PubMed] [Google Scholar]
- 35.Miller SJ, et al. Molecularly defined cortical astroglia subpopulation modulates neurons via secretion of Norrin. Nat Neurosci. 2019;22(5):741–752. doi: 10.1038/s41593-019-0366-7. [DOI] [PMC free article] [PubMed] [Google Scholar]
- 36.Uhlen M, et al. A pathology atlas of the human cancer transcriptome. Science. 2017;357(6352):eaan2507. doi: 10.1126/science.aan2507. [DOI] [PubMed] [Google Scholar]
- 37.Barretina J, et al. Addendum: The Cancer Cell Line Encyclopedia enables predictive modelling of anticancer drug sensitivity. Nature. 2019;565(7738):E5–E6. doi: 10.1038/s41586-018-0722-x. [DOI] [PubMed] [Google Scholar]
- 38.Leopold SA, et al. Norrin protects optic nerve axons from degeneration in a mouse model of glaucoma. Sci Rep. 2017;7(1):14274. doi: 10.1038/s41598-017-14423-8. [DOI] [PMC free article] [PubMed] [Google Scholar]
- 39.McNeill B, et al. Hedgehog regulates Norrie disease protein to drive neural progenitor self-renewal. Hum Mol Genet. 2013;22(5):1005–1016. doi: 10.1093/hmg/dds505. [DOI] [PubMed] [Google Scholar]
- 40.Deng C, Reddy P, Cheng Y, Luo CW, Hsiao CL, Hsueh AJ. Multi-functional norrin is a ligand for the LGR4 receptor. J Cell Sci. 2013;126(pt 9):2060–2068. doi: 10.1242/jcs.123471. [DOI] [PMC free article] [PubMed] [Google Scholar]
- 41.Xu S, Cheng F, Liang J, Wu W, Zhang J. Maternal xNorrin, a canonical Wnt signaling agonist and TGF-β antagonist, controls early neuroectoderm specification in Xenopus. PLoS Biol. 2012;10(3):e1001286. doi: 10.1371/journal.pbio.1001286. [DOI] [PMC free article] [PubMed] [Google Scholar]
- 42.Pollard SM, et al. Glioma stem cell lines expanded in adherent culture have tumor-specific phenotypes and are suitable for chemical and genetic screens. Cell Stem Cell. 2009;4(6):568–580. doi: 10.1016/j.stem.2009.03.014. [DOI] [PubMed] [Google Scholar]
- 43.Rheinbay E, et al. An aberrant transcription factor network essential for Wnt signaling and stem cell maintenance in glioblastoma. Cell Rep. 2013;3(5):1567–1579. doi: 10.1016/j.celrep.2013.04.021. [DOI] [PMC free article] [PubMed] [Google Scholar]
- 44.Park NI, et al. ASCL1 reorganizes chromatin to direct neuronal fate and suppress tumorigenicity of glioblastoma stem cells. Cell Stem Cell. 2017;21(2):209–224.e7. doi: 10.1016/j.stem.2017.06.004. [DOI] [PubMed] [Google Scholar]
- 45.Bertrand N, Castro DS, Guillemot F. Proneural genes and the specification of neural cell types. Nat Rev Neurosci. 2002;3(7):517–530. doi: 10.1038/nrn874. [DOI] [PubMed] [Google Scholar]
- 46.Chanda S, et al. Generation of induced neuronal cells by the single reprogramming factor ASCL1. Stem Cell Reports. 2014;3(2):282–296. doi: 10.1016/j.stemcr.2014.05.020. [DOI] [PMC free article] [PubMed] [Google Scholar]
- 47.Pang ZP, et al. Induction of human neuronal cells by defined transcription factors. Nature. 2011;476(7359):220–223. doi: 10.1038/nature10202. [DOI] [PMC free article] [PubMed] [Google Scholar]
- 48.Tanaka R, et al. Accurate determination of S-phase fraction in proliferative cells by dual fluorescence and peroxidase immunohistochemistry with 5-bromo-2’-deoxyuridine (BrdU) and Ki67 antibodies. J Histochem Cytochem. 2011;59(8):791–798. doi: 10.1369/0022155411411090. [DOI] [PMC free article] [PubMed] [Google Scholar]
- 49.Paes KT, et al. Frizzled 4 is required for retinal angiogenesis and maintenance of the blood-retina barrier. Invest Ophthalmol Vis Sci. 2011;52(9):6452–6461. doi: 10.1167/iovs.10-7146. [DOI] [PubMed] [Google Scholar]
- 50.Gao L, et al. Wnt/β-catenin signaling pathway inhibits the proliferation and apoptosis of U87 glioma cells via different mechanisms. PLoS One. 2017;12(8):e0181346. doi: 10.1371/journal.pone.0181346. [DOI] [PMC free article] [PubMed] [Google Scholar]
- 51.Buss H, et al. Phosphorylation of serine 468 by GSK-3beta negatively regulates basal p65 NF-kappaB activity. J Biol Chem. 2004;279(48):49571–49574. doi: 10.1074/jbc.C400442200. [DOI] [PubMed] [Google Scholar]
- 52.Winston JT, Strack P, Beer-Romero P, Chu CY, Elledge SJ, Harper JW. The SCFbeta-TRCP-ubiquitin ligase complex associates specifically with phosphorylated destruction motifs in IkappaBalpha and beta-catenin and stimulates IkappaBalpha ubiquitination in vitro. Genes Dev. 1999;13(3):270–283. doi: 10.1101/gad.13.3.270. [DOI] [PMC free article] [PubMed] [Google Scholar]
- 53.Die L, Yan P, Jun Jiang Z, Min Hua T, Cai W, Xing L. Glycogen synthase kinase-3 beta inhibitor suppresses Porphyromonas gingivalis lipopolysaccharide-induced CD40 expression by inhibiting nuclear factor-kappa B activation in mouse osteoblasts. Mol Immunol. 2012;52(1):38–49. doi: 10.1016/j.molimm.2012.04.005. [DOI] [PubMed] [Google Scholar]
- 54.Takebe N, et al. Targeting Notch, Hedgehog, and Wnt pathways in cancer stem cells: clinical update. Nat Rev Clin Oncol. 2015;12(8):445–464. doi: 10.1038/nrclinonc.2015.61. [DOI] [PMC free article] [PubMed] [Google Scholar]
- 55.Ye X, Wang Y, Nathans J. The Norrin/Frizzled4 signaling pathway in retinal vascular development and disease. Trends Mol Med. 2010;16(9):417–425. doi: 10.1016/j.molmed.2010.07.003. [DOI] [PMC free article] [PubMed] [Google Scholar]
- 56.Zhan T, Rindtorff N, Boutros M. Wnt signaling in cancer. Oncogene. 2017;36(11):1461–1473. doi: 10.1038/onc.2016.304. [DOI] [PMC free article] [PubMed] [Google Scholar]
- 57.Zheng H, et al. PLAGL2 regulates Wnt signaling to impede differentiation in neural stem cells and gliomas. Cancer Cell. 2010;17(5):497–509. doi: 10.1016/j.ccr.2010.03.020. [DOI] [PMC free article] [PubMed] [Google Scholar]
- 58.Morris LG, et al. Recurrent somatic mutation of FAT1 in multiple human cancers leads to aberrant Wnt activation. Nat Genet. 2013;45(3):253–261. doi: 10.1038/ng.2538. [DOI] [PMC free article] [PubMed] [Google Scholar]
- 59.Niehrs C. The complex world of WNT receptor signalling. Nat Rev Mol Cell Biol. 2012;13(12):767–779. doi: 10.1038/nrm3470. [DOI] [PubMed] [Google Scholar]
- 60.Lee Y, Lee JK, Ahn SH, Lee J, Nam DH. WNT signaling in glioblastoma and therapeutic opportunities. Lab Invest. 2016;96(2):137–150. doi: 10.1038/labinvest.2015.140. [DOI] [PubMed] [Google Scholar]
- 61.Bengoa-Vergniory N, Kypta RM. Canonical and noncanonical Wnt signaling in neural stem/progenitor cells. Cell Mol Life Sci. 2015;72(21):4157–4172. doi: 10.1007/s00018-015-2028-6. [DOI] [PMC free article] [PubMed] [Google Scholar]
- 62.Tian XH, et al. XAV939, a tankyrase 1 inhibitior, promotes cell apoptosis in neuroblastoma cell lines by inhibiting Wnt/β-catenin signaling pathway. J Exp Clin Cancer Res. 2013;32:100. doi: 10.1186/1756-9966-32-100. [DOI] [PMC free article] [PubMed] [Google Scholar]
- 63.Ma L, Wang X, Jia T, Wei W, Chua MS, So S. Tankyrase inhibitors attenuate WNT/β-catenin signaling and inhibit growth of hepatocellular carcinoma cells. Oncotarget. 2015;6(28):25390–25401. doi: 10.18632/oncotarget.4455. [DOI] [PMC free article] [PubMed] [Google Scholar]
- 64.Boso D, et al. HIF-1α/Wnt signaling-dependent control of gene transcription regulates neuronal differentiation of glioblastoma stem cells. Theranostics. 2019;9(17):4860–4877. doi: 10.7150/thno.35882. [DOI] [PMC free article] [PubMed] [Google Scholar]
- 65.Ohlmann A, Tamm ER. Norrin: molecular and functional properties of an angiogenic and neuroprotective growth factor. Prog Retin Eye Res. 2012;31(3):243–257. doi: 10.1016/j.preteyeres.2012.02.002. [DOI] [PubMed] [Google Scholar]
- 66.Chen Y, et al. Norrin protected blood-brain barrier via frizzled-4/β-catenin pathway after subarachnoid hemorrhage in rats. Stroke. 2015;46(2):529–536. doi: 10.1161/STROKEAHA.114.007265. [DOI] [PMC free article] [PubMed] [Google Scholar]
- 67.Luhmann UF, et al. Fetal loss in homozygous mutant Norrie disease mice: a new role of Norrin in reproduction. Genesis. 2005;42(4):253–262. doi: 10.1002/gene.20141. [DOI] [PubMed] [Google Scholar]
- 68.Hu Y, Smyth GK. ELDA: extreme limiting dilution analysis for comparing depleted and enriched populations in stem cell and other assays. J Immunol Methods. 2009;347(1–2):70–78. doi: 10.1016/j.jim.2009.06.008. [DOI] [PubMed] [Google Scholar]
- 69.Bourgey M, et al. GenPipes: an open-source framework for distributed and scalable genomic analyses. Gigascience. 2019;8(6):giz037. doi: 10.1093/gigascience/giz037. [DOI] [PMC free article] [PubMed] [Google Scholar]
- 70.Bolger AM, Lohse M, Usadel B. Trimmomatic: a flexible trimmer for Illumina sequence data. Bioinformatics. 2014;30(15):2114–2120. doi: 10.1093/bioinformatics/btu170. [DOI] [PMC free article] [PubMed] [Google Scholar]
- 71.Dobin A, et al. STAR: ultrafast universal RNA-seq aligner. Bioinformatics. 2013;29(1):15–21. doi: 10.1093/bioinformatics/bts635. [DOI] [PMC free article] [PubMed] [Google Scholar]
- 72.Huber W, et al. Orchestrating high-throughput genomic analysis with Bioconductor. Nat Methods. 2015;12(2):115–121. doi: 10.1038/nmeth.3252. [DOI] [PMC free article] [PubMed] [Google Scholar]
- 73.Anders S, Pyl PT, Huber W. HTSeq--a Python framework to work with high-throughput sequencing data. Bioinformatics. 2015;31(2):166–169. doi: 10.1093/bioinformatics/btu638. [DOI] [PMC free article] [PubMed] [Google Scholar]
- 74.Robinson MD, McCarthy DJ, Smyth GK. edgeR: a Bioconductor package for differential expression analysis of digital gene expression data. Bioinformatics. 2010;26(1):139–140. doi: 10.1093/bioinformatics/btp616. [DOI] [PMC free article] [PubMed] [Google Scholar]
- 75.Anders S, Huber W. Differential expression analysis for sequence count data. Genome Biol. 2010;11(10):R106. doi: 10.1186/gb-2010-11-10-r106. [DOI] [PMC free article] [PubMed] [Google Scholar]
- 76.Young MD, Wakefield MJ, Smyth GK, Oshlack A. Gene ontology analysis for RNA-seq: accounting for selection bias. Genome Biol. 2010;11(2):R14. doi: 10.1186/gb-2010-11-2-r14. [DOI] [PMC free article] [PubMed] [Google Scholar]
- 77.Trapnell C, et al. Transcript assembly and quantification by RNA-Seq reveals unannotated transcripts and isoform switching during cell differentiation. Nat Biotechnol. 2010;28(5):511–515. doi: 10.1038/nbt.1621. [DOI] [PMC free article] [PubMed] [Google Scholar]
- 78.Trapnell C, Hendrickson DG, Sauvageau M, Goff L, Rinn JL, Pachter L. Differential analysis of gene regulation at transcript resolution with RNA-seq. Nat Biotechnol. 2013;31(1):46–53. doi: 10.1038/nbt.2450. [DOI] [PMC free article] [PubMed] [Google Scholar]
- 79. Korotkevich G, Sukhov V, Sergushichev A. Fast gene set enrichment analysis [preprint]. https://www.biorxiv.org/content/10.1101/060012v2 Posted on bioRxiv October 22, 2019.
- 80.Merico D, Isserlin R, Stueker O, Emili A, Bader GD. Enrichment map: a network-based method for gene-set enrichment visualization and interpretation. PLoS One. 2010;5(11):e13984. doi: 10.1371/journal.pone.0013984. [DOI] [PMC free article] [PubMed] [Google Scholar]
- 81.Shannon P, et al. Cytoscape: a software environment for integrated models of biomolecular interaction networks. Genome Res. 2003;13(11):2498–2504. doi: 10.1101/gr.1239303. [DOI] [PMC free article] [PubMed] [Google Scholar]
Associated Data
This section collects any data citations, data availability statements, or supplementary materials included in this article.