

Abstract
In the last decade, along with the increasing use of graphene oxide (GO) in various applications, there is also considerable interest in understanding its effects on human health. To date, only few experimental approaches can realistically simulate common routes of exposure, such as ingestion, due to the inherent complexity of the digestive tract. This study presents the synthesis of size-sorted GO of submicron- or micron-sized lateral dimensions, its physicochemical transformations across mouth, gastric, and small intestinal simulated digestions, and its toxicological assessment against a physiologically relevant, in vitro cellular model of the human intestinal epithelium. Results from real-time characterization of the simulated digestas of the gastrointestinal tract (GIT) using multi-angle laser diffraction and field-emission scanning electron microscopy (FESEM) showed that GO agglomerates in the gastric and small intestinal phase. Extensive morphological changes, such as folding, were also observed on GO following simulated digestion. Furthermore, X-ray photoelectron spectroscopy (XPS) revealed that GO presents covalently bound N-containing groups on its surface. Interestingly, it was shown that the GO employed in this study underwent reduction. Toxicological assessment of the GO small intestinal digesta over 24 hours did not point to acute cytotoxicity and examination of the intestinal epithelium under electron microscopy did not reveal any histological alterations. Importantly, both submicron- and micron-sized GO variants elicited a 20% statistically significant increase in reactive oxygen species generation compared to the untreated control after a 6-hour exposure.
Keywords: graphene oxide, ingestion, reduction, agglomeration, toxicity
1. Introduction
Two-dimensional (2D) engineered nanomaterials (ENMs) are characterized by enormous surface area, anisotropic geometry, and electron confinement in a planar surface that render them good candidates for numerous applications in the electronics, energy, construction, and biomedical industry, among others[1–4]. Graphene, a single atom-thick allotrope of carbon with its atoms arranged in a hexagonal lattice, is probably the most well-studied 2D ENM. Its discovery in 2004[5] kickstarted a wave of interest in 2D nano-structures and nowadays the production of graphene-related materials has already reached several thousand metric tons per year[6]. Its oxidized counterpart, graphene oxide (GO), has also garnered interest due to its scalable production at declining cost[7,8] and physical and chemical properties which can be tailored to fit the needs of various applications[9]. Specifically, its high surface area, versatile chemistry, self-assembling properties, and biodegradability have led to its potential incorporation to existing applications and have also spurred the development of new technologies,[10,11] with GO currently being explored in the food[12], agriculture[13], biomedical[14], and water purification and remediation industries[15]. This intense interest in GO is reflected on increasing production forecasts for graphene related materials and is translated to GO-enabled products and services, especially in composite materials. Such development inevitably exposes end-consumers and workforce to GO and its life-cycle by-products, and the scientific community has already undertaken its toxicological profiling.
Myriad studies have already investigated the biological effects of GO on cells, tissues, and animals assuming inhalation or intravenous administration as the most plausible human exposure routes[16–18]. At the same time, its application in food packaging[12], water filtration[19], nanomedicine[20], and the general potential of carbon-based ENMs in agriculture[21] suggest that ingestion is another possible route for human exposure to GO. Interestingly, there have only been a handful of studies to explore the toxicodynamics of ingested GO on human intestinal epithelial cells[22–26] and even fewer in vivo studies of its system-wide effects upon oral administration[27–29]. Even more so, the bio-transformations of GO across the GIT have remained practically unstudied with only one such published work[26]. As it stands, the limited literature, discrepancies in utilized GO (size and oxidation state) and in vitro methodologies confound the assessment of its physicochemical transformations and biological fate in the GIT.
Engineered nanomaterials are increasingly used in the food industry to enhance product durability and are even used as additives to improve sensory effects and boost nutritional value of food products. The determination of their impact on human health upon ingestion has been attracting the interest of the nanosafety community[30]. Still, there are knowledge gaps regarding the toxicokinetics of ingested ENMs following absorption from the GIT, their acute and chronic effects on the gastrointestinal barrier, and their toxicodynamics, including bio-transformations as they undergo digestion. Food matrix may further modulate the response of biological systems to ingested ENMs[31,32] and complicate the identification of physical and chemical alterations which might govern their toxicological impact. These alterations include bio-dissolution[33], biomolecular corona formation[34], and morphological changes, like agglomeration[35]. In the case of anisotropic, carbonaceous, soft materials like GO, the technical challenges are ever so harder to overcome and could partially explain the scarcity in available literature.
In order to address the aforementioned knowledge gaps, two distinctly sized populations of GO were synthesized in this study. The synthesized sub-micron and a micron-sized GO variants were incorporated in a fasting food model (FFM) and submitted to a three-stage (oral, gastric, small intestinal), simulated gastrointestinal digestion according to a methodology previously developed by our group[36]. The physical and chemical transformations of GO were analyzed by employing multiple techniques. Particularly, real-time, ensemble size measurements of GO were performed using multi-angle laser diffraction to follow its agglomeration along the GIT. Furthermore, a custom-developed sample preparation protocol allowed us to observe microscale alterations on GO’s morphology by means of field-emission scanning electron microscopy. Moreover, it was possible to probe the chemical modifications on the surface of GO after its simulated digestion by means of X-ray photoelectron spectroscopy. Finally, we performed the toxicological assessment of GO digesta using a physiologically relevant, tri-culture in vitro model of the human small intestinal epithelium consisting of differentiated small intestinal enterocytes (Caco-2 cells), mucus-secreting goblet cell-like cells (HT29), and specialized Microfold cells, naturally associated with the lymphatic system[36]. Figure 1 summarizes the study design.
Figure 1. Stepwise overview of the study.
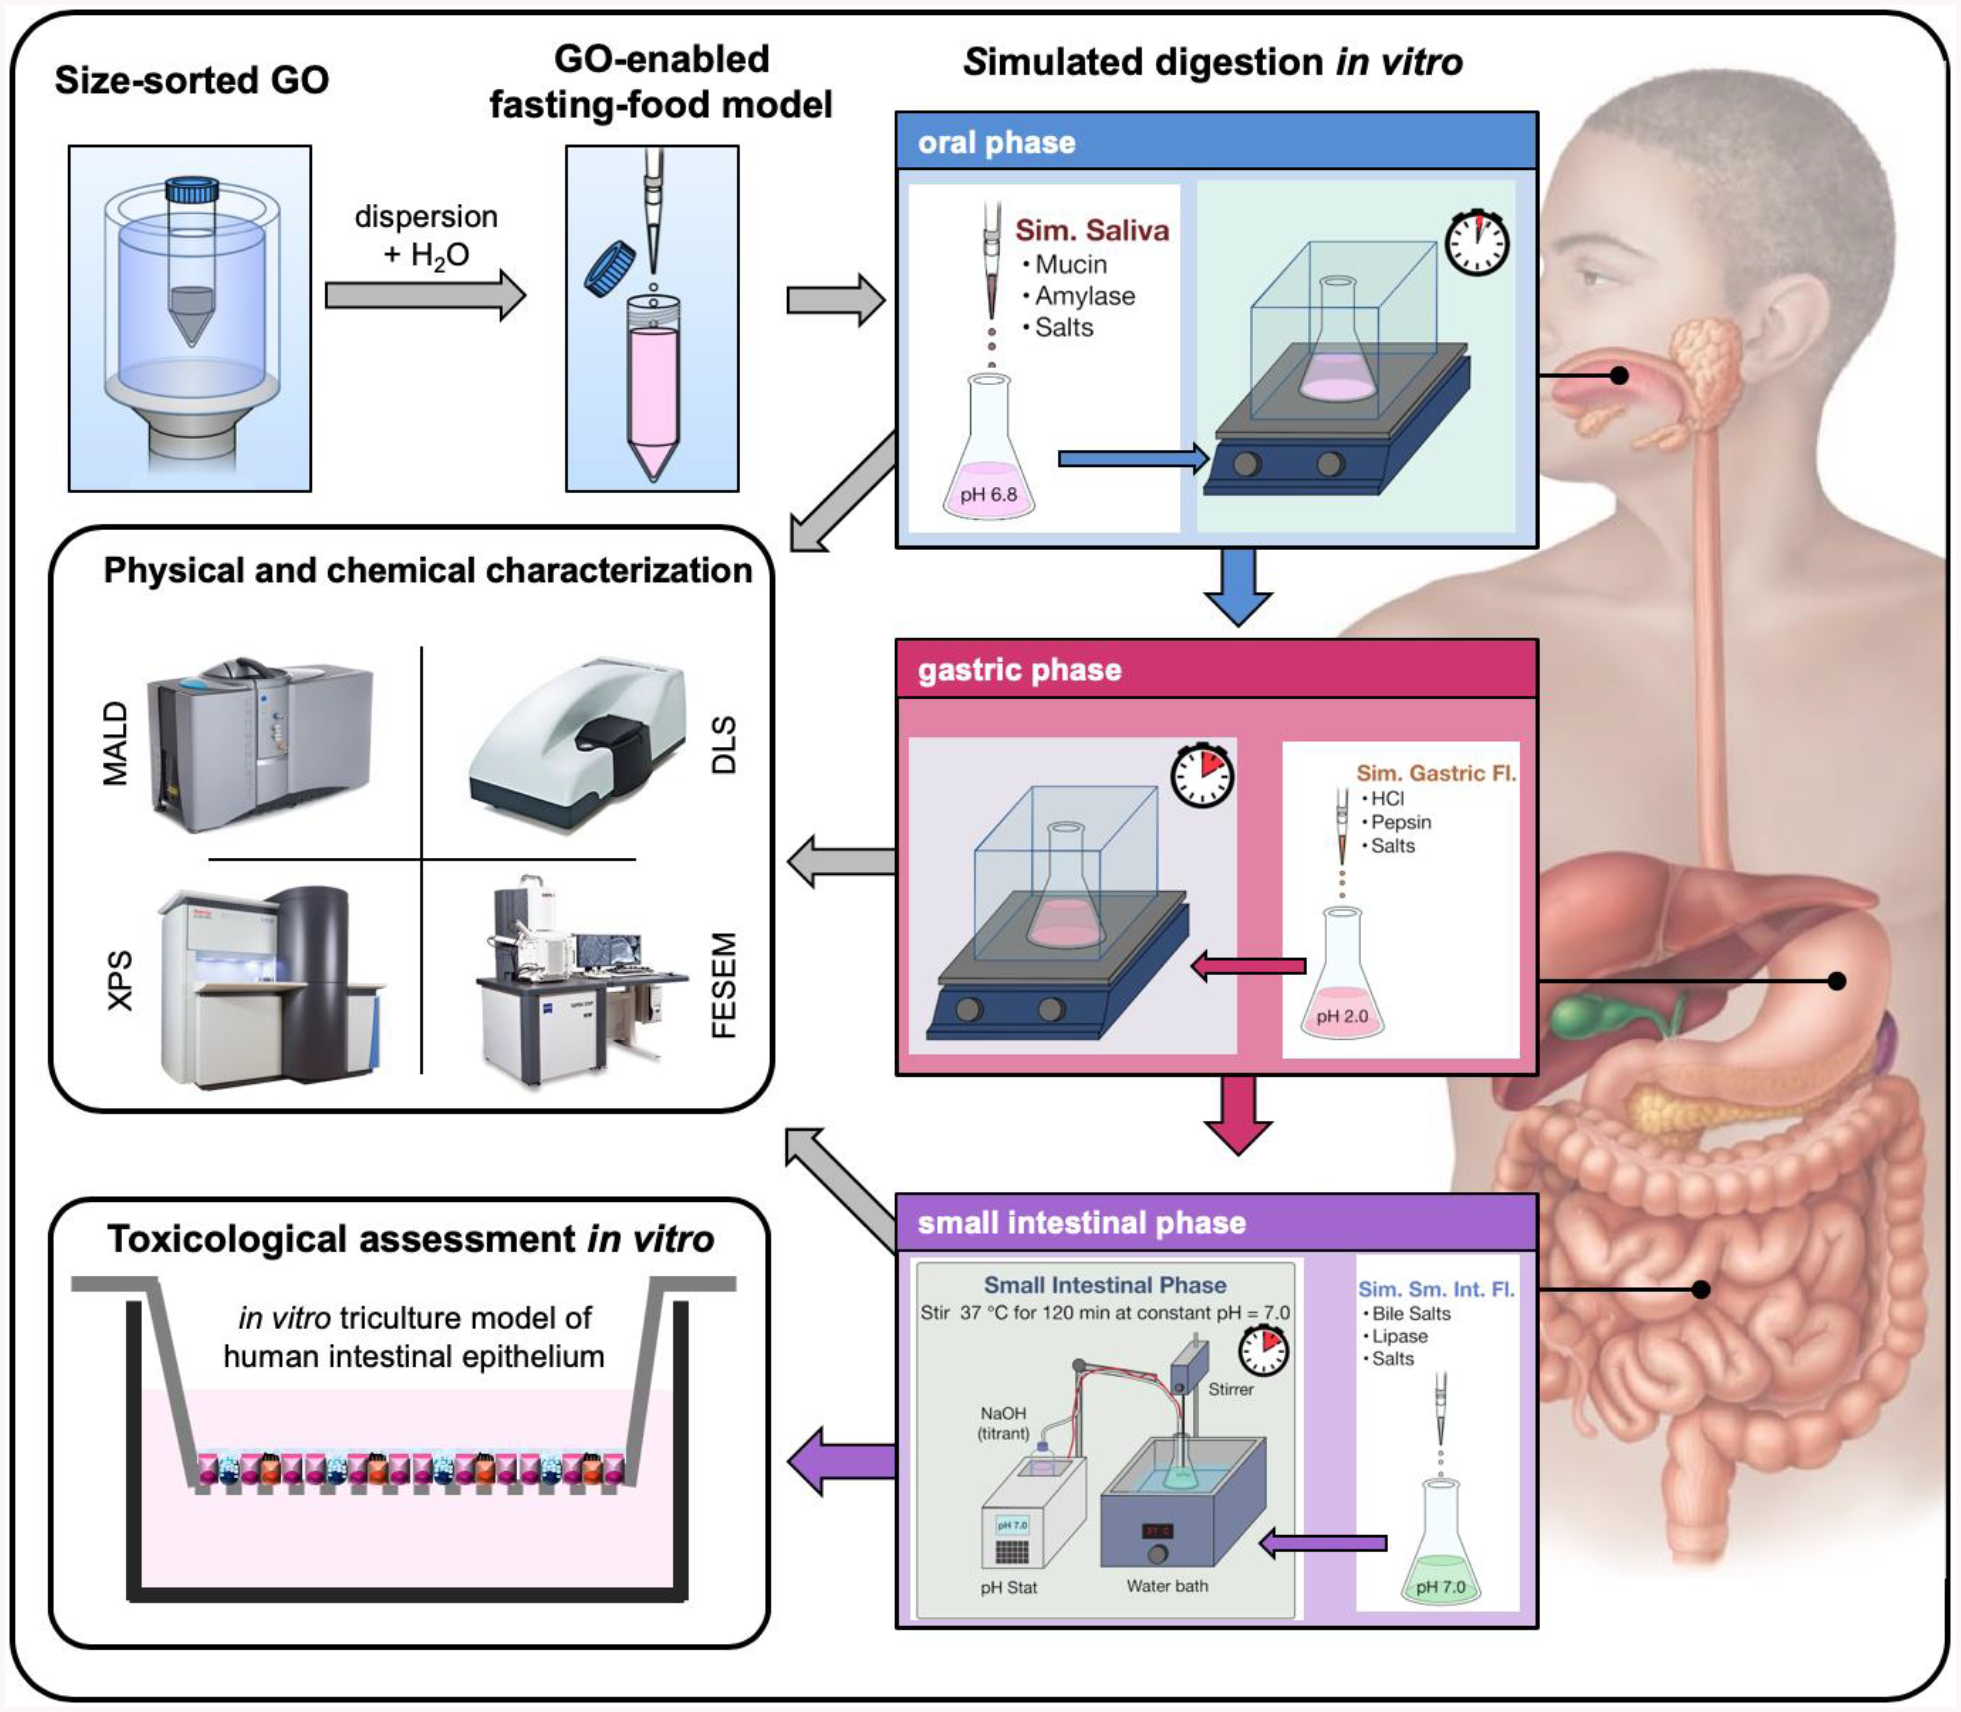
This study presents the preparation of GO-enabled fasting food models, their simulated digestion, physicochemical characterization, and in vitro toxicological assessment against a triculture model of the human small intestinal epithelium.
2. Results and Discussion
2.1. Synthesis, size-sorting, and physicochemical and biological properties of pristine GO
The preparation of colloidally stable and sterile GO of distinct lateral size is a multi-step process of synthesis, purification, and exfoliation. Endotoxin-free synthesis of GO was performed according to an improved Hummer’s method previously presented by the authors[37]. During synthesis, the size of GO flakes and their degree of oxidation depends on multiple factors, like the precursor graphite, ratio of intercalant acids and oxidizing agents, reaction temperature, and duration [38], as shown in Figure 2a. The purification step allowed to remove residual ions and acids as well as large and less oxidized debris. Then, the exfoliation step performed by ultrasonication in water, controlled the size distribution of the flakes depending on the total energy delivered, duration, and GO concentration. At the end of this process, the size distribution of GO is still wide and size heterogeneity confounds its morphology-dependent investigation in biological systems. In this study, post-processing was employed to independently control size to other parameters, like surface chemistry, and thus obtain two GO samples of relatively monodisperse and distinct lateral size. To this date, centrifugation techniques which rely on different sedimentation rate of GO flakes of variable lateral size and thickness are the most successful and scalable size separation methods. Using iterative centrifugation, it is feasible to separate GO flakes of higher mass (of either larger lateral size or thickness) by collecting the precipitate of each iteration and centrifuging the supernatant at an increased g-force in next iteration, as shown in Figure 2b.
Figure 2.
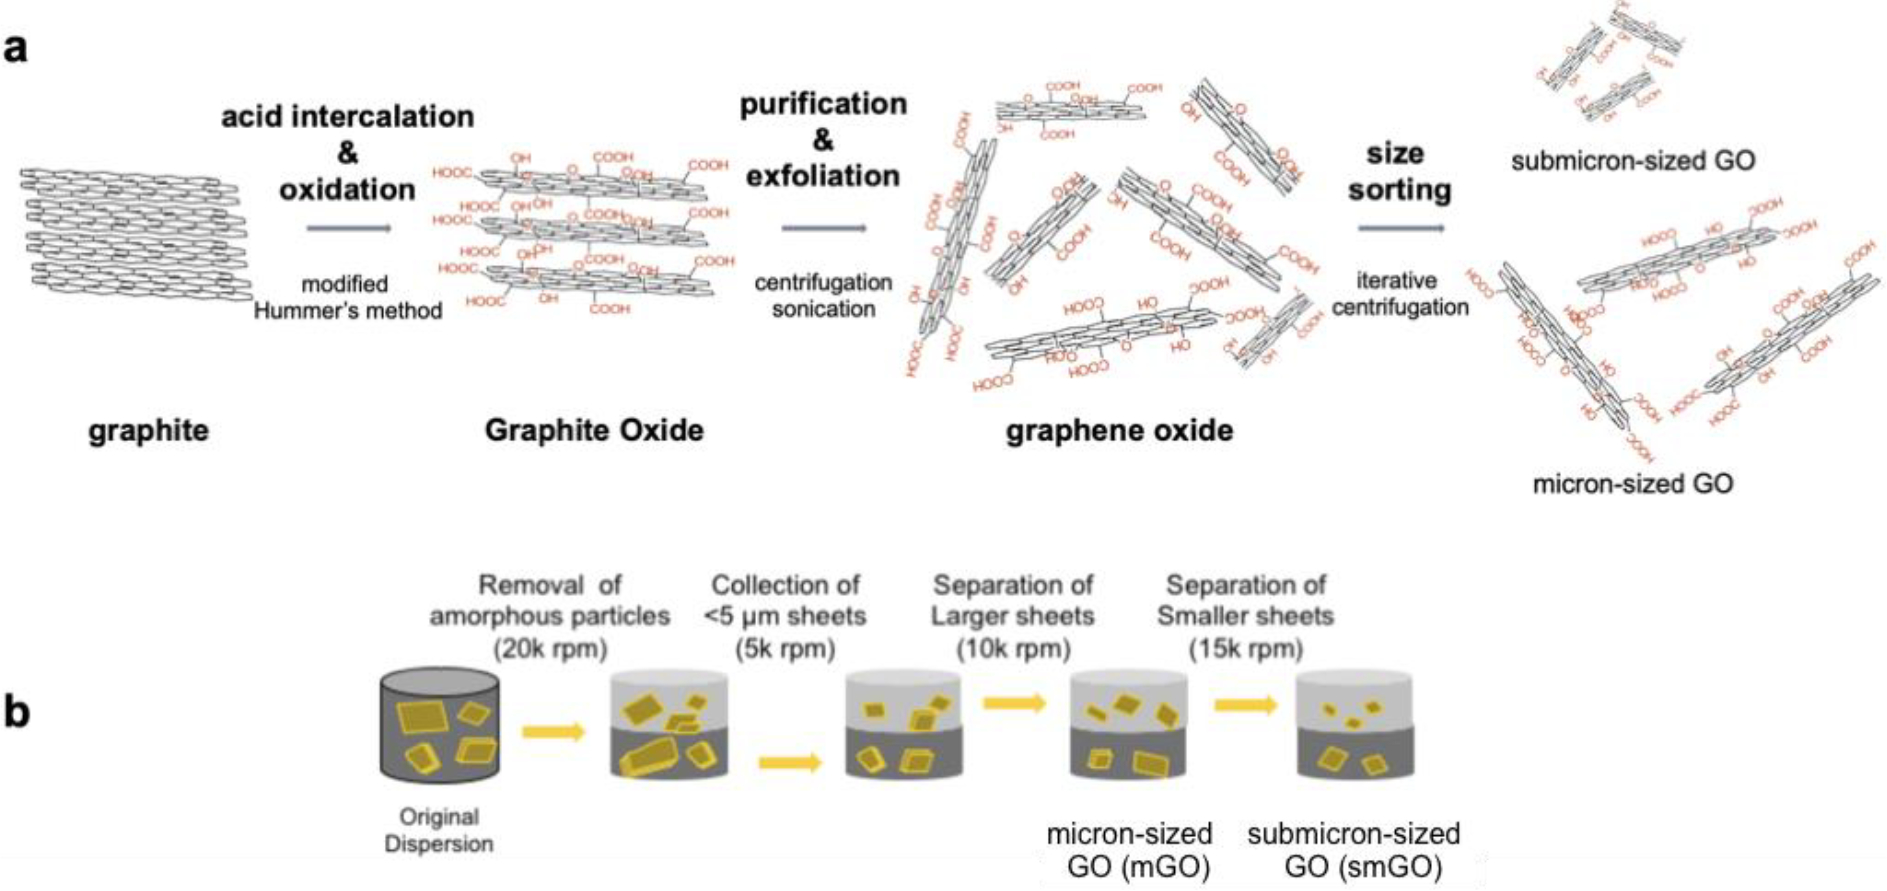
a.Overview of the preparation of monodisperse GO suspensions including synthesis via oxidation, purification, exfoliation, and size-sorting. b. Schematic of the iterative centrifugation applied for preparation of monodisperse GO suspensions.
The mean lateral sizes of the pristine submicron-sized (“smGO”) and micron-sized (“mGO”) as measured by field emission electron microscopy (FESEM) were 0.24 and 1.13 μm, respectively, and their size cumulative frequency distributions were found to be significantly different by the Kolmogorov-Smirnov test (p < 0.0001). Atomic force microscopy was employed to measure the thickness of the flakes which at 0.8–1.2 nm suggested that GO was mostly organized in single layers. As measured by XPS, the C/O ratios of smGO and mGO were also similar at 1.37, and 1.41, respectively. Raman spectra of both sizes presented a D peak at 1360 cm−1 and a G peak at 1590 cm−1. Moreover, the ID/IG ratios of smGO and mGO, indicative of the functionalized sp3-hybridized carbon atoms to sp2-hybridized carbon atoms ratio, were ~0.83 and ~0.84, respectively, suggesting similar defect density and surface chemistry[39]. Complete characterization data, including atomic force microscopy thickness and lateral size distributions, FESEM size distributions, XPS survey spectra, Raman spectra, trace metal purity, endotoxin and microbiological load assessment for smGO and mGO are presented in Supplementary tables S1 and S2, respectively.
2.2. Preparation and colloidal stability of GO-enabled fasting food models
Submicron-sized-(smGO) and micron-sized-(mGO) GO-enabled fasting food models at 50 and 250 μg mL−1 were prepared by respectively dispersing pristine smGO and mGO suspensions in HyClone™ cell culture grade water following the dispersion protocol presented in the experimental section. The fasting food model employed here uses water as the simplest possible matrix for the ingestion of GO in absence of nutrients, like fat, carbohydrates, or proteins. Moreover, in the absence of data on human exposure to GO, the chosen concentrations were based on the potential ingestion of GO upon the rupture of a GO-based membrane for water filtration. GO membranes generally operate in the nanofiltration regime with a filtration rate of 1–10 L m−2 h−1 for each applied bar[40]. Membrane thickness and surface area are typically in the range of ~0.5 – 1.0 μm and ~10 cm2 [41], respectively. Given a GO density of ~2 g cm−3 [42], this amounts to a total mass of 1–10 mg.
After preparation, the colloidal properties of GO-enabled fasting food models were measured by dynamic light scattering (DLS) and electrophoretic light scattering, summarized in Table S3. In brief, both smGO and mGO at 50 and 250 μg mL−1 presented negative z-potential values ranging from −47 to −52 mV. The strongly negative z-potential of GO has been attributed to ionizable carboxylic groups and other ionizable groups with variable pK[43], but its excellent dispersibility in aqueous media is mostly due to tertiary alcohol and epoxy groups on its planar surface[43,44]. Moreover, the polydispersity indices (pdi) of smGO and mGO were below ~0.4 which can be considered relatively low for ENMs produced with top-down approaches. Figure 3 presents the colloidal stability of as-prepared GO-enabled fasting food models. GO-enabled fasting food models presented stable diffusion coefficients, pdi, and light scattering intensities at both angles over at least 10 minutes, which is the preparation time for the simulated digestions. In more detail, the regression coefficients (slopes) of agglomeration indices (ai) and mean diffusion coefficients equaled to zero, indicating that particles did not agglomerate. The only exception as shown in Figure 3d was the pdi slope for mGO at 250 μg mL−1 at 0.1 which suggested slight agglomeration of GO flakes to bodies of variable size. These results overall agree with what is known for the colloidal stability of GO in peri-neutral water at low ionic strength[45]. In such environments, sufficiently oxidized graphene flakes experience strong electrostatic repulsion due to negative charges from -COO− and other electronegative oxygen-containing functionalities and van der Waals forces and π-π interactions cannot induce agglomeration[46].
Figure 3. Colloidal stability of GO-enabled fasting food models.
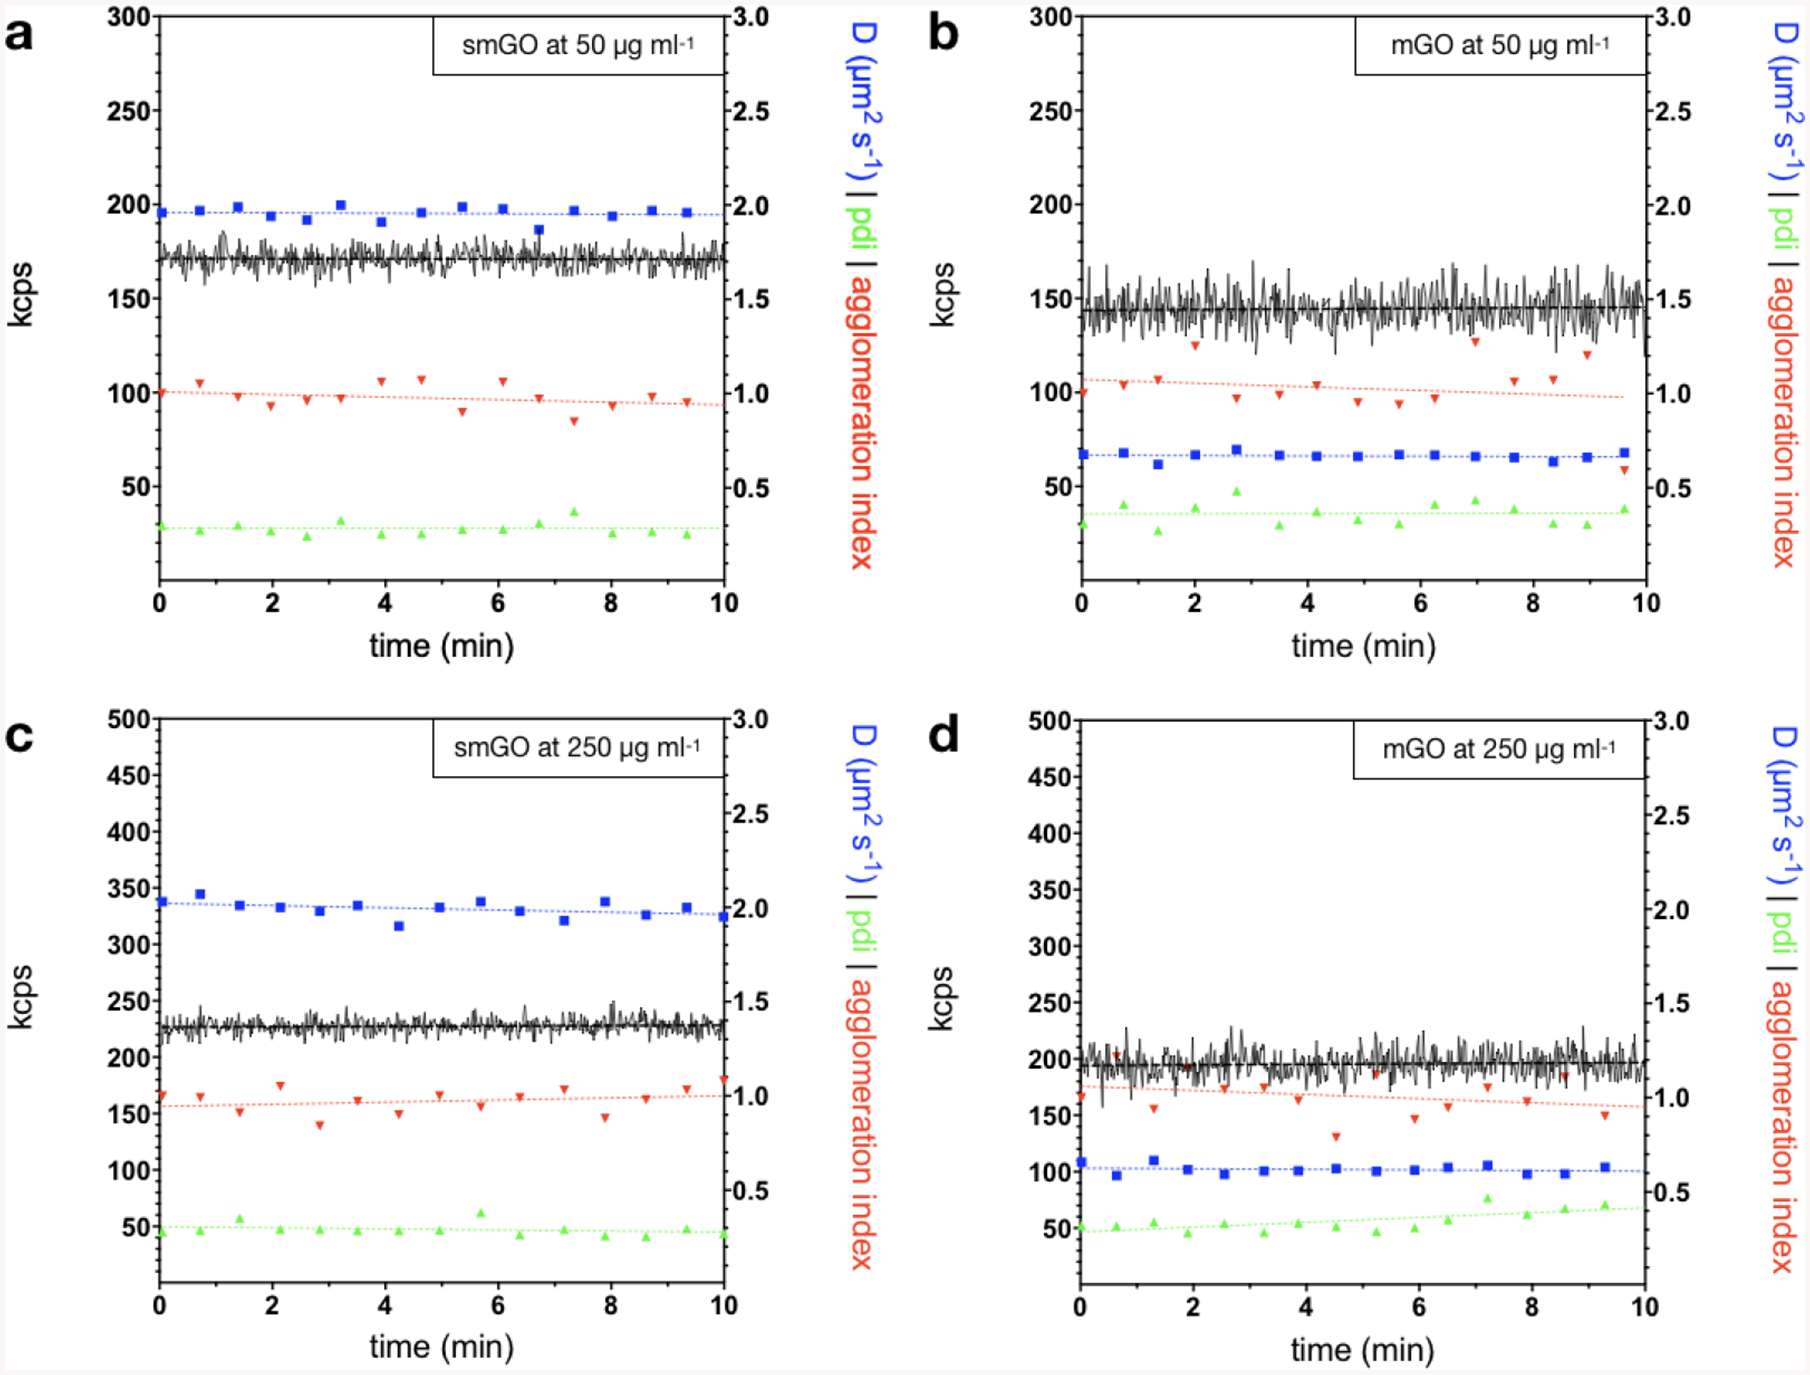
Time series over 10 min of mean diffusion coefficients (blue), polydispersity index (pdi, green), agglomeration index (ai, red), and kilo (photon) count per second (kcps, black) and their respective simple linear regressions in dashed lines for GO-enabled fasting food models. All metrics for a. smGO at 50 μg mL−1, b. mGO at 50 μg mL−1, and c. smGO at 250 μg mL−1remain unchanged over time. d. mGO at 250 μg mL−1 only exhibited a slight increase in pdi over time (slope = 0.1).
2.3. Agglomeration of GO flakes upon simulated gastrointestinal digestion
Figure 4 shows how smGO and mGO behave across the GIT. In more detail, Figure 4a shows that both GO samples present minimal agglomeration in the oral phase. In the gastric phase, as shown in Figure 4b, smGO and mGO organize in structures larger than those present in the blank, due to the acidic pH (2) at which protonation of GO flakes cancels their electrostatic stabilization[45], further promoted by the Debye screening of the flakes’ surface charge in the presence of salts. In the small intestinal phase, as shown in Figure 4c, smGO and mGO agglomerate even further, probably due to the presence of bile salts and additional digestive enzymes. These are expected to adsorb on the surface of GO and further accentuate its agglomeration by bridging and stabilizing clusters of multiple flakes[47]. Overall, the results of this study are in agreement to what has been previously reported on the agglomeration of GO in the GIT by Guarnieri et al.[26] who suggested that GO agglomerates during simulated digestion based on changes in the D band of digested GO.
Figure 4. Volume-weighted size distributions and percentiles of cumulative particle volume for GO-enabled fasting food models and blank FFM.
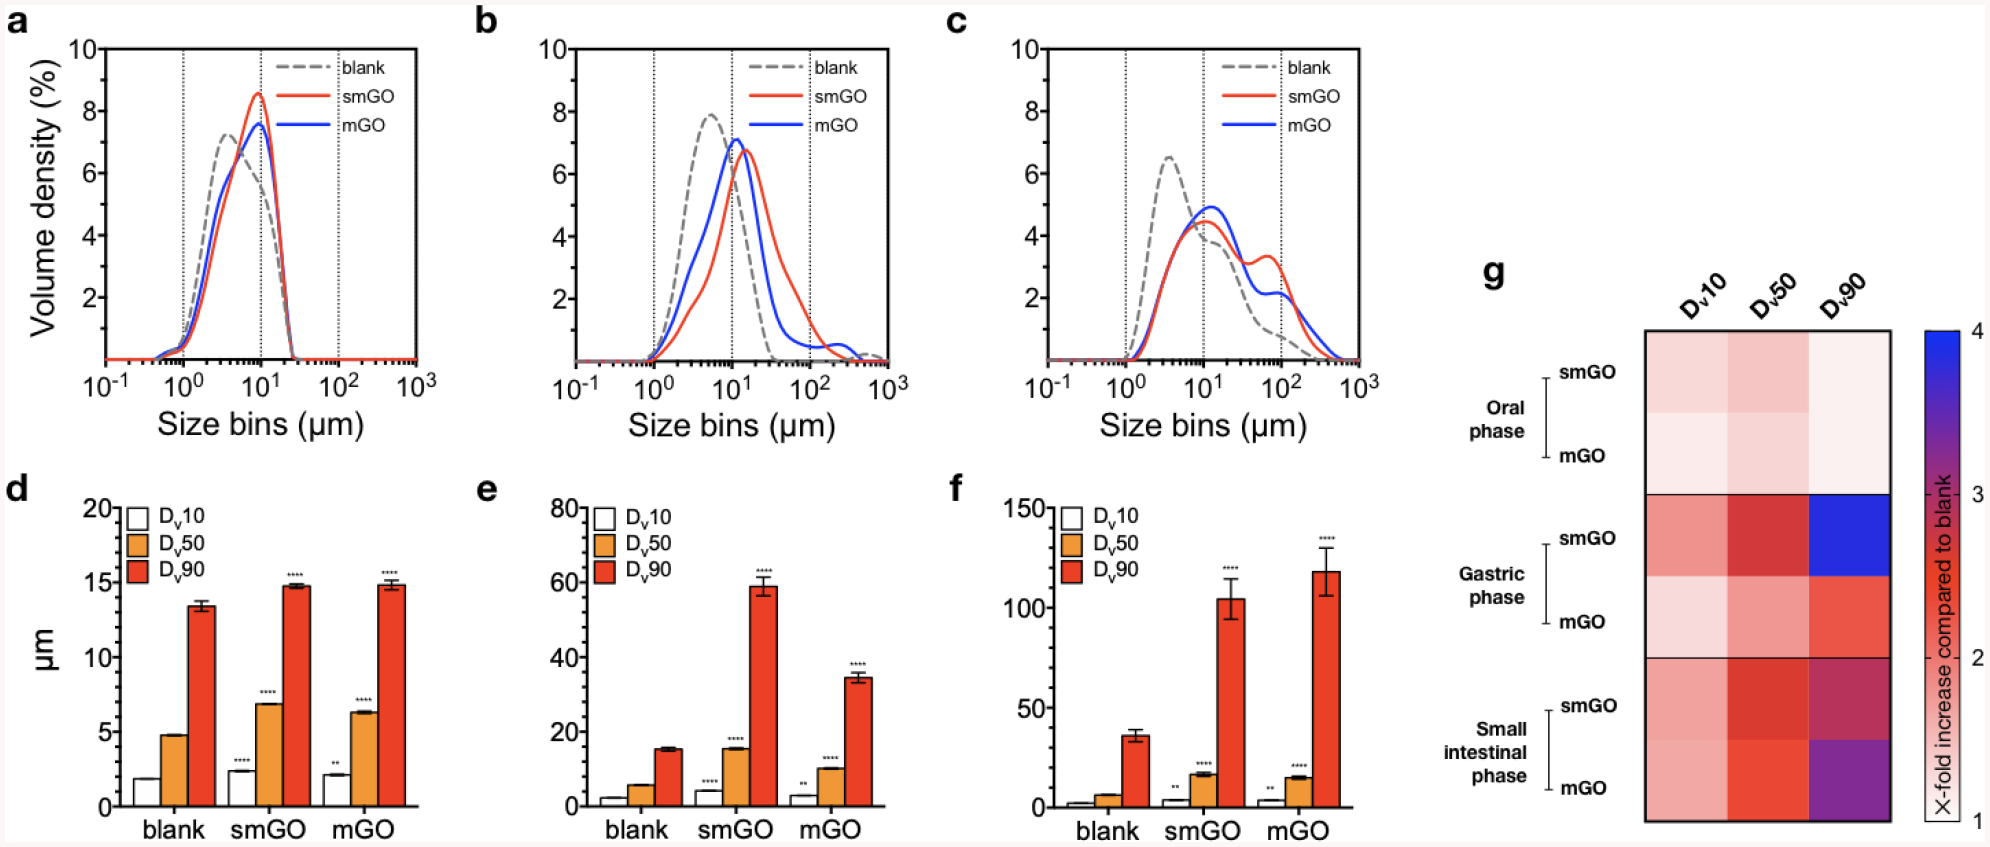
The evolution of volume-weighted particle diameters across a. oral, b. gastric, and c. small intestinal phases for GO-enabled fasting food models and blank FFM suggests extended agglomeration for smGO and mGO. d. In the oral phase, both samples share similar Dv10, Dv50, and Dv90 which are siginificantly elevated compared to blank FFM. e. In the gastric and f. small intestinal phase, Dv90 for smGO and mGO exhibit strong aglgomeration. g. Heatmap for the visuallization of X-fold increase in Dv10, Dv50, and Dv90 of smGO and mGO over the respective values for blank FFM. Measuements were peformed on GO-enabled fasting food models at 250 μg mL−1; statistical analyses were peformed with Tukey’s test for multiple comparisons; ** p < 0.01; *** p < 0.001; **** p < 0.0001.
It has to be noted that the size distributions obtained by MALD can be trustworthy when the illuminated particles are spherical, rigid, non-transparent, and share the same refractive index. The anisotropic geometry of GO flakes and the presence of particles with variable refractive indices (e.g., biomolecules) in GO digesta do not conform to the ideal conditions required for MALD. Nevertheless, this technique can still be utilized to qualitatively assess the agglomeration of particulates in complex dispersions (i.e., by setting the same refractive index for all samples, it is possible to compare shifts in size distributions and thus evaluate the agglomeration of GO in real time with minimal sample preparation).
Shifts in size distribution of smGO and mGO were further compared to blank FFM (digesta without the presence of GO), based on the Dv10, Dv50, and Dv90 values which represent particles diameters below of which lie 10%, 50%, and 90% of a sample’s cumulative particle volume, respectively. Figure 4d shows that the percentiles of smGO and mGO in the oral phase are not significantly different than those for blank FFM; in Figure 4e it can be seen that the acidic conditions of the gastric phase inflate the Dv90 values of smGO and mGO at levels 3–4 higher than that for blank FFM. In the small intestinal phase described in Figure 4f, even though the pH of the digestive tract is neutral, smGO and mGO undergo further agglomeration that could be attributed to ion bridging between planar functional groups. The heatmap in Figure 4g summarizes the changes in size percentiles of smGO and mGO relative to blank FFM across the GIT.
In order to verify MALD measurements and observe microscale features of GO flakes, smGO and mGO small intestinal digesta were imaged under field-emission scanning electron microscopy (FESEM), as presented in Figure 5, along with images of the as-prepared GO-enabled fasting food models. The applied protocol allowed us to visualize the flakes’ morphology at the microscale and verify their agglomeration in small intestinal digesta by avoiding washing steps and other mechanical interventions that could bias the observed properties. In Figures 5a–b, flakes of the GO-enabled fasting food model appear flat and well-defined. In contrast, in Figures 5c–d, the small intestinal digesta of smGO and mGO appear agglomerated and thus larger in size, in agreement to MALD measurements and similar to the effects of simple acid treatment on GO observed by others[24]. Higher magnification images in Figures 5e–f reveal wrinkling and / or stacking of GO flakes which appear darker due to decreased conductivity and increased work function. Finally, the physisorption of carbonaceous material and ions might also contribute to the altered morphology of the flakes as they have been shown to enable the bridging of GO flakes and promote multiple stacking[48]. Overall, FESEM images support the results from MALD regarding GO agglomeration and provide positive evidence for its morphological alterations during simulated digestion.
Figure 5. FESEM imaging of smGOGO and mGO.

Electron microscopy images of GO-enabled fasting food models at 5 μg mL−1 for a. smGO and b. mGO exhibit typical features for GO flakes, like angular shapes and flat morphology. Low magnification images of small intestinal digesta of GO-enabled fasting food model at 250 μg mL−1 for c. smGO and d. mGO with their respective higher magnification images in e-f show agglomeration, multiple stacking, and physisorption of amorphous material.
2.4. Chemical transformations of GO across the simulated gastrointestinal tract
Figure 6 presents XPS surface chemistry analyses on the small intestinal digesta of GO-enabled fasting food models and pristine GO samples. The C1s spectra of pristine GO in Figure 6a–b present five main peaks around 284.8, 286.5, 288.1, and 289.1 eV which correspond to sp2-hybridized C−C, C−O (epoxide and hydroxyl), C=O (carbonyl), and O−C=O (carboxyl) bonds, respectively. Small intestinal digesta of smGO and mGO, as shown in Figure 6c and 6d, respectively, present with overall increase in nitrogen content, along with a C-N peak at 285.8 eV in C1s spectra, indicating nitrogen incorporation into the GO structure. C-N peak increases for both smGO and mGO, accompanied by considerable increase in the C-C peak and restoration of sp2-hybridized C−C bonds. This observation indicates nitrogen substitution on smGO and mGO through multiple routes, including nucleophilic epoxide ring opening, amine participation in hydrogen bonds with hydroxyl groups, and / or deprotonation of carboxyl groups. These reactions primarily substitute the oxygen on the surface with nitrogen-containing functional groups, hence increase the C-N peak. Later, upon further reactions with other reactants (simple protons or long-chained molecules), these nitrogen-containing groups leave the GO surface to facilitate C-C bond formation and reduce it by restoring its sp2-hybridized structure. Many GO reduction reaction pathways initiated by nitrogen-containing compounds have been reported in the literature[49]. Biomolecules such as hormones, proteins, amino acids, serum albumin, and even microorganisms are among these nitrogen-containing compounds that have been reported as reducing agents for GO[50–53]. Since proteins are present during the mouth, gastric, and small intestinal phase, it is plausible that they participate in reductive reactions on the GO surface.
Figure 6. Surface chemistry of GO-enabled fasting food models and GO small intestinal digesta.
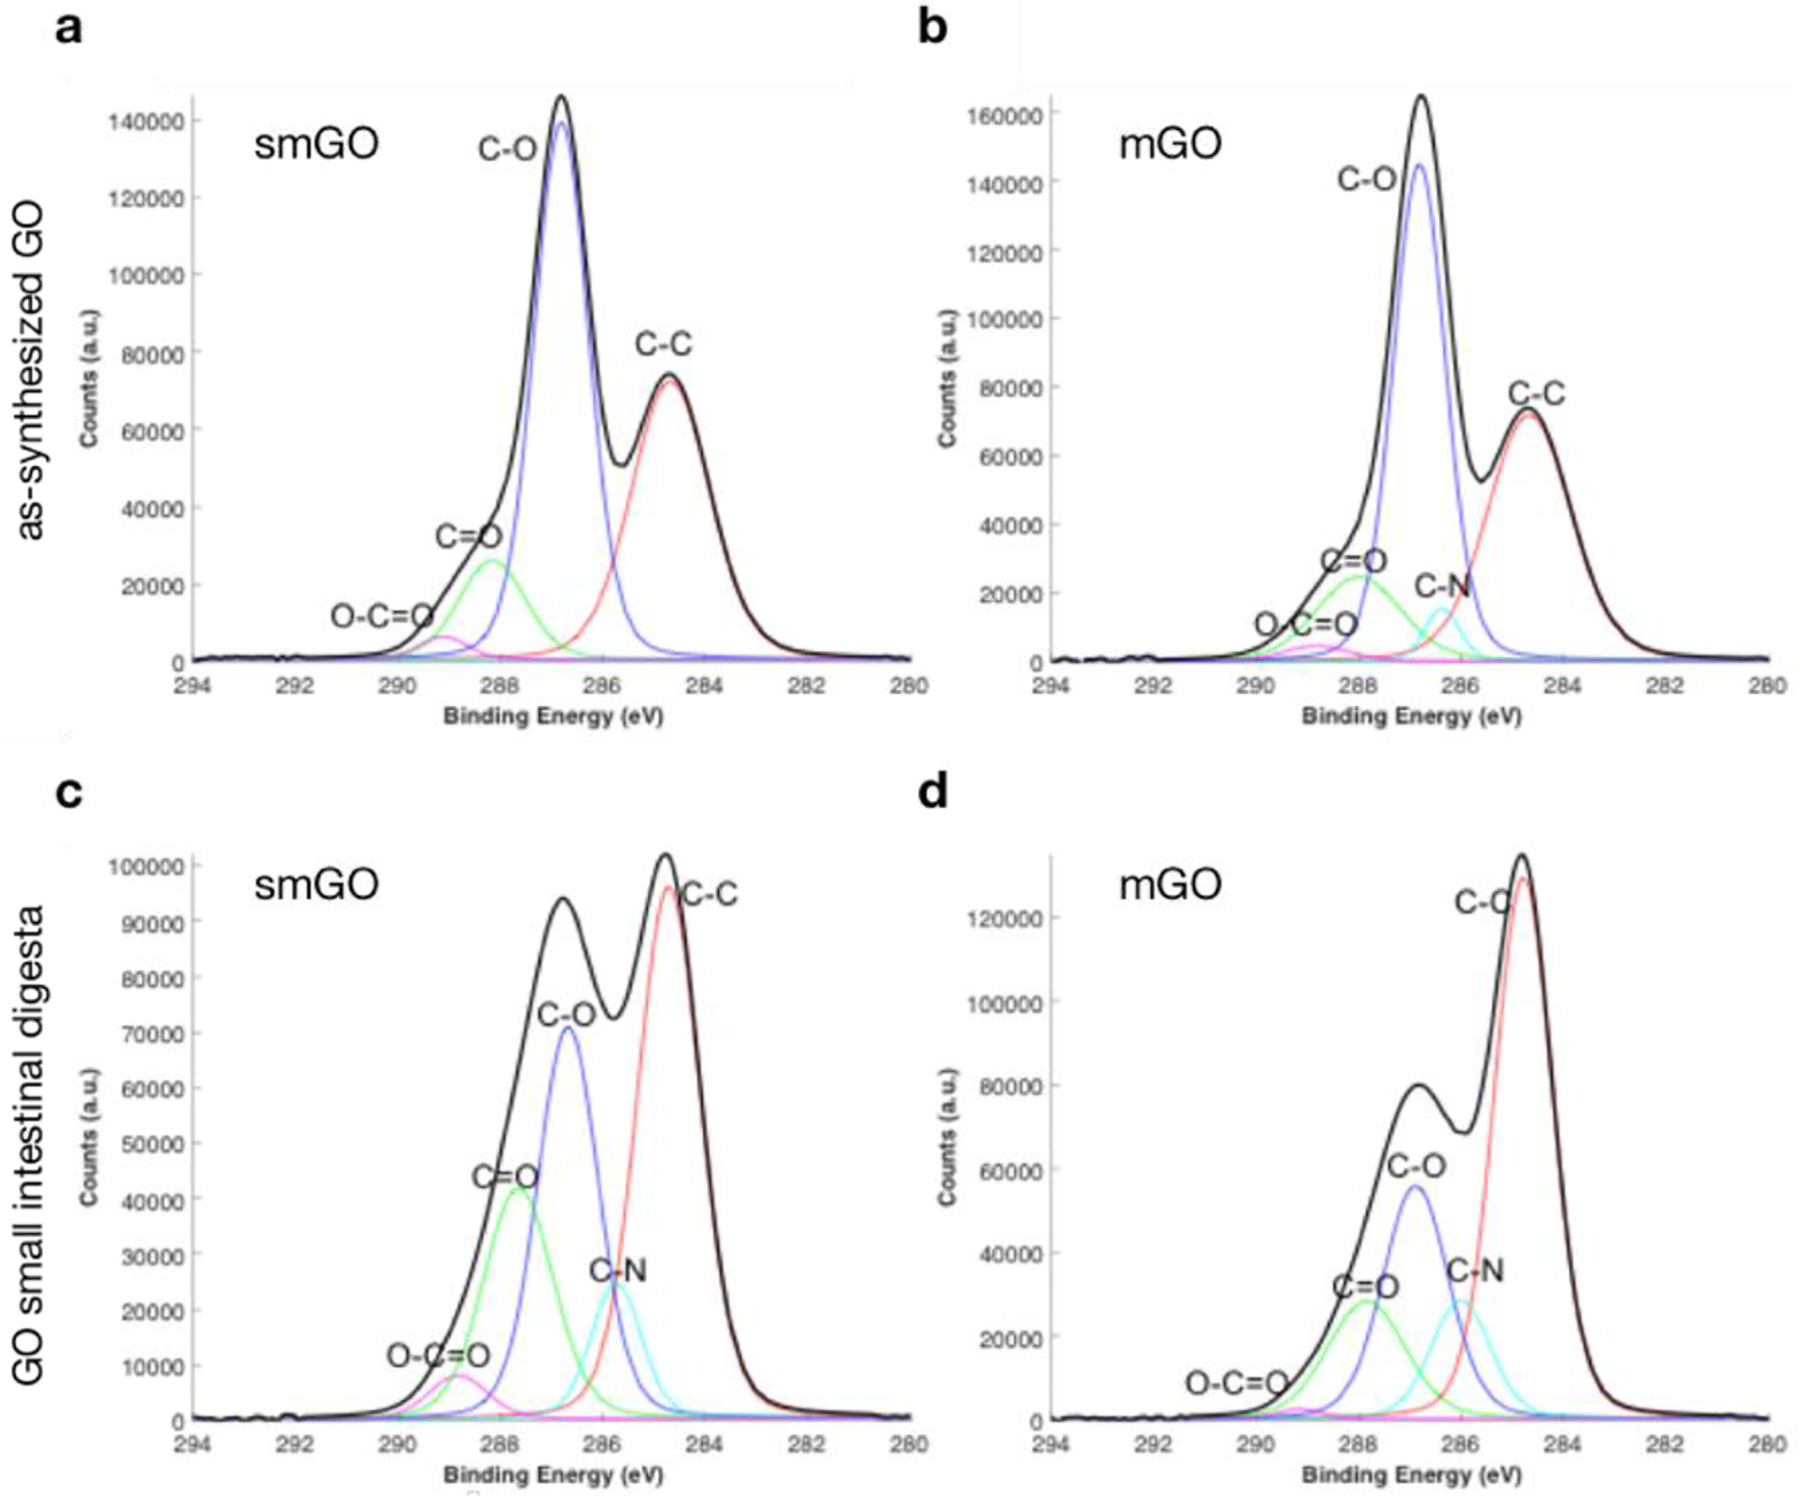
C1s XPS spectra of as-prepared a. smGO and b. mGO fasting food models. C1s XPS spectra of small intestinal digesta for c. smGO and d. mGO.
These results highlight the propensity of GO to oxidize the intestinal proteome and chemically sequester enzymes. Consequently, further investigation of the GO reduction mechanism, biochemical identification of nitrogen-containing species on its surface, and interrogation of its interactions with easily oxidizable nutrients (e.g., vitamin C) are warranted through single compound reaction screening and proteomic analysis of its biomolecular corona.
2.5. In vitro toxicological assessment of small intestinal GO digestas against a tri-culture model of the human intestinal epithelium
In this study, we utilized an advanced, tri-culture, small intestinal epithelial model to assess the acute pathogenicity of two distinct sizes of GO small intestinal digesta. Figure 7 presents the results from the toxicological assessment of smGO and mGO. It is important to note that due to physiological dilutions in the GIT fluids and cell culture medium, the starting concentrations of GO-enabled fasting food models at 50 and 250 μg mL−1 correspond to administered concentrations to cells of ~1 and ~5 μg mL−1, respectively. Figure 7a shows that the transepithelial electrical resistance (TEER) values of intestinal epithelia treated with small intestinal digesta of blank FFM, smGO, or mGO were similar. These results suggest good cell layer integrity and intracellular tight junctions, which ensure the uncompromised function of the intestinal barrier. Furthermore, extracellular release of the cytoplasmic enzyme lactate dehydrogenase (LDH) due to ruptured cell membranes and apoptosis is a typical measurand of acute cytotoxicity. As shown in Figure 7b, small intestinal digesta of smGO or mGO did not induce cytotoxicity under the experimental conditions of this study. Similarly, no differences were observed in overall cell viability or mitochondrial enzymatic activity as shown in Figure 7c upon exposure to small intestinal digesta of GO-enabled fasting food models. Figure 7d presents the assessment of reactive oxygen species (ROS) generation measured after 6 hours of exposure to small intestinal digesta of smGO or mGO. Persistent ROS generation has been mechanistically linked to chronic inflammation and tissue injury and is one of the most studied mechanisms of ENMs toxicity[54,55]. Here, at 1 μg mL−1 of administered GO concentration, there was no effect on ROS production. On the contrary, both smGO and mGO at 5 μg mL−1 of administered concentration caused a statistically significant 1.2-fold increase in ROS production over the blank FFM, respectively (p < 0.05). Still, this increase is low compared to the positive control (menadione, 100 μM), which induced a 2.4-fold increase (p < 0.001) over the blank FFM.
Figure 7. In vitro toxicological assessment of a triculture human intestinal epithelium model exposed to small intestinal phase digesta of smGO and mGO.
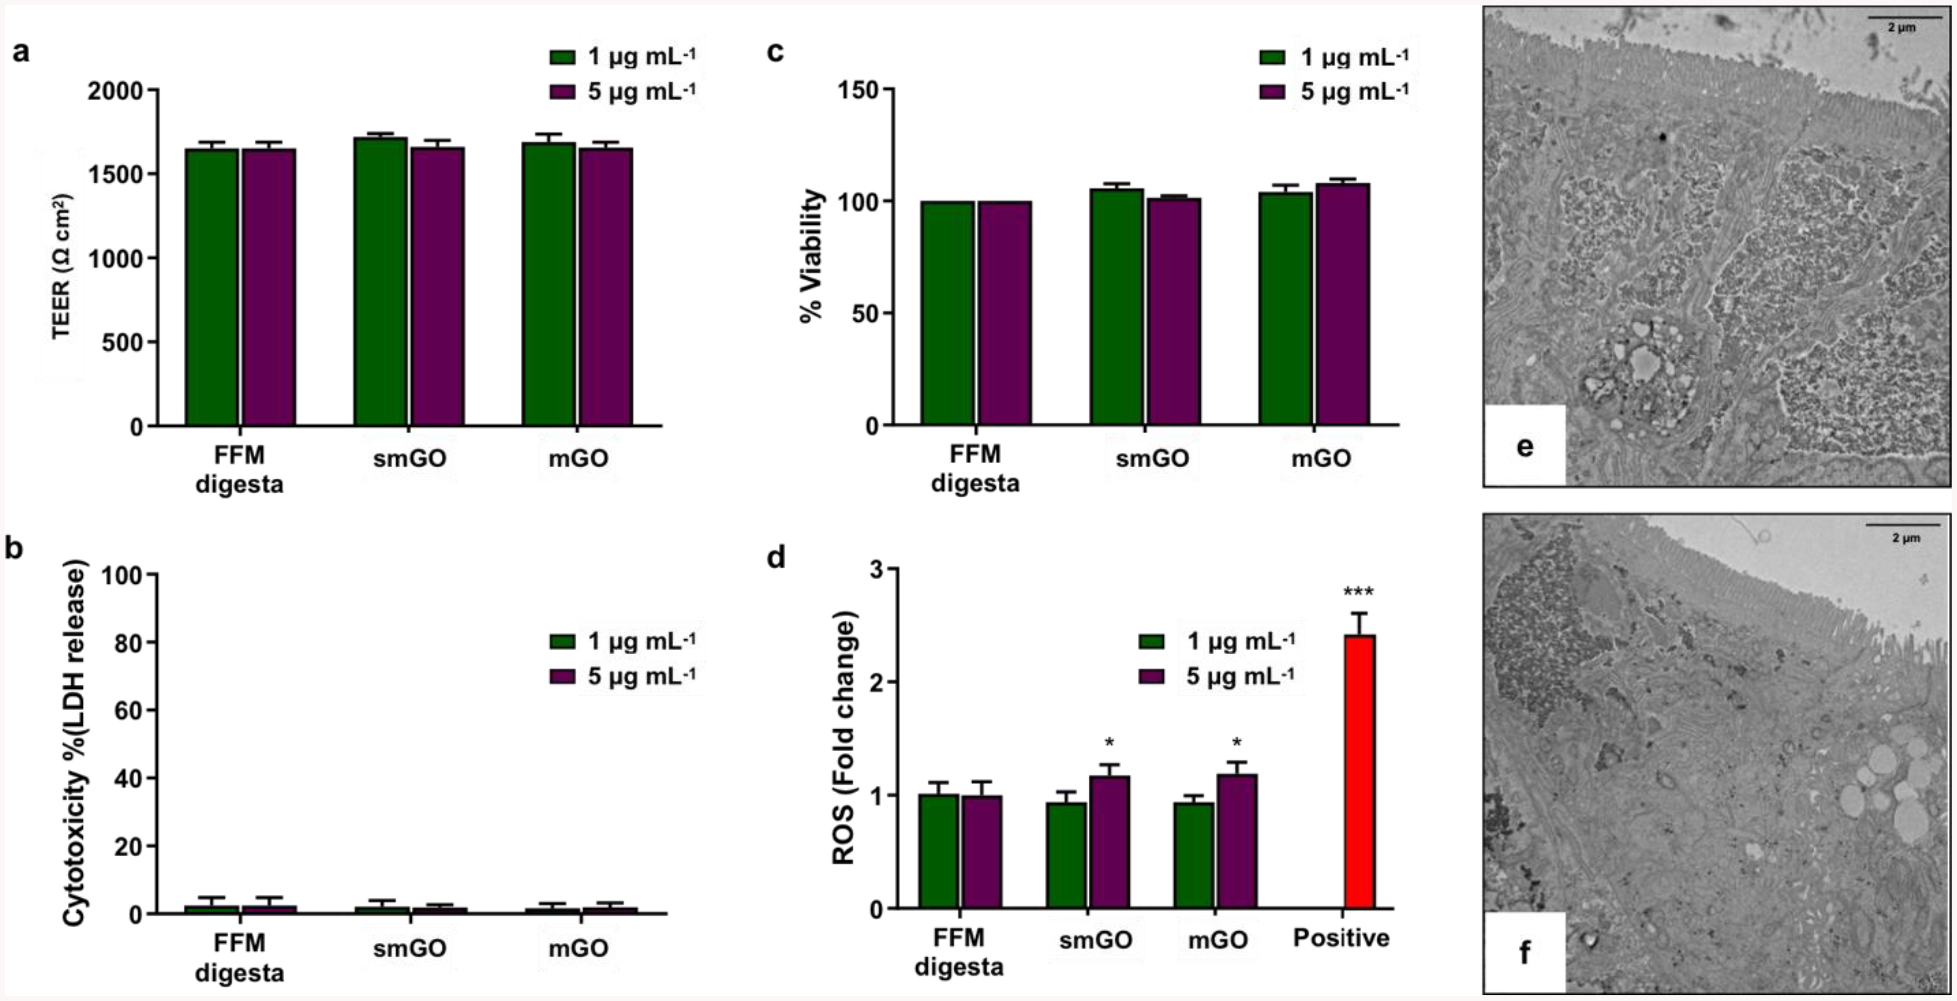
a. Trans-epithelial electrical resistance (TEER) measurements in Ω cm2 (24 h), b. cytotoxicity assessment by lactate dehydrogenase (LDH) release assay as % of lysed control (24 h), c. cell viability / mitochondrial enzymatic activity (PrestoBlue® assay) as % change compared to blank fasting food model (24h), d. reactive oxygen species (ROS) generation as X-fold change compared to blank fasting food model (6h). e. Representative transmission electron microscopy (TEM) images of cryo-sectioned small intestinal epithelium after 24-h exposure with blank fasting food model or f. mGO at starting concentration of 250 μg mL−1. All experiments were performed in triplicates; error bars represent mean ± standard deviation. * p < 0.05; *** p < 0.001.
The toxicity results here do not contradict the available literature on the biological effects of ingested GO. Guarnieri et. al. conducted the simulated digestion of GO flakes with lateral size ~400 nm at comparable concentrations and applied the digested GO on a Caco-2 cell monolayer without observing considerably different biological responses[26]. Another study mimicked the stomach transition of GO by acid treatment (without digestive enzymes) and, again, no differences in cell viability were observed against Caco-2 cells at concentrations ranging from 5 to 80 μg mL−1[24]. However, variable ROS production was observed for GO of different sizes and starting materials. Finally, other studies skipped any semblance of simulated digestion and exposed Caco-2 cells to GO dispersed in culture medium alone, again without observing any acute toxicity[22,56].
The current toxicological evaluation of GO provides safety information for its application in water purification and remediation industries as well as useful insight for its use in the food industry, especially when put in context with commonly used ENMs, like TiO2 and SiO2. The in vitro toxicity of TiO2 and SiO2 has been previously evaluated by the authors using the same GIT simulator and tri-culture intestinal epithelium model[57]. At FDA allowable concentrations (~210 μg mL−1 when administered to cells), SiO2 did not induce any significant toxicological response, while TiO2 only induced a significant ROS production (1.20-fold increase compared to untreated control, p<0.05). Similar levels of biological activity between FDA-approved ENMs and GO suggest that at the tested experimental conditions GO may be lack acute in vitro pathogenicity.
Representative TEM images presented in Figures 7e and 7f further show that GO did not induce any obvious histological alterations to the small intestinal epithelium. Specifically, the cellular tri-culture in vitro model employed here consisted of enterocytes, goblet cells, and M cells with clear polarization, tight junctions (TJs), and dense apical brush border (BB) with microvilli (MV) at typical length and width of ~1 μm and ~0.1 μm, respectively[58]. Absence of BB disruption, maintained TJs, and no change in the MV number or length 24 hours post-treatment of the epithelium with small intestinal digestas of GO-enabled fasting food models suggest that the barrier integrity was not compromised. Of note, no uptake of GO could be observed, which is in agreement with a recent report which demonstrated how the BB of differentiated Caco-2 cells prevents adhesion and uptake of GO flakes by epithelial cells[25].
While this tri-culture model provides a physiologically relevant, in vitro representation of the human small intestinal epithelium and is therefore suitable for basic, acute toxicological assessments, real world exposure to GO through ingestion might happen over longer time-points and could involve alterations at the molecular level which are difficult to pinpoint within the context of a single in vitro study. Furthermore, this study addresses the knowledge gap of the biological activity of GO ingested with water, but it is important to note that GO ingestion may also take place in the presence of more complex food models. It has already been shown that certain ENMs have the capacity to alter the bioavailability of nutrients[59] while others may increase the bioavailability of noxious agents, like pesticides[57]. In addition, food matrix effects have been shown to modulate the bioactivity of ENMs[32,35], and the gut microbiome and proteome of animals is known to be sensitive to the presence of chemically active particulates[28,29,60]. Therefore, we plan to apply the methods developed here to interrogate the physicochemical transformations, toxicological assessment, and effect on gut microbiome and proteome of GO in the presence of more complex food models.
3. Conclusions
In this study, the size-sorted synthesis of endotoxin-free GO was presented. Additionally, its physicochemical transformations across the GIT and toxicological assessment against a physiologically relevant cellular in vitro model of the human intestinal epithelium was evaluated. During simulated gastrointestinal digestion, GO was shown to progressively agglomerate in the gastric and small intestinal phases. Importantly, both submicron- and micron-sized GO flakes exhibited a strong tendency to agglomerate. The observed morphological changes can be attributed to the acidic pH of the gastric phase which is known to promote GO agglomeration. Moreover, the abundance of proteins and cations across the GIT may also stabilize GO agglomerates or enable associations with different regions of the same flake, thus leading to folding and wrinkling. Our results further showed that GO is chemically reduced during simulated digestion and reacts with digestive enzymes, resulting in covalently bound N-containing groups on its surface. Toxicological assessment of the GO small intestinal digesta over 24 hours did not show any acute cytotoxicity. Importantly, both GO sizes elicited a ~20% statistically significant increase in ROS generation after 6 hours which raises some concerns regarding its effects on tissues that are less tolerant to inflammagens, like in the case of inflammatory bowel diseases.
Under the light of this data, it is important to perform additional studies that take into consideration possible food matrix effects on the physicochemical transformations and biological profile of GO. Beyond its toxicological investigation, it is also important to examine the interactions of GO with the intestinal proteome and microbiota which may incur undesirable changes in the homeostasis of the intestinal tract, interfere with digestive processes, and modulate the bioavailability of macro- and micro-nutrients.
4. Experimental Section
Synthesis and size-sorting of pristine graphene oxide:
Synthesis of endotoxin-free graphene oxide was performed by the oxidation of graphite under acidic conditions according to an improved Hummer’s method developed by the authors and previously described elsewhere[37]. After the purification step, endotoxin-free water was added to graphite oxide in a 200-mL beaker to obtain a 1 mg mL−1 solution. This sample was ultrasonicated using a probe sonicator (Q-sonica 700) at 20% amplitude for 30 min. Both dispersions were transferred to sterile centrifugation tubes and were centrifuged at 4000 rpm (3220 g) for 30 min to remove large flakes and graphitic aggregates. The supernatant of this dispersion was centrifuged at 20000 rpm for 30 min. The precipitate was collected and re-dispersed in endotoxin-free water at the original dispersion volume. This sample was then centrifuged again at 5000 rpm for 30 min and the resulting supernatant was collected and centrifuged again at 10000 rpm for 30 min. The precipitate was re-dispersed in endotoxin-free water at 1 mg mL−1 and used as mGO in further experiments. The supernatant was further centrifuged at 15000 rpm for 30 min and the resulting precipitate was used as smGO for further experiments. Microbiological sterility and absence of endotoxins were experimentally verified as described in the supplementary information.
Size measurement of graphene oxide using field emission scanning electron microcopy:
Silicon wafers (0.5 × 5 × 7 mm) were sputter coated with 10 nm of Pt/Pd in an EMS 150T S metal sputter coater and 5-μL drops of smGO or mGO at 0.5 μg mL−1 were deposited on their surface and left to dry protected from dust. The wafers were then secured on aluminum stubs with thin strips of conductive tape and were imaged using a Supra 55VPTM (Carl Zeiss AG) at a working distance of 3–4 mm using the in-lens detector operating at 1 kV. For size measurements, flat GO flakes were identified, their surface was calculated using ImageJ, and distributions of the square root of as-measured surface area were plotted on GraphPad© Prism.
Size measurement of graphene oxide using atomic force microscopy:
A drop of smGO or mGO suspensions at 0.01 mg mL−1 was placed on an AFM-grade mica substrate. After 30 min, the sample was washed by deionized water for 5 second and dried using N2 gas twice to assure the removal of aggregated particles and impurities. AFM images were obtained using a Research Asylum AFM in tapping mode using 9 nm thick silicon tip. Images were taken at various spots on the sample at 0.7 Hz scanning rate. Features with heights larger than 5 nm appeared to be GO aggregates and were not used in the image analysis. Obtained mages were processed individually and manually using the Gwyddion software to evaluate the thickness of the flakes.
Raman Spectroscopy of graphene oxide:
Dispersions of smGO and mGO at 0.5 mg mL−1 concentration were used to prepare the Raman sample. Twenty (20) mL of each GO suspension was vacuum filtered over a PTFE membrane (0.2-micron pore size). The samples were then dried in an oven at 80°C for 10 hours and were then mounted on a glass slide using double sided tape to achieve a flat surface during the measurement. A Horiba Jobin-Yvon LabRam Raman microscope was used for the measurements with a laser source of 532 nm. The samples were scanned over a range of 1000–3000 cm−1 Raman shift using 10 seconds acquisition times for 5 times on each point and 1800 gr/mm gratings were used during these measurements.
Dispersion preparation of graphene oxide-enabled fasting food models:
Under sterile conditions, 1 mL of each of the as-synthesized suspensions of pristine smGO and mGO were transferred in sterile, non-pyrogenic, 14-mL, polypropylene, round-bottom tubes. The tubes were then sonicated in a 3-inch cup-horn sonicator (Branson Ultrasonics Corp) that delivered 1.23 J s−1, as determined by a calorimetric calibration protocol described elsewhere[61]. Each aliquot was sonicated for 60 s so that the total energy delivered to each suspension was ~75 J. The sonicated, suspensions of pristine smGO and mGO were then added to appropriate volumes of endotoxin-free HyClone™ cell culture grade water at pH 7 and mixed by tube inversion at final GO concentration of 50 μg mL−1 and 250 μg mL−1, thus preparing graphene oxide-enabled fasting food models. HyClone™ cell culture grade water alone was used as a blank fasting food model (blank FFM).
Colloidal characterization of graphene oxide-enabled fasting food models:
Measurements of mean diffusion coefficient (D), polydispersity index (pdi), and agglomeration index (ai) of the as-prepared smGO and mGO at 50 μg mL−1 and 250 μg mL−1 were performed using a Zetasizer™ NanoZS instrument by Malvern Instruments Ltd. Immediately after preparation, 1-mL aliquots of each sample were transferred in 12-mm disposable, polystyrene cuvettes. Each sample was illuminated with a 633 nm He–Ne laser beam and D and pdi values were calculated in regular time intervals according to the ISO recommended cumulants analysis of the correlograms. The agglomeration indices reported here are defined as the ratio of kcps at 175° to kcps at 13°, normalized against its value at t = 0 min. For all samples, measurements were performed at 25 °C and measurement position and laser attenuation were set automatically by the instrument. Moreover, the scattering intensity for each sample in kilo (photon) counts per second (kcps) was recorded at 175° in regular time intervals. Time-resolved kcps values of smGO and mGO at 175° were recorded every second from freshly prepared samples using the “flow” measurement type. Finally, the obtained time series of D, pdi, ai, and kcps were fitted with GraphPad© Prism using simple linear regression and it was tested if the slopes were significantly non-zero, thus indicating a temporal change in colloidal properties.
Digestion of graphene-oxide enabled fasting food models using a three-phase gastro-intestinal tract simulator:
Five (5) mL of smGO or mGO at 50 μg mL−1 or 250 μg mL−1 were used as initial food inputs to simulate the digestion of 1.250 mg or 0.250 mg of GO-enabled membranes, respectively. An equal volume of HyClone™ cell culture grade, endotoxin-free water at pH 7 was used as the blank fasting food model (blank FFM). In total, 5 samples were generated: (1) blank FFM; (2) smGO at 50 μg mL−1; (3) smGO at 250 μg mL−1; (4) mGO at 50 μg mL−1; and (5) mGO at 250 μg mL−1. The in vitro simulated digestion of the above samples was performed using a 3-phase (oral, gastric, small intestinal) gastrointestinal tract simulator, as previously described in detail by the authors[36]. Briefly, in the oral phase, food inputs were brought to 37 °C, mixed with simulated saliva fluid pre-warmed at 37 °C, and inverted by hand for 10 seconds to mimic agitation in the mouth. The resulting oral phase digestas were then combined with pre-warmed simulated gastric fluid and incubated in a shaking incubator at 37 °C for two hours at 200 rpm to complete the stomach phase. In the small intestinal phase, stomach digestas were combined with pre-warmed solutions containing additional salts, bile extract, and lipase to simulate intestinal fluid, and were incubated at 37 °C for 2 hours.
Multi-angle laser diffraction measurements of oral, gastric, and small intestinal digestas:
A laser diffraction particle size analyzer (Mastersizer 3000, Malvern Instruments, Ltd) equipped with a wet dispersion unit (Hydro SV) and 633 and 466 nm laser sources was used to measure the volume-weighted particle size distributions in the oral, gastric, and small intestinal digestas of smGO and mGO at 250 μg mL−1. To perform background measurements, blank FFM samples corresponding to each of the oral, gastric, and small intestinal phase were diluted 1-in-7 with HyClone™ cell culture grade water and centrifuged at 10000×g for 10 min. The supernatants were then aspirated and used to correct for light refraction and background noise from the continuous phase. Oral, gastric, and small intestinal digestas of smGO, mGO, and blank FFM were diluted 1-in-7 with HyClone™ cell culture grade water and measured while stirred at 1800 rpm. For all samples, selected dispersant type was “water”, selected particle type was “non-spherical”, and the refractive index, absorption index, and density were set at 1.7, 0.01, and 2 g cm−3, respectively, for both 633 nm and 466 nm light measurements. For each sample, <10 measurements of 120 sec (at 633 nm) and 10 sec (at 466 nm) each were performed. Finally, the volume-weighted size distributions were averaged using the built-in software. For each of the oral, gastric, and small intestinal phase, multiple comparison tests between the Dv10, Dv50, and Dv90 values of blank FFM and each of smGO and mGO were performed on GraphPad© Prism using Tukey’s test.
Field-emission scanning electron microscopy of graphene oxide in small intestinal digestas:
Silicon wafers (0.5 × 5 × 7 mm) were sputter coated with 10 nm of Au in an EMS 150T S metal sputter coater and placed in 24-well plates. Each well was then filled with 2 mL of small intestinal phase digestas of smGO or mGO at 250 μg mL−1 and placed at 4 C° protected from light for 3 days. One (1) mL of pure glycerol was then added in each well to gently displace the sediments of digestas and reveal the wafers, which were transferred to new wells filled with deionized water. Importantly, only water and glycerol were used during sample preparation, the latter being a typical stabilizer of the tertiary structure of proteins[62]. After standing overnight, the wafers were allowed to dry protected from dust. For field-emission scanning electron microscopy, the wafers were secured on aluminum stubs with thin strips of conductive tape and were imaged using a Supra 55VPTM (Carl Zeiss AG) at a working distance of 3–4 mm using the in-lens detector operating at 1 kV.
X-ray photoelectron spectroscopy of graphene oxide in small intestinal digestas:
Ten (10) mL of each of the smGO and mGO at 250 μg mL−1 were vacuum filtered onto separate poly-ethersulfone (PES) membranes (Supor® PES Membrane Disc Filters, Pall Corp.), thus fabricating smGO-PES and mGO-PES membranes. Each of the as-prepared membranes was cut into half: one half underwent simulated digestion as described above and the other half was left untreated (control). At the end of the small intestinal digestion phase, smGO-PES and mGO-PES were immersed in deionized water for 12 hours and were then allowed to dry overnight protected from dust and light. For X-ray photoelectron spectroscopic (XPS) analysis, digested membranes and their respective controls were analyzed by a Thermo Scientific K-Alpha XPS (ESCA). The X-rays were generated by a 12 keV electron beam and had a spot size of 400 mm. The atomic percentages of each atom and the C1s peak deconvolution were performed by using the Thermo Scientific Avantage software. Three data points for each sample were taken. The dwell time was set to 10 ms for the survey spectra and 50 ms for the high-resolution (C1s) spectra. For each data point, the number of scans were set to 3 and 4 for the survey and high-resolution scans, respectively. The XPS instrumental error for atomic composition is ±1%, and the accuracy of the C1s peak fitting is ±2%. Data represent the average of three independent measurements.
Tri-culture, small intestinal epithelium cell model and treatments:
Caco-2, HT29-MTX, and Raji-B cells were obtained from Sigma, Inc. Monocultures of Caco-2 and HT29-MTX cells were grown in high-glucose DMEM supplemented with 10% vol/vol heat-inactivated fetal bovine serum (FBS). Raji B cells were cultured in RPMI 1640 media supplemented with 10% FBS.
A tri-culture, small intestinal epithelial model as previously described and characterized in detail by the authors was employed in this study[36]. In summary, 1.5 mL of Caco-2 cells and HT29-MTX cells were first co-cultured at a ratio of 3:1 (Caco-2:HT29-MTX) for 2 weeks on a 0.4-μm pore membrane transwell inserts (apical compartment) in a 6-well cell culture plate. In the basolateral compartment, 2.5 mL of complete DMEM media was added. After day 4 and until day 15, media was changed every other day. During this time, Caco-2 cells differentiated to intestinal enterocytes and HT29-MTX cells secreted mucus, similar to intestinal goblet cells. On day 15 and 16, the media in the basolateral compartment was replaced with 2.5 mL of Raji B cell suspension at a concentration of 1 ×10⁶ cells mL−1 in 1:1 DMEM: RPMI complete media to stimulate the differentiation of some of the mature Caco-2 cells to M-cell-like phenotype. Co-cultures of Caco-2/HT29-MTX in 96-well plates were used for tetrazolium salt reduction and ROS production studies (see below) which require closed-bottom adherent cell cultures suitable for plate reader fluorescence measurements. To prepare co-cultures, Caco-2 and HT29-MTX cells at a 3:1 ratio was seeded at a total 3 × 10⁴ cells per well (100 μL of cell mixture) in black-wall, clear optical bottom plates (BD Biosciences). After day 4 and until day 18, media was changed every other day.
The small intestinal phase digestas were combined with FBS-free DMEM at a ratio of 1:3 and the mixtures were applied to the cells on day 17 (1.5 mL to the apical compartment for transwell inserts, 200 μL per well for 96-well plates). It is worth noting that the initial GO concentrations in smGO and mGO were diluted by a factor of 48 before being applied to cells. Therefore, the triculture cellular model was eventually exposed to 1.04 μg mL−1 and 5.21 μg mL−1 corresponding to starting smGO and mGO concentrations of 50 and 250 μg mL−1, respectively.
Lactate dehydrogenase release, intracellular enzymatic activity, trans-epithelial resistance, and intracellular reactive oxygen species generation:
Transepithelial electrical resistance (TEER) was measured after 24 h treatment in transwell plate using an EVOM2 Epithelial Volt/Ohm Meter with a Chopstick Electrode Set (World Precision Instruments).
Cytotoxicity was performed after 24 h treatment in transwell tri-cultures using the Pierce LDH assay kit (Sigma Aldrich, St. Louis, MO, USA) according to manufacturer’s instructions. Briefly, untreated wells were used to measure spontaneous LDH release and lysed wells were used to measure maximum LDH release. Apical fluid from each well was transferred to a tube and was then centrifuged. After centrifugation, 50 μL of each supernatant was dispensed in a fresh 96-well plate where 50 μL of reaction mixture was added. Plates were incubated at room temperature for 30 minutes after which 50 μL of stop solution was added and mixed by tapping. Absorbance was measured at 490 nm (A490) and 680 nm (A680). To calculate LDH activity, A680 values were subtracted from A490 values to correct for instrument background. To correct for digesta background, LDH activities from no-cell controls were subtracted from test well LDH activities. Percent cytotoxicity was calculated by subtracting spontaneous LDH release values from treatment values, dividing by total LDH activity (Maximum LDH activity – Spontaneous LDH activity), and multiplying by 100.
ROS analysis was performed after 6 h treatment in 96-well plate co-cultures. Production of ROS was assessed using the CellROX® green regent (Thermo Fisher Scientific, Waltham, MA, USA) according to the manufacturer’s instructions. Briefly, media was removed from the test wells, replaced with 100 μL of working solution, and plates were incubated for 30 minutes at 37 °C. Wells were then washed 3 times with PBS and fluorescence was measured at 480 nm (excitation)/520 nm (emission). Cells treated with 100 μM menadione for 1 h at 37°C were used as positive controls for ROS generation.
PrestoBlue metabolic activity (cell viability) assay was performed after 24 h exposure using cells in 96-well plate co-cultures. PrestoBlue® cell viability reagent (ThermoFisher) was used according to the manufacturer’s instructions. Briefly, wells were washed 3 times with 200 μL of PBS, and 100 μL of 10% PrestoBlue reagent was added to each well. Plates were then incubated at 37 °C for 15 minutes and fluorescence was measured at 560 nm (excitation)/590 nm (emission).
Experiments were performed in triplicates and statistical analyses were performed on GraphPad© Prism using two-way ANOVA tests and multiple comparisons (corrected with Dunnett’s test).
Transmission electron microscopy:
Transwell membranes were immersed in a routine fixative of 2.5% Glutaraldehyde, 1.25% formaldehyde and 0.03% picric acid in 0.1 M sodium cacodylate buffer (pH 7.4). After overnight fixation at room temperature, membranes were washed in 0.1M cacodylate buffer and post-fixed with 1% osmium tetroxide (OsO4) / 1.5% potassium ferrocyanide (KFeCN6) for 1 hour, washed twice in water, once in maleate buffer (MB), and incubated in 1% uranyl acetate in MB for 1hr, followed by two washes in water and subsequent dehydration in grades of alcohol (10min each; 50%, 70%, 90%, 2×10min 100%). The samples were then put in propylene oxide for 1 hr and infiltrated overnight in a 1:1 mixture of propylene oxide and TAAB Epon (Marivac Canada Inc. St. Laurent, Canada). The following day the samples were embedded in TAAB Epon and polymerized at 60 °C for 48 hrs. Ultrathin sections (~60 nm) were cut on a Reichert Ultracut-S microtome, picked up on to copper grids stained with lead citrate and examined in a JEOL 1200EX transmission electron microscope and images were recorded with an AMT 2k CCD camera.
Supplementary Material
5. Acknowledgements
Research reported in this publication was supported by National Institute of Environmental Health Sciences Grants U24ES026946 and U01ES027292. The content is solely the responsibility of the authors and does not necessarily represent the official views of the National Institutes of Health. The engineered nanomaterial used in the research presented in this publication have been synthesized, characterized, and provided by the Engineered Nanomaterials Resource and Coordination Core established at Harvard T. H. Chan School of Public Health (NIH grant #U24ES026946) as part of the Nanotechnology Health Implications Research (NHIR) Consortium. Support for the reported research, analysis of data, and result interpretation were also provided by the Nanyang Technological University - Harvard T. H. Chan School of Public Health Initiative for Sustainable Nanotechnology (NTU-Harvard SusNano; NTU-HSPH 17001). Partial funding for Dimitrios Bitounis was provided by the International Initiative for the Environment and Public Health Cyprus Program of the Harvard School of Public Health.
Footnotes
6 Conflict of interest
The authors declare no conflict of interest.
8 References
- [1].Ong WJ, Tan LL, Ng YH, Yong ST, Chai SP, Chem. Rev 2016, 116, 7159. [DOI] [PubMed] [Google Scholar]
- [2].Bonaccorso F, Bartolotta A, Coleman JN, Backes C, Adv. Mater 2016, 6136. [DOI] [PubMed] [Google Scholar]
- [3].Kurapati R, Kostarelos K, Prato M, Bianco A, Adv. Mater 2016, 6052. [DOI] [PubMed] [Google Scholar]
- [4].Wang L, Xiong Q, Xiao F, Duan H, Biosens. Bioelectron 2017, 89, 136. [DOI] [PubMed] [Google Scholar]
- [5].Novoselov KS, Geim AK, Morozov SV, Jiang D, Zhang Y, Dubonos SV, Grigorieva IV, Firsov AA, Science (80-.). 2004, DOI 10.1126/science.1102896. [DOI] [PubMed] [Google Scholar]
- [6].Ghaffarzadeh K, IDTechEx 2018, DOI 10.1080/00958970801993680. [DOI] [Google Scholar]
- [7].Pham VH, Cuong TV, Hur SH, Shin EW, Kim JS, Chung JS, Kim EJ, Carbon N. Y 2010, DOI 10.1016/j.carbon.2010.01.062. [DOI] [Google Scholar]
- [8].Amadei CA, Arribas P, Vecitis CD, Carbon N. Y 2018, DOI 10.1016/j.carbon.2018.02.091. [DOI] [Google Scholar]
- [9].Cho JS, Jang W, Mun SC, Yi M, Park JH, Wang DH, Carbon N. Y 2018, DOI 10.1016/j.carbon.2018.07.010. [DOI] [Google Scholar]
- [10].Pyun J, Angew. Chemie - Int. Ed 2011, DOI 10.1002/anie.201003897. [DOI] [Google Scholar]
- [11].Feng L, Wu L, Qu X, Adv. Mater 2013, DOI 10.1002/adma.201203229. [DOI] [PubMed] [Google Scholar]
- [12].Pinto AM, Cabral J, Tanaka DAP, Mendes AM, Magalhães FD, Polym. Int 2013, DOI 10.1002/pi.4290. [DOI] [Google Scholar]
- [13].Chen J, Sun L, Cheng Y, Lu Z, Shao K, Li T, Hu C, Han H, ACS Appl. Mater. Interfaces 2016, DOI 10.1021/acsami.6b05730. [DOI] [PubMed] [Google Scholar]
- [14].Reina G, González-Domínguez JM, Criado A, Vázquez E, Bianco A, Prato M, Chem. Soc. Rev 2017, DOI 10.1039/c7cs00363c. [DOI] [PubMed] [Google Scholar]
- [15].Hegab HM, Zou L, J. Memb. Sci 2015, DOI 10.1016/j.memsci.2015.03.011. [DOI] [Google Scholar]
- [16].Ali-Boucetta H, Bitounis D, Raveendran-Nair R, Servant A, Van den Bossche J, Kostarelos K, Adv. Healthc. Mater 2013, 2, 433. [DOI] [PubMed] [Google Scholar]
- [17].Palmieri V, Perini G, De Spirito M, Papi M, Nanoscale Horizons 2019, DOI 10.1039/c8nh00318a. [DOI] [PubMed] [Google Scholar]
- [18].Kim YH, Jo MS, Kim JK, Shin JH, Baek JE, Park HS, An HJ, Lee JS, Kim BW, Kim HP, Ahn KH, Jeon KS, Oh SM, Lee JH, Workman T, Faustman EM, Yu IJ, Nanotoxicology 2018, DOI 10.1080/17435390.2018.1431318. [DOI] [Google Scholar]
- [19].Amadei CA, Montessori A, Kadow JP, Succi S, Vecitis CD, Environ. Sci. Technol 2017, DOI 10.1021/acs.est.6b05711. [DOI] [PubMed] [Google Scholar]
- [20].Wu SY, An SSA, Hulme J, Int. J. Nanomedicine 2015, DOI 10.2147/IJN.S88285. [DOI] [PMC free article] [PubMed] [Google Scholar]
- [21].Kwak SY, Lew TTS, Sweeney CJ, Koman VB, Wong MH, Bohmert-Tatarev K, Snell KD, Seo JS, Chua NH, Strano MS, Nat. Nanotechnol 2019, DOI 10.1038/s41565-019-0375-4. [DOI] [PubMed] [Google Scholar]
- [22].Nguyen THD, Lin M, Mustapha A, J. Food Prot 2015, DOI 10.4315/0362-028X.JFP-14-463. [DOI] [PubMed] [Google Scholar]
- [23].Ruiz ON, Fernando KAS, Wang B, Brown NA, Luo PG, McNamara ND, Vangsness M, Sun YP, Bunker CE, ACS Nano 2011, DOI 10.1021/nn202699t. [DOI] [PubMed] [Google Scholar]
- [24].Kucki M, Rupper P, Sarrieu C, Melucci M, Treossi E, Schwarz A, León V, Kraegeloh A, Flahaut E, Vázquez E, Palermo V, Wick P, Nanoscale 2016, DOI 10.1039/c6nr00319b. [DOI] [PubMed] [Google Scholar]
- [25].Kucki M, Diener L, Bohmer N, Hirsch C, Krug HF, Palermo V, Wick P, J. Nanobiotechnology 2017, DOI 10.1186/s12951-017-0280-7. [DOI] [PMC free article] [PubMed] [Google Scholar]
- [26].Guarnieri D, Sánchez-Moreno P, Del Rio Castillo AE, Bonaccorso F, Gatto F, Bardi G, Martín C, Vázquez E, Catelani T, Sabella S, Pompa PP, Small 2018, DOI 10.1002/smll.201800227. [DOI] [PubMed] [Google Scholar]
- [27].Yang K, Gong H, Shi X, Wan J, Zhang Y, Liu Z, Biomaterials 2013, DOI 10.1016/j.biomaterials.2013.01.001. [DOI] [PubMed] [Google Scholar]
- [28].Xie Y, Wu B, Zhang XX, Yin J, Mao L, Hu M, Chemosphere 2016, DOI 10.1016/j.chemosphere.2015.09.076. [DOI] [PubMed] [Google Scholar]
- [29].Li J, Yang S, Yu J, Cui R, Liu R, Lei R, Chang Y, Geng H, Qin Y, Gu W, Xia S, Chen K, Kong J, Chen G, Wu C, Xing G, RSC Adv. 2018, DOI 10.1039/c8ra06058d. [DOI] [PMC free article] [PubMed] [Google Scholar]
- [30].Sohal IS, O’Fallon KS, Gaines P, Demokritou P, Bello D, Part. Fibre Toxicol 2018, DOI 10.1186/s12989-018-0265-1. [DOI] [PMC free article] [PubMed] [Google Scholar]
- [31].Deloid GM, Cao X, Molina RM, Silva DI, Bhattacharya K, Ng KW, Loo SCJ, Brain JD, Demokritou P, Environ. Sci. Nano 2019, DOI 10.1039/c9en00184k. [DOI] [PMC free article] [PubMed] [Google Scholar]
- [32].Zhang Z, Zhang R, Xiao H, Bhattacharya K, Bitounis D, Demokritou P, McClements DJ, NanoImpact 2019, 13, 13. [DOI] [PMC free article] [PubMed] [Google Scholar]
- [33].Sohal IS, Cho YK, O’Fallon KS, Gaines P, Demokritou P, Bello D, ACS Nano 2018, DOI 10.1021/acsnano.8b02978. [DOI] [PubMed] [Google Scholar]
- [34].Cao X, Han Y, Li F, Li Z, McClements DJ, He L, Decker EA, Xing B, Xiao H, NanoImpact 2019, DOI 10.1016/j.impact.2018.12.002. [DOI] [Google Scholar]
- [35].McClements DJ, DeLoid G, Pyrgiotakis G, Shatkin JA, Xiao H, Demokritou P, NanoImpact 2016, 3–4, 47. [DOI] [PMC free article] [PubMed] [Google Scholar]
- [36].DeLoid GM, Wang Y, Kapronezai K, Lorente LR, Zhang R, Pyrgiotakis G, Konduru NV, Ericsson M, White JC, De La Torre-Roche R, Xiao H, McClements DJ, Demokritou P, Part. Fibre Toxicol 2017, 14, 40. [DOI] [PMC free article] [PubMed] [Google Scholar]
- [37].Parviz D, Strano M, Curr. Protoc. Chem. Biol 2018, 10, e51. [DOI] [PMC free article] [PubMed] [Google Scholar]
- [38].Jia J, Kan CM, Lin X, Shen X, Kim JK, Carbon N. Y 2014, DOI 10.1016/j.carbon.2014.05.027. [DOI] [Google Scholar]
- [39].Childres I, Jauregui LA, Park W, Caoa H, Chena YP, in New Dev. Phot. Mater. Res, 2013. [Google Scholar]
- [40].Montessori A, Amadei CA, Falcucci G, Sega M, Vecitis CD, Succi S, EPL 2016, DOI 10.1209/0295-5075/116/54002. [DOI] [Google Scholar]
- [41].Amadei CA, Vecitis CD, J. Phys. Chem. Lett 2016, DOI 10.1021/acs.jpclett.6b01829. [DOI] [PubMed] [Google Scholar]
- [42].Dimiev AM, Eigler S, Graphene Oxide: Fundamentals and Applications, John Wiley & Sons, 2016. [Google Scholar]
- [43].Konkena B, Vasudevan S, J. Phys. Chem. Lett 2012, DOI 10.1021/jz300236w. [DOI] [PubMed] [Google Scholar]
- [44].Neklyudov VV, Khafizov NR, Sedov IA, Dimiev AM, Phys. Chem. Chem. Phys 2017, DOI 10.1039/c7cp02303k. [DOI] [PubMed] [Google Scholar]
- [45].Gudarzi MM, Langmuir 2016, DOI 10.1021/acs.langmuir.6b01012. [DOI] [PubMed] [Google Scholar]
- [46].Zhao J, Wang Z, White JC, Xing B, Environ. Sci. Technol 2014, DOI 10.1021/es5022679. [DOI] [PubMed] [Google Scholar]
- [47].Wu L, Liu L, Gao B, Muñoz-Carpena R, Zhang M, Chen H, Zhou Z, Wang H, Langmuir 2013, DOI 10.1021/la404134x. [DOI] [PubMed] [Google Scholar]
- [48].Zhou Y, Fox DS, Maguire P, O’Connell R, Masters R, Rodenburg C, Wu H, Dapor M, Chen Y, Zhang H, Sci. Rep 2016, DOI 10.1038/srep21045. [DOI] [PMC free article] [PubMed] [Google Scholar]
- [49].Chua CK, Pumera M, Chem. Soc. Rev 2014, DOI 10.1039/c3cs60303b. [DOI] [PubMed] [Google Scholar]
- [50].Bose S, Kuila T, Mishra AK, Kim NH, Lee JH, J. Mater. Chem 2012, DOI 10.1039/c2jm00011c. [DOI] [Google Scholar]
- [51].Chen D, Li L, Guo L, Nanotechnology 2011, DOI 10.1088/0957-4484/22/32/325601. [DOI] [PubMed] [Google Scholar]
- [52].Liu J, Fu S, Yuan B, Li Y, Deng Z, J. Am. Chem. Soc 2010, DOI 10.1021/ja100938r. [DOI] [PubMed] [Google Scholar]
- [53].Esfandiar A, Akhavan O, Irajizad A, J. Mater. Chem 2011, DOI 10.1039/c1jm10151j. [DOI] [Google Scholar]
- [54].Rubio L, Pyrgiotakis G, Beltran-Huarac J, Zhang Y, Gaurav J, Deloid G, Spyrogianni A, Sarosiek KA, Bello D, Demokritou P, Part. Fibre Toxicol 2019, DOI 10.1186/s12989-019-0325-1. [DOI] [PMC free article] [PubMed] [Google Scholar]
- [55].Khatri M, Bello D, Martin J, Bello A, Gore R, Demokritou P, Gaines P, NanoImpact 2017, DOI 10.1016/j.impact.2017.01.007. [DOI] [Google Scholar]
- [56].Rahmanian N, Hamishehkar H, Dolatabadi JEN, Arsalani N, Colloids Surfaces B Biointerfaces 2014, DOI 10.1016/j.colsurfb.2014.09.036. [DOI] [PubMed] [Google Scholar]
- [57].Cao X, Deloid GM, Bitounis D, De La Torre-Roche R, White JC, Zhang Z, Ho CG, Ng KW, Eitzer BD, Demokritou P, Environ. Sci. Nano 2019, DOI 10.1039/c9en00676a. [DOI] [PMC free article] [PubMed] [Google Scholar]
- [58].Crawley SW, Mooseker MS, Tyska MJ, J. Cell Biol 2014, DOI 10.1083/jcb.201407015. [DOI] [PMC free article] [PubMed] [Google Scholar]
- [59].Deloid GM, Sohal IS, Lorente LR, Molina RM, Pyrgiotakis G, Stevanovic A, Zhang R, McClements DJ, Geitner NK, Bousfield DW, Ng KW, Loo SCJ, Bell DC, Brain J, Demokritou P, ACS Nano 2018, DOI 10.1021/acsnano.8b03074. [DOI] [PMC free article] [PubMed] [Google Scholar]
- [60].Zhao Y, Yu X, Jia R, Yang R, Rui Q, Wang D, Sci. Rep 2015, DOI 10.1038/srep17233. [DOI] [PMC free article] [PubMed] [Google Scholar]
- [61].Cohen JM, Beltran-Huarac J, Pyrgiotakis G, Demokritou P, NanoImpact 2018, DOI 10.1016/j.impact.2017.12.002. [DOI] [PMC free article] [PubMed] [Google Scholar]
- [62].Vagenende V, Yap MGS, Trout BL, Biochemistry 2009, DOI 10.1021/bi900649t. [DOI] [PubMed] [Google Scholar]
Associated Data
This section collects any data citations, data availability statements, or supplementary materials included in this article.