Abstract
Now that examples of multisensory neurons have been observed across the neocortex, this has led to some confusion about the features that actually designate a region as “multisensory.” While the documentation of multisensory effects within many different cortical areas is clear, often little information is available about their proportions or net functional effects. To assess the compositional and functional features that contribute to the multisensory nature of a region, the present investigation used multichannel neuronal recording and tract tracing methods to examine the ferret temporal region: the Lateral Rostral Suprasylvian Sulcal area (LRSS). Here, auditory-tactile multisensory neurons were predominant and constituted the majority of neurons across all cortical layers whose responses dominated the net spiking activity of the area. These results were then compared with a literature review of cortical multisensory data and were found to closely resemble multisensory features of other, higher-order sensory areas. Collectively, these observations argue that multisensory processing presents itself in hierarchical and area-specific ways, from regions that exhibit few multisensory features to those whose composition and processes are dominated by multisensory activity. It seems logical that the former exhibit some multisensory features (among many others), while the latter are legitimately designated as “multisensory.”
Keywords: Auditory, Neocortex, Multisensory Convergence, Multisensory Integration, Neocortex, RRID:AB_509997: SMI-32R-100, RRID:SCR_006495: Tucker-Davis Technologies, RRID:SCR_004314: MicroBrightfield, Inc., Single-unit recording, Somatosensory, Tract-tracing
Graphical Abstract
• Multisensory processing occurs across the neocortex, but what makes an area multisensory?
• Multisensory processing in ferret Lateral Rostral Suprasylvian (LRSS) area was examined using tract tracing and multichannel neuronal recording and compared with other cortical areas.
• Inputs from lower level auditory and somatosensory cortices converged in the LRSS, where the majority of neurons were auditory-somatosensory multisensory and multisensory activity was the dominant output signal.
• Comparison with similarly-studied cortical areas indicates that areas dominated by multisensory activity are appropriately designated as multisensory.
1.0. INTRODUCTION
One of the major functions of cortex is to integrate signals from a complex sensory environment into a unified percept, such as in the merging of sight, taste, odor and texture into the fused perception of a carrot or a steak (e.g., see Fondberg et al., 2018). For such sensory synthesis to occur, inputs from different sensory systems must converge onto individual neurons, which is a phenomenon that is so prevalent that it seems to be a ubiquitous property of the neocortex (Ghanzafar and Schroeder, 2006). An issue that emerges from this general observation is the understanding of how much multisensory convergence must occur in a given region to render it multisensory. This is relevant for interpreting the results of macro-level assessments of function, such as fMRI, EEG and Intrinsic Signal imaging, which report a summary signal from the massive numbers of neurons involved. For any given region, areal responses to multisensory stimulation are generated by a population of neurons made up of subgroups of unisensory and multiple multisensory neuron types. So far, the only studies to identify and assess these different types of cortical neurons have employed single-unit (or multichannel single-unit) electrophysiological recordings. Indeed, even multi-unit recordings lack the acuity to resolve the activity necessary to identify them as one of three categories of sensory neuron: unisensory (those which are significantly influenced by stimulation from only one sensory modality; bimodal/trimodal multisensory neurons (those which show spiking responses to independent stimuli from more than one modality) and subthreshold multisensory neurons (neurons that exhibit spiking activity to only one modality but is significantly modulated by stimulation of another modality). Examples of these types of neurons have been identified in a variety of cortical areas by numerous investigations using single-unit techniques (Allman et al., 2009; Allman and Meredith, 2007; Avillac et al., 2007; Barraclough et al., 2005; Bizley et al., 2007; Breveglieri et al., 2008; Clemo et al., 2007; Dehner et al., 2004; Duhamel et al., 1998; Foxworthy et al., 2013a,b; Kayser et al., 2008. 2009; Keniston et al., 2009; Meredith and Allman, 2009, 2015; Meredith et al., 2006, 2018; Wallace et al., 2006). However, it needs to be recognized that identifying multisensory neurons within a given area is very different from understanding the proportion of multisensory neurons present and the net effect of the multisensory signal generated by their activation. For example, multisensory activity occurs in core auditory cortex (areas A1/AAF; Bizley et al., 2007), but the collective result of crossmodal activity there represents significantly less than ongoing spontaneous output of the constituent auditory neurons (Meredith and Allman, 2015). Thus, the observation of a small number of multisensory neurons within a much larger pool seems insufficient to render a region’s output as multisensory and essentially asks the question: how much of a given area must be multisensory for the entire region to be designated as multisensory? On the other hand, given the high degree of local circuit interconnectivity, it is difficult to understand how a cortical area that receives multisensory inputs is not entirely ‘infected’ by multisensory properties. These issues relating the proportionality of multisensory neurons in a given region to that region’s multisensory function, however, have not yet been systematically addressed.
One region that has been observed to exhibit multisensory processing (e.g., Avilac et al., 2007; Breveglieri et al., 2008; Duhamel et al., 1998; Lippert et al., 2013; Schlack et al., 2005; Schroeder and Foxe, 2002) and whose proportional multisensory components have been revealed at the single-unit level is the parietal cortex. In a study of the ferret rostral Posterior Parietal area (PPr; Foxworthy et al., 2013a,b), 64% of identified neurons showed multisensory properties that accounted for 78% of the spiking activity in response to multisensory stimulation, and that multisensory neurons predominated in each cortical layer except layer 6. Furthermore, these multisensory properties were dependent on inputs from unisensory cortical regions whose axon terminals largely targeted the supragranular layers where dendritic spine density was highest. Although it cannot be assumed that these findings suggest a pattern of multisensory processing that is applicable to other multisensory cortices, they represent a quantitative basis by which data from other multisensory cortical regions can be compared. Therefore, the present investigation was initiated to evaluate the proportional, functional and connectional features of a different multisensory cortical region.
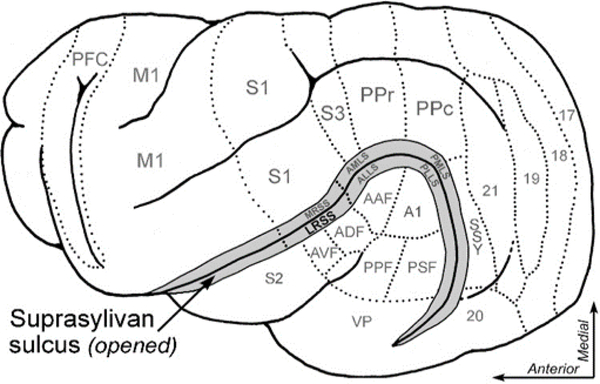
Our present experiments examined a newly identified region of ferret cortex: the lateral rostral suprasylvian sulcal area (LRSS). As illustrated on the diagram of ferret cortex in Figure 1, the LRSS region borders the temporal auditory representations of the anterior dorsal- and anterior ventral auditory fields (ADF/AVF; Bizley et al., 2005; see Table 1 for list of abbreviations) and resides lateral to the parietal somatosensory cortices. In preliminary studies (Keniston et al., 2008, 2009a), this region has been determined to process both auditory and somatosensory signals, as would be expected from its location between the auditory and somatosensory cortical fields. Therefore the LRSS was investigated to examine the incidence and integrative features of its constituent multisensory neurons while also elucidating its laminar, functional and connectional properties. The primary goal of these experiments is to compare results obtained from the LRSS with published data from other multisensory areas and to identify the different patterns generated by the multisensory components of different sensory cortices.
Figure 1:
A lateral view of ferret cerebral cortex showing the opened suprasylvian sulcus (greyed, at arrow) and selected functional areas (outlined by dotted lines). See Table 1 for list of abbreviations.
Table 1:
List of abbreviations
| Area A1 | Primary auditory cortex |
| Area M1 | Primary motor cortex |
| Area S1 | Primary somatosensory cortex |
| Area S2 | Second somatosensory cortex |
| Area S3 | Third somatosensory cortex |
| Area 17 | Primary visual cortex |
| Area 18 | Secondary visual cortex |
| Area 19 | Third visual cortex |
| Area 20 | Visual cortical area 20 |
| AAF | Anterior auditory field |
| ADF | Anterior dorsal auditory field |
| AVF | Anterior ventral auditory field |
| ALLS | Anterolateral lateral suprasylvian visual area |
| AMLS | Anteromedial lateral suprasylvian visual área |
| LRSS | Lateral rostral suprasylvian sulcal somatosensory area |
| MRSS | Medial rostral suprasylvian sulcal somatosensory area |
| PLLS | Posterolateral lateral suprasylvian visual area |
| PMLS | Posteromedial lateral suprasylvian visual area |
| PPF | Posterior pseudosylvian auditory field |
| PSF | Posterior suprasylvian auditory field |
| SSY | Suprasylvian sulcal visual area |
| VLF | Ventral lateral auditory field |
| vPAF | Ventral posterior auditory field |
2.0. MATERIALS AND METHODS
All procedures were performed in compliance with the Guide for Care and Use of Laboratory Animals (NIH publication 86–23) and the National Research Council’s Guidelines for Care and Use of Mammals in Neuroscience and Behavioral Research (2003) and approved by the Institutional Animal Care and Use Committee at Virginia Commonwealth University. Unless otherwise stated, adult male ferrets procured from Marshall Farms (North Rose, NY) were used.
2.1. Electrophysiological Procedures:
Preparation for electrophysiological recordings occurred in two phases. First, the animal was anesthetized (pentobarbital 40 mg/kg, i.p.) and its head secured in a stereotaxic frame. Using aseptic surgical techniques, a craniotomy was made to expose the LRSS cortex and a recording well/head support mount was implanted using screws and dental cement. The scalp incision was sutured closed around the implant and standard postoperative care was provided. Second, after at least two days of recovery, the animal was anesthetized (35 mg/kg ketamine and 2 mg/kg acepromazine, i.m.) and the head was supported by securing the implanted well/head to a support frame; thus no wounds or pressure points were present. An endotracheal tube was inserted and the animal artificially ventilated with expired carbon dioxide kept at ~4.5%. Contact lenses were applied to prevent corneal drying. A muscle relaxant (0.3 mg/kg pancuronium bromide, i.m.) was given to prevent spontaneous movements and the animal received a continuous infusion of anesthetic and fluids (4 mg/kg/h ketamine; 0.5 mg/kg/h acepromazine; 0.2 mg/kg/h pancuronium bromide in a 5% dextrose/0.9% saline solution, i.p.). Heart rate and body temperature were continuously monitored and a heating pad used to maintain temperature at ~38 °C. The implant was then opened and the dura over the LRSS reflected. Guided by sulcal landmarks, the 32 channel Michigan silicon probe (~1 MO, 1×32×5mm, #100–413, 100 μm contact spacing; NeuroNexus Technologies, Ann Arbor, MI) was inserted into the LRSS cortex to 3.5–6 mm depth using a hydraulic micropositioner. The probe was allowed to settle in situ for one half hour prior to onset of sensory testing.
Neuronal activity was picked-up by the headstage, routed through chained Medusa 16 preamps (digitized at 25kHz) through a Pentusa digital amplifier (Tucker-Davis Technologies; RRID:SCR_006495; 32 channel recording system) and stored on computer as well as monitored through a loudspeaker and on an on-screen oscilloscope. Neurons were tested using manually-delivered stimulation to provide a quick estimate of sensory responsiveness and preference. Auditory responsiveness was assessed using a dog-training clicker, and visual sensitivity was evaluated with focused spots of light from a flashlight or a 4” black card moved in ambient light across the visual field. Manual tactile stimulation consisted of lightly tapping the body surface with a fine camel’s hair brush, and where receptive, the borders were recorded graphically on a scaled drawing of a ferret. Quantitative sensory testing used electronically-triggered stimuli in one of three presentations: auditory alone, somatosensory alone, or combined auditory-somatosensory. Auditory stimuli (100ms duration, 81 dB SPL white noise) were generated (RX-6; TDT) using a Gaussian function and delivered through FF1 magnetic speakers (TDT) at 45° azimuth, 0° elevation 35 cm from the animal’s head. Somatosensory stimuli were generated by an electronic ramp generator (delay, velocity, amplitude and duration independently variable) that drove a modified shaker (Ling 102A) equipped with a nylon monofilament (0.17 × 48 mm) that delivered a tap (2.5×10⁻² g force) to hair or cutaneous body surface. These stimuli were programmed to onset individually (e.g., auditory alone, somatosensory alone) or in combination. Each stimulus or combination was presented 50 times in random order with a randomized intertrial interval of 3 to 8 seconds. Each stimulus was positioned to fall within the receptive fields of as many as possible of the neurons per penetration. Neuronal responses from each of the recording channels were digitized at 25 kHz using a Tucker Davis neurophysiology workstation (RRID:SCR_006495; System III, Alachua, FL) and stored on a PC for later analysis. When recording was completed, the animal was euthanized and processed histologically (as described for neuroanatomical procedures, below), where the tissue was sectioned coronally (50 μm thick), mounted and counterstained (Cresyl violet). From these serial sections, recording penetrations were histologically identified by the position of their recording tracks and photographed using a light microscope. From a similar, cresyl-violet stained section, the LRSS layers were traced and transferred to the image containing the recording track. Finally, a scaled schematic of the multichannel electrode was graphically superimposed on the section and the position of responsive neurons was indicated at the corresponding recording site. Only recording sites that were verified within LRSS were included in this study.
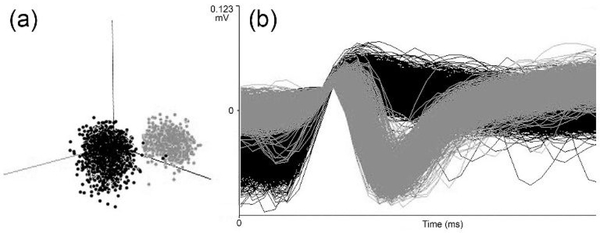
For electrophysiological data analysis, individual neuronal waveforms were sorted offline using an automated Bayesian sort-routine (v. 2.10, OpenSorter, Tucker Davis; RRID:SCR_006495) to identify and group waveforms that represent single units, as depicted in Figure 2. For each neuronal template, responses to stimuli were identified after the method of (Bell et al., 2005): response onset was defined as the point which activity level exceeded 3 standard deviations above median spontaneous activity (as measured from −0.5 s to 5 ms prior to stimulus onset), with a minimum of 15 ms of activity sustained at that level; response offset was defined as activity that dropped below the sustained response level and remained below it for 15 ms; response duration was defined as the period between the response onset and offset. The time span between onset and offset was used to calculate the spike counts for each of the three stimulus conditions and, in this manner, a mean (and standard deviation) spike count was determined for somatosensory, auditory, and combined somatosensory-auditory stimulation for each neuron. All responses were confirmed by examining the peristimulus time histogram and spike-density functions generated for each templated neuron. Where more than one neuron was identified at a given locus, a t-test was used to determine if spike counts for all stimulus conditions were significantly different; if criteria were not met, data representing only one neuron was included for analysis. These same procedures were used to ensure that neurons recorded at adjoining depth locations were different. To avoid well-known floor effects on measures of integration, neurons with low response levels to combined-stimulation (<1.0 spike/trial) were required to have responses to separate-modality stimulation that were significantly different (t-test) from the combined response for inclusion. The following multisensory definitions (denoted by underscored text; consistent with numerous published studies of multisensory processing: Meredith and Stein, 1986; 1996; Allman et al., 2009; Stevenson et al., 2014) are used in this study. Based on suprathreshold responses to sensory stimulation, neurons were defined as bimodal multisensory neurons (responded separately to more than one sensory modality presented alone) or as unimodal neurons (responded to only one modality when presented alone). In addition, unimodal neurons whose responses to combined auditory-somatosensory stimulation were significantly different (paired t-test) from the most effective single-modality response were defined as subthreshold multisensory neurons (also called “modulatory”). A small number of units (<1%) could not be characterized by these criteria, and were not analyzed further. Within multisensory neurons, multisensory integration was defined statistically (paired t-test) to assess if the best separate-modality response differed significantly from the response evoked by the combined condition. For neurons showing multisensory integration, the levels of response enhancement or response depression were determined by subtracting the response evoked by the combined stimuli from the response elicited by the best unisensory stumulus, that was then divided by the response to the best unisensory stimulus and multiplying by 100 (expressed as a percent change). These results for each neuron were then tabulated with other receptive field or anatomical features (e.g., lamina), sorted and examined by group (e.g., unimodal, bimodal, etc.).
Figure 2.
A screen-shot of waveforms recorded from one site in the LRSS demonstrating (A) cluster cutting and (B) waveform discrimination for identification of single-unit activity (grey=one unit; black=second unit).
2.2. Retrograde Tract-tracing Procedures:
For retrograde tracer studies, ferrets (n=3) were anesthetized with pentobarbital (40 mg/kg i.p.) and a craniotomy was performed, under aseptic conditions, to expose the LRSS cortex. An electrode carrier was used to support a syringe containing the tracer (biotinylated dextran amine, BDA 3k MW; 10% in Citrate buffer, 0.75 μl) which was pressure injected. After the injection, the cortex was covered with gel foam, the wound sutured closed, and standard postoperative care was provided. Following an 8–12 day post-injection survival period, animals were deeply anesthetized (pentobarbital, 60mg/kg i.p.) and exsanguinated by saline perfusion followed by 4.0% paraformaldehyde fixative. The brain was stereotaxically blocked in the coronal plane, removed and cryoprotected. Sections (50 μm thick) were cut serially using a freezing microtome. A series of sections (300 μm interval) was processed for BDA visualization using the protocol of Veenman et al. (1992) with heavy metal intensification. Reacted sections were mounted on pre-treated slides, dehydrated and coverslipped.
The BDA-reacted tissue sections were examined using a light microscope and the locations of labeled neuronal features were plotted using a PC-driven digitizing stage controlled by Neurolucida software (MBF Biosciences, Williston VT, USA; RRID:SCR_006495). Each tissue section was traced showing its tissue outline and grey matter/white matter border, upon which the locations of labeled neurons were plotted. Retrogradely labeled neurons were densely black within their somata and proximal dendrites. Plotted tissue sections from each case were digitally transferred to a graphics program and serially superimposed for final visualization and graphic display. Sulcal/gyral and cytoarchitectonic landmarks were used to identify the functional subdivisions of cortex according to published mapping studies (Bizley et al., 2005; Foxworthy et al., 2011; Homman-Ludiye et al., 2010; Innocenti et al., 2002; Keniston et al., 2009b; Leclerc et al., 1993; Manger et al., 2002, 2004, 2008; McLaughlin et al., 1998; Rice et al., 1993; Zhou et al., 2016) and the Neurolucida Explorer (MBF Biosciences, Williston VT, USA; RRID:SCR_006495) program was used to count the number of labeled neurons per region, which was then tabulated in a spread sheet. In this way, the number of neurons per area projecting to the LRSS could be compared within and across cases.
2.3. Orthograde Tract-tracing Procedures:
For orthograde tracer studies, ferrets were anesthetized with pentobarbital (40 mg/kg i.p.) and a craniotomy was performed, under aseptic conditions, to expose either the auditory cortices on the middle ectosylvian gyrus (n=3; 0.7 μl injection volume) or the somatosensory cortices of S1 (n=2) and MRSS (n=3; 0.7 μl injection volume). Each of these selected sites were determined earlier to be sources of projections the LRSS. Except that BDA 10k MW in PBS, ~0.75μl was used as the tracer, the same injection, transport and processing procedures as described for retrograde procedures were followed. BDA-reacted tissue sections (n=7–10/case) were examined using a light microscope equipped with a PC-driven digitizing stage to plot laminar boundaries and the locations of labeled axon terminals/boutons in LRSS. Labeled boutons, identified as sharp, black swellings at the end of thin axon stalks or as symmetrical varicosities along the course of an axon, were plotted at 200X magnification. Labeled boutons were measured under 1000x oil-immersion using Neurolucida software (MBF Bioscience; RRID:SCR_006495); these data were tabulated in a spreadsheet for comparison and statistical analysis. Adjacent, cresyl-violet stained sections were used to assist laminar identification. Plots containing bouton markers and laminar designations were examined using NeuroExplorer software (MBF Bioscience; RRID:SCR_006495) to determine bouton counts/laminae per section. The number of granular (layer 4), supragranular (layers 1–3) and infragranular (layers 5–6) boutons were compiled for each case and their ratios were used to assess whether a projection targeted granular, supragranular, or infragranular locations in the LRSS.
2.4. Laminar and cytoarchitectonic features:
The laminar arrangement of the LRSS was assessed for electophysiological or tract-tracing experiments by staining sections with cresyl-violet and examining the sections using a light microscope/Neurolucida system. In addition, in several cases a separate series of sections was processed to visualize cytoarchitectural features using the antibody SMI-32 (SMI-32R; Covance, Berkeley, CA; RRID:AB_509997; Table 2). The SMI-32 mouse monoclonal IgG1 antibody was prepared against the nonphosphorylated epitope of neurofilament H isolated from homogenized hypothalami from Fischer 344 rats. SMI-32 is expressed in neuronal cell bodies, dendrites, and some thick axons in both the central and the peripheral nervous systems (Sternberger and Sternberger, 1983). SMI-32 immunreactivity has previously been shown to distinguish reliably the cortical layers in a variety of species and largely generates strong labeling in medium/large-sized pyramidal neurons located in cortical layers 3 and 5 as well as demarcating the six layers of the ferret cortex (Homman-Ludiye et al., 2010).
Table 2.
Sources and Dilutions of Antibodies
| Host | Antigen | Manufacturer | Catalog No. | Citation | Dilution |
|---|---|---|---|---|---|
| Mouse | Rat hypothalamus nonphosphorylated neurofilaments | Covance, Princeton NJ | SMI-32R | Sternberger and Sternberger, 1983 | 1/1,500 |
2.5. Golgi Procedures:
Ferrets (n=3) were deeply anesthetized with sodium pentobarbital (60 mg/kg i.p.) and perfused transcardially with 0.9% saline followed by 0.4% paraformaldehyde. Next, the cortex of both hemispheres was blocked stereotaxically in the coronal plane into 7–10 mm thick segments. Blocks containing the LRSS were stained using the FD Rapid Golgi Stain Kit (FD Neurotechnologies, Ellicott City, MD, USA) and protocol. This procedure has been used in numerous published studies from our lab (e.g., Clemo et al., 2016; Clemo and Meredith, 2012) and has been specifically recommended for the analysis of neuronal dendritic spines (Risher et al., 2014). First, the tissue block was rinsed in double-distilled water and incubated for 14 days in the dark at room temperature in a 1:1 mixture of FD solutions A/B (refreshed after first day). Next, the tissue block was transferred to FD solution C and refrigerated (4°C) in the dark for 7 days (refreshed after first day). The tissue block was then sectioned serially (125 μm thickness) on a vibratome, mounted from FD solution C onto gelatin-coated glass slides and air dried in the dark overnight. Finally, the sections were reacted (FD solutions D/E) in the dark for 10 min according to the FD staining procedure, after which they were dehydrated in a series of alcohols/xylene and coverslipped using Permount.
2.6. Analysis of Golgi-stained Neurons:
Golgi-Cox stained sections containing the LRSS were surveyed using low magnification light-microscopy to identify candidate neurons for tracing and reconstruction. Candidate LRSS neurons were required to display complete labeling of their soma and connected dendrites. Once a candidate neuron was identified, the entire tissue section and its features (outline, grey-white border) in which it was located was traced using a light microscope and Neurolucida software. Subsequent tracing of the neuronal somata and dendritic branches was done at high (400x) magnification. This process was repeated for different neurons in the different cortical laminae and in different tissue sections from each of the cases until about 30 were collected from each animal.
2.7. Analysis of Golgi-stained Dendritic Spines:
From reconstructed Golgi-stained LRSS pyramidal neurons (described above), candidate portions of apical and basilar dendrites bearing spines were selected and measured using Neurolucida software. Along these defined dendritic segments, high magnification (1000x, oil) was used to visualize and mark, using Neurolucida, the location of each visible dendritic spine. No attempt was made to resolve spines hidden by the thickness of the dendrite itself. Spines were classified according to the criteria of Stuart et al., (2007) as simple or pedunculated. Simple spines were defined as protrusions from the parent dendrite that lacked a neck constriction and could be short, bent or straight. Pedunculated spines were defined as protrusions that exhibited a neck constriction, usually with a bulbous enlargement at the tip. Occasionally, filopodic spines were observed as long, thin, sometimes wavy protrusions but, because they often lack synaptic contacts, were not marked or counted. In addition, because spine densities diminish at locations close to the neuronal soma, no spines were evaluated <25μm from the soma. This process was repeated until at least one apical and 2–4 basilar dendrites were examined in 6–7 neurons for each of the selected neurons. The number marked spines was counted (Neurolucida Explorer) per segment length to determine dendritic spine density (spines/μm ) and exported the data to a spreadsheet. The spreadsheet tabulated these measures according to laminar location (SG=supragranular layers 2–3; IG=infragranular layers 5–6) of the parent cell body. Values for the average and standard deviation were calculated for each of these parameters and groups were statistically compared using a t-test (p<0.05). Representative dendritic segments/spines were photographed (Nikon Eclipse 60) or reconstructed using a camera lucida drawing tube attached to a light microscope (Nikon Eclipse400). Images were imported to Photoshop (Adobe Systems) for graphic manipulation and display.
3.0. RESULTS
3.1. LRSS location and cellular features
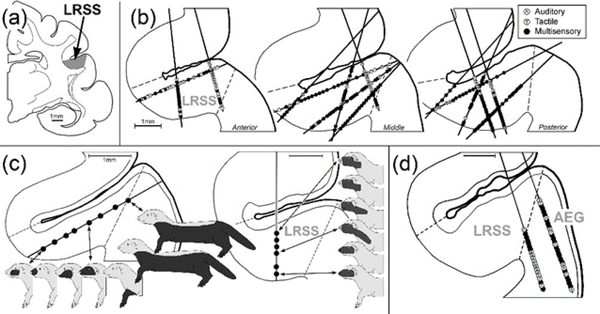
A preliminary evaluation of the LRSS occurred during an investigation of the medial bank of the suprasylvian sulcus (where the MRSS is located; Keniston et al., 2009b), when several recording penetrations transited into the adjoining lateral bank of the sulcus. Here, recordings were distinguished from those of the MRSS by the prevalence of somatosensory receptive fields outside the head and face and the higher likelihood of response to auditory stimulation (Keniston et al., 2008, 2009a). The present investigation sought to extend those initial findings by examining the sensory and multisensory properties of the LRSS. Accordingly, single-unit recordings were performed in 8 adult ferrets at 15 different histologically confirmed electrode tracks within the LRSS, as shown in Figure 3. From these recordings, evidence for a whole-body, somatotopic arrangement was observed within the LRSS, as illustrated in Figure 3c. Representation of the head/face was found near the fundus of the sulcus (possibly in continuum with MRSS on medial bank), forelimb/forepaw in the mid-bank region and trunk/hindlimb/tail near the lip of the sulcus. In addition, the somatotopy also demonstrated a columnar arrangement, such that penetrations that ran perpendicular to the pial surface encountered receptive fields centered on the same body part or region, as depicted in Figure 3c. Also during the present experiments, several recording penetrations passed laterally from the LRSS onto the anterior ectosylvian gyrus (AEG), as shown in Figure 3d. In these instances, high proportions of neurons (95%) were responsive to auditory stimulation, which is consistent with the classification of this region as the auditory anterior ventral (AVF) and anterior dorsal (ADF) fields (Bizley et al., 2005). Collectively, these data indicate that the LRSS contains a whole-body representation that is located lateral to the face/head representation of the MRSS, but medial to the auditory AVF/ADF fields. Visual responses were not observed in the LRSS region, although penetrations (not shown) further posterior to those in Figure 3b revealed responses that are consistent with a transition into the anterolateral lateral suprasylvian visual field (ALLS; Manger et al., 2004). Anteriorly, the presumed transition from LRSS into S2 was not identified because the S2 region itself has not been examined or mapped in ferrets.
Figure 3:
Recording penetration reconstructions. (a) shows a coronal section through cortex that contains the Lateral Rostral Suprasylvian Sulcal area (LRSS-shaded grey) on the lateral bank of the suprasylvian sulcus. Only the sulcus and its surrounding tissue is depicted in the subsequent figures. (b) shows reconstructions for all 15 recording penetrations through the anterior, middle and posterior levels of the LRSS. Each dot represents 1 neuron; black dots = multisensory neurons (bimodal, subthreshold), open dots represent unisensory auditory neurons, grey dots represent unisensory tactile neurons. Not all neurons are shown due to overlap. (c)-left, depicts the somatosensory representation in the LRSS. For a penetration that spanned the LRSS from the lip to the fundus, somatosensory-responsive neurons (black dots) exhibited receptive fields (black areas on ferret body) that progressed from the trunk/hindlimb/tail, to forelimb and eventually to face. When recording penetrations paralleled the columnar organization of the region (roughly perpendicular to pial surface of the sulcus), depicted in (c)-right, somatosensory-responsive neurons exhibited receptive fields that were spatially related to one another, as if they were ‘nested’ on a particular part of the body surface. (d) Depicts sensory responses derived from the anterior ectosylvian gyrus (AEG) lateral to the LRSS. Neurons in this region were primarily responsive to auditory stimulation (96.5%), but also showed sensitivity to somatosensory inputs (59%). See (b) for key.
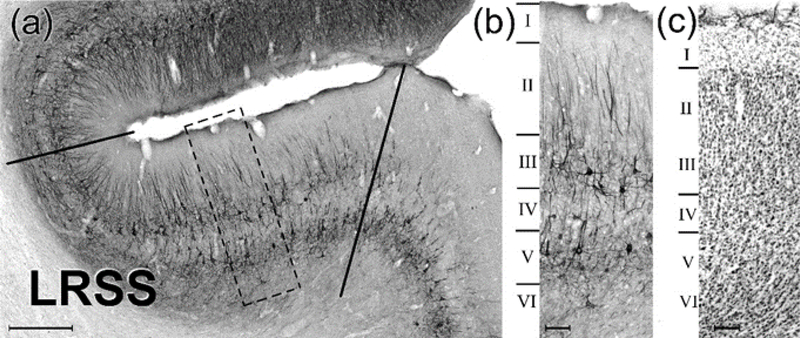
The functional properties of the LRSS region correspond with some of its cytoarchitectonic features, as depicted in Figure 4. The LRSS exhibits the six layers characteristic of homotypical neocortex. The SMI-32 immunostaining of this region is characterized by heavily stained, moderate-sized pyramidal neurons in layer 5, a faint and comparatively narrow layer 4, well-stained somata and neuropil in layer 3 and stained, vertically oriented dendrites in layer 2. SMI-32 staining in layers 2 and 3 diminishes and fades as it crosses the lip of the sulcus onto the anterior ectosylvian gyrus (where auditory fields ADF and AVF are located (Bizley et al., 2005), but remains consistent across the fundus and into the medial bank where LRSS transitions to MRSS (Keniston et al., 2009b). These laminar features are also evident in Cresyl violet-stained sections of the LRSS, as shown in Figure 4c. Golgi-Cox staining revealed the presence of neuronal profiles across the laminae of the LRSS. Using light microscopy and Neurolucida, the neuronal morphology of 90 Golgi-Cox stained neurons was reconstructed. Overall, soma size was fairly regular across the laminae (mean area= 195.2 μm2 ± 4.6 s.e.) but the largest tended to be layer 5–6 pyramidal neurons while the smallest were non-pyramidal neurons; spiny stellate neurons sometimes characteristic of layer 4 were not observed.
Figure 4:
Lamination of the ferret lateral rostral suprasylvian sulcal area (LRSS). A coronal section through the LRSS is depicted in the micrograph (a) where SMI-32 immunocytochemistry reveals the cytoarchitectonics and lamination of the LRSS region (scale = 0.5mm). Layers with little to no staining are separated by bands containing labeled processes and/or cell bodies. The boxed area (dashed lines) is further magnified in (b) to identify the specific layers: no label is seen in layer I, modest labeling of vertically oriented dendrites occurs in layer II, darkly labeled pyramidal neurons with crossed and diagonally-oriented labeled dendrites are observed in layer III, sparse labeling occurs in layer IV, heavy labeling of pyramidal neurons with crossed and diagonally-oriented dendritic labeling is found in layer V, and moderate to sparse labeling of short dendritic segments is shown in layer VI. These cytoarchtectonic features change at the lip of the sulcus (scale = 0.1mm). Part (c) shows a corresponding, Cresyl violet-stained section through the LRSS (scale = 0.1mm).
3.2. Multisensory Properties of the LRSS
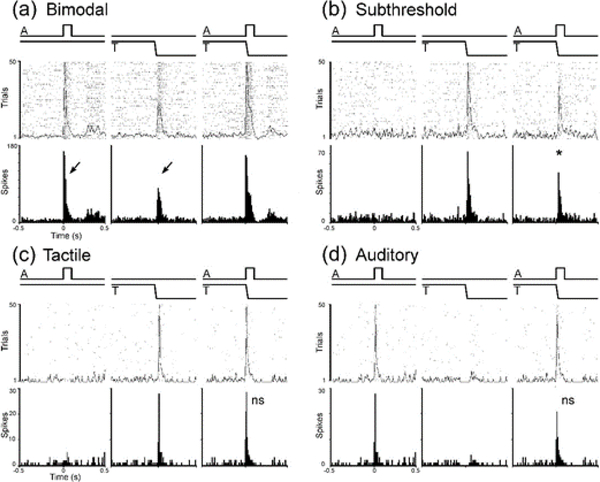
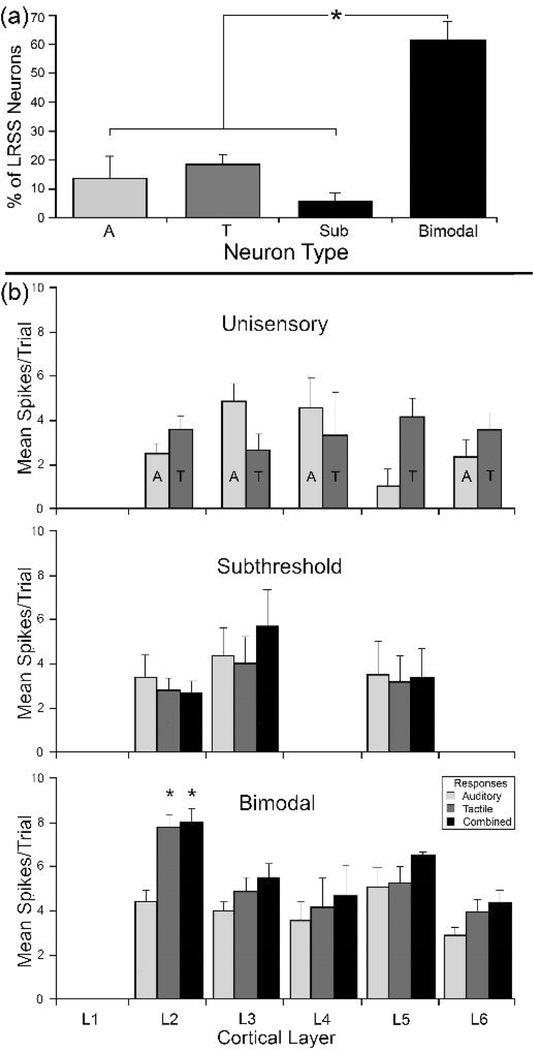
Single-unit recording in the LRSS identified a total of 422 neurons, of which 340 (81%) were responsive to sensory stimulation. All LRSS neurons were tested with standardized, computer-generated auditory, tactile and combined auditory-tactile stimulation. For individual neurons, responses to these sensory tests identified them as bimodal (n=213), subthreshold-multisensory (n=20), unisensory auditory (n=43), or unisensory tactile (n=64) types, for which examples are illustrated in Figure 5. The proportions of each sensory type of neuron encountered within the LRSS are graphed in Figure 6a, where it is evident that the bimodal type of multisensory neuron is significantly more prevalent (63%; Chi-square, p<0.0001) in the LRSS than the other neuronal types.
Figure 5.
Examples of sensory and multisensory responses of LRSS neurons: (a) bimodal (independently activated by auditory ‘A’ and by tactile ‘T’ stimulation: arrows); (b) subthreshold multisensory (activated by only one modality: tactile ‘T,’ not by auditory ‘A,’ but the response to ‘T’ was significantly influenced by combined ‘AT’ stimulation); (c) tactile (activated and influenced only by that modality); (d) auditory (activated and influenced only by that modality). The same conventions are used in each panel. Stimulus onset and duration is depicted by the waveforms at the top either presented alone or simultaneously. Beneath each stimulus or stimulus combination is a raster (1 dot=1 spike; 50 trials) overlaid by the spike-density function. At the bottom is a peristimulus-time histogram (time bin=10ms) summary of activity depicted in raster/spike-density, above. For each panel, stimuli are presented alone (auditory alone, somatosensory alone) or simultaneously (auditory and somatosensory combined). Asterisk=p<0.05, paired t-test; ns=not significant.
Figure 6.
(a) The proportion (percentage ± se) of the different sensory neuron types identified in the LRSS. Bimodal (AT) types were significantly (asterisk, p<0.0001; ANOVA) more prevalent than their subthreshold multisensory (Sub) or unisensory (A= auditory; T=tactile) counterparts. (b) The distribution of sensory and multisensory response activity by cortical layer. Within each LRSS layer (L1-L6), average activity (spikes/trial ± se) are shown for unisensory (top panel), subthreshold multisensory (middle) and bimodal multisensory neurons in response to auditory (light gray bars), tactile (dark gray) and combined auditory-tactile (black) stimulation. Sensory responses of unisensory neurons were comparatively low, while bimodal neurons generally showed the highest response rate. In addition, bimodal neurons in layer 2 showed significantly (“*”, p<0.01; ANOVA) higher response rates than did their counterparts in other laminae.
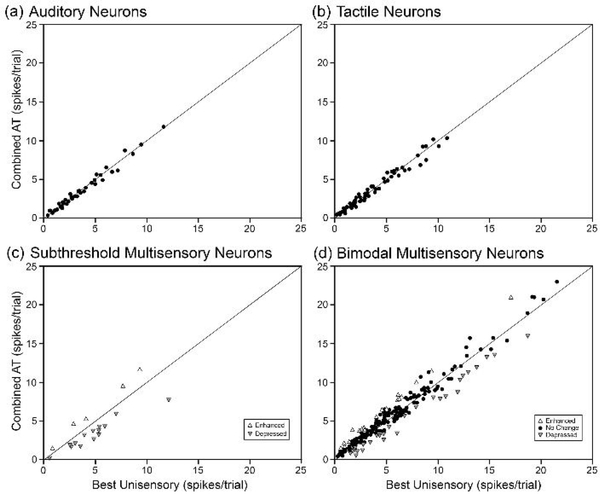
The spiking/discharge activity of the different types of sensory neurons is summarized in Figure 6b and listed in Table 3. Bimodal neurons generally showed the highest response rate of sensory responses (mean = 5.9 ± 0.3 s.e.), while average responses of unisensory neurons were comparatively low (A=3.54 ± 0.4; T=3.56 ± 0.3). As a group, bimodal neurons tended to respond more vigorously to tactile stimulation alone than other LRSS neurons (p<0.0048, Tukey-Kramer test), and also generated significantly higher (p<0.0001; ANOVA) responses to combined auditory-tactile stimulation than did unisensory auditory, unisensory tactile or subthreshold neurons (see Table 3). In addition, bimodal neurons in layer 2 showed significantly (p<0.01; ANOVA) higher response rates to combined stimuli (mean = 8.3 ± 0.7 s.e.) than did their bimodal counterparts in other laminae (mean= 5.2 ± 0.6; see Fig. 6 b-bottom). This functional distinction for bimodal neurons is also evident from the plots in Figure 7, which demonstrates that bimodal neurons exhibit a higher response range than their unisensory and subthreshold counterparts. Here, it is also apparent that the level of response change that results from combining the auditory and somatosensory stimuli exhibited a comparatively wide range in bimodal neurons (Figure 7d). In fact, combined-modality stimulation evoked response enhancement(enhancement mean= 40.6% ± 25.6 s.d.; n=21) in some bimodal neurons, response depression in other bimodal neurons (−30.4% ± 16.4; n=27) and no significant response change in most (avg. = 4.7% ± 14.5; n=163).
Table 3.
Discharge activity of LRSS neurons by neuron type (Unisensory auditory or tactile; Multisensory Subthreshold auditory or tactile; Multisensory Bimodal (Auditory + Tactile)). Values indicate average (standard error) response in units of spikes/second (Hz; spontaneous) or spikes/trial (stimulus A, T or AT). Asterisks indicate significant (p<0.05, Tukey-Kramer test) difference with values in same column.
| Neuron type | Number (%) | Spontaneous (Hz) | Response (A) | Response (T) | Response (AT) |
|---|---|---|---|---|---|
| Auditory | 43 (12.6) | 24.3 (20.3) | 3.5 (0.5) | 3.5 (0.6) | |
| Tactile | 64 (18.8) | 35.9 (36) | 3.5 (0.5) | 3.5 (0.5) | |
| Subthr Auditory | 4 (1.2) | 14.5 (11.6)* | 3.4 (1.6) | 3.9 (1.9) | |
| Subthr Tactile | 16 (4.8) | 44.6 (41.7) | 3.7 (0.9) | 3.9 (1.0) | |
| Bimodal Aud-Tact | 213 (62.6) | 31.2 (30.5) | 3.9 (0.2) | 5.2 (0.2)* | 5.9 (0.5)* |
| All sensory neurons | 340 (100) | 31.6 (1.7) | 3.6 (0.2) | 4.5 (0.2) | 5.1 (0.2) |
Figure 7.
For each type of sensory neuron (a) auditory, (b) tactile, (c) subthreshold multisensory, and (d) bimodal multisensory, each dot=1 neuron) these graphs plot the response to combined auditory-tactile stimulation (y-axis) against its response to its most effective unisensory stimululs. Note that unisensory auditory and unisensory tactile neurons show no significant change in response to combined stimulation and these responses plot close to the line of unity. In contrast, subthreshold multisensory neurons show significantly increased (enhanced; upward triangle) or decreased (depressed; downward triangle) responses to combined auditory-tactile stimulation and this activity plots away from the line of unity. For bimodal neurons, there is not only an increased level of overall response (e.g., units that plot > 12 spikes/response) over that observed for unisensory neurons, but some also exhibit significant levels of response integration (open symbols for enhancement, depression) while others do not (closed, black dots).
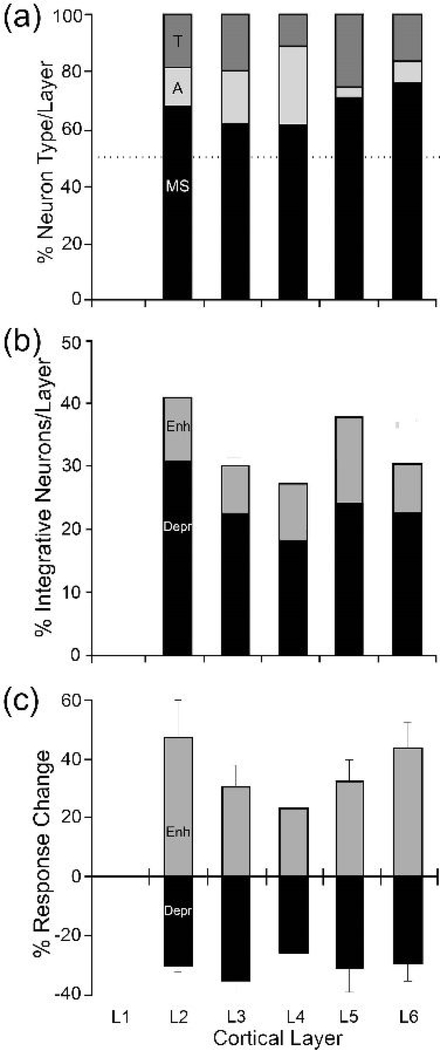
The distribution of neuron types across the laminae of the LRSS was analyzed from the histological reconstructions of the recording sites and the percentage of each neuron type by lamina was calculated. These results are shown in Figure 8a. Each layer was dominated by multisensory neurons, while a small but consistent proportion of unisensory (A, or T) neurons were also present. Therefore, the predominance of multisensory neurons within the LRSS area was preserved for each layer as well. Because few neurons were identified in Layer 1 and it could not be ruled out that such activity did not originate from subjacent Layer 2, those neurons that histologically plotted in Layer 1 were assigned to Layer 2 for analysis here. A given multisensory neuron can exhibit a range of responses when processing multiple sensory cues (Meredith and Stein, 1996; Perrault et al., 2005) and not every multisensory neuron exhibits multisensory integration. Figure 8b depicts the proportion of multisensory neurons that demonstrated multisensory integration (enhancement or depression) by lamina. Although proportionally more neurons demonstrated multisensory response depression than enhancement, these effects did not appear to vary by lamina. Furthermore, when the magnitude of multisensory integration was calculated by layer, as shown in Figure 8c, laminar distinctions likewise were not apparent.
Figure 8.
The laminar distribution of multisensory neurons and their integrative properties. (a) Multisensory neurons (MS, subthreshold and bimodal; black) predominated in all layers of the LRSS (dotted line indicates 50% of neuronal sample/layer) while proportionally fewer unisensory (T=tactile, dark grey; A=auditory, light grey) neurons occurred in each layer. (b) Multisensory neurons across all layers exhibited integrated responses to combined auditory-tactile stimulation, as well as a higher incidence of response depression (Depr) than response enhancement (Enh). (c) The average (± se) magnitude of response enhancement or response depression was fairly similar across all cortical layers.
3.3. Connectional properties: Cortical sources of input
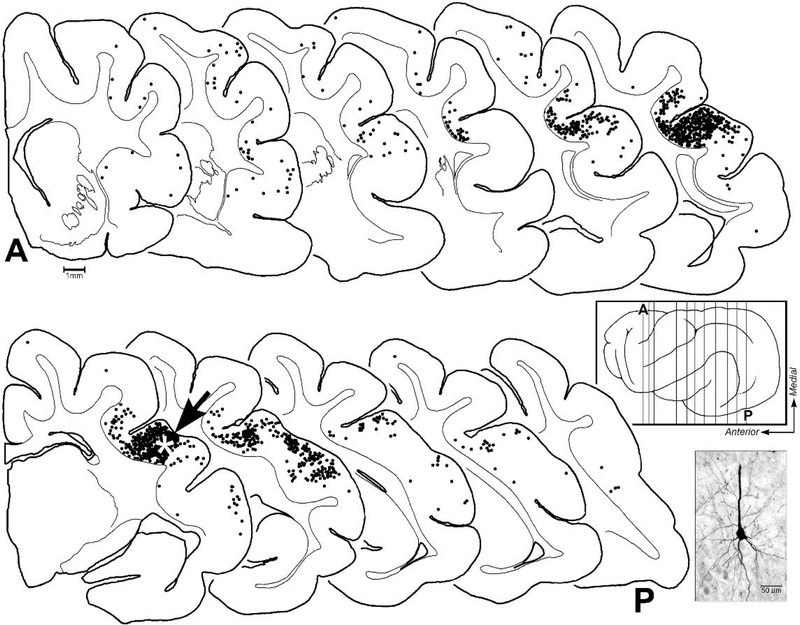
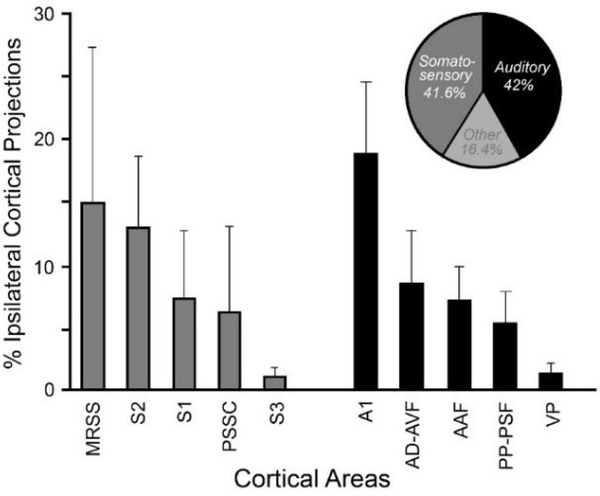
Given the dominance of auditory-tactile responsivity among neurons in the LRSS, it would be expected that cortical inputs to the LRSS would arise from loci that process either auditory or somatosensory information. This possibility was addressed by making neuroanatomical tracer injections (BDA; n=3 cases) into the LRSS and examining ipsilateral cortical areas for the presence of retrogradely labeled neurons. Neurons labeled from the LRSS injection were identified mostly within nearby parietal and temporal regions, as shown for the case illustrated in Figure 9. In this representative example, labeled neurons were consistently identified in the lateral bank of the suprasylvian sulcus anterior to the LRSS. Although this anterior region is unmapped in ferrets, preliminary data of this anterior region (Foxworthy and Meredith, 2011) suggests that somatosensory area S2 occupies this portion of the sulcal bank as well as the adjoining anterior ectosylvian gyrus (consistent with the location of S2 in cats: Burton and Kopf, 1984). Other cortical inputs to the LRSS are known to arise from the medial bank of the suprasylvian sulcus adjacent to the LRRS, which contains the somatosensory area MRSS (Keniston et al., 2009b). Lateral to the LRSS, labeled neurons were found on the anterior ectosylvian gyrus corresponding to the location of auditory fields AVF and ADF (Bizley et al., 2005), and the pseudosylvian sulcal cortex, where somatosensory (and visual) inputs have been reported (Ramsay and Meredith, 2004). At more posterior levels inputs to the LRSS arise from the middle ectosylvian gyrus where the auditory cortices of AAF, A1, PPF, PSF and VL are located, as well as some minor projections from within the banks of the suprasylvian sulcus corresponding to areas AMLS and PMLS. When these projection sources were sorted according to sensory modality, over 83% of cortical inputs to LRSS arose from ipsilateral areas that process somatosensory or auditory, signals as summarized in Figure 10. Here, the proportions of projections to the LRSS from the ipsilateral somatosensory and auditory cortical fields are quantified and summarized for 3 cases and indicate that the majority of somatosensory inputs arise from nearby cortical areas MRSS (15.1% of total ipsilateral projections) and S2 (13%), while auditory cortical inputs largely originate from A1 (18.9%) and the nearby auditory fields of AVF/ADF (8.7%). Furthermore, a cursory examination of thalamic projections to the region reaffirms the notion that LRSS is the recipient of convergence of multiple sensory projections that originate from the ipsilateral posterior nucleus, the ventrobasal complex, the lateral posterior nucleus, and the medial geniculate nucleus. These connectional results confirm that multiple somatosensory and auditory regions robustly converge on the LRSS, which is consistent with the sensory and multisensory activity exhibited by the region.
Figure 9.
These serially arranged coronal sections (‘A’ = anterior; ‘P’ = posterior) through the cortical hemisphere occur in approximately 1mm intervals (represented by vertical lines on cortex in boxed inset). On each section, each of the black dots represent a neuron retrogradely labeled from the LRSS injection site (indicated by white asterisk on section #7 at arrow). Labeled neurons were not found in coronal sections anterior or posterior to the series depicted. Most neurons projecting to the LRSS were identified in nearby parietal or temporal regions representing somatosensory or auditory processing regions. Not all labeled neurons are depicted due to overlap. The photomicrograph shows a typical retrogradely labeled cortical neuron with its tracer-filled soma and proximal dendrites.
Figure 10.
Bar graphs (mean ± se) of robust (each >1% of total) ipsilateral cortical projections to LRSS from somatosensory (grey bars) and auditory (black bars) cortices. As summarized in the pie chart, ~83% of projections to LRSS arose from ipsilateral somatosensory and auditory regions.
3.4. Connectional properties: Laminar pattern of input termination:
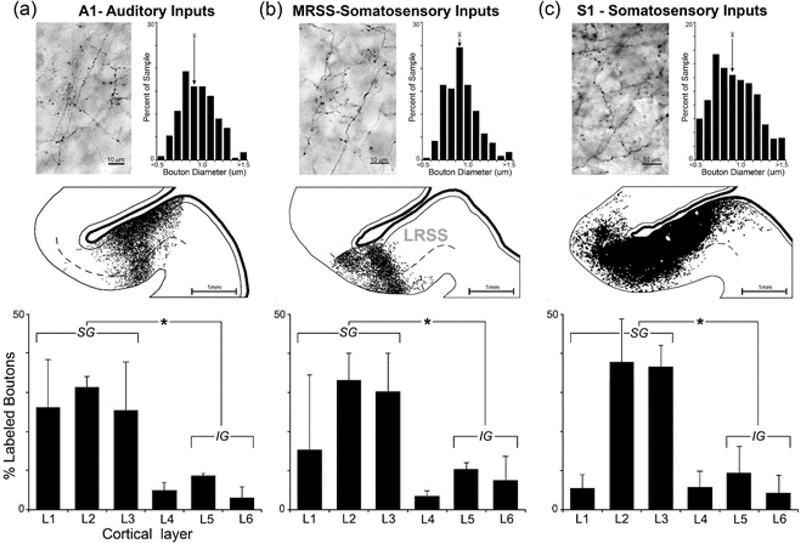
Once the cortical sources of afferent input to the LRSS were established, their terminal distribution of inputs within the LRSS was evaluated. To identify the pattern of termination of auditory inputs, BDA tracer injection was made into A1 (the auditory region with the largest proportion of projections to the LRSS) and the labeled axons and axon terminals in LRSS were examined. As shown in the representative example in Figure 11a, A1 projections to the LRSS terminated in a dense patch that, while spanning the entire cortical mantle (from layer 1 through layer 6), produced an expanded and denser distribution within the supragranular layers (L1–3). This supragranular bias was confirmed in each of 20 tissue sections (from 3 cases) through the LRSS that were quantitatively plotted. When summarized for the three A1 injection cases, the bar graphs (Fig. 11 a-bottom) indicate that this auditory projection to LRSS primarily (83% of boutons) targets the supragranular layers, and this distribution terminal label is significantly different from that observed for the infragranular layers (t-test; p<0.001). Boutons from A1 exhibited an average diameter of 0.94μm ± 0.2 and showed a unimodal size distribution that ranged 0.5–1.6μm , which is similar to that exhibited by cortical pyramidal neurons (Gabbot et al., 1987) and is likely to represent VGlut1-positive profiles consistent with corticocortical axon terminals (Hackett et al., 2011).
Figure 11.
Laminar pattern of afferent inputs to the LRSS. Panels show data for axon terminals (boutons) orthogradely labeled by tracer injection into (a) auditory cortex-A1; (b) the somatosensory MRSS (this area largely represents head and face; Keniston et al., 2009); and (c) somatosensory S1 (injection of forelimb representation). Each panel displays a photomicrograph of BDA-labeled axons and boutons within the LRSS, next to which is a bar graph illustrating the size and distribution of measured bouton diameters (arrow = average). At mid-panel, a coronal section through the LRSS depicts the distribution of labeled boutons (1 dot=1 bouton) with the grey-white border and Layer 1 (thin black lines) and Layer 4 (dashed line) depicted. The histograms at the bottom quantitatively show the laminar distribution of labeled boutons by plotting the proportion (mean ± sd) of labeled boutons by section (3–7 sections/case) by cortical layer (L1-L6). Asterisks indicate statistically significant (t-test; p<0.001) difference between bouton counts in supragranular (SG; layers 1–3) versus infragranular layers (IG, layers 5–6). For each afferent source, axon terminal distributions were heavily biased toward supragranular locations.
To evaluate the pattern of termination of somatosensory inputs to the LRSS, the MRSS was selected for tracer injection (BDA) because this region exhibits the largest proportion of cortical somatosensory projections to the LRSS. Tracer injection into MRSS produced a pattern of labeled boutons in LRSS, for which a representative example is depicted in Figure 11b. MRSS projections to the LRSS produced a narrow band of terminal labeling centered on the medial/deep aspects of the LRSS. Because the face is primarily represented within the MRSS (Keniston et al., 2009b), the termination of MRSS projections in the medial/deep aspects of the LRSS is consistent with the face representation within the overall LRSS somatotopic organization (see Fig. 4). Within this deep portion of the sulcal bank, boutons labeled from the MRSS were found across all laminae, as illustrated in Figure 11b. When quantified across the three MRSS injection cases (3–7 sections were plotted and measured per case), the bar graphs demonstrate that this MRSS projection primarily (75%) targets the supragranular layers of the LRSS, and these levels of terminal label are significantly greater than that observed for the infragranular layers (t-test, p<0.001). Boutons from MRSS showed an average diameter of 0.92μm (± 0.2; range = 0.5–1.7μm ) and demonstrated a unimodal size distribution.
To examine the pattern of termination of body (non-face) inputs to the LRSS, the forelimb representation of S1 was injected with tracer (BDA). Because S1 neurons projecting to LRSS represented only 7.3% of total ipsilateral cortical projections to the LRSS, and only the forelimb subregion of S1 was targeted for injection, a larger volume of tracer (2.1 μl ) was used than for the other afferent cortical areas. S1-forelimb projections to the LRSS, as illustrated in Figure 11c, largely filled the bank of the LRSS and occurred across all laminae. However, boutons labeled from S1 occurred more densely in the supragranular (Layers 1–3) than in the deeper, infragranular layers (Layers 5–6). When quantified across multiple (n=8) LRSS sections, as summarized in the bar graph (Fig. 11c, bottom), the average proportion of S1 axon terminals was consistently found to be higher in the supragranular (80%) than for the infragranular layers; these laminar differences were statistically significant (t-test, p<0.001). Boutons from S1 showed an average diameter of 0.92μm (± 0.3; range = 0.4–1.7μm ) and demonstrated a unimodal size distribution.
3.5. Dendritic Spine Properties
The relative homogeneity of laminar distribution of multisensory neurons (see Figure 8a) seems at odds with the distribution of external inputs that favor the supragranular layers. This apparent contradiction might be explained by laminar variability in the density of dendritic spines that would accommodate excitatory synaptic inputs known to terminate on dendritic spines (Stuart, 2006). Therefore, dendritic spine density of LRSS pyramidal neurons was examined from Golgi-Cox stained sections using light microscopy and Neurolucida. Overall, dendritic segments (n=170) neurons exhibited an average 0.98 (±0.02 se) spines/micron. However, average dendritic spine density was significantly (t-test; p<0.001) higher for supragranular (n=97; mean = 1.1 ± 0.02 se spines/micron) than for infragranular (n=70; mean = 0.83 ± 0.05 se spines/micron) neurons in the LRSS.
4.0. DISCUSSION
4.1. LRSS – a multisensory cortex
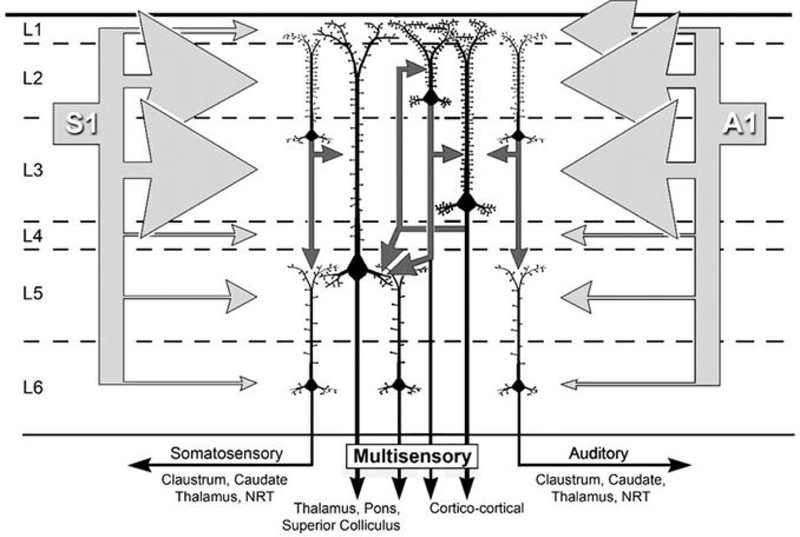
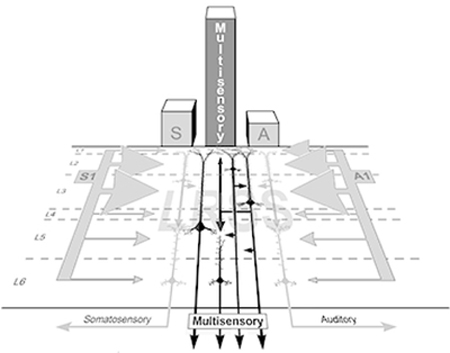
These results provide insight into the sensory and multisensory properties of the ferret LRSS cortex. Given the position of the LRSS external to parietal somatosensory areas and outside the core auditory areas, its cartographic location between those representations, and its capacity to process auditory as well as somatosensory signals, it seems that LRSS could be a homolog of the cat Posterior-Rostral Suprasylvian area (RSp; Clemo et al., 2007) and the primate Caudal-Medial area (CM; Foxe et al., 2000; 2002; Hackett et al., 2007) both of which have also been shown have multisensory auditory-somatosensory properties. The present results show that the LRSS is somatotopcially organized and receives extensive inputs from somatosensory cortical areas S1-S2 and MRSS. At the same time, over 80% of LRSS neurons were functionally influenced by auditory cues and the region receives substantial inputs from the auditory cortical areas of A1, ADF/AVF and AAF. Unisensory (auditory, somatosensory) and multisensory (subthreshold, bimodal) neuron types did not show laminar preferences within the LRSS, but modality-specific afferent inputs did. As summarized in Figure 12, ipsilateral projections from somatosensory and auditory cortices each preferentially targeted the supragranular layers of the LRSS, where increased dendritic spine density is observed, possibly to accommodate the increased synaptic input. Not only does the higher proportion of external multiple sensory inputs increase the probability of multisensory convergence in the recipient supragranular layers, but already-converged multisensory signals from other layer 2/3 neurons can contribute as well via their local circuit connections. As a likely consequence, multisensory signals from layer 2/3 neurons are relayed to infragranular neurons via translaminar connections, thereby distributing multisensory properties across the remainder of the cortical column. Finally, outputs from the LRSS carrying multisensory signals are likely to target other multisensory areas at cortical and subcortical levels. As also illustrated in Figure 12, this proposed local LRSS circuit can also accommodate the presence of unimodal neurons in a parallel processing arrangement that maintains distinct unisensory output targets. In summary, the LRSS receives >80% of its cortical inputs from sources representing more than one sensory modality (somatosensory or auditory), it exhibits a preponderance of multisensory neurons (68.5%; both bimodal and subthreshold types) that constitute the majority of neurons found in each cortical layer, and the response activity of these multisensory neurons dominates the functional output of the region. These observations justify the designation of the LRSS as a multisensory region.
Figure 12.
Summary of the laminar organization of connectivity and unisensory/multisensory features of the LRSS. The laminar distribution of converging extrinsic connections from unisensory areas SI (left) and A1 (right) are represented by the array of light gray arrows that are scaled in proportion to their laminar termination in LRSS. The preference for external inputs to target the supragranular layers (>80% of terminals) corresponds with the higher density of dendritic spines there, presumably to accommodate the high number of excitatory inputs. Intrinsic, translaminar connections from of layer 2/3 neurons (small, dark gray arrows) relay signals to layer 5/infragranular layer neurons where extrinsic inputs are comparatively sparse. Given that unisensory and multisensory neurons are found in both the supra- and infragranular layers, and that the general output targets of cortex are identified as unisensory (black arrows labeled as somatosensory, auditory) or multisensory, suggests that unisensory and multisensory signals are processed in parallel as they course through the LRSS circuit. Dashed lines indicate laminar boundaries. S1=primary somatosensory cortex, A1=primary auditory cortex. Light gray arrows, extrinsic inputs; dark gray arrows, intrinsic connections, black arrows, outputs.
4.2. Comparisons with other regions that exhibit multisensory features
The present results demonstrate that the ferret LRSS is a multisensory cortical region in which a majority (68.5 %) of neurons exhibit multisensory properties. This proportion of multisensory neurons is consistent with findings from other studies using similar methods to study other higher-order sensory cortical areas, such as PPr (64%; Foxworthy et al., 2013a, b), VIP (86%; Avillac et al., 2007), SIV (66%; Dehner et al., 2014) and FAES (60%; Meredith and Allman, 2009) as listed in Table 4.
Table 4.
A literature survey of the relationship of an area’s cortical level/hierarchy (high, intermediate, or low/primary) to the proportion (%) of multisensory neurons (bimodal, subthreshold) identified for that area. In general, higher cortical areas exhibit higher proportions of multisensory neurons.
| Cortical area | Animal | Hierarchy | Multisensory Total | Bimodal | Subthreshold | Reference |
|---|---|---|---|---|---|---|
| Lateral rostral supra-sylvian sulcal area (LRSS) | Ferret | High | 68% | 63% | 5% | Present Study |
| Rostral Posterior Parietal area (PPr) | Ferret | High | 64% | 50% | 14% | Foxworthy et al., 2013a |
| Caudal Posterior Parietal area (PPc) | Ferret | High | 11% | 0% | 11% | Foxworthy et al., 2013a |
| Ventral Intraparietal Cortex (VIP) | Monkey | High | 86% | 58% | 28% | Avillac et al., 2007 |
| Superior Temporal Sulcal cortex (STS) | Monkey | High | 51% | 37% | 14% | Barraclough et al., 2005 |
| Fourth Somatosensory Area (SIV) | Cat | High | 66% | 1% | 66% | Dehner et al., 2004 |
| Auditory Field of Anterior Ectosylvian Sulcus (FAES) | Cat | High | 60% | 24% | 36% | Meredith & Allman, 2009 |
| Anterior Ectosylvian Sulcal cortex (AES) | Cat | High | 30% | 30% | ND | Wallace et al., 2006 |
| Multisensory Zone of V2L (MZ-V2L) | Rat | High | 37% | 20% | 17% | Schormans et al., 2017; 2019 |
| Rostral Suprasylvian Sulcal area (RSSc) | Cat | Intermed. | 24% | ND | 24% | Clemo et al., 2007 |
| Medial Rostral Suprasylvian Sulcal area (MRSS) | Ferret | Intermed. | 29% | 13% | 16% | Keniston et al., 2009b |
| Posterior Lateral Lateral Suprasylvian visual area (PLLS) | Cat | Intermed. | 25% | 9% | 16% | Allman & Meredith, 2007 |
| Lateral Visual Zone (V2L) | Rat | Intermed. | 13% | 0% | 13% | Schormans et al., 2017; 2019 |
| Dorsal Auditory cortex (AuD) | Rat | Intermed. | 24% | 5% | 19% | Schormans et al., 2017; 2019 |
| Third Somatosensory Area (S3) | Ferret | Intermed. | 9% | 0% | 9% | Foxworthy et al., 2013a |
| Dorsal Zone of Auditory Cortex (DZ) | Cat | Intermed. | 49% | 34% | 15% | Kok et al., 2016 |
| Anterior Ventral Auditory Field (AVF) | Ferret | Intermed/High? | 39% | 26% | 13% | Bizley et al., 2007 |
| Anterior Dorsal Auditory Field (ADF) | Ferret | Intermed | 31% | 18% | 13% | Bizley et al.,2007 |
| Posterior Pseudosylvian Auditory Field (PPF) | Ferret | Intermed. | 29% | 9% | 20% | Bizley et al.,2007 |
| Posterior Suprasylvian Auditory Field (PSF) | Ferret | Intermed. | 20% | 4% | 16% | Bizley et al.,2007 |
| Anterior Auditory Field (AAF) | Ferret | Primary | 11% | 5% | 6% | Bizley et al.,2007 |
| Primary Auditory Cortex (A1) | Ferret | Primary | 13% | 3% | 10% | Bizley et al.,2007 |
| Primary Auditory Cortex (A1) | Ferret | Primary | 34% | 16% | 18% | Meredith & Allman, 2015 |
| Primary Auditory Cortex (A1) | Monkey | Primary | 12% | 0% | 12% | Kayser et al., 2008 |
Using the present LRSS data and the literature review in Table 4, comparison to other cortical regions reveals specific, shared multisensory features among regions. First is that none of the examined cortical areas contain anywhere close to 100% multisensory neurons. Instead, at least a minority (e.g., 25–40%) of unisensory neurons are consistently present. This seems counter-intuitive, since it might be expected that extensive local-circuit connectivity would distribute multisensory properties throughout a region. However, an alternative hypothesis has been proposed (Foxworthy et al., 2013a) whereby parallel processing of unisensory and multisensory information maintains the separation of those distinct signals as they pass through a cortical area. This notion is further supported by the presence of unisensory processing in some of the output targets of multisensory cortex, such as the claustrum (Remedios et al., 2010) and reticular thalamic nucleus (FitzGibbon, 2000; Jones, 2007; Zikopoulos and Barbas, 2007). Thus, multisensory regions also transmit unisensory signals, although the behavioral or network benefit of this arrangement remains to be assessed.
Second, in those cortical regions in which multisensory neurons predominate, the spiking output that is generated is dominated by the responses of multisensory neurons. This is demonstrated by the following example. When the average response for each type of neuron is multiplied by its proportion (percent of sample), a hypothetical total number of spikes evoked by a particular stimulus can be calculated. Thus, in the LRSS, when combined auditory-tactile stimulation occurred, a total of 502 spikes/trial resulted from the entire sample. Of that total, multisensory neurons (68.5% of the sample) contributed 396.6 spikes/trial, or 78.2% of the total number of spikes. In this arrangement, multisensory neurons not only dominated the proportion of neurons in the LRSS, their collective responses contributed to an even larger proportion of the output activity. An almost identical effect is seen for the multisensory PPr area, where 78% of total hypothetical spiking is derived from its constituent multisensory neurons (64%; Foxworthy et al., 2013a, b). Thus, given the proportion and activity generated by multisensory neurons, the net activity of these areas in response to a multisensory stimulus is overwhelmingly multisensory. Therefore, for regions where multisensory neurons predominate and the output signal they generate is dominated by multisensory responses, it seems appropriate to be designated as multisensory.
Third, although the proportion of multisensory neurons is inconsistent among cortical areas it seems to exhibit a general hierarchical trend. As can be seen from Table 4, higher-order cortical areas tend to exhibit the highest proportions of multisensory neurons (the cited studies of higher cortical areas averaged 53% multisensory neurons; range 55–80%) while lower, primary areas exhibit the lowest (averaged 18% multisensory neurons; range 11–34%). Collectively, these observations support the notion that multisensory processing occurs broadly across the cortex (see Ghazanfar and Schroeder, 2006) albeit in very different proportions. This raises the clear possibility that an area can exhibit some multisensory features without being categorized as multisensory (see Wang et al., 2008). In fact, such a situation is already described for core auditory fields AAF/A1 (Meredith and Allman, 2015), where multisensory spiking output was observed, but it was so low that it was less than the spontaneous activity level of the constituent unimodal auditory neurons. Further analyses of multisensory population function are needed, especially in lower-level cortical areas, to assess the proportional contribution of multisensory processing at those levels.
Finally, there appears to be a similarity in the pattern of sensory inputs to multisensory cortical areas that is reflected by a common connectional arrangement. For example, as shown in Figure 11, cortical projections arising from primary sensory areas (in this case S1 and A1) preferentially terminate in the supragranular layers of the LRSS. Based on the hierarchy of the coritical regions involved, these inputs passing from lower-level (primary) areas to higher-level cortex, by definition, constitute a feedforward projection. However, instead of predominantly terminating in layer 4 (as predicted by the Felleman and van Essen model (1991)), each of the afferent projections distribute predominantly to the supragranluar layers 1–3. The terminal pattern of cortical, modality-specific input projections to the LRSS are similar to those demonstrated for multisensory cortical area PPr, where inputs from somatosensory area SIII and from visual area PPc preferentially converge in the supragranular layers (Foxworthy et al., 2013a). Furthermore, that supragranular layers are the preferred targets of input connections is consistent with crossmodal projection patterns for numerous other higher-order cortices that are biased toward the supragranuar layers (RLs: Clemo et al., 2007; PLLS: Clemo et al., 2008; FAES: Clemo et al., 2016). Collectively, these observations suggest that crossmodal feedforward projections to multisensory cortices exhibit a distinct laminar pattern.
4.3. A Terminology for Multisensory Areas
Almost since the publication of the earliest multisensory reports (e.g., Horn and Hill, 1965), there have been inconsistencies and semantic confusion about how to describe and define the phenomenon (Stein et al., 2010). Some of the multisensory literature uses the terms “multisensory convergence” and “multisensory integration” interchangeably, or describes any form of “multisensory processing” as “multisensory integration.” Even though those pairs of terms have specific meanings and are not synonymous, they seemed to represent similar, operational concepts that just became part of the vernacular. More recently, the term “multisensory” is being frequently applied to entire regions in which multisensory effects are only sparsely represented. That assumption, although novel and attention-grabbing, has not been challenged. Specifically: is the presence of a multisensory effect sufficient to render an entire region multisensory? Several considerations argue against this broad assumption. So far, studies of multisensory processing have always identified a contingent of unisensory neurons within the same region (see Table 4 for review), so the presence of even large proportions of multisensory neurons in an area is insufficient convert the entire population to being multisensory. Also, consider the possibility of a region that receives some cross-modal inputs (e.g, as detected by LFP) but it fails to demonstrate multisensory effects in its spiking output. Should such a region that exhibits no demonstrable multisensory output be regarded as the descriptive equivalent of those that do, and how is this informative? A similar quandary was examined (and resolved) in an experiment using behaving monkeys where single-unit responses in primary visual cortex were recorded. This study found that V1 units were unaffected by acoustic stimulation, except that their response latency was reduced when a saccade was made to a visual target accompanied by a concurrent auditory stimulus (Wang et al, 2008). This was a clear example of how non-visual cues can influence visual processing in primary visual cortex in a non-human primate. Here, the authors concluded, in the context of all the other processing features of V1, that “…multisensory integration should be added to the list of cognitive processes performed in V1 (Wang et al., 2008).” This conclusion, based on functional context and performance is both accurate and informative, and does not conflate the identified multisensory feature in V1 with that of areas with more extensive multisensory involvements. In fact, at the other end of the multisensory spectrum (where multisensory involvements are extensive) are regions like those identified in the present study. Here, the ferret LRSS contains a majority of neurons that are multisensory, which constitute the majority of neurons across all cortical laminae and their multisensory output activity is predominant. These proportionally dominant multisensory features closely resemble those of numerous higher-order multisensory areas (see Table 4). Ultimately, from these collected observations it is clear that the assumption of “one multisensory term fits all” is not appropriate. Instead, these studies indicate that there is a wide range of expression of multisensory features across cortex that deserves a nomenclature that is sensitive to these measurable and important distinctions. Accordingly, until data to the contrary becomes apparent, it is appropriate and informative to designate a “multisensory area” as one in which multisensory features are predominant.
ACKNOWLEDGEMENTS:
A special thanks to Dr. J.N. Campbell for assistance with dendritic spine analysis. This work was supported by the National Institutes of Health (NS064675 and NS039460 to M.A.M.).
Footnotes
CONFLICT OF INTEREST:
The authors report no conflicts of interest. The authors alone are responsible for the content and writing of this paper.
DATA AVAILABILITY:
Data contained in this report is archived with and available from the corresponding author.
5.0 REFERENCES
- Allman BL, Keniston LP, & Meredith MA (2009). Not just for bimodal neurons anymore: the contribution of unimodal neurons to cortical multisensory processing. Brain Topography, 21, 157–167. DOI: 10.1007/s10548-009-0088-3. [DOI] [PMC free article] [PubMed] [Google Scholar]
- Allman BL, & Meredith MA (2007). Multisensory processing in “unimodal” neurons: cross-modal subthreshold auditory effects in cat extrastriate visual cortex. Journal of Neurophysiology, 98, 545–549. DOI: 10.1152/jn.00173.2007. [DOI] [PubMed] [Google Scholar]
- Avillac M, Ben Hamed S, & Duhamel JR (2007). Multisensory integration in the ventral intraparietal area of the macaque monkey. The Journal of Neuroscience, 27, 1922–1932. . DOI: 10.1523/JNEUROSCI.2646-06.2007. [DOI] [PMC free article] [PubMed] [Google Scholar]
- Barraclough NE, Xiao D, Baker CI, Oram MW, & Perrett DI (2005). Integration of visual and auditory information by superior temporal sulcus neurons responsive to the sight of actions. Journal of Cognitive Neuroscience, 17, 377–391. DOI: 10.1162/0898929053279586. [DOI] [PubMed] [Google Scholar]
- Bell AH, Meredith MA, Van Opstal AJ, & Munoz DP (2005). Crossmodal integration in the primate superior colliculus underlying the preparation and initiation of saccadic eye movements. Journal of Neurophysiology, 93, 3659–3673. DOI: 10.1152/jn.01214.2004. [DOI] [PubMed] [Google Scholar]
- Bizley JK, Nodal FR, Bajo VM, Nelken I, & King AJ (2007). Physiological and anatomical evidence for multisensory interactions in auditory cortex. Cerebral Cortex, 17, 2172–2189. DOI: 10.1093/cercor/bhl128. [DOI] [PMC free article] [PubMed] [Google Scholar]
- Bizley JK, Nodal FR, Nelken I, & King AJ (2005). Functional organization of ferret auditory cortex. Cerebral Cortex, 15, 1637–53. DOI: 10.1093/cercor/bhi042. [DOI] [PubMed] [Google Scholar]
- Breveglieri R, Galletti C, Monaco S, & Fattori P. (2008) Visual, somatosensory and bimodal activities in the macaque Parietal area PEc. Cerebral Cortex, 18, 806–816. DOI: 10.1093/cercor/bhm127. [DOI] [PubMed] [Google Scholar]
- Briggs F, & Callaway EM (2005). Laminar patterns of local excitatory input to layer 5 neurons in macaque primary visual cortex. Cerebral Cortex, 15, 479–88. DOI: 10.1093/cercor/bhh154. [DOI] [PMC free article] [PubMed] [Google Scholar]
- Burton H, & Kopf EM (1984). Ipsilateral cortical connections from the second and fourth somatic sensory areas in the cat. The Journal of Comparative Neurology, 225, 527–53. DOI: 10.1002/cne.902250405. [DOI] [PubMed] [Google Scholar]
- Clemo HR, Allman BL, Donlan MA, & Meredith MA 2007. Sensory and multisensory representations within the cat rostral suprasylvian cortex. The Journal of Comparative Neurology, 503, 110–127. DOI: 10.1002/cne.21378. [DOI] [PubMed] [Google Scholar]
- Clemo HR, Lomber SG, & Meredith MA (2016). Synaptic Basis for Cross-modal Plasticity: Enhanced Supragranular Dendritic Spine Density in Anterior Ectosylvian Auditory Cortex of the Early Deaf Cat. Cerebral Cortex, 26, 1365–76. DOI: 10.1093/cercor/bhu225. [DOI] [PMC free article] [PubMed] [Google Scholar]
- Clemo HR, Lomber SG, & Meredith MA (2017). Synaptic distribution and plasticity in primary auditory cortex (A1) exhibits laminar and cell-specific changes in the deaf. Hearing Research, 353, 122134. DOI: 10.1016/j.heares.2017.06.009. [DOI] [PubMed] [Google Scholar]
- Clemo HR, & Meredith MA (2012). Dendritic spine density in multisensory versus primary sensory cortex. Synapse, 66, 714–24. DOI: 10.1002/syn.21560. [DOI] [PubMed] [Google Scholar]
- Clemo HR, Sharma GK, Allman BL, & Meredith MA (2008). Auditory projections to extrastriate visual cortex: connectional basis for multisensory processing in ‘unimodal’ visual neurons. Experimental Brain Research, 191, 37–47. DOI: 10.1007/s00221-008-1493-7. [DOI] [PMC free article] [PubMed] [Google Scholar]
- Dehner LR, Keniston LP, Clemo HR, & Meredith MA (2004). Cross-modal circuitry between auditory and somatosensory areas of the cat anterior ectosylvian sulcal cortex: a ‘new’ inhibitory form of multisensory convergence. Cerebral Cortex, 14, 387–403. DOI: 10.1093/cercor/bhg135. [DOI] [PubMed] [Google Scholar]
- Duhamel JR, Colby CL, & Goldberg ME (1998). Ventral intraparietal area of the macaque: congruent visual and somatic response properties. Journal of Neurophysiology, 79, 126–136. DOI: 10.1152/jn.1998.79.1.126. [DOI] [PubMed] [Google Scholar]
- Felleman DJ, & Van Essen DC (1991). Distributed hierarchical processing in the primate cerebral cortex. Cerebral Cortex, 1, 1–47. [DOI] [PubMed] [Google Scholar]
- FitzGibbon T. (2000). Cortical projections from the suprasylvian gyrus to the reticular thalamic nucleus in the cat. Neuroscience, 97, 643–655. [DOI] [PubMed] [Google Scholar]
- Fondberg R, Lundström JN, Blöchl M, Olsson MJ, & Seubert J. (2018). Multisensory flavor perception: The relationship between congruency, pleasantness, and odor referral to the mouth. Appetite, 125, 244–252. DOI: 10.1016/j.appet.2018.02.012. [DOI] [PubMed] [Google Scholar]
- Foxworthy WA, Clemo HR, & Meredith MA (2013a). Laminar and Connectional Organization of a Multisensory Cortex. The Journal of Comparative Neurology, 521, 1867–1890. DOI: 10.1002/cne.23264. [DOI] [PMC free article] [PubMed] [Google Scholar]
- Foxworthy WA, Keniston LP, Allman BL, & Meredith MA (2013b). Multisensory and unisensory neurons in ferret parietal cortex exhibit distinct functional properties. The European Journal of Neuroscience, 37, 910–923. DOI: 10.1111/ejn.12085. [DOI] [PMC free article] [PubMed] [Google Scholar]
- Foxworthy WA, & Meredith MA (2011). An examination of somatosensory area SIII in ferret cortex. Somatosensory and Motor Research, 28, 1–10. DOI: 10.3109/08990220.2010.548465. [DOI] [PMC free article] [PubMed] [Google Scholar]
- Gabbott PL, Martin KA, & Witteridge D. (1987). Connections between pyramidal neurons in layer 5 of cat visual cortex (area 17). The Journal of Comparative Neurology, 259, 364–381. DOI: 10.1002/cne.902590305. [DOI] [PubMed] [Google Scholar]
- Ghazanfar AA, & Schroeder CE (2006). Is neocortex essentially multisensory? Trends in Cognitive Sciences, 10, 278–85. DOI: 10.1016/j.tics.2006.04.008. [DOI] [PubMed] [Google Scholar]
- Hackett TA, Smiley JF, Ulbert I, Karmos G, Lakatos P, de la Mothe LA, & Schroeder CE (2007). Sources of somatosensory input to the caudal belt areas of auditory cortex. Perception, 36, 1419–30. [DOI] [PubMed] [Google Scholar]
- Hackett TA, Takahata T, & Balaram P. (2011). VGlut1 and VGlut2 mRNA expression in the primate auditory system. Hearing Research, 274, 129–141. DOI: 10.1016/j.heares.2010.11.001. [DOI] [PMC free article] [PubMed] [Google Scholar]
- Homman-Ludiye J, Manger PR, & Bourne JA (2010). Immunohistochemical parcellation of the ferret (Mustela putorius) visual cortex reveals substantial homology with the cat (Felis catus). The Journal of Comparative Neurology, 518, 4439–4462. DOI: 10.1002/cne.22465. [DOI] [PubMed] [Google Scholar]
- Hooks BM, Hires SA, Zhang YX, Huber D, Petreanu L, Svoboda K, & Shepherd GM (2011). Laminar analysis of excitatory local circuits in vibrissal motor and sensory cortical areas. Public Library of Science Biology, 9:e1000572. DOI: 10.1371/journal.pbio.1000572. [DOI] [PMC free article] [PubMed] [Google Scholar]
- Horn G, & Hill RM (1966). Responsiveness to sensory stimulation of units in the superior colliculus and subjacent tectotegmental regions of the rabbit. Experimental Neurology, 14, 199–223. [DOI] [PubMed] [Google Scholar]
- Innocenti GM, Manger PR, Masiello I, Colin I, & Tettoni L. (2002). Architecture and callosal connections of visual areas 17, 18, 19 and 21 in the ferret (Mustela putorius). Cerebral Cortex, 12, 411–422. DOI: 10.1093/cercor/12.4.411. [DOI] [PubMed] [Google Scholar]
- Jones EG (2007). The Ventral Nuclei. The Thalamus. Cambridge: Cambridge University Press; p 705–874. [Google Scholar]
- Kayser C, Petkov CI, & Logothetis NK (2008). Visual modulation of neurons in auditory cortex. Cerebral Cortex, 18, 1560–1574. DOI: 10.1093/cercor/bhm187. [DOI] [PubMed] [Google Scholar]
- Kayser C, Petkov CI, & Logothetis NK (2009). Multisensory interactions in primate auditory cortex: fMRI and electrophysiology. Hearing Research, 258, 80–88. DOI: 10.1016/j.heares.2009.02.011. [DOI] [PubMed] [Google Scholar]
- Keniston LP, Allman BL, & Meredith MA (2008). Multisensory character of the lateral bank of the rostral suprasylvian sulcus in ferret. Society for Neuroscience Abstracts, 38, 457.10. [Google Scholar]
- Keniston LP, Allman BL, & Meredith MA (2009a) The effect of temporal stimulus asynchrony on bimodal multisensory processing the lateral rostral suprasylvian sulcus (LRSS) of the ferret. Society for Neuroscience Abstracts, 39, 847.7. [Google Scholar]
- Keniston LP, Allman BL, Meredith MA, & Clemo HR (2009b). Somatosensory and multisensory properties of the medial bank of the ferret rostral suprasylvian sulcus. Experimental Brain Research, 196, 239–251. DOI: 10.1007/s00221-009-1843-0. [DOI] [PMC free article] [PubMed] [Google Scholar]
- Kok M, Carrasco A, Meredith MA, & Lomber SG (2016) Multisensory electrophysiology reveals overt and subthreshold non-auditory influences on dorsal auditory cortex. Canadian Association for Neuroscience Abstracts, #2-D-99; 10, 158. [Google Scholar]
- Leclerc SS, Rice FL, Dykes RW, Pourmoghadam K, & Gomez CM (1993). Electrophysiological examination of the representation of the face in the suprasylvian gyrus of the ferret: a correlative study with cytoarchitecture. Somatosensory and Motor Research, 10, 133–159. PMID: 8392240. [DOI] [PubMed] [Google Scholar]
- Lippert MT, Takagaki K, Kayser C, & Ohl FW (2013). Somatosensory responses in a region of the rat parietal cortex. Public Library of Science One, 8(5): e63631. doi: 10.1371/journal.pone.0063631 DOI: 10.1371/journal.pone.0063631. [DOI] [PMC free article] [PubMed] [Google Scholar]
- Manger PR, Engler G, Moll CK, & Engel AK (2008). Location, architecture, and retinotopy of the anteromedial lateral suprasylvian visual area (AMLS) of the ferret (Mustela putorius). Visual Neuroscience, 25, 27–37. DOI: 10.1017/S0952523808080036. [DOI] [PubMed] [Google Scholar]
- Manger PR, Masiello I, & Innocenti GM (2002). Areal organization of the posterior parietal cortex of the ferret (Mustela putorius). Cerebral Cortex, 12, 1280–1297. DOI: 10.1093/cercor/12.12.1280. [DOI] [PubMed] [Google Scholar]
- Manger PR, Nakamura H, Valentiniene S, & Innocenti GM (2004). Visual areas in the lateral temporal cortex of the ferret (Mustela putorius). Cerebral Cortex, 14, 676–689. DOI: 10.1093/cercor/bhh028. [DOI] [PubMed] [Google Scholar]
- McLaughlin DF, Sonty RV, & Juliano SL (1998). Organization of the forepaw representation in ferret somatosensory cortex. Somatosensory and Motor Research, 15, 253–268. PMID: 9875544. [DOI] [PubMed] [Google Scholar]
- Meredith MA, & Allman BL (2009). Subthreshold multisensory processing in cat auditory cortex. NeuroReport, 20, 126–131. DOI: 10.1097/WNR.0b013e32831d7bb6. [DOI] [PMC free article] [PubMed] [Google Scholar]
- Meredith MA, & Allman BL (2015). Single-unit analysis of somatosensory processing in core auditory cortex of hearing ferrets. The European Journal of Neuroscience, 41, 686–698. DOI: 10.1111/ejn.12828. [DOI] [PMC free article] [PubMed] [Google Scholar]
- Meredith MA, Allman BL, Keniston LP, & Clemo HR (2011). Are bimodal neurons the same throughout the brain? In: Murray MM, & Wallace MT, editors. The Neural Bases of Multisensory Processes. Boca Raton, FL: CRC Press; p 51–64. [Google Scholar]
- Meredith MA, Keniston LR, Dehner LR, & Clemo HR (2006). Crossmodal projections from somatosensory area SIV to the auditory field of the anterior ectosylvian sulcus (FAES) in Cat: further evidence for subthreshold forms of multisensory processing. Experimental Brain Research, 172, 472–484. DOI: 10.1007/s00221-006-0356-3. [DOI] [PubMed] [Google Scholar]
- Meredith MA, & Stein BE (1983). Interactions among converging sensory inputs in the superior colliculus. Science, 221, 389–391. DOI: 10.1126/science.6867718 [DOI] [PubMed] [Google Scholar]
- Meredith MA, & Stein BE (1986). Visual, auditory, and somatosensory convergence on cells in superior colliculus results in multisensory integration. Journal of Neurophysiology, 56, 640–662. DOI: 10.1152/jn.1986.56.3.640. [DOI] [PubMed] [Google Scholar]
- Meredith MA, & Stein BE (1996). Spatial determinants of multisensory integration in cat superior colliculus neurons, Journal of Neurophsyiology, 75, 1843–1857. DOI: 10.1152/jn.1996.75.5.1843. [DOI] [PubMed] [Google Scholar]
- Meredith MA, Wallace MT, & Clemo HR (2018). Review: Do the Different Sensory Areas within the Cat Anterior Ectosylvian Sulcal Cortex Collectively Represent a Network Multisensory Hub? Multisensory Research, 31, 793–823. DOI: 10.1163/22134808-20181316. [DOI] [PMC free article] [PubMed] [Google Scholar]
- Perrault TJ Jr., Vaughan JW, Stein BE, & Wallace MT (2005). Superior colliculus neurons use distinct operational modes in the integration of multisensory stimuli. Journal of Neurophysiology, 93:2575–2586. DOI: 10.1152/jn.00926.2004. [DOI] [PubMed] [Google Scholar]
- Ramsay AM, & Meredith MA (2004). Multiple sensory afferents to ferret pseudosylvian sulcal cortex. NeuroReport, 15, 461–465. PMID: 15094504. [DOI] [PubMed] [Google Scholar]
- Remedios R, Logothetis NK, & Kayser C. (2010). Unimodal responses prevail within the multisensory claustrum. The Journal of Neuroscience, 30, 12902–12907. DOI: 10.1523/JNEUROSCI.2937-10.2010. [DOI] [PMC free article] [PubMed] [Google Scholar]
- Rice FL, Gomez CM, Leclerc SS, Dykes RW, Moon JS, & Pourmoghadam K. (1993). Cytoarchitecture of the ferret suprasylvian gyrus correlated with areas containing multiunit responses elicited by stimulation of the face. Somatosensory and Motor Research, 10, 161–188. PMID: 8392241. [DOI] [PubMed] [Google Scholar]
- Risher WC, Ustunkaya T, Singh Alvarado J, Eroglu C. (2014). Rapid Golgi analysis method for efficient and unbiased classification of dendritic spines. Public Library of Science One, 9:e107591. DOI: 10.1371/journal.pone.0107591. [DOI] [PMC free article] [PubMed] [Google Scholar]
- Schlack A, Sterbing-D’Angelo SJ, Hartung K, Hoffmann KP, & Bremmer F. (2005). Multisensory space representations in the macaque ventral intraparietal area. The Journal of Neuroscience, 25, 4616–4625. DOI: 10.1523/JNEUROSCI.0455-05.2005. [DOI] [PMC free article] [PubMed] [Google Scholar]
- Schormans AL, Typlt M, & Allman BL (2017). Crossmodal plasticity in auditory, visual and multisensory cortical areas following noise-induced hearing loss in adulthood. Hearing Research, 2017, 343:92–107. DOI: 10.1016/J.HEARES.2016.06.017. [DOI] [PubMed] [Google Scholar]
- Schormans AL, Typlt M, & Allman BL (2019). Adult-Onset hearing impairment induces layer-specific cortical reorganization: Evidence of crossmodal plasticity and central gain enhancement. Cerebral Cortex, 29, 1875–1888 DOI: 10.1093/CERCOR/BHY067. [DOI] [PMC free article] [PubMed] [Google Scholar]
- Schroeder CE, & Foxe JJ (2002). The timing and laminar profile of converging inputs to multisensory areas of the macaque neocortex. Cognitive Brain Research, 14, 187–198. PMID: 12063142. [DOI] [PubMed] [Google Scholar]
- Stein BE, Burr D, Constantinidis C, Laurienti PJ, Meredith MA, Perrault TJ, Ramachandran R, Roder B, Rowland BA, Sathian K, Schroeder CE, Shams L, Stanford TR, Wallace MT, Yu L, & Lewkowicz DJ (2010) Semantic confusion regarding the development of multisensory integration: A practical solution. European Brain Research, 31, 1713–1720. doi: 10.1111/j.1460-9568.2010.07206.x. [DOI] [PMC free article] [PubMed] [Google Scholar]
- Stein BE, & Meredith MA (1993). The merging of the senses. Cambridge, Mass: MIT Press. [Google Scholar]
- Sternberger LA, & Sternberger NH (1983). Monoclonal antibodies distinguish phosphorylated and nonphosphorylated forms of neurofilaments in situ. Proceedings of the National Academy of Sciences USA, 80, 6126–6130, DOI: 10.1073/pnas.80.19.6126 [DOI] [PMC free article] [PubMed] [Google Scholar]
- Stevenson RA, Ghose D, Fister JK, Sarko DK, Altieri NA, Nidiffer AR, Kurela LR, Siemann JK, James TW, & Wallace MT (2014). Identifying and quantifying multisensory integration: a tutorial review. Brain Topography, 27, 707–30. [DOI] [PubMed] [Google Scholar]
- Stuart G, Spruston N, & Hausser M. (2007). Dendrites. Oxford University Press, USA. [Google Scholar]
- Veenman CL, Reiner A, & Honig MG (1992). Biotinylated dextran amine as an anterograde tracer for single- and double-labeling studies. Journal of Neuroscience Methods, 41, 239–54. PMID: 1381034. [DOI] [PubMed] [Google Scholar]
- Wallace MT, Meredith MA, & Stein BE (1998). Multisensory integration in the superior colliculus of the alert cat. Journal of Neurophysiology, 80, 1006–1010. DOI: 10.1152/jn.1998.80.2.1006. [DOI] [PubMed] [Google Scholar]
- Wallace MT, Carriere BN, Perrault TJ Jr., Vaughan JW, & Stein BE (2006). The development of cortical multisensory integration. The Journal of Neuroscience, 26, 11844–9. DOI: 10.1523/JNEUROSCI.3295-06.2006. [DOI] [PMC free article] [PubMed] [Google Scholar]
- Weiler N, Wood L, Yu J, Solla SA, & Shepherd GM (2008). Topdown laminar organization of the excitatory network in motor cortex. Nature Neuroscience, 11, 360–366. DOI: 10.1038/NN2049. [DOI] [PMC free article] [PubMed] [Google Scholar]
- Zhou ZC, Salzwedel AP, Radke-Schuller S, Li Y, Sellers KK, Gilmore JH, Shih Y-YI, Frohlich F, & Gao W. (2016). Resting state network topology of the ferret brain. NeuroImage, 143, 70–81. DOI: 10.1016/J.NEUROIMAGE.2016.09.003 [DOI] [PMC free article] [PubMed] [Google Scholar]
- Zikopoulos B, & Barbas H. (2007). Circuits for multisensory integration and attentional modulation through the prefrontal cortex and the thalamic reticular nucleus in primates. Review of Neuroscience, 18, 417–438. DOI: 10.1515/revneuro.2007.18.6.417. [DOI] [PMC free article] [PubMed] [Google Scholar]


