Abstract
Enzymatic reactions consist of several steps, (i) a weak binding event of the substrate to the enzyme, (ii) an induced fit or a protein conformational transition upon ligand binding, (iii) the chemical reaction, and (iv) the release of the product. Here we focus on step (iii) of the reaction of a DNA polymerase, HIV RT, with a nucleotide. We determine the rate and the free energy profile for the addition of a nucleotide to a DNA strand using a combination of a QM/MM model, the string method, and exact Milestoning. The barrier height and the time scale of the reaction are consistent with experiment. We show that the observables (free energies and Mean First Passage Time) converge rapidly, as a function of the Milestoning iteration number. We also consider the substitution of an oxygen of the incoming nucleotide by a non-bridging sulfur atom and its impact on the enzymatic reaction. This substitution has been suggested in the past as a tool to examine the influence of the chemical step on the overall rate. Our joint computational and experimental study suggests that the impact of the substitution is small. Computationally, the differences between the two are within the estimated error bars. Experiments suggest a small difference. Finally, we examine step (i) the weak binding of the nucleotide to the protein surface. We suggest that this step has only a small contribution to the selectivity of the enzyme. Comments are made on the impact of these steps on the overall mechanism.
Graphical Abstract
1. Introduction
Enzymatic reactions exploit the properties of enzyme-substrate complexes to reduce the timescales needed to reach the product state from the reactants. Hence, enzymes impact kinetics of chemical change but not the relative thermodynamics of the initial and final states. They speed up the outcomes of desired events and select the most likely course of action given a number of alternative processes. The reactions that are most likely to happen at a given time in a cell are those that are the fastest, not necessarily those that are leading to the most stable products. An enzymatic reaction can be described by the Michaelis-Menten mechanism, consisting of two steps: (i) the formation of a transient complex and (ii) the chemical reaction leading to products
| (1) |
We use the common notations, E for an enzyme, S for the substrate, and P for product. The rate coefficients are k±x where the minus sign denotes the backward reaction, and the x, the reaction step. Eq. (1) is useful for the description of many biochemical processes, as is evident by the overall success of the Michaelis-Menten model of enzyme kinetics.1 Nevertheless, in many enzymes the reaction can be more complex and includes more steps. These additional steps may enhance the functional roles of the enzyme, such as selectivity, and are therefore of interest.
The reaction mechanism of the enzyme HIV reverse transcriptase (HIV RT) has been investigated extensively in the past. HIV RT belongs to the family of DNA polymerases. The task of enzymes of this family is to copy, accurately and efficiently, genetic material from one polynucleotide strand to a complementary strand. HIV RT is a useful model system for studying activity and selectivity of these protein machines since computational, structural, and kinetic experiments are available.2–4 Molecular dynamics (MD) simulations offer atomically detailed models of enzyme function but need to be verified against experimental data. Kinetically, a polymerization reaction can be written as a sequence of four elementary steps. Each of them has the potential to contribute to selectivity and rate enhancement.
| (2) |
The first step in the pathway of this enzyme is the weak binding of the substrate (a nucleotide N) to the surface of the protein with corresponding rate coefficients of k1 and k−1. Once the initial complex is formed the protein undergoes a conformational transition (from E to F) and locks the ligand in a conformational state called the Michaelis complex for the next step of the chemical reaction. The rate coefficients for the forward and backward conformational transitions are k2 and k−2 respectively. The chemical reaction is the third step involving the bond formation between the nucleotide and the DNA strand, which has been studied extensively by Warshel and others for DNA polymerases.5–8 The rate coefficients of the third step are k3 and k−3. The final step is a byproduct (inorganic phosphate) release9, 10 and opening of the protein-DNA complex followed by DNA translocation to allow for the addition of a new substrate. The two events of the last step are not necessarily coupled.
In the past we investigated computationally the step of a conformational transition (step 2), and the step of product release (step 4). The second step was shown to have a significant impact on the specificity of the enzyme,2, 11 while the product release (step 4) may be rate limiting in related reactions.10 Here we extend these studies for two other steps. The chemical process (step 3) and the binding of the nucleotide to the protein surface (step 1). This manuscript is therefore an important step towards evaluating the entire mechanism of an enzyme. We also examine the binding of a substrate in which one of the non-bridging oxygens is replaced by a sulfur atom.
2. Method
2.1. The chemical reaction (step 3)
2.1.1. System preparation
The atomically detailed model of HIV RT is based on the Protein Data Bank (PDB) structure 1RTD.12 The CHARMM program13 and CHARMM36 force field14 are used for the MD simulations. The HIV RT model was solvated in an aqueous solution of 0.15M of sodium chloride. The water model is TIP3P15 and the solvation box is 151 × 128 × 110 Å3. The system consists of 216,002 atoms. Periodic boundary conditions were applied in all three directions. The cutoff distance for nonbond interactions is 20 Å for the calculations of changes of chemical bonds without the summation of interactions at longer ranges.
We removed a hydrogen from the O3’ of guanine base (Figure 1) preparing it for the phosphoryl transfer reaction. The system was minimized for 500 steps with the adopted basis Newton-Raphson method, followed by a short equilibration run in the NVT ensemble for 50 ps using a Langevin thermostat at 310K with a friction constant 10 ps−1. The system was then equilibrated in the NPT ensemble using Nose-Hoover Langevin piston pressure method for 1 ns at a pressure of 1 atmosphere and a temperature of 310K.16–19 The integration time step is 1 fs in all simulations. All bond lengths with hydrogen atoms were kept fixed with the SHAKE algorithm except those in the QM region (see below).20 Electrostatic embedding is adopted in all QM/MM simulations.
Figure 1.
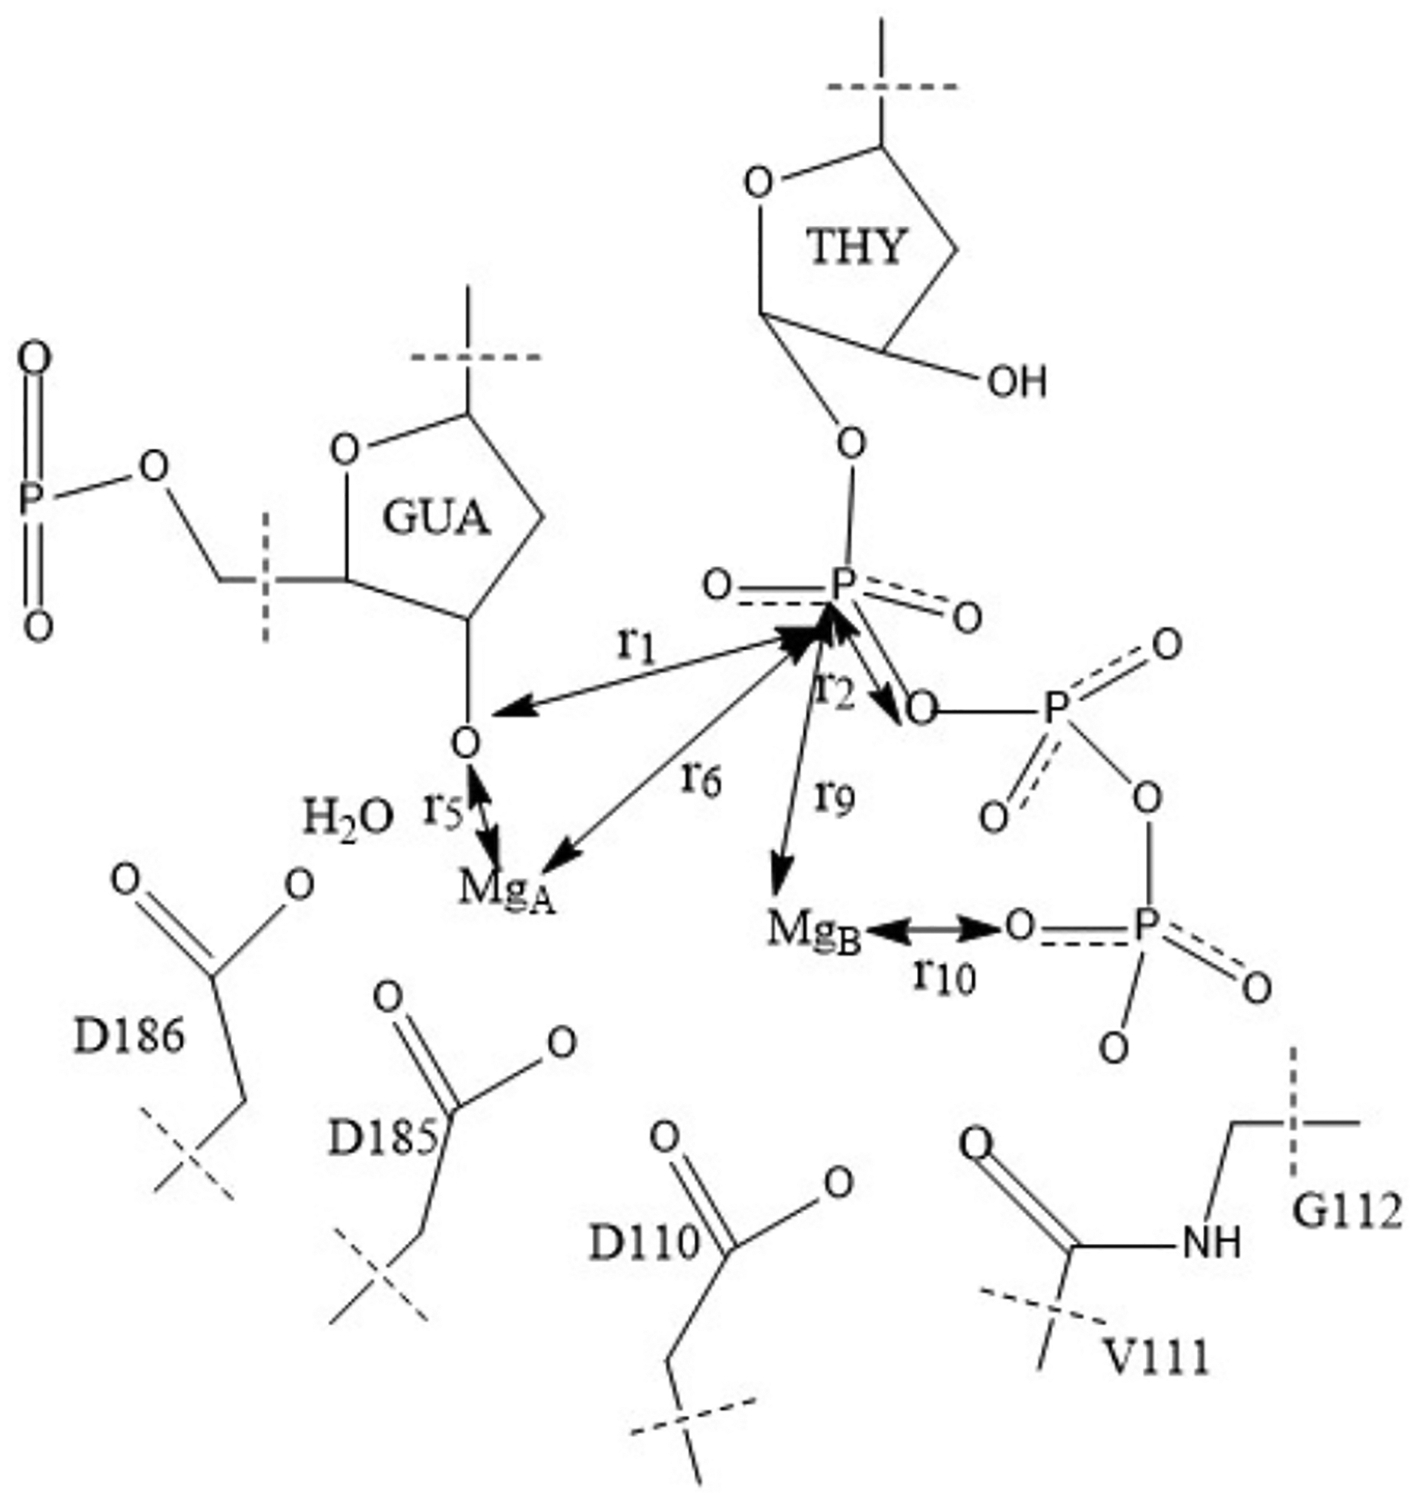
The QM region selected for the reaction of nucleotide addition and six suggestions for coarse variables.
2.1.2. The quantum region
To describe the chemical reaction of adding a nucleotide to the DNA strand, we need a computational method that makes it possible to break and form chemical bonds. We use a reaction-specific semi-empirical quantum mechanical/molecular mechanical (QM/MM) method, AM1/d-PhoT, which has been optimized for phosphoryl transfer reactions that was developed by Nam et al.21 The QM region consists of 77 atoms including eight capping hydrogen atoms (the complete list of QM atoms is in Table S1). Electrostatic embedding is adopted in all QM/MM simulations.
2.1.3. Free energy calculation and path optimization
We compute the free energy profile along a one-dimensional reaction coordinate. We first use a geometry-based choice, r = r0 − r1 (Figure 1), to explore the local conformational fluctuations along the reaction pathway. The distance between the phosphate of the substrate (TTP PA) and the oxygen of the complementary strand (GUA 22 O3’) is r1. The distance between the same phosphate and the oxygen of the leaving group that is bound to it (TTP O3A) is r2. This reaction coordinate captures the coupled event of bond breaking and formation.
We denote the template and complementary DNA strands, by DNAA and DNAB, respectively. The umbrella sampling method combined with the WHAM algorithm are used to obtain the free energy profile along the reaction coordinate r.22, 23 Harmonic restraints with a force constant of 200 kcal/mol Å2 are placed every 0.1 Å for r ranging from −2.4 Å to 0.1 Å. Another weaker half-harmonic constraint with a force constant of 10 kcal/mol Å2 was added between the Mg2+ ion in the catalysis center and one O atom at the tail of incoming nucleotide (i.e. r10 in Figure 1, the distance between the atom TTP O1G and the Mg2+ ion). The constraint is centered at 2.4 Å and is keeping the oxygen atom at the reaction center. In each sampling window, a QM/MM simulation was run for 250 ps in the NVT ensemble with a Langevin thermostat at 310K with a friction constant 10 ps−1. Configurations were saved every 0.5 ps for WHAM analysis. 500 configurations were saved at each sampling window. We calculated the free energy profile using the last 150 ps (300 data points).
In addition to the calculations along a geometry-based reaction coordinate discussed above, we also explored optimization of the reaction coordinate in a space of coarse variables. Figure 1 shows the QM region we selected in our QM/MM simulations where we identified six coarse variables closely related to the reaction process. The definitions of these six coarse variables are listed in Table 1. We used the string method in coarse variables to optimize the minimum free energy path.24 The reaction mechanism was simulated with 17 images along the pathway for 120 ps. In the string simulations, the position of images is updated every 1 ps, and the total iteration count is therefore 120. The initial guess of the reaction path and the positions of the anchors were taken from the last configuration of the 1D umbrella sampling runs of each window.
Table 1.
The six coarse variables considered in this paper (distances between listed atoms)
| Collective variables | Atom 1 | Atom 2 |
|---|---|---|
| r1 | TTP PA | DNAB 22 GUA O3′ |
| r2 | TTP PA | TTP O3A |
| r5 | DNAB 22 GUA O3′ | |
| r6 | TTP PA | |
| r9 | TTP PA | |
| r10 | TTP O1G |
2.1.4. Exact Milestoning
Here we only summarize the essential elements of the theory and algorithm of Milestoning. For a detailed description, readers are referred to recent literature.25 To initiate a Milestoning calculation, we partition the phase space into cells where the interfaces between cells are the milestones. A convenient choice of cells is the Voronoi tessellation in the space of one or more coarse variables.26, 27 The center of the Voronoi cell is defined by a single configuration in coarse space, xα, which is also called an anchor. A milestone Mαβ is the set of all points with equal distances from anchors α and β. For simplicity, we denote the milestone with a single index Mαβ ≡ Mi.
In a single iteration of a Milestoning simulation,28 two computational steps are carried out
an initial sampling at each milestone,
unbiased trajectories initiated from configurations sampled in step (1),
The initial sampling in step (1) is conducted in the NVT ensemble with harmonic restraints added to keep the system at a milestone.28 In the next step unbiased trajectories are run from configurations sampled in step (1) in the NVE ensemble. The trajectories run until they hit a milestone different from the initial one for the first time. For each trajectory we record the initiating and terminating milestones, and the trajectory length in time. We also store the full phase space point at the terminating milestone. The unbiased trajectories are used to estimate the transition probabilities, , between milestones, i, and, j, and the milestone lifetime, ti, of each milestone, i. Let the number of trajectories initiated from milestone i be ni and the number of trajectories initiated at milestone i and terminating at milestone j be nij. The transition probability, , is estimated as
| (3) |
Let til be the length of a trajectory l initiated at milestone i. The lifetime of a milestone is given by
| (4) |
With the transition probabilities and the lifetimes at hand, one can calculate the free energy landscape and mean first passage time (MFPT) using the transition matrix with appropriate boundary conditions. Reflecting boundary conditions are used to estimate the free energy profile in which we set and for ∀j ≠ fin − 1. The index fin represents the final milestone. Cycling boundary conditions, from the product to the reactant, are used to compute the MFPT. These boundary conditions are obtained when we set the transition matrix elements and for ∀j ≠ ini, where the index ini represents the initial milestone. The last set up corresponds to a nonequilibrium but stationary state in which the flux is a time independent.
In the first step of the analysis we solve the eigenvector equation with a given eigenvalue of 1,
| (5) |
The eigenvector w is the stationary fluxes through the milestones, or the number of trajectories that pass the milestones in a unit time. The stationary probability that a trajectory passes milestone i last, is pi = witi. The free energy is
| (6) |
The MFPT τ is calculated as
| (7) |
where wfin is the flux through the final (product) milestone.
The Milestoning method with a single iteration has been applied successfully to complex biochemical processes, such as membrane permeation,29, 30 enzyme catalysis,11, and a protein conformational change.31 However, the initial sampling from the NVT ensemble restrained to the milestone in step (1) is an approximation. The flux distribution at the milestone is the distribution generated by trajectories that hit the milestone only once. The equilibrium distribution allows multiple crossing events. Therefore, the exact distribution at the milestone is a first hitting point distribution (FHPD) and not the equilibrium Boltzmann distribution (BD). If the milestones are well separated in space, the trajectories have ample time to relax to a local equilibrium. In that case we can assume that FHPD≈BD. However, under different conditions it is desired to compute the FHPD at each milestone. For that purpose, the exact Milestoning method was developed.28 In exact Milestoning we use multiple iterations to better estimate the distribution at the milestone. The key idea is to iteratively update the sampling at the milestones according to
| (8) |
where is a normalized distribution at milestone i at the n − th iteration that approximates the FHPD. The transition probability from phase space point xi on milestone i to xj on milestone j in a stationary process is Wij(xi, xj). The quantity is obtained from the more detailed Wij(xi, xj) by an average: . The iterations are guaranteed to converge for a system with a finite MFPT to give the exact FHPD and .28
2.2. The relative binding strength of a correct and incorrect ligand to the protein
In this section we consider the relative binding strength of a correct and incorrect substrates to the surface of the protein. Following Eq. (2) the rate coefficients k1 and k−1 inform us on the weak binding step. In the past, others have computed the absolute on and off rate coefficients.32–35 In the present investigation we only consider the relative binding strengths of different ligands. We define K1 ≡ k1 / k−1 as the quasi equilibrium binding constant. We denote K1C as the quasi equilibrium constant for the correct substrate and K1I for the incorrect one. The corresponding free energy difference between the bound (B) and unbound (U) states for the correct ligand is
| (9) |
We can write a similar expression for the incorrect substrate
| (10) |
For computational convenience we put the two expression in a thermodynamics cycle
| (11) |
Since the free energy is a state function we must have:
| (12) |
Here we use the Free Energy Perturbation method (FEP)36 to compute the “alchemical” change of the “correct” and “incorrect” ligand in the unbound (CI) and bound complex (EC-EI) form on the right-side difference of Eq. (12). Exploiting the cycle, the calculation provides information on the left side of Eq. (12) or the difference in the strength of binding of the two substrates.
The open state protein structure is obtained from previous simulations of HIV RT.2 The NAMD 2.10 program37 and CHARMM36 force field14 are used in the MD simulations. The HIV RT is solvated in a sodium chloride aqueous solution of 0.15M. The water model is TIP3P.15 The system consists of 246,001 atoms. Periodic boundary conditions are applied in all three directions. Since this calculation does not include quantum mechanics the cutoff distance of the nonbond interactions is 12 Å. PME is used for long-range electrostatic summation.38 The trajectories are run in the NPT ensemble with Nose-Hoover algorithm using a Langevin dynamics to control the pressure at 1 atmosphere and the temperature at 300K.16 The barostat oscillation time is 50 fs and the oscillation decay period is 25 fs. The friction coefficient for the Langevin thermostat is 1 ps−1.
The potential energy in the free energy perturbation calculations is
| (13) |
where UI and UC are the interactions between the incorrect and correct substrates (ATP and TTP) and the rest of the system, respectively. The interpolation parameter, λ, changes from 0 to 1 with a step size of 0.05. In NAMD, the electrostatic and van der Waals components scale differently. The two parameters in NAMD that controls the scaling rate are alchVdwLambdaEnd=1.0 and alchElecLambdaStart=0.5. Within each λ window, the system is equilibrated for 500 ps and the sampling continues for additional 500 ps.
2.3. Substituting oxygen to sulfur atom
In Figure 2 we show the possible substitution of oxygen (TTP O2A) to sulfur in the substrate (α-thio(Sp) TTP). Using an alternative substrate has been of considerable interest in studies attempting to determine whether chemistry or another step is rate-limiting.39–41 Here we examine if the free energy profile and kinetics are changing significantly following the sulfur substitution. We substitute the oxygen to sulfur in the last configuration from each window of the umbrella sampling simulation discussed in section 2.1.3. Then we ran 250 ps umbrella sampling simulations using the same coarse variable r = r2 − r1. The Milestoning with a single iteration are conducted using reflecting and cycling boundary conditions.
Figure 2.
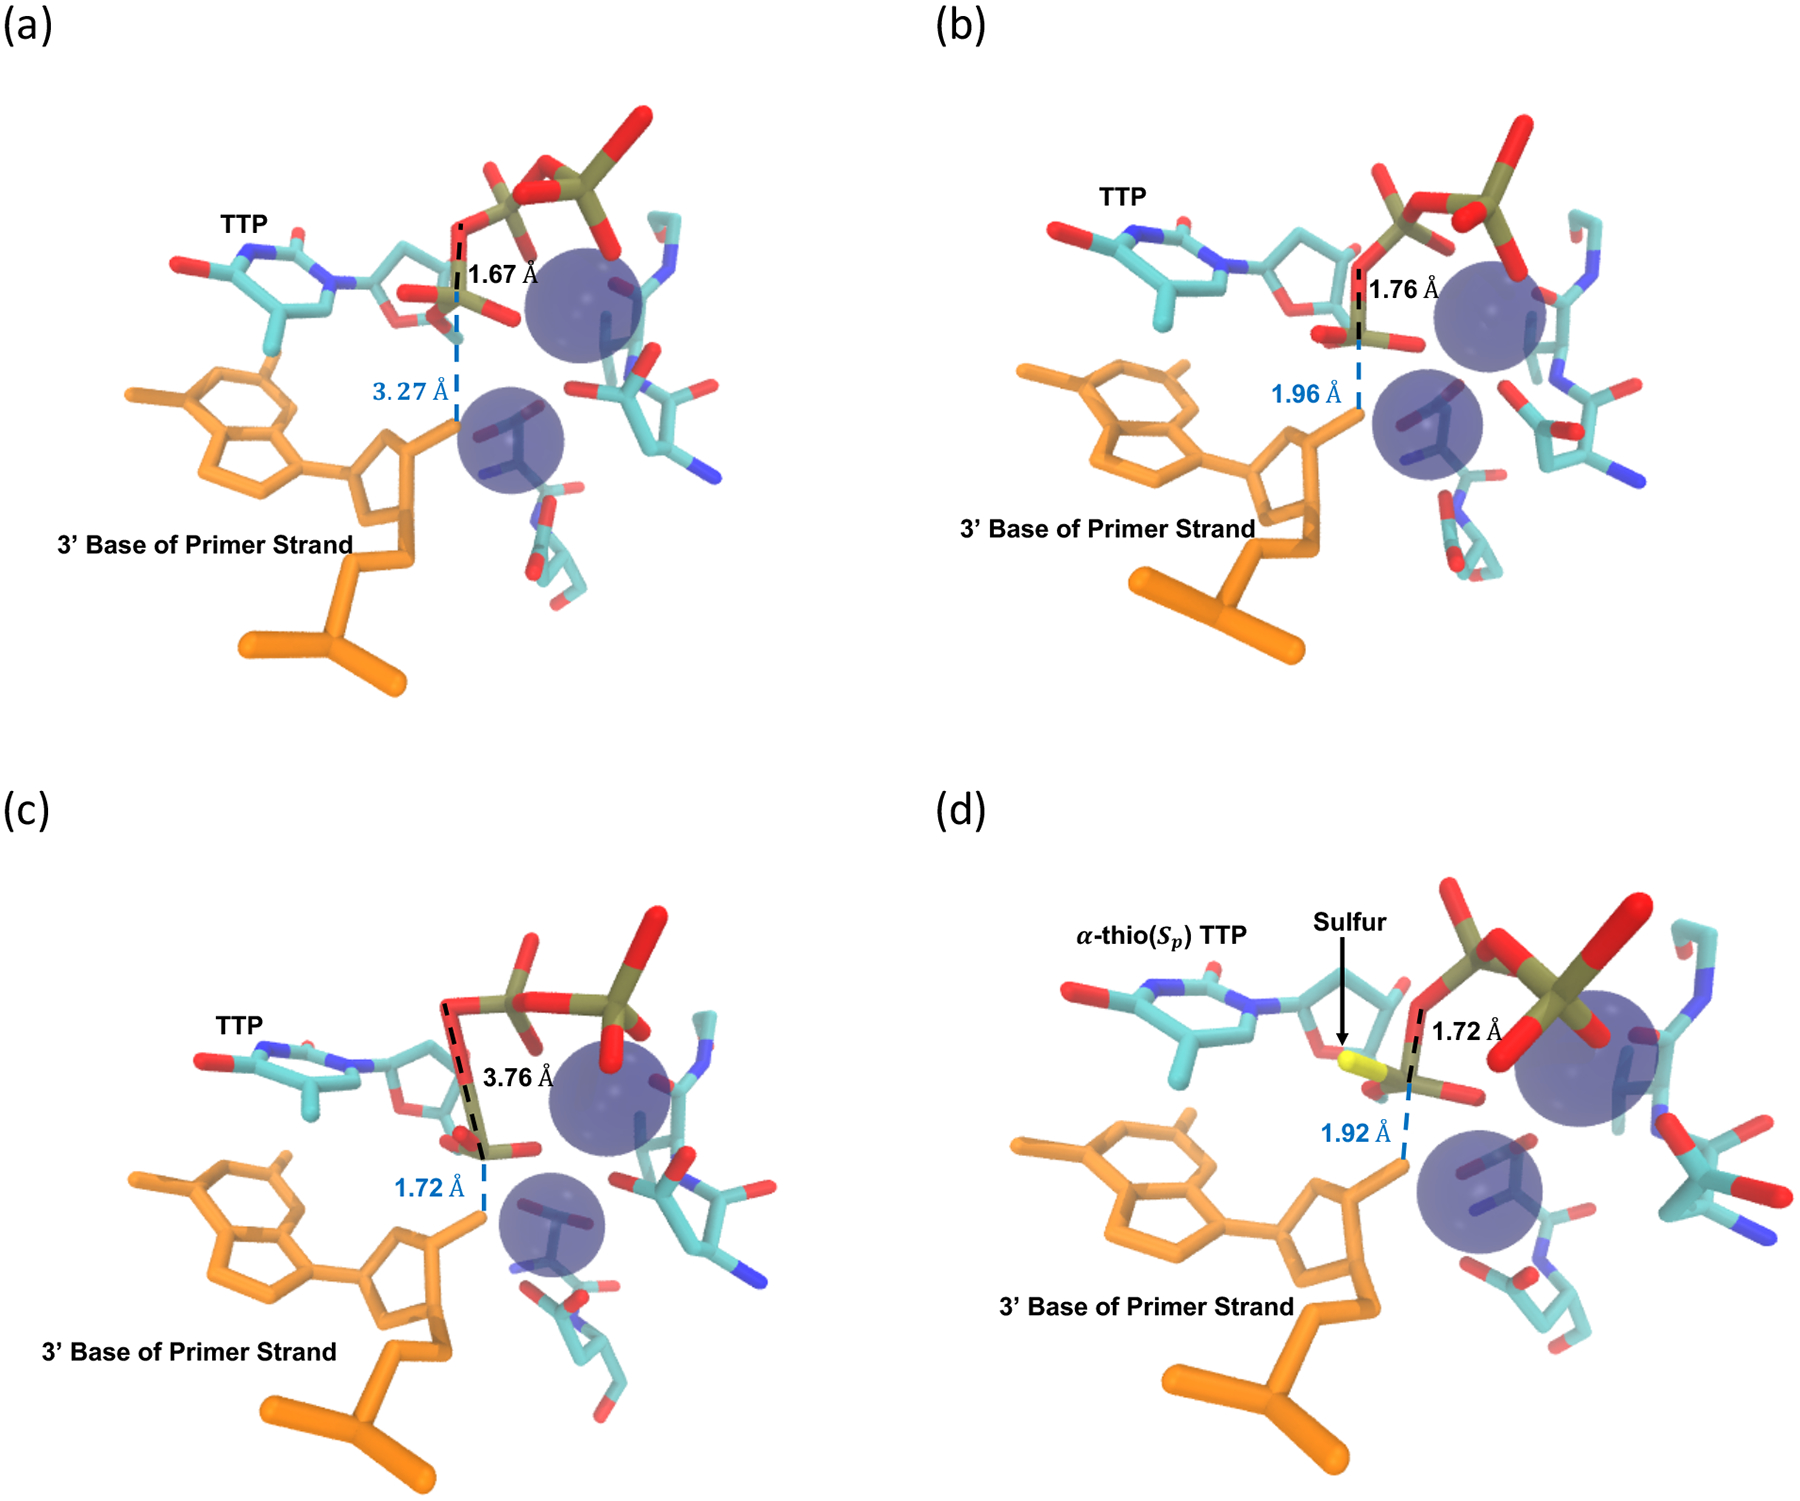
Snapshots of the addition process of TTP addition to a DNA strand by HIV RT : (a) The reactant state structure, (b) the transition state, (c) the product state. (d) The transition state structure of the sulfur variant of TTP - α-thio(Sp) TTP.
2.4. Experimental measurement of thio effect.
The effect of thio substitution on the rate of the chemical reaction was measured by comparing the kinetics of incorporation of dATP to α-thio(Sp) dATP. Differences between TTP in computational studies versus dATP for experimental studies are not significant because the chemistry and geometry of the active site are nearly identical for the two nucleotides.
Purification of the α-thio(Sp) dATP: The Rp and Sp diastereomers of α-thio-dATP (TriLink Biotech) were separated by reverse phase HPLC on a Vydac 218 TP54 C18 column. Aliquots of approximately 1 μmol of nucleotide were injected onto the column, equilibrated in 100 mM triethylammonium acetate, pH 7. The diastereomers were separated with a 0 – 4 % acetonitrile gradient, monitoring absorbance at 260 nm. The first and second main peaks correspond to the Rp and Sp diastereomers, respectively.42 Fractions from the second peak were pooled, concentrated on a Sep Pak C18 cartridge (Waters), then dried to completion in a SpeedVac centrifugal concentrator (Savant). The nucleotide was resuspended in dH2O and the concentration was determined by absorbance at 259 nm using the extinction coefficient 15,200 M−1 cm−1. A small aliquot of the purified nucleotide was used for an analytical separation analysis and the isomeric purity was determined to be > 96%.
Kinetics of nucleotide incorporation: Rapid quench-flow (RQF-3, KinTek Corp, Austin, TX) was used to measure the time dependence of dATP (NEB) and α-thio(Sp) dATP (TriLink Biotech) incorporation. 100 nM of MDCC-labeled HIV RT (p51 C280S/p66 C280S E36C)43 was preincubated with 150 nM of 5’-FAM labeled DNA (27mer/45–18T, Primer: 5’-FAM-CCG TCG CAG CCG TCC AAC CAA CTC AAC-3’, Template: 3’- GGC AGC GTC GGC AGG TTG GTT GAG TTG TAG CTA GGT TAC GGC AGG-5’) in reaction buffer (50 mM Tris pH7.5, 100 mM potassium acetate, 0.1 mM EDTA). Then, the enzyme/DNA complex was mixed with various concentrations of dATP or α-thio(Sp) dATP (ranging from 1 to 100 μM) and 12.5 mM magnesium acetate at 37°C.43 After mixing, the reaction was quenched with 500 mM EDTA at 14 different time points ranging from 3 to 1500 ms. The 28-nt product (Product: 5’-FAM-CCG TCG CAG CCG TCC AAC CAA CTC AACA-3’) was resolved from the substrate using capillary electrophoresis, following previously published methods.44 A 10 μL aliquot of Hi-Di Formamide (Applied Biosystems) was mixed with 1 μL of each sample in a 96-well plate. Cy3 (ThermoFisher) internal standard was added to each well to help determine the identity of substrate and product peaks. The 96-well plates were run on an ABI 3130xl genetic analyzer (Applied Biosystems). The peaks from capillary electrophoresis were analyzed using Genemapper 5 (ThermoFisher). To determine product formation (28mer), peak areas from Genemapper 5 were imported into an in-house Python script. The script generated a tab-delimited product versus timetable, which was imported into KinTek Explorer software (KinTek Corp, Austin, TX) for global data analysis to define the apparent Km and kcat for the reaction as described.43
3. Results and Discussion
3.1. Umbrella sampling and reaction pathway
The free energy profile is calculated first using the umbrella sampling simulations (section 2.1.3) along a single reaction coordinate r = r2 − r1 (Figure 3). The free energy barrier of the forward reaction is 14 ± 0.2 kcal/mol. The error bars in the free energy are statistical and were estimated using a Monte Carlo bootstrap error analysis with ten data sets.45 The equilibrium position of the reactant state is at r = −1.5 Å and the transition state is near r = −0.2 Å.
Figure 3.
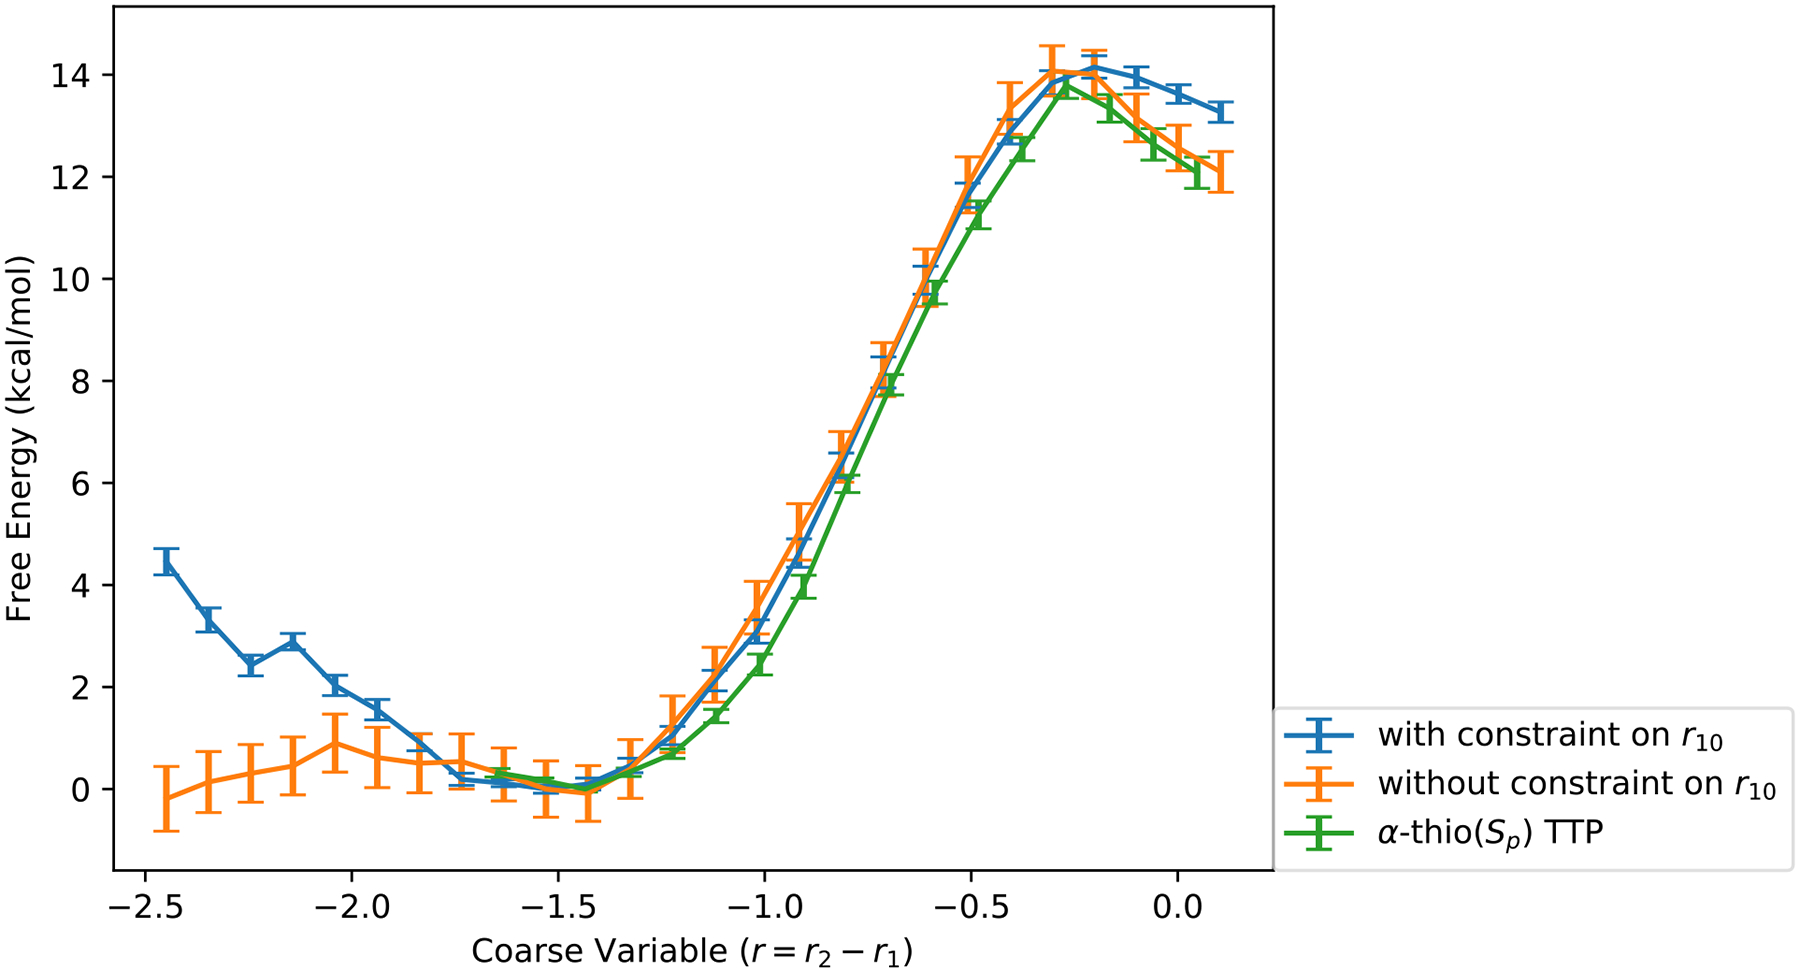
The free energy profile from 1D umbrella sampling simulations. The blue color denotes the result with a harmonic restraint (force constant 10 kcal/molÅ2) on the coarse variable r10 for TTP (the distance between the magnesium ion and the phosphate oxygen, see Figure 1). The orange curve is the free energy profile without the harmonic restraint. The green curve is the free energy for the α-thio(Sp) TTP with the harmonic restraint (force constant 20 kcal/molÅ2) for the first half of the reaction. The x axis is the coarse variable r = r2 − r1 in Å. The y axis is the free energy in kcal/mol.
The above choice of the reaction coordinate is simple and intuitive, and it is useful for enforcing the chemical step to occur using the umbrella sampling technique. However, other variables may influence the reaction in a non-trivial way. Based on previous investigation of the polymerase reaction and on chemical intuition,46 we identify six distances as candidates for coarse variables in the QM region (Figure 1). We determined the optimal pathway in that space with the string method in collective variables as implemented in CHARMM.24, 47, 48 In Figure 4 we plot the variation of all the coarse variables as a function of the progress along the optimal pathway. Of all the coarse variables only two (r1 and r2) change significantly. These are the variables we used previously. The other four distances fluctuate mildly during the reaction. Representative structures of the active site at the reactant, transition, and product states are shown in Figure 2.
Figure 4.
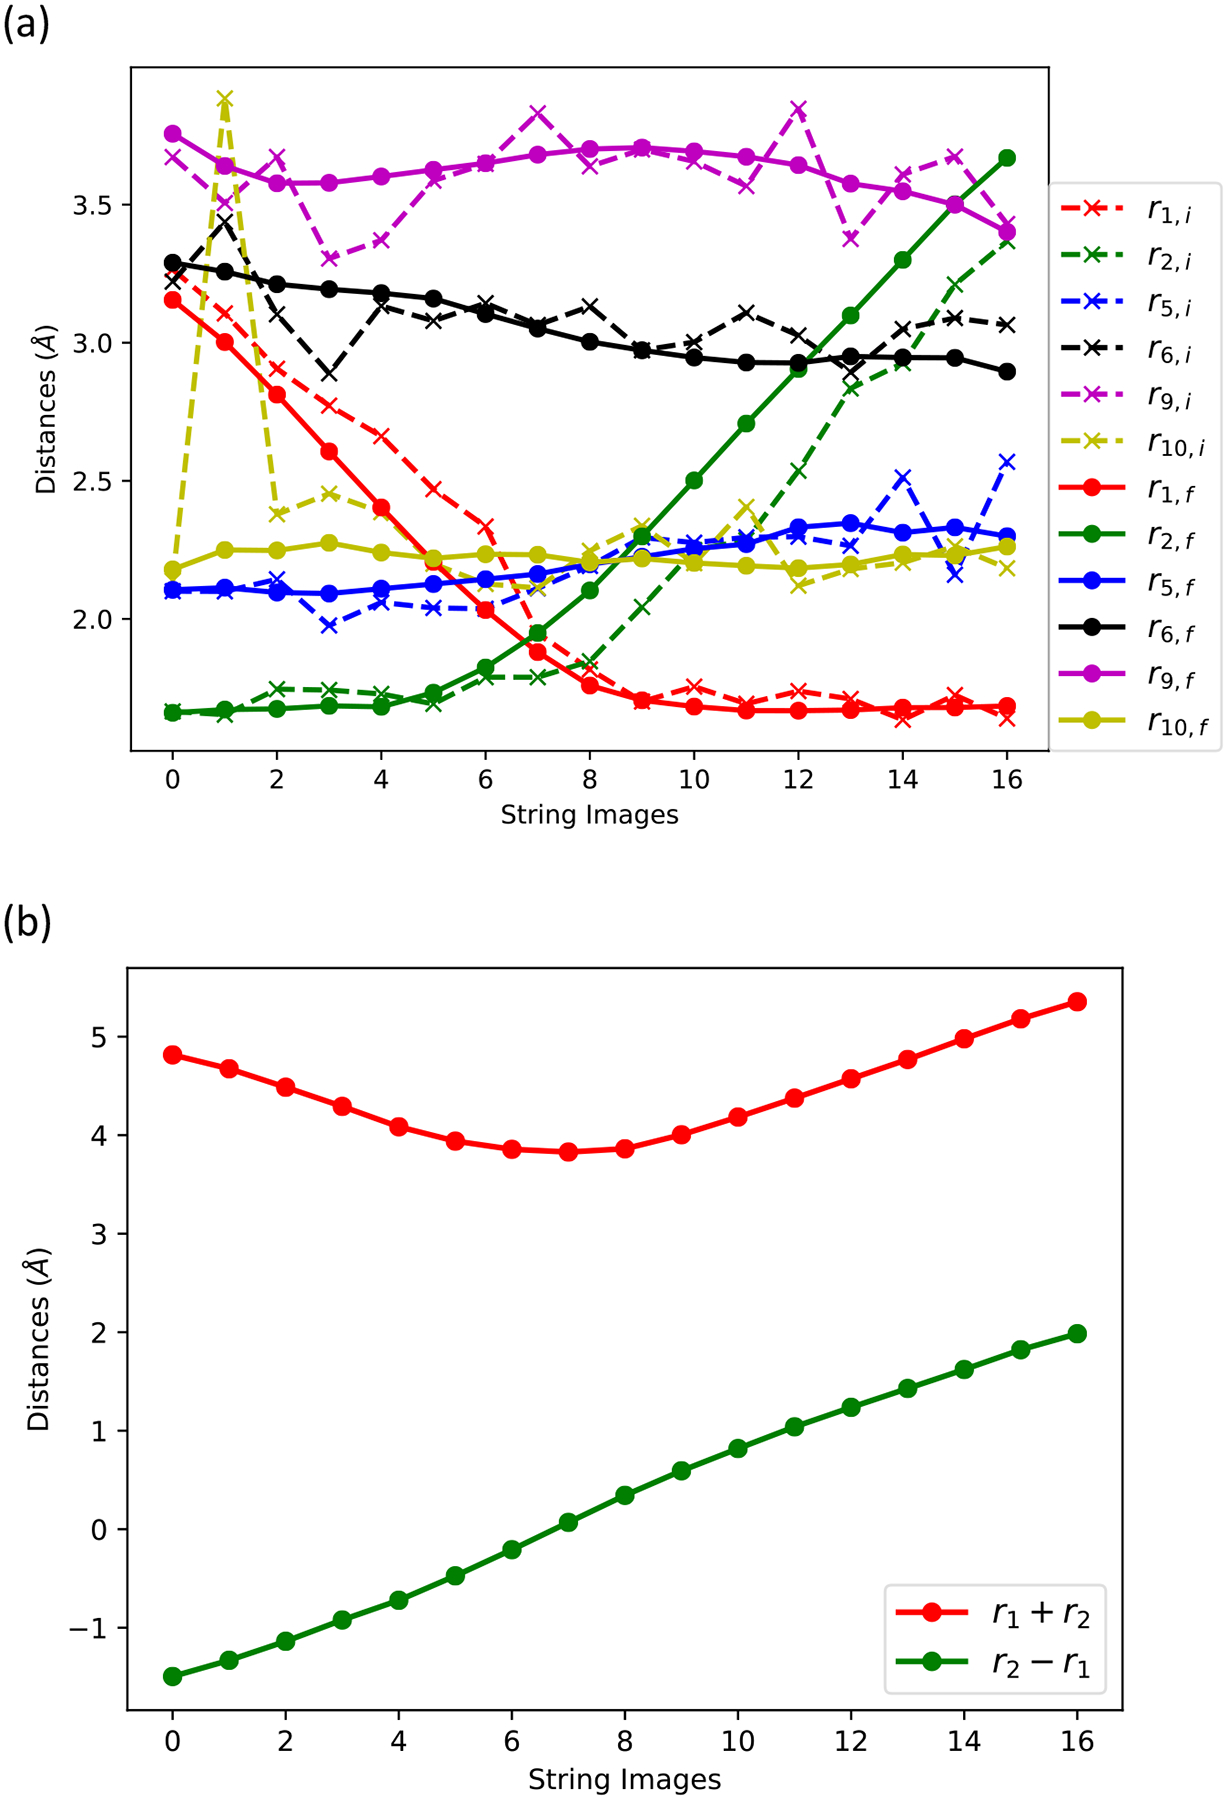
A summary of the path optimization with the string method. (a) A path optimization in the space of six collective variables. Dashed lines are initial guesses using the final structures of the umbrella sampling simulation. The umbrella sampling simulations use “r = r2 − r1” as a reaction coordinate. Solid lines show the string optimized path. The initial and final values of r10 at image 1 differ significantly. This is due to the unstable noncovalent association between the Mg2+ ion and the oxygen atom (TTP O1G) at the tail of the incoming nucleotide in the umbrella sampling simulations. In the string optimization simulations, the instability is removed due to the equidistance restraints in the simulation process. (b) The r2 − r1 and r1 + r2 coarse variables as a function of the string coordinate. Note that while r2 − r1 vary considerably, r1 + r2 varies significantly less.
The initial value of coarse variable r10 (the distance between the magnesium atom and the oxygen of the substrate (TTP O1G)) in image 1 (Figure 4) fluctuates widely as a function of the path index. The initial guess of the reaction path is based on the last configurations of the umbrella sampling simulations with a mild harmonic restraint on r10. However, after the string optimization, the coarse variable r10 becomes a slowly varying function of the path index (yellow solid line in Figure 4). This relaxation is mainly due to the equidistance restraints in the string optimization method. To investigate how the coarse variable r10 will affect the 1D free energy profile along r = r2 − r1, we ran another umbrella sampling simulation without the harmonic restraint on r10. The result is shown in Figure 3. Another difference is that the free energy landscape around the reactant equilibrium position now becomes flat, from which we conclude that the noncovalent association between the Mg2+ ion and the O atom (r10) helps locking the incoming nucleotide into the active site. The last observation illustrates the importance of the magnesium ion in sustaining a stable transient complex. Since we are primarily interested in the forward direction, we kept the harmonic restraint on r10 in the Milestoning calculation and increased the force constant to 50 kcal/mol Å−2.
The findings described above suggest that two coarse variables (r1 and r2) are sufficient to describe the phosphoryl transfer reaction. We can reduce the number of coarse variables to one by using the antisymmetric stretch combination (r = r2 − r1). The complementary variable (r1 +r2) changes only moderately (Figure 4). In the following Milestoning calculations, we use r.
In our decision to use only the coarse variable r as a reaction coordinate, we assume that the changes we observe in the distributions of the other coarse variables along the reaction coordinate are in equilibrium and sampled appropriately. To assess this assumption, we examined the distance distributions of r5, r6, r9 and r10 (Figure 5). The distributions show significant shifts that remain, however, small. The distance distribution of r5 is similar for the reactant and transition state. The distribution of r6 and r10 (distances between the phosphate and potentially mobile magnesium ions) show significant deviations. The distribution of r6 is narrower and shifts to smaller values at the transition state compare to the reactant state. The distributions of r9 and r10 are significantly broader in the reactant state compared to the transition state. The average value of r9 shift to smaller values and of r10 to larger distances.
Figure 5.
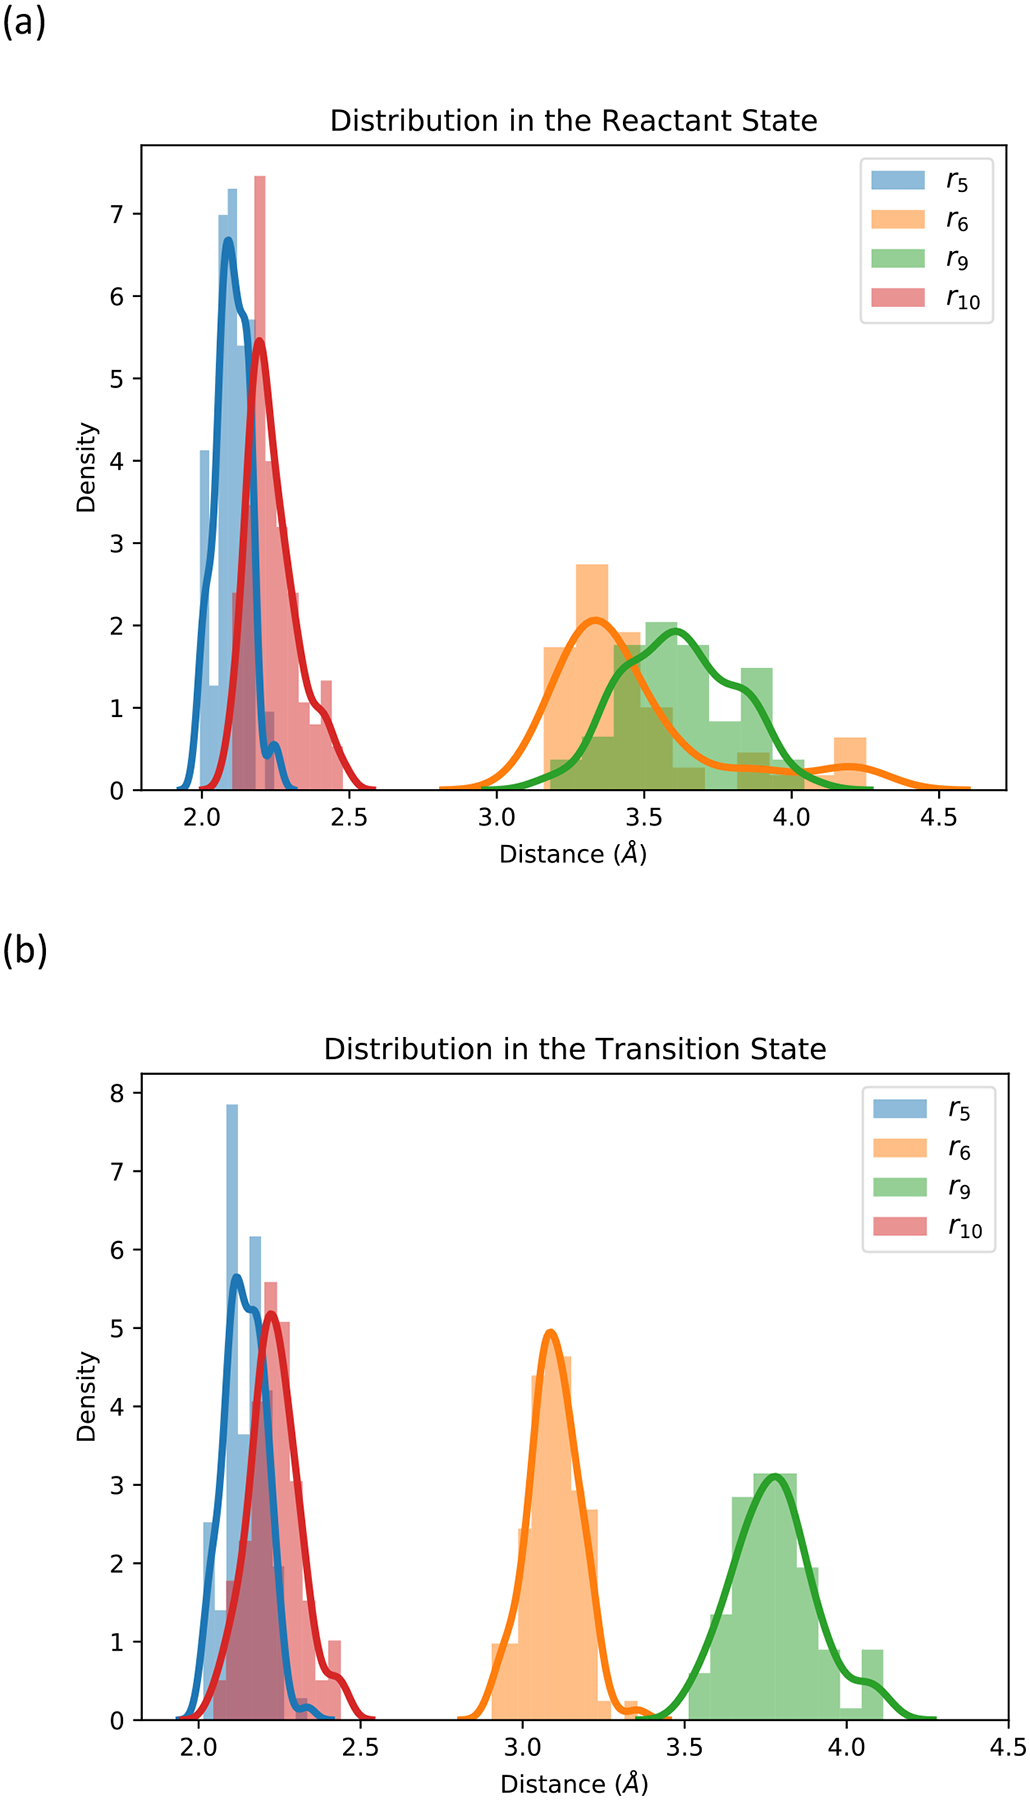
(a) The distance distributions of r5, r6, r9 and r10 in the reactant state; (b) The distance distributions of r5, r6, r9 and r10 in the transition state. The distributions are computed from the last iteration of the exact Milestoning run.
3.2. Free energy profile and kinetics from exact Milestoning
As we learned from the string path optimization, the coarse space can be effectively reduced to one dimension (r = r2 − r1). Therefore, milestones were placed along this coarse variable every 0.1 Å in a range from −1.6 Å to 0.0 Å and at 0.5 Å as the product state boundary. There is a total of 18 milestones. The milestone at −0.2 Å, is roughly the transition state.
We number the milestones from 0 to 17 with milestone 0 at −1.6 Å, milestone 16 at 0.0 Å and milestone 17 at 0.5 Å. Balancing out the statistics and efficiency, we sampled 100 configurations on milestone 0 to 4, 200 configurations on milestone 5 to 7, 300 configurations on milestone 8 to 11 and 100 configurations on milestone 12 to 16. All initial configurations for the exact Milestoning calculations were selected from the last 150 ps umbrella sampling simulations. The milestones are placed at centers of umbrella sampling windows. We added a half-harmonic restraint centering at −1.8 Å (before the initial milestone) with a force constant of 100 kcal/mol Å2 to restrain the system to the reactant region.
The free energy profile can also be obtained from Milestoning calculations (see section 2.1.4 and Eq. (6)). It is shown in Figure 7. The error bars were estimated by sampling 1000 times the transition matrix using the beta distribution, and the local lifetime ti using the normal distribution.49 We conducted 16 iterations following the exact Milestoning procedure. As the iteration number increases, the free energy profile fluctuates around the average value. In the iteration process, using only the configurations that hit the milestone last in the previous iteration may lead to poor sampling of forward events. The problem is specifically acute when the free energy increase is the steepest (milestones 5–11). To enhance the forward-hitting population on these intermediate milestones, we take advantage of configurations from previous iterations.
Figure 7.
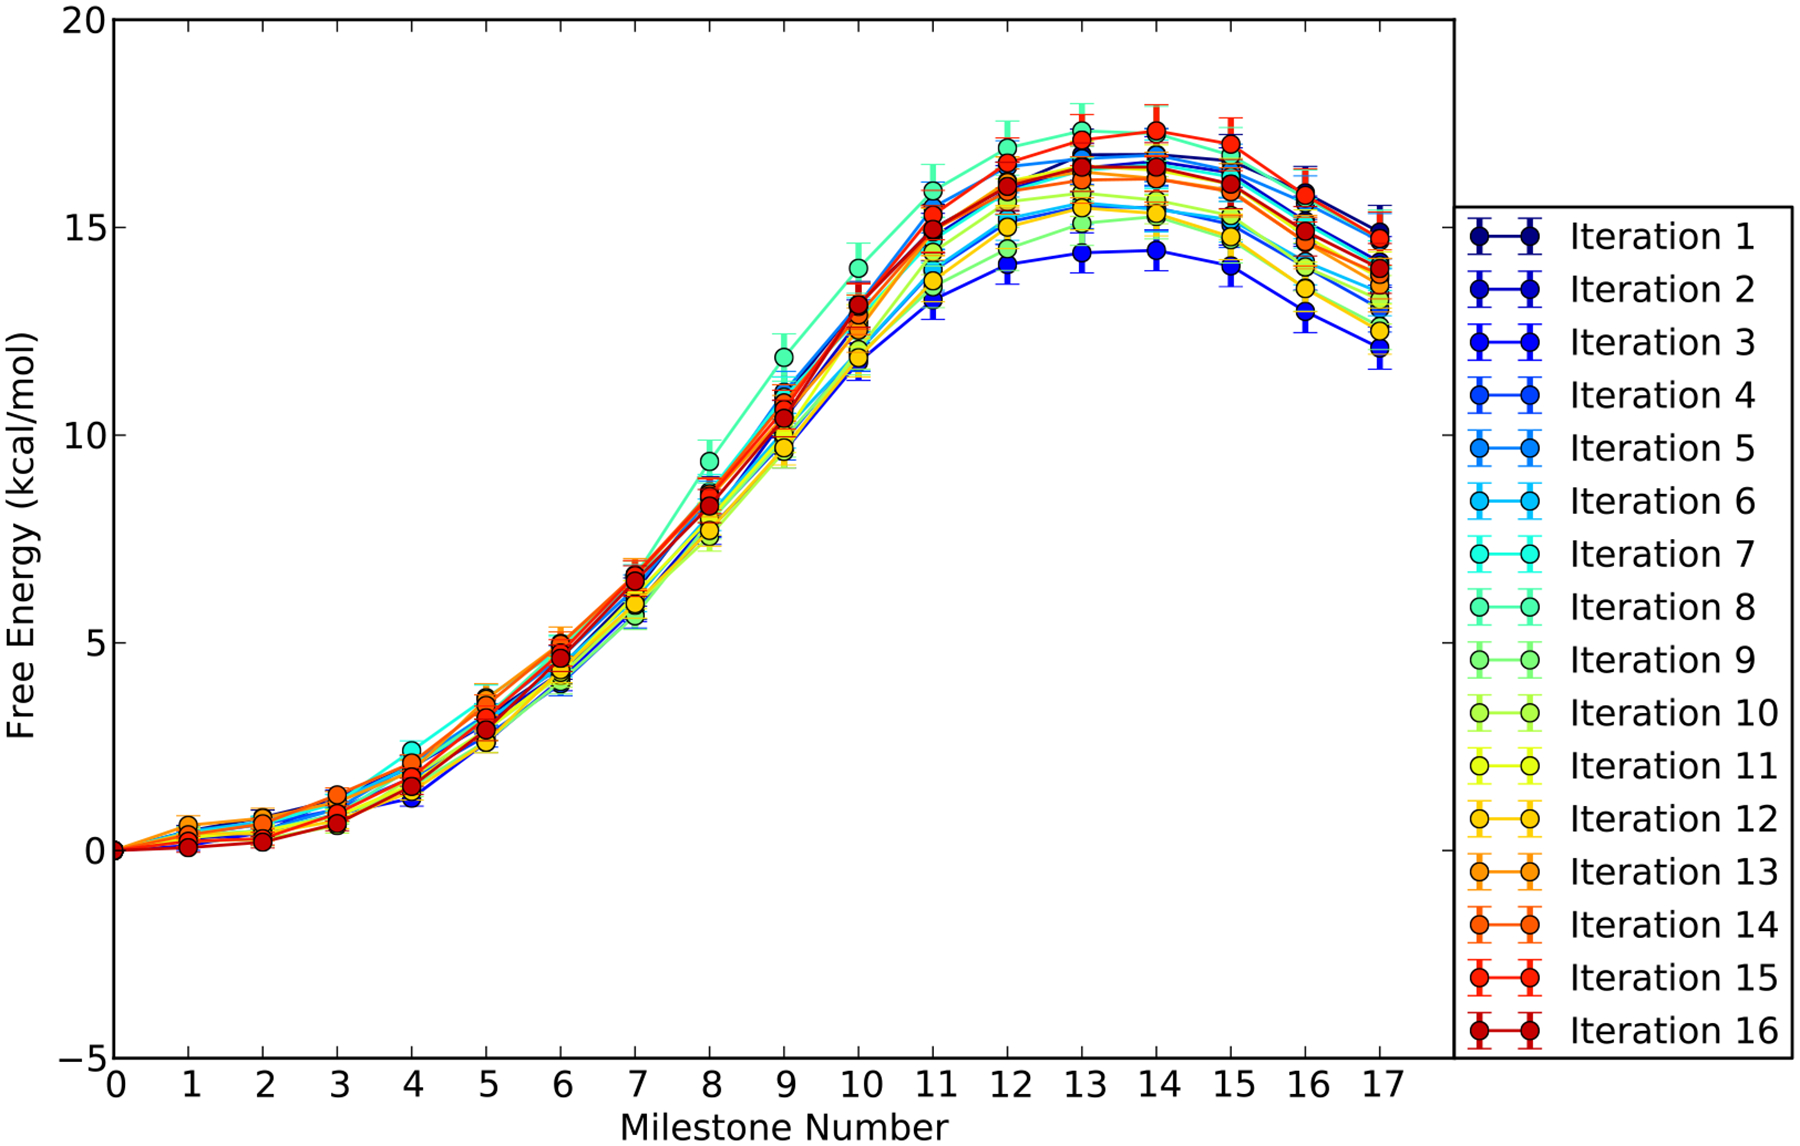
The free energy profile as a function of the milestone index calculated with exact Milestoning for the TTP substrate. The profiles for different iterations of exact Milestoning are shown in different colors.
For example, the number of forward-hitting events from milestone M8 to M9 is less than what is needed in a single iteration. Therefore, forward-hitting events from milestone M8 to M9 from previous iterations are also added to the next iteration. Since the iterations of the distributions, converge to same asymptotic value, as the index, n, of the iterations increases, also previous iterations converge to the asymptotic value. Therefore, using hits from previous iterations converge to the correct answer as can be tested by examining the convergence of the free energy and the MFPT. The free energy barrier calculated from the average of last five iterations of exact Milestoning is about 16 ± 0.24 kcal/mol which is higher than the estimate from the umbrella sampling. We discuss possible reasons for the disagreement below.
There are several sources of errors in Milestoning. The first is that the iterations did not converge to the FHPD and therefore the sampling is conducted from a different distribution. Another source of error is statistical, the sample of terminating trajectories between two milestones can be poor. The overall convergence of the free energy profile suggests that these errors are small. There is yet another difference in the definition of the stationary probability in the umbrella sampling and in Milestoning. In the umbrella sampling we consider the probability that the system is in a position x. In Milestoning we consider instead the probability that the last milestone that was crossed by a trajectory is x. This means, for example, that at a specific time t, the trajectory can be anywhere between the two milestones near x.
The MFPT as a function of the reaction coordinate is shown in Figure 8. The MFPT fluctuates around a stationary value as a function of the iteration number. The MFPT for the phosphoryl transfer reaction catalyzed by HIV RT estimated from the average of last five iterations is 50 – 110 ms. The MFPT is not sensitive to the precise position of product state boundary since (1) the flux through milestone 17 is about eleven orders of magnitude smaller than that of initial state; and (2) moving the product state boundary from 0.5 Å to, say, 1.5 Å only increases the local lifetime of milestone 17 by less than 1 ps while the transition probabilities remain the same. We analyzed the distribution of the overall MFPT of the average of last five iterations by the same procedure we estimated the error bars of the free energy. The distribution is shown in Figure 9.
Figure 8.
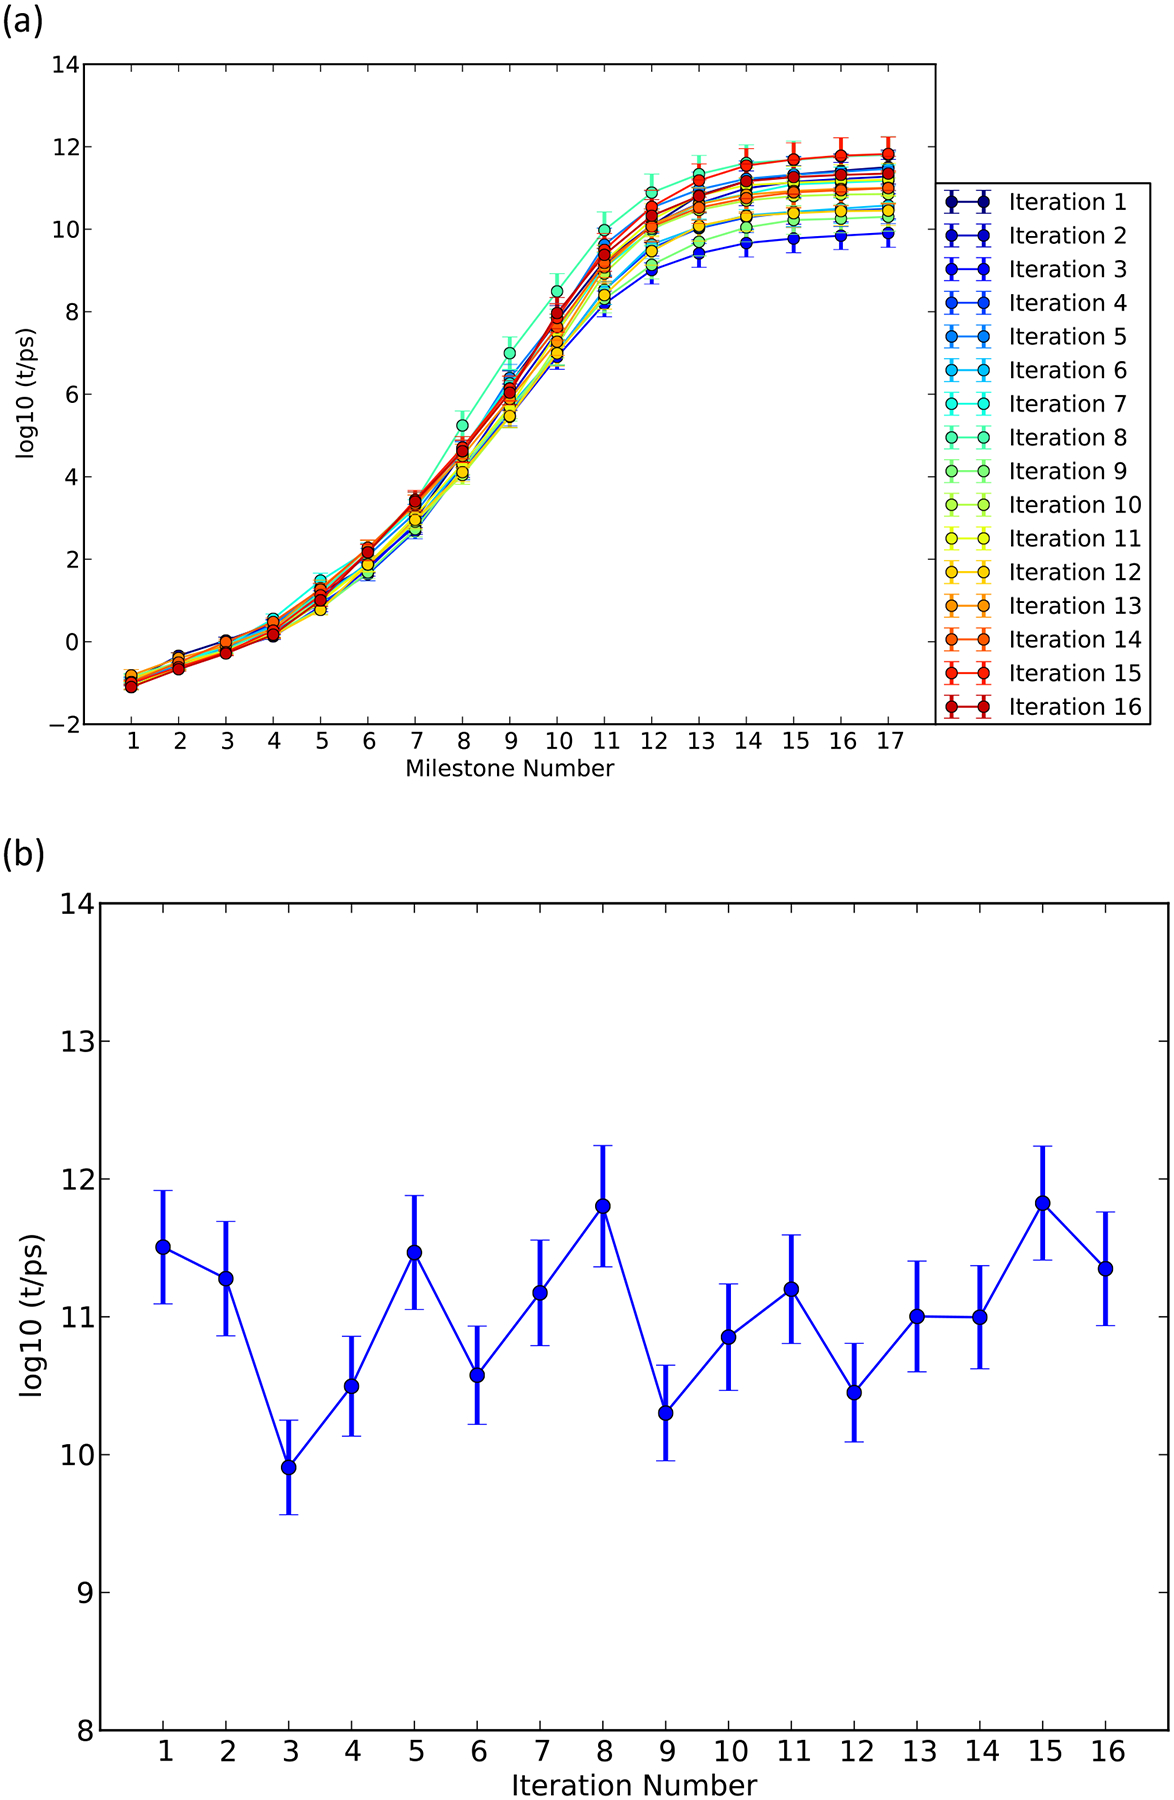
(a) The mean first passage time from the initial milestone (0) to reach each of the milestones (1–17) calculated with the method of exact Milestoning for TTP; (b) The mean first passage time from the initial milestone (0) to the final milestone (17) as a function of the exact Milestoning iteration number for the substrate TTP.
Figure 9.
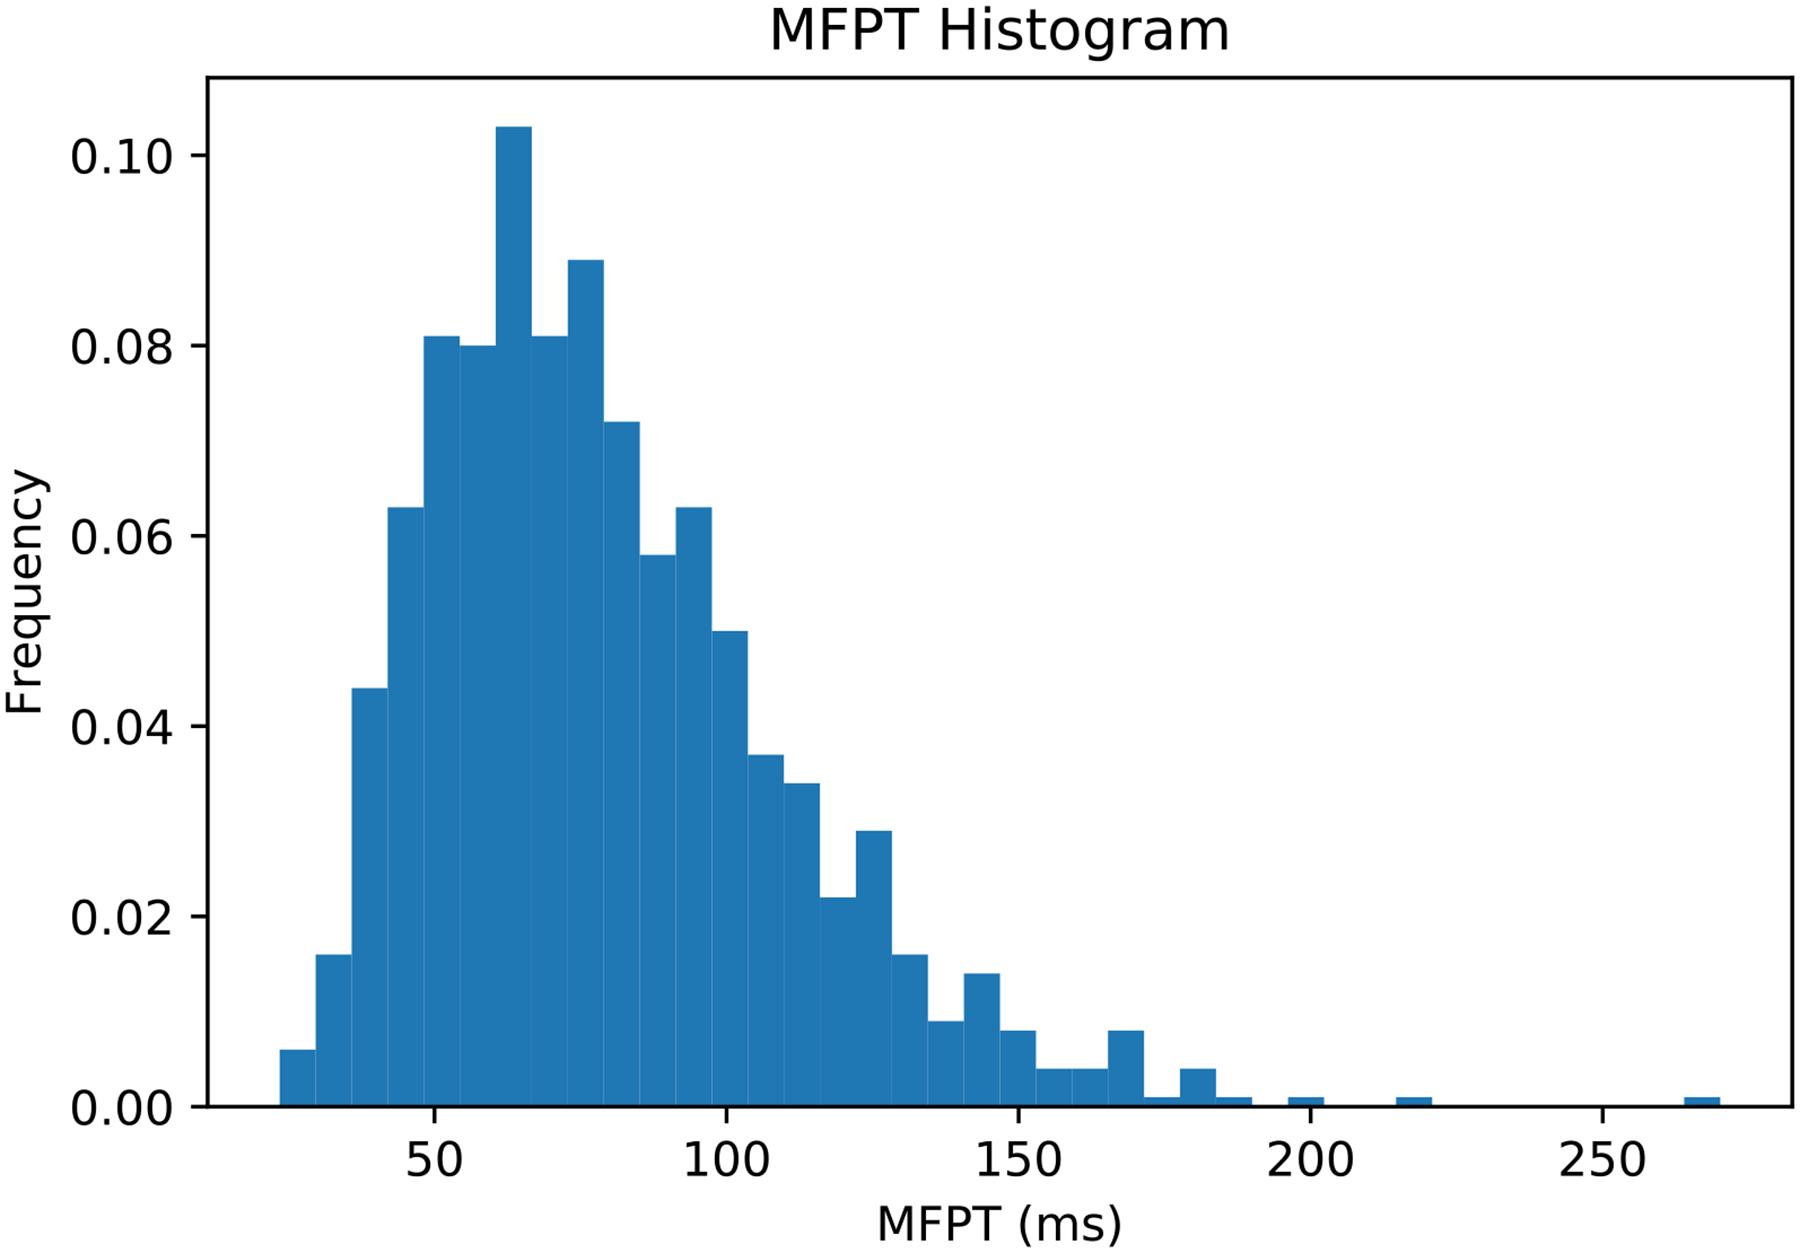
Histogram of the overall mean first passage times from the initial milestone (0) to the final milestone (17) calculated by transition matrices and lifetime sampled from the last five iterations of the exact Milestoning algorithm for the reaction of HIV RT with the substrate TTP.
We note that the single iteration Milestoning is working quite well. We therefore performed a single iteration Milestoning calculations for α-thio(Sp) TTP. The results are shown in Figure 10 and Figure 11. The free energy barrier is about 14.8 ± 0.64 kcal/mol and the MFPT is about 9~65 ms. The free energy barriers and the corresponding MFPT-s are summarized in Table 2.
Figure 10.
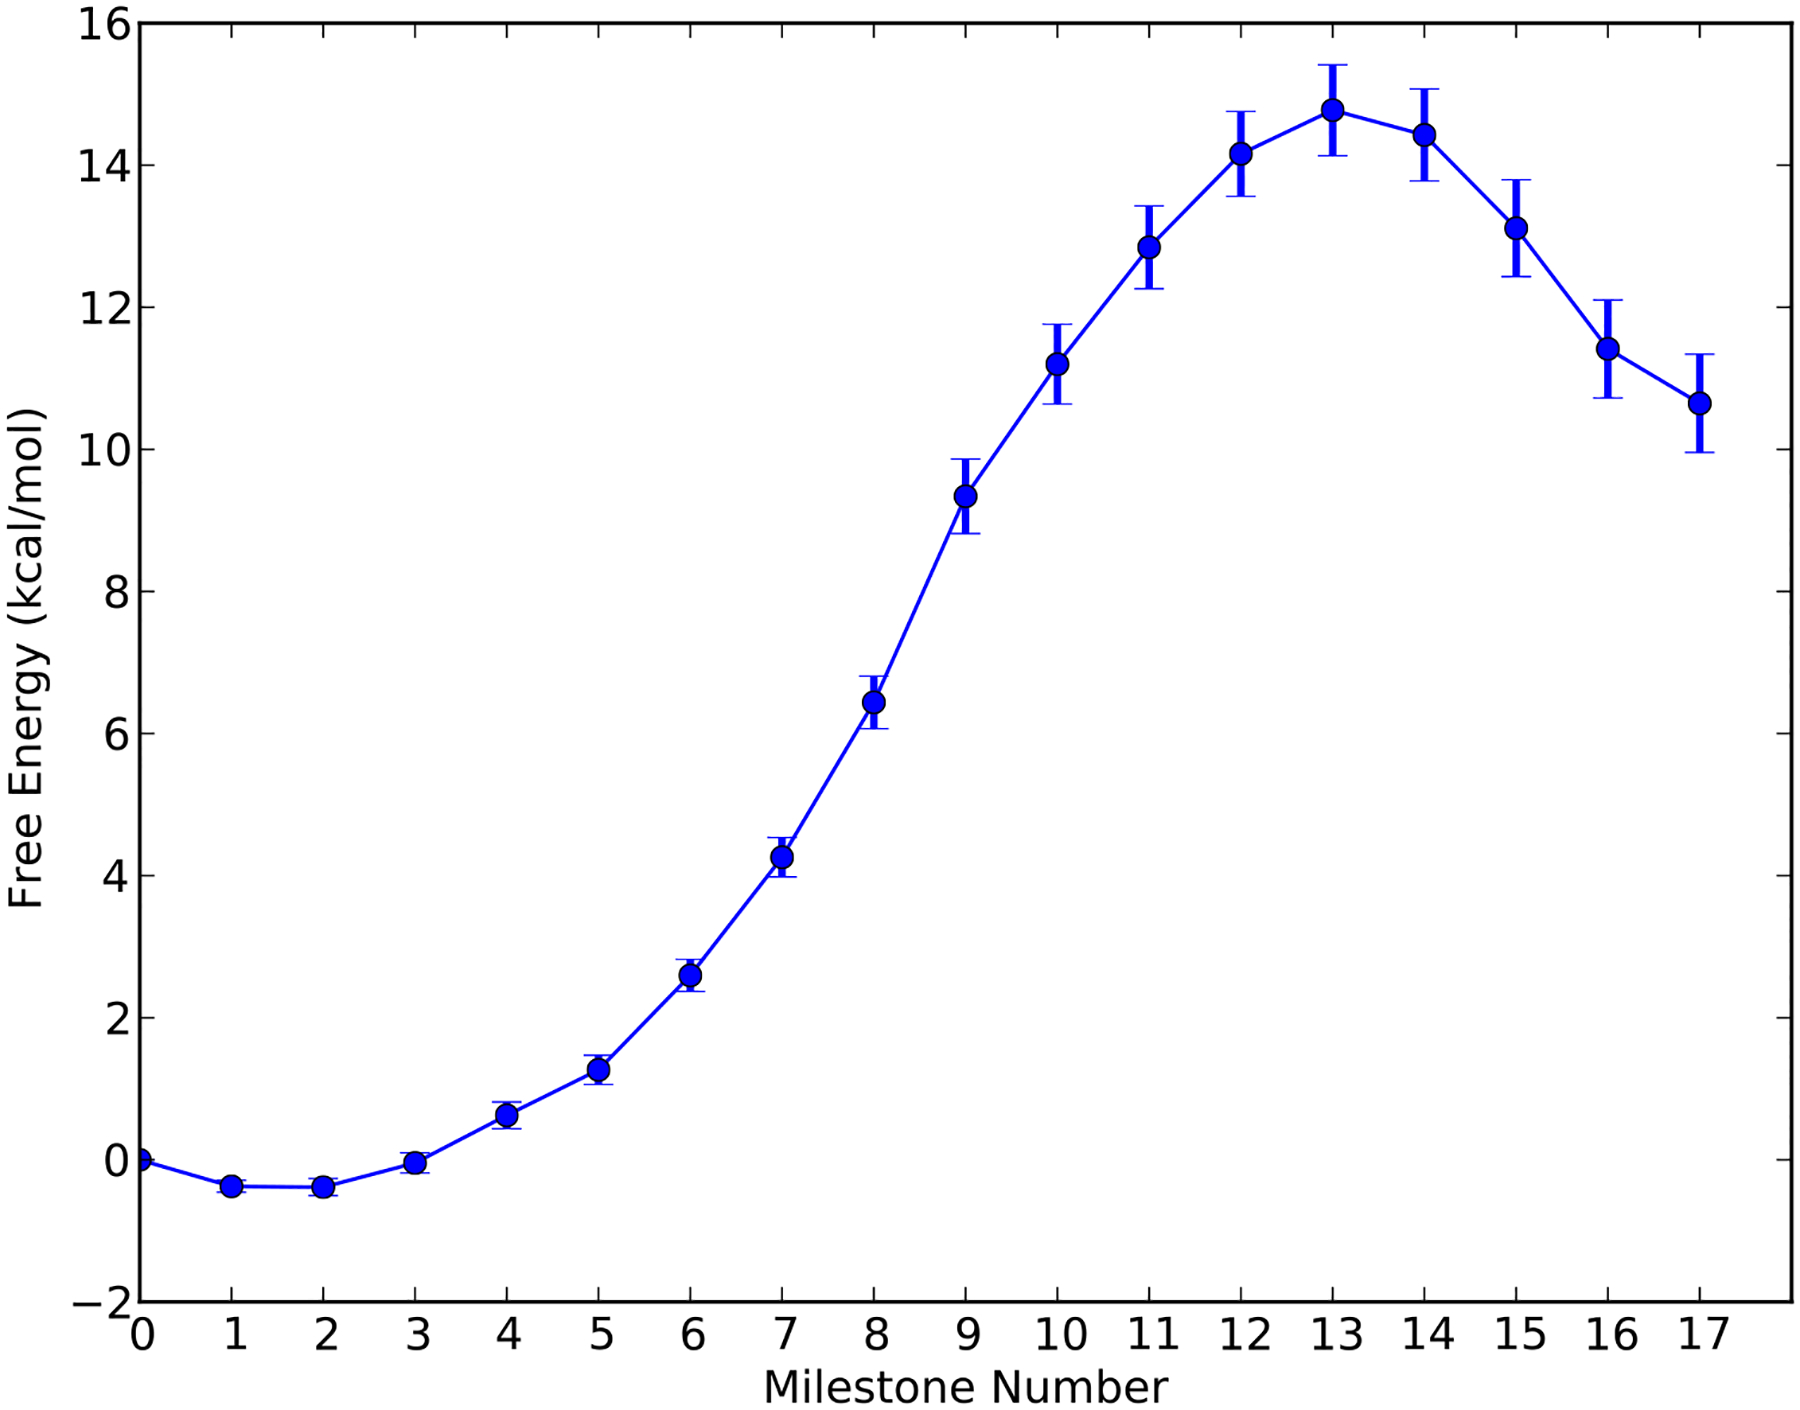
The free energy profile estimated with a single iteration Milestoning for the reaction of HIV RT with the α-thio(Sp) TTP as a function of the milestone index.
Figure 11.
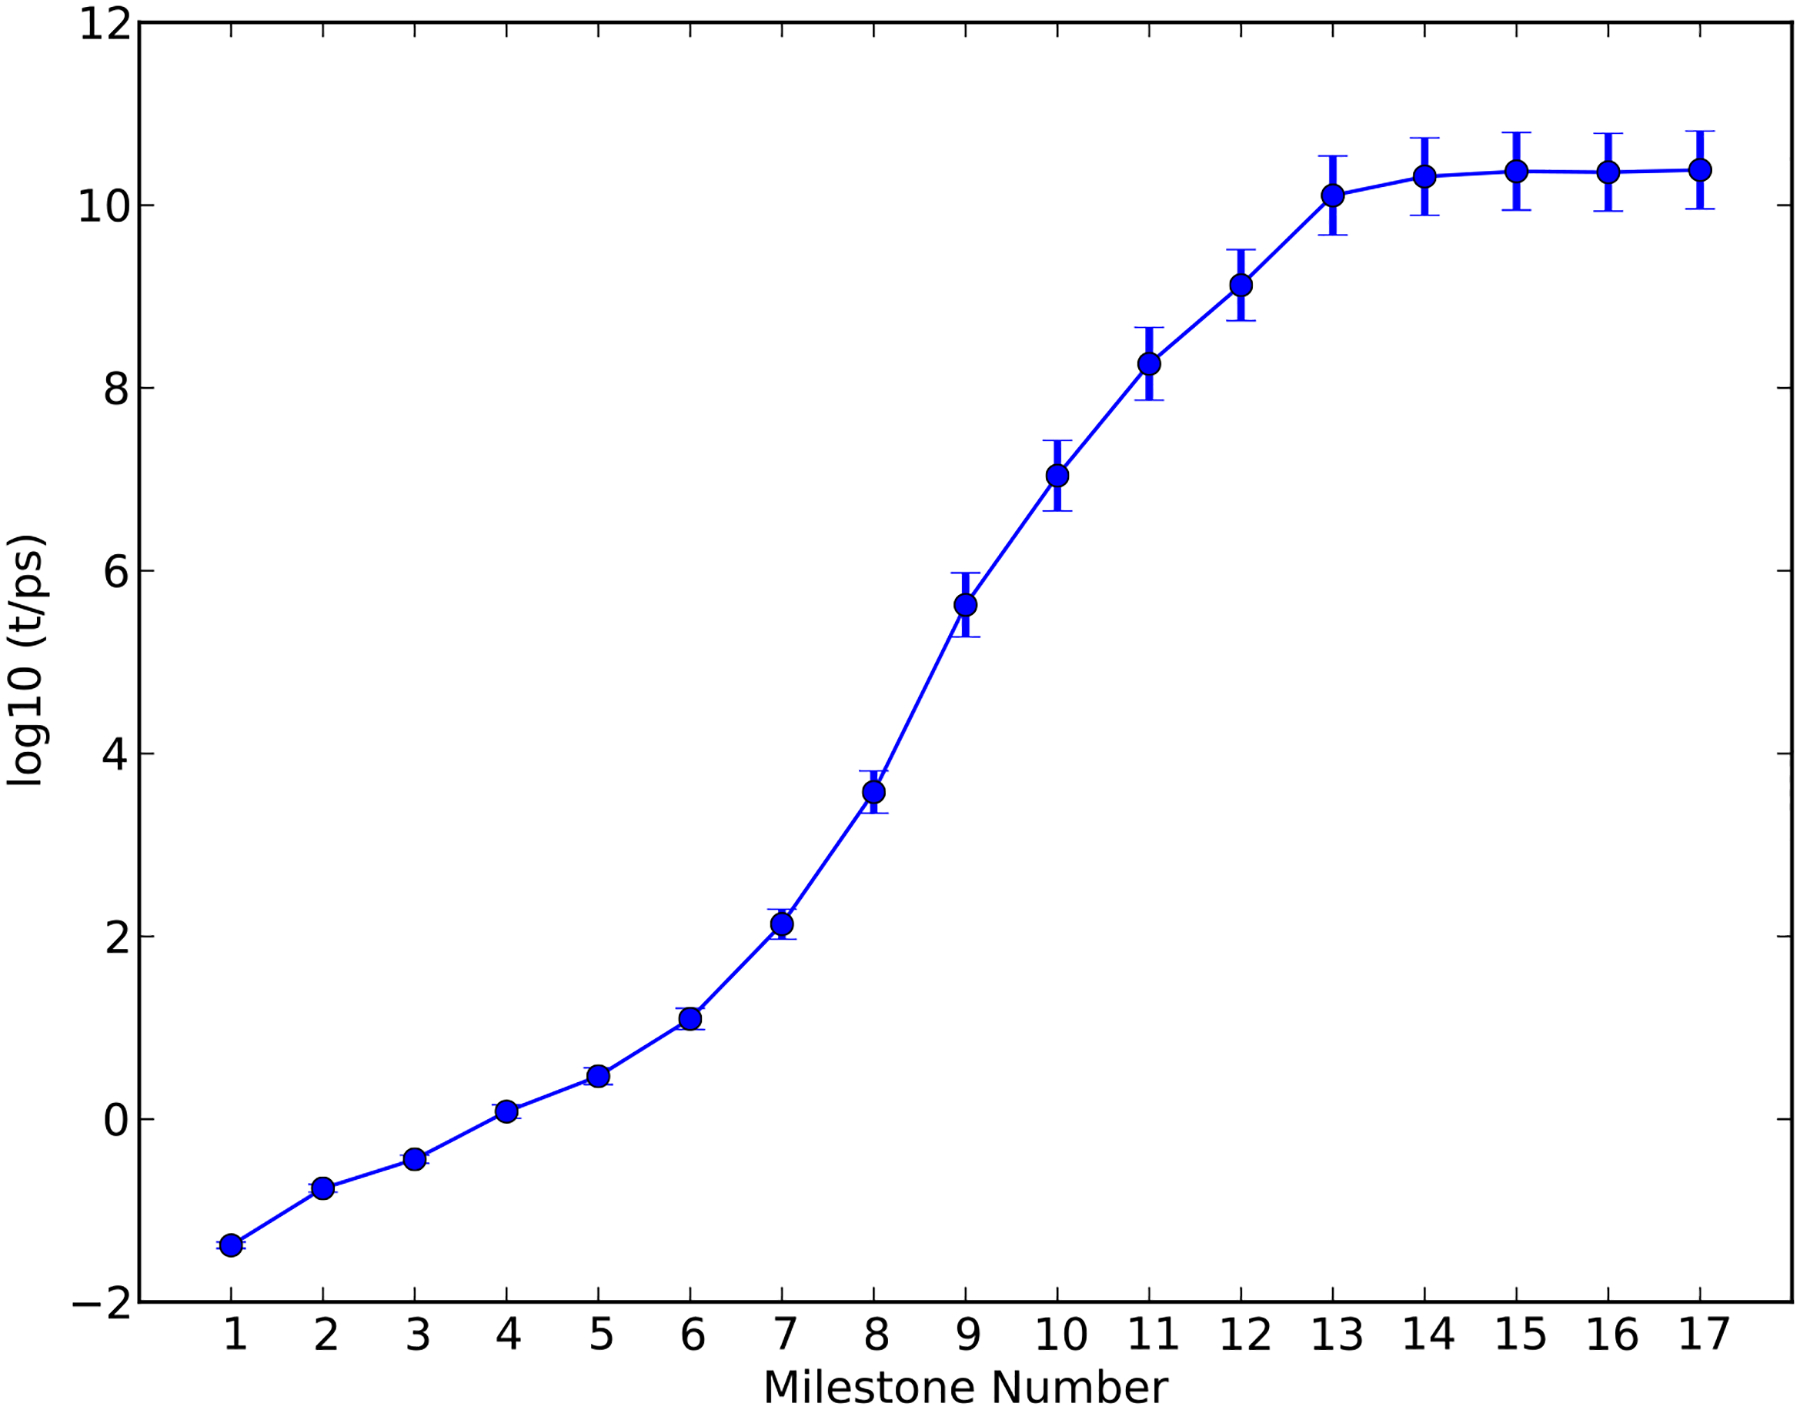
The mean first passage time from the initial milestone (0) to each of the milestones along the reaction coordinate (1–17) calculated from a single iteration Milestoning for the reaction of HIV RT with the α-thio(Sp) TTP as a function of the milestone index.
Table 2.
Summary of free energy calculations and MFPT
| Wild-type TTP | α-thio(Sp) TTP | |
|---|---|---|
| Free energy barrier from umbrella sampling | 14 ± 0.2 kcal/mol | 13.8 ± 0.3 kcal/mol |
| Free energy barrier from Milestoning | 16 ± 0.24 kcal/mol | 14.8 ± 0.64 kcal/mol |
| MFPTfrom Milestoning | 50 – 110 ms | 9 – 65 ms |
3.3. The calculation of relative binding of a correct and incorrect ligand
The FEP result for free energy change of the correct and incorrect substrate (TTP and ATP) weak binding to the protein surface is summarized in Figure 6. The binding free energy of the correct substrate is only 0.7 kcal/mol lower than that of the incorrect substrate. This is in line with a previous study2 showing that there is only a tenfold difference in binding affinity in comparing a correct base pair with a mismatch.
Figure 6.
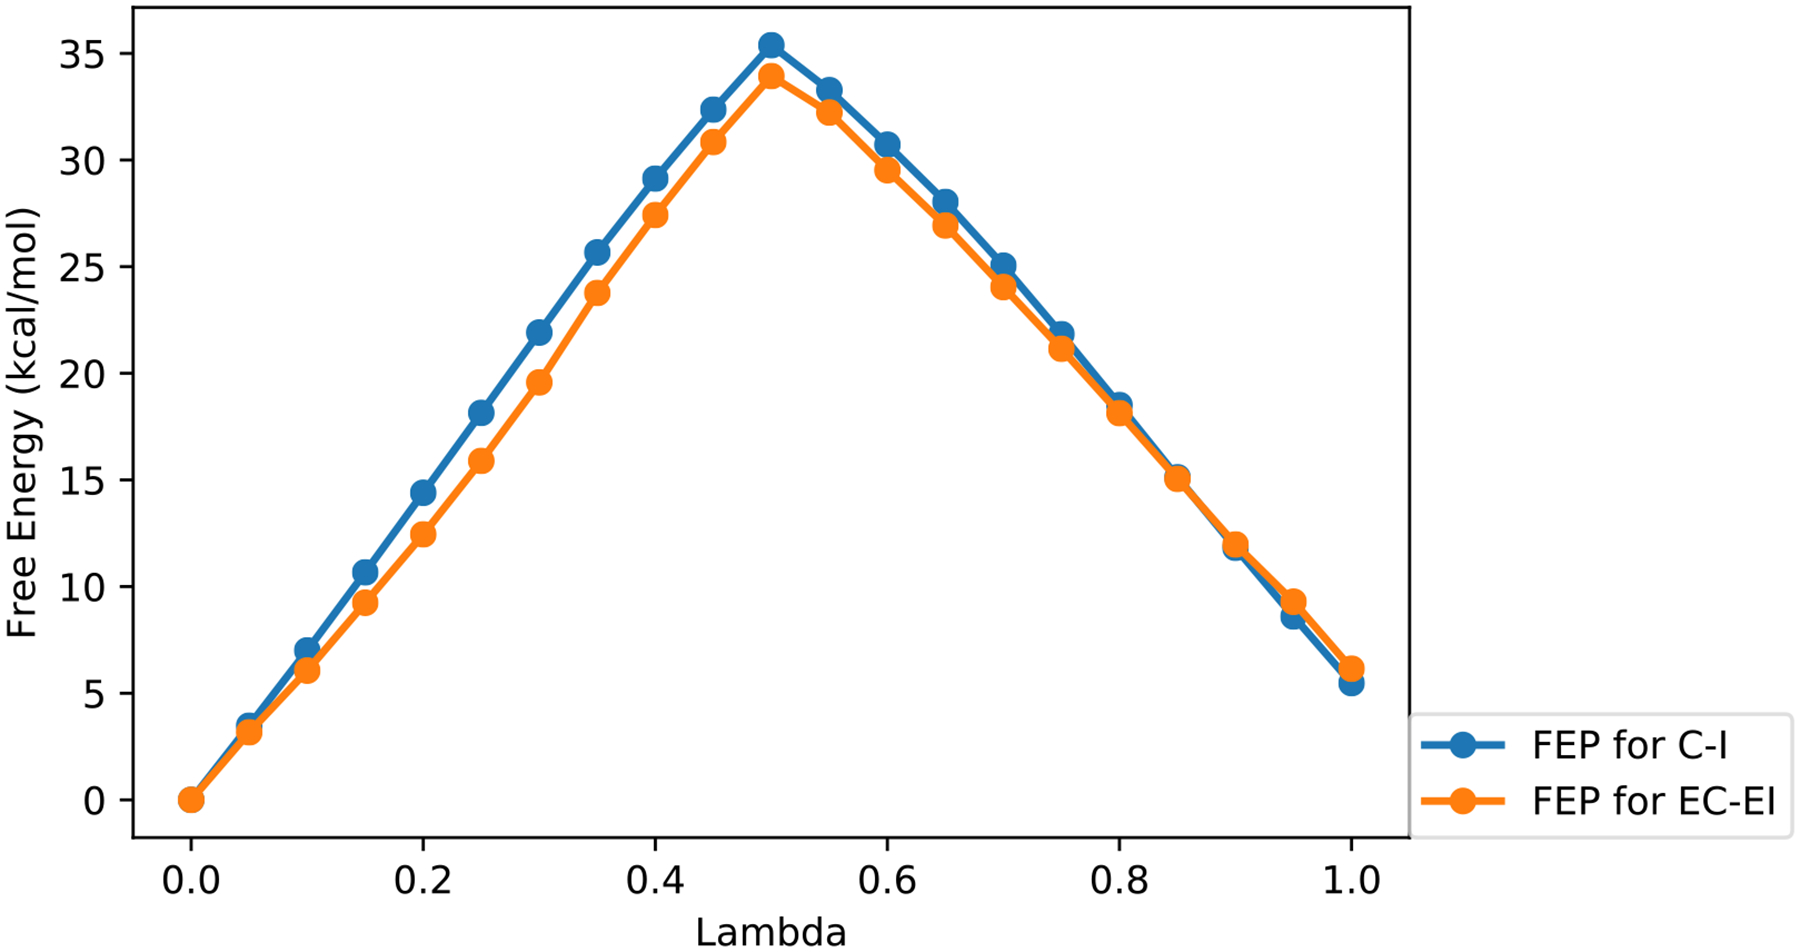
Free energy perturbation (FEP) calculations. We plot the free energy change as a function of the interpolation parameter, lambda, for the initial weak binding of substrates to the protein surface. The blue color denotes the FEP result between the correct and incorrect substrates that are not bound to the protein and are placed in aqueous solution ((C-I) as in Eq. (11)). The orange curve shows the FEP difference between correct and incorrect substrates in the bound state (EC-EI) as in Eq. (11). Lambda=0 corresponds to the correct substrate (TTP). Lambda=1 corresponds to the incorrect substrate (ATP).
In contrast, the conformational change of HIV RT from open to closed state in step 2 of Eq. (2) (studied in our previous work)2 shows a strong selectivity and a backward barrier difference of ~15 kcal/mol. The major determinant of specificity is a function of the kinetic partitioning of the closed state to either bind the correct nucleotide tightly and facilitate catalysis, but to promote release of a mismatched nucleotide. There is little discrimination in the initial binding, consistent with the expected contribution of a single hydrogen bond.
3.4. Replacing oxygen O2A by a sulfur atom
An intriguing variation of the incoming nucleotide is to replace a non-bridging oxygen atom on the α-phosphate by a sulfur atom to form α-thio(Sp) TTP.39–41 Since sulfur is less electronegative than oxygen, it is expected to make the reacting phosphate atom less positive (Figure 2). We model this variant by modifying the O2A of TTP to sulfur and conducted umbrella sampling simulations as before for the new substrate. The free energy profile is shown in Figure 3. The free energy barrier is about 13.8 ± 0.3 kcal/mol, which is almost the same as that of TTP without modification. The transition state structure is shown in Figure 2.
Experimental measurement of the thio effect
To experimentally examine the impact of the thio-substitution on the rate of DNA polymerization, we measured the nucleotide concentration-dependence of the kinetics of incorporation of dATP in comparison to α-thio(Sp) dATP in single turnover kinetics. Figure 12 shows the results of kinetic analysis to define the rates of incorporation. Data were fit according to a minimal model defined previously.43
| (14) |
where EDn represents and enzyme-DNA complex with a primer strand n nucleotides long, dNTP represent a deoxynucleoside triphosphate and PPi represents pyrophosphate. Although the data are fit based on a simple model where the Michaelis constant Km represents the apparent nucleotide binding affinity, we know that nucleotide binding does not come to equilibrium. Rather an initial weak nucleotide binding induces a fast conformational change in the enzyme so the Km is defined by the ratio of kcat/kon where kon = kcat/Km is the apparent second-order rate constant for the two-step nucleotide binding.43, 50, 51
Figure 12.
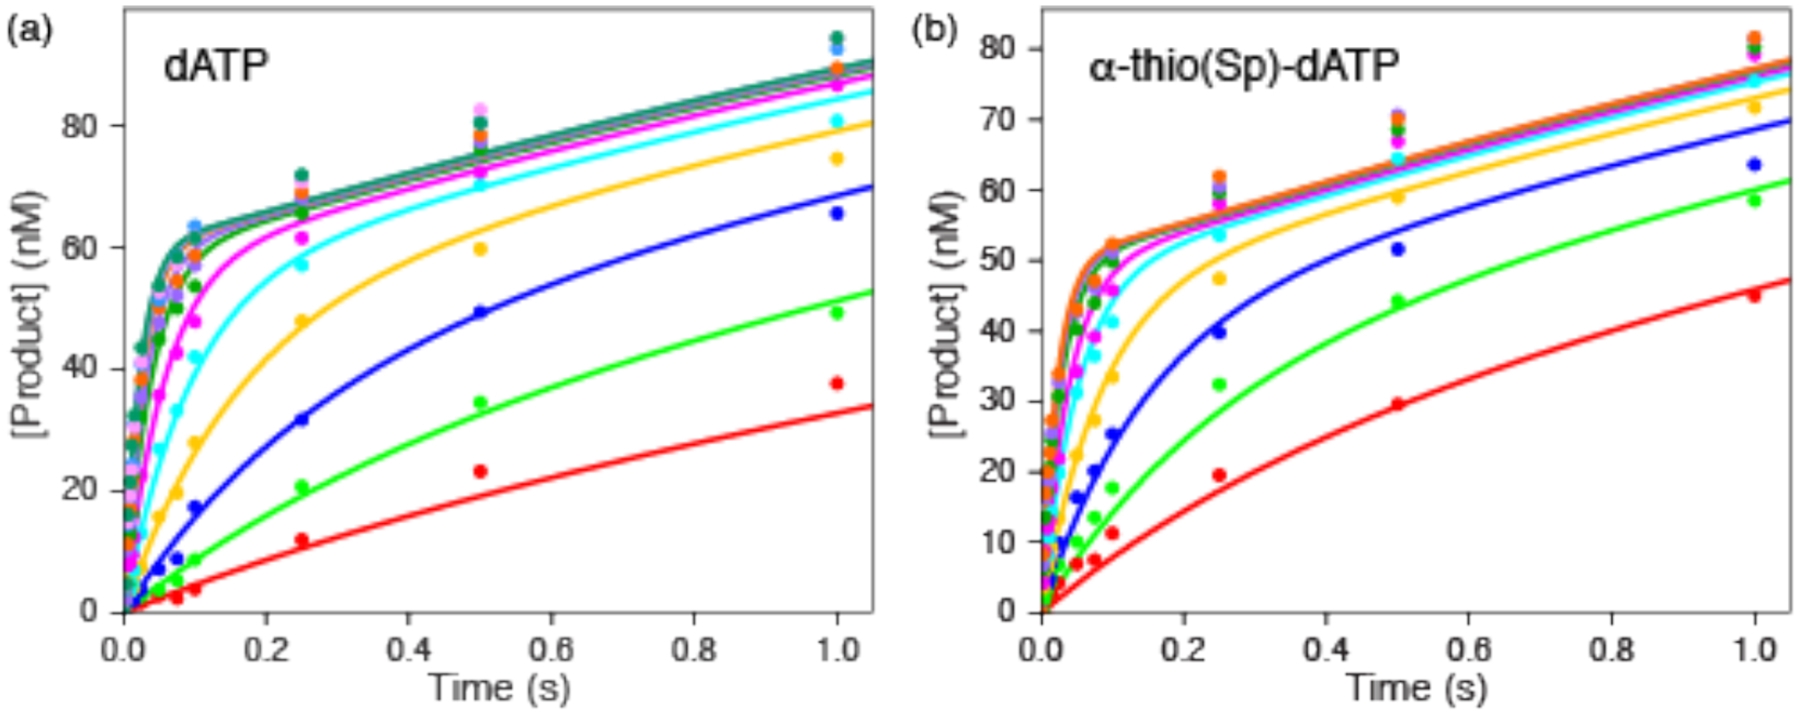
Kinetics of incorporation of dATP and α-thio(Sp) dATP. The time dependence of incorporation of dATP (a) and α-thio(Sp) dATP (b) were measured at various nucleotide concentrations by rapid quench methods as described.43 Data were fit globally to derive estimates for kcat and Km as summarized in Table 3. The smooth lines represent the global fit for each data set as described in the text.
Figure 12 shows the kinetics of incorporation of dATP and α-thio(Sp) dATP. As summarized in Table 3, the rates of incorporation of the two nucleotides are nearly identical, with the observed rate constant for α-thio(Sp) dATP, slightly faster. This very small “inverse elemental effect” is consistent with an associative transition state where formation of the bond precedes breaking the prior bond between PPi and the α-phosphate of the dNTP.41
Table 3.
Summary of kinetic measurements on the thio effect
| Nucleotide | kcat (s−1) | Km (μM) | kcat/Km (μM−1s−1) |
|---|---|---|---|
| dATP | 48 ± 2 | 17 ± 1 | 2.8 ± 0.2 |
| α-thio(Sp) dATP | 61 ± 4 | 35 ± 3 | 1.7 ± 0.2 |
Computation of thio effect
To computationally analyze the impact of the thiol substitution on the mechanism of the chemical reaction we show in Figure 13 the Mulliken charges on a few atoms in the quantum regime for the two substrates. Although partial atomic charges are not uniquely defined and a number of choices are possible, the use of Mulliken population analysis can provide insight on the effect of electronegativity along the reaction pathway. The Mulliken charges were computed at the level of PBE052–54 /def2-SVP using ORCA software.55 The RIJCOSX approximation56 was used to accelerate the calculations. Configurations were chosen from the transition state sampling within the Milestoning calculations. In accord with chemical intuition the oxygen is more electro-negative than the sulfur and it impacts the charge of the phosphate atom bound to it. The modifications of the charges of other atoms were small. Despite the significant changes in the charge of the phosphate with which a new bond is broken and formed, the kinetics of the reactions of TTP and α-thio(Sp) TTP are essentially the same as indicated by the free energy profile in Figure 3. Hence, while the chemical intuition is consistent with quantum mechanical estimates of the Mulliken charges, the enzyme must influence the reaction in more than one way. Additional interactions with the enzyme compensate for the charge variations, yielding indistinguishable rates at the accuracy level of the computations and experiments.
Figure 13.
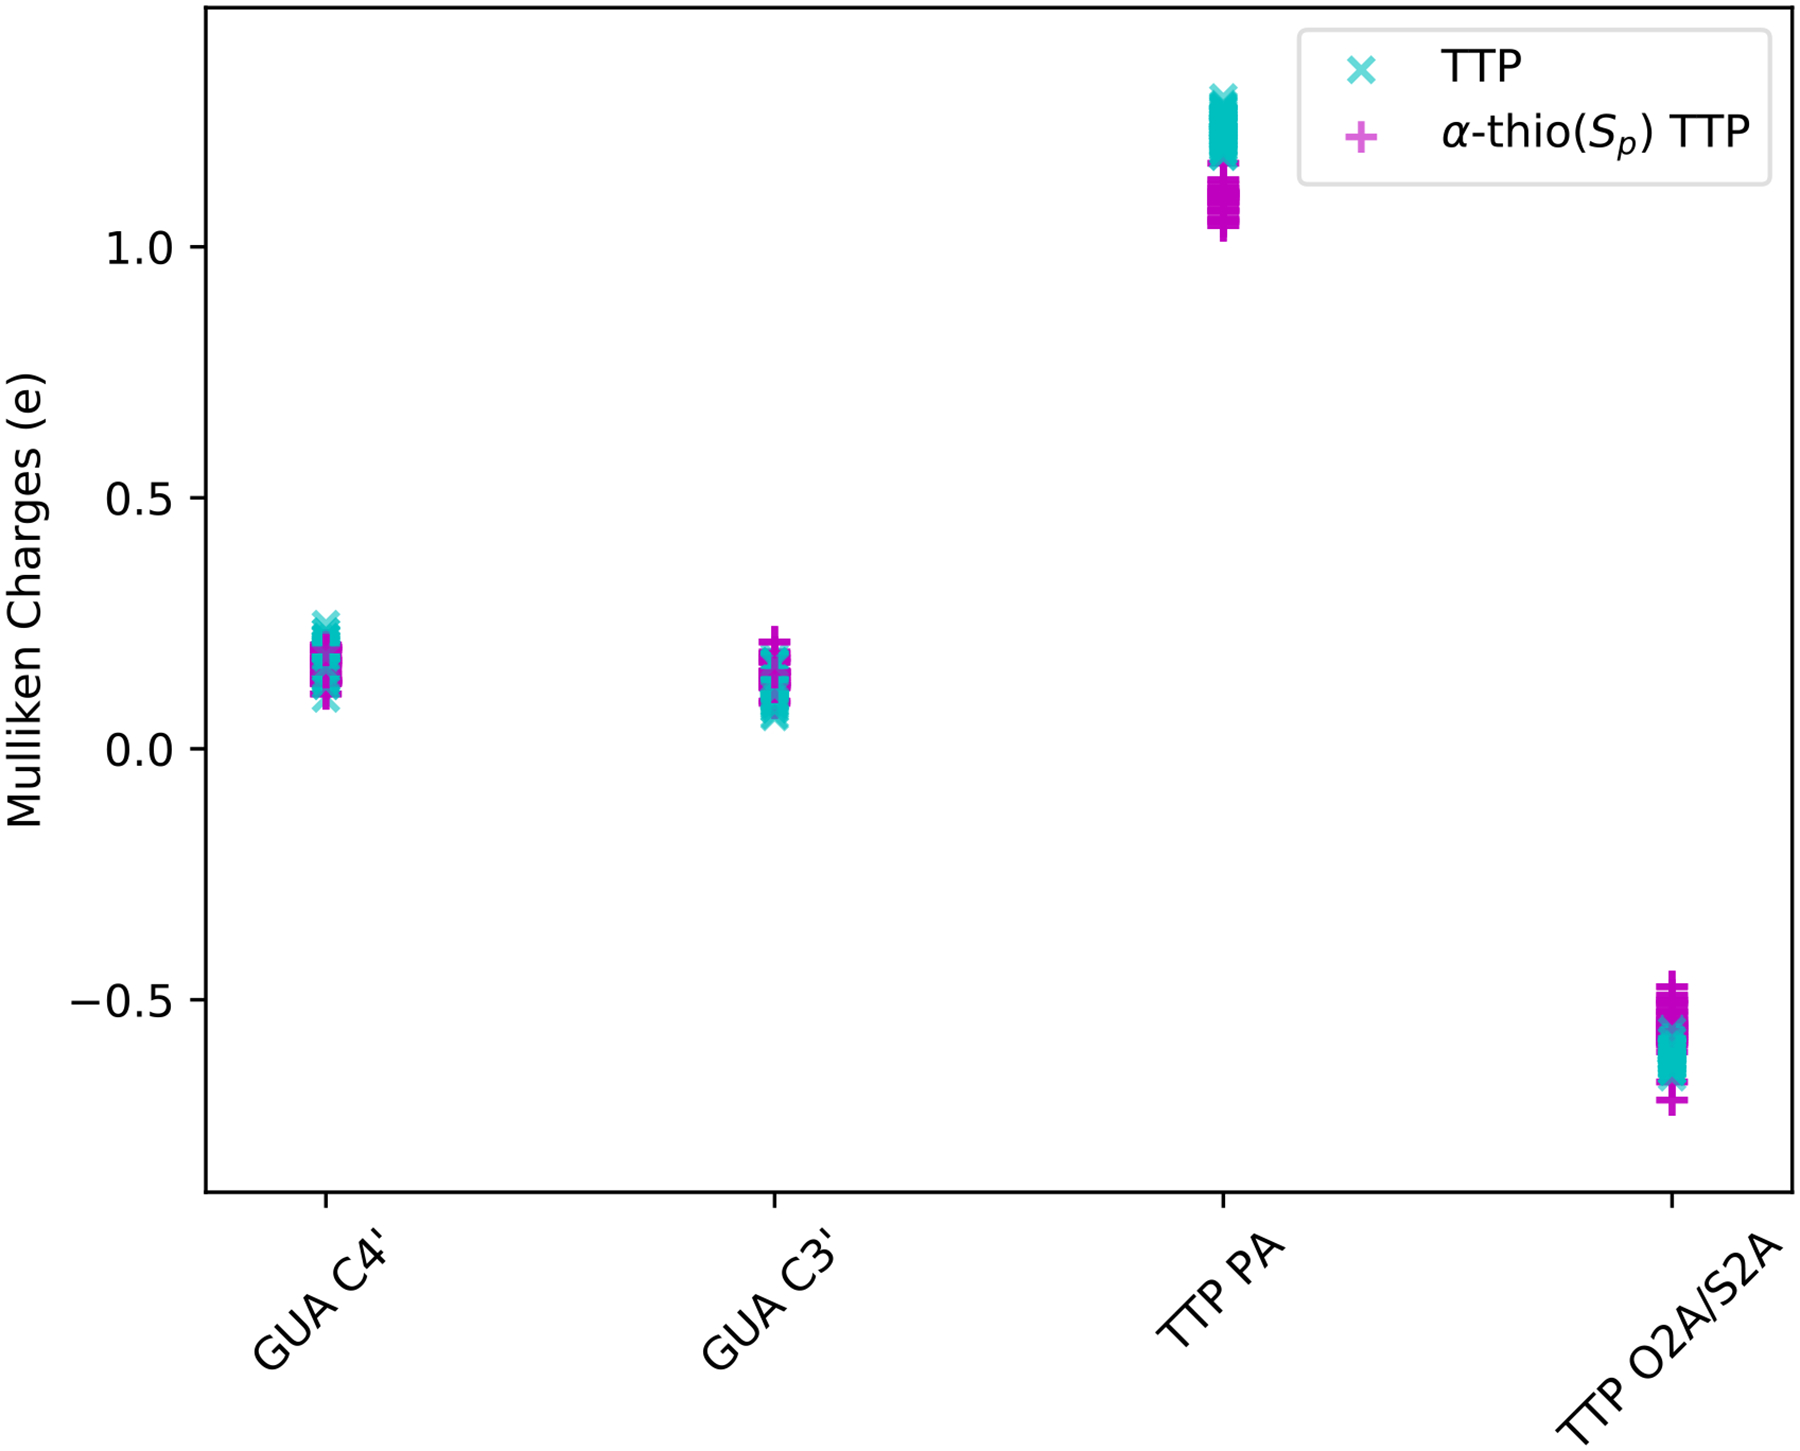
A comparison of the Mulliken charges on a few atoms at the reaction center for the substrates TTP and α-thio(Sp) TTP. The most significant change is at the phosphate, PA, which is attached to the sulfur or oxygen atoms. In the thiol derivative the phosphate is less positively charged as expected from chemical intuition. Configurations were chosen from the transition state of Milestoning calculations. See text for more details. The distance r1 is between the phosphate and the oxygen of the bond to be formed, and r2 is the corresponding distance of the bond to be broken.
To further examine the difference between the two reactions, we examine the geometries of the transition states in Figure 14. We plot three distance distributions sampled in the Milestoning calculations. One distribution is at the transition state. The other two distributions of distances are from two milestones just before and after the transition state. It is clear that the transition state in the thiol derivative is considerably more compressed than that of TTP. Moreover, the distance from between the pair of atoms forming the bond (r1) is quite large at the transition states of both, TTP and α-thio(Sp) TTP. It is significantly larger than the distance of the bond to be broken (r2). Therefore, the transition state seems to be early compared to a symmetric transition state when r1 =r2.
Figure 14.
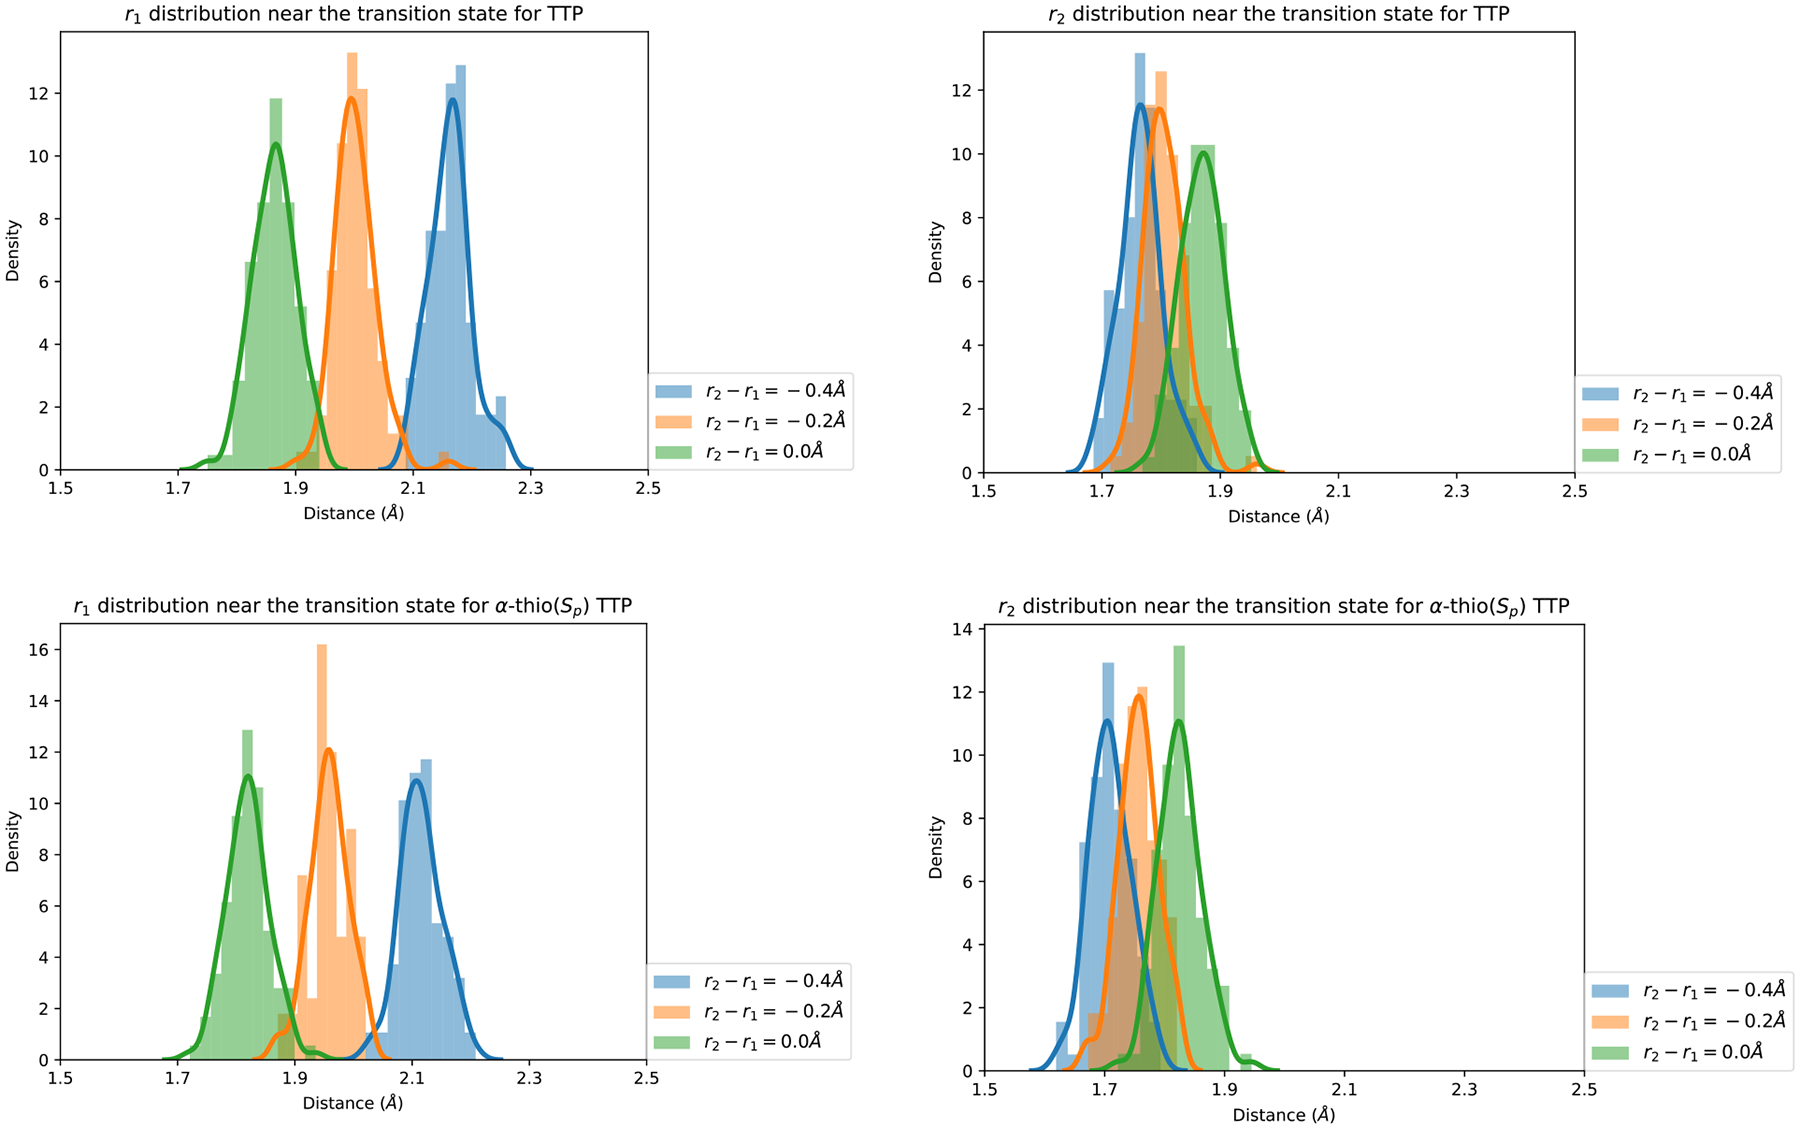
Distribution of coarse variables at the transition states for the two substrates TTP and α-thio(Sp) TTP. The distance r1 is between the phosphate and the oxygen of the bond to be formed, and r2 is the corresponding distance of the bond to be broken. The transition state is at r2 − r1 = −0.2Å which suggests that it is early. See text for more details.
4. Conclusions
We investigate the chemical step of HIV RT catalysis using semi-empirical QM/MM simulations and the Milestoning theory. We find that a single reaction coordinate of the difference between the distances of bond breaking and formation is sufficient to characterize this process. We computed the thermodynamics and kinetics of TTP and α-thio(Sp) TTP substrates and conclude that the difference between TTP and the sulfur substitution is small. Within the accuracy of our calculations (Milestoning in conjunction with the semi-empirical QM method and the CHARMM force field) we do not find significant difference between these two ligands in the heights of the free energy barriers and the MFPTs. Experimental measurements confirm the results of the computer simulations. The chemical insight that suggest significant difference between the two substrate is based on the higher electronegativity of the oxygen. This intuition is consistent with the calculations as the Mulliken charges estimate by quantum calculations are larger for oxygen compared to sulfur. However, the free energy profiles and the rates remain almost identical and bond distances computed for the transition state are consistent with predictions for an associative transition state.41
Eq. (2) outlines several steps in the chemical reaction. We have shown in the past that the conformational transition of the protein, following ligand binding,2 (step 2), determines the specificity of the enzyme. We also examined the step of byproduct release9 (step 4), and illustrate that the process is unusually slow. In the present study we consider the last two steps of Eq. (2): The weak binding of the substrate to the protein surface (step 1), which we demonstrate to have little impact on the selectivity and rate, consistent with the observed tenfold weaker binding of a mismatched nucleotide.43 We also examine the chemical step (step 3) which requires the passage over the highest free energy barrier, and is therefore rate limiting. Interestingly, the second step of conformational transition is the step that control selectivity, even though it is not rate limiting. It is also interesting that the overall barrier heights for the three steps: (i) a protein conformational transition that follows ligand binding2, (ii) the chemical reaction (current work) and (iii) the byproduct release9 have all comparable free energy barriers and time scales, suggesting a fine-tuned system that can respond to environmental changes with more than one mechanism.
Supplementary Material
7. Acknowledgements
This research is supported by grants from The National Institute of Health - GM 59796 and the Welch Foundation F-1896
Footnotes
5 Supporting Information
A table S1 with atom definitions of the QM region.
References
- 1.Michaelis L; Menten M, Die Kinetik Der Invertinwirkung. Biochem. Z 1913, 49, 333–369. [Google Scholar]
- 2.Kirmizialtin S; Nguyen V; Johnson KA; Elber R, How Conformational Dynamics Of DNA Polymerase Select Correct Substrates: Experiments And Simulations. Structure 2012, 20, 618–627. [DOI] [PMC free article] [PubMed] [Google Scholar]
- 3.Herce HD; Garcia AE, Molecular Dynamics Simulations Suggest a Mechanism for Translocation of the HIV-1 TAT Peptide Across Lipid Membranes. Proc. Natl. Acad. Sci. U. S. A 2007, 104, 20805–20810. [DOI] [PMC free article] [PubMed] [Google Scholar]
- 4.Edwards TE; Okonogi TM; Sigurdsson ST, Investigation Of RNA-Protein And RNA-Metal Ion Interactions By Electron Paramagnetic Resonance Spectroscopy: The HIV TAR-Tat Motif. Chem. Biol 2002, 9, 699–706. [DOI] [PubMed] [Google Scholar]
- 5.Aqvist J; Warshel A, Simulation Of Enzyme Reactions Using Valence Bond Force Fields And Other Hybrid Quantum/Classical Approaches. Chem. Rev 1993, 93, 2523–2544. [Google Scholar]
- 6.Matute RA; Yoon H; Warshel A, Exploring The Mechanism Of DNA Polymerases By Analyzing The Effect Of Mutations Of Active Site Acidic Groups In Polymerase. Proteins: Struct., Funct., Bioinf 2016, 84, 1644–1657. [DOI] [PMC free article] [PubMed] [Google Scholar]
- 7.Klvana M; Murphy DL; Jerabek P; Goodman MF; Warshel A; Sweasy JB; Florian J, Catalytic Effects Of Mutations Of Distant Protein Residues In Human DNA Polymerase Beta: Theory And Experiment. Biochemistry 2012, 51, 8829–8843. [DOI] [PMC free article] [PubMed] [Google Scholar]
- 8.Florian J; Goodman MF; Warshel A, Computer Simulations Of Protein Functions: Searching For The Molecular Origin Of The Replication Fidelity Of DNA Polymerases. Proc. Natl Acad. Sci. U. S. A 2005, 102, 6819–6824.15863620 [Google Scholar]
- 9.Atis M; Johnson KA; Elber R, Pyrophosphate Release In The Protein HIV Reverse Transcriptase. J. Phys. Chem. B 2017, 121, 9557–9565. [DOI] [PMC free article] [PubMed] [Google Scholar]
- 10.Li A; Gong SZ; Johnson KA, Rate-Limiting Pyrophosphate Release By HIV Reverse Transcriptase Improves Fidelity. J. Biol. Chem 2016, 291, 26554–26565. [DOI] [PMC free article] [PubMed] [Google Scholar]
- 11.Kirmizialtin S; Johnson KA; Elber R, Enzyme Selectivity Of HIV Reverse Transcriptase: Conformations, Ligands, And Free Energy Partition. J. Phys. Chem. B 2015, 119, 11513–11526. [DOI] [PMC free article] [PubMed] [Google Scholar]
- 12.Huang HF; Chopra R; Verdine GL; Harrison SC, Structure Of A Covalently Trapped Catalytic Complex Of HIV-I Reverse Transcriptase: Implications For Drug Resistance. Science 1998, 282, 1669–1675. [DOI] [PubMed] [Google Scholar]
- 13.Brooks BR; Bruccoleri RE; Olafson BD; States DJ; Swaminathan S; Karplus M, Charmm - A Program For Macromolecular Energy, Minimization, And Dynamics Calculations. J. Comput. Chem 1983, 4, 187–217. [Google Scholar]
- 14.Huang J; Rauscher S; Nawrocki G; Ran T; Feig M; de Groot BL; Grubmuller H; MacKerell AD, CHARMM36: An Improved Force Field For Folded And Intrinsically Disordered Proteins. Biophys. J 2017, 112, 175A–176A. [DOI] [PMC free article] [PubMed] [Google Scholar]
- 15.Jorgensen WL; Chandrasekhar J; Madura JD; Impey RW; Klein ML, Comparison Of Simple Potential Functions For Simulating Liquid Water. J. Chem. Phys 1983, 79, 926–935. [Google Scholar]
- 16.Feller SE; Zhang YH; Pastor RW; Brooks BR, Constant-Pressure Molecular-Dynamics Simulation - The Langevin Piston Method. J. Chem. Phys 1995, 103, 4613–4621. [Google Scholar]
- 17.Andersen HC, Molecular-Dynamics Simulations At Constant Pressure And-Or Temperature. J. Chem. Phys 1980, 72, 2384–2393. [Google Scholar]
- 18.Nose S; Klein ML, Constant Pressure Molecular-Dynamics For Molecular-Systems. Mol. Phys 1983, 50, 1055–1076. [Google Scholar]
- 19.Hoover WG, Canonical Dynamics - Equilibrium Phase-Space Distributions. Phys. Rev. A 1985, 31 (3), 1695–1697. [DOI] [PubMed] [Google Scholar]
- 20.Ryckaert JP; Ciccotti G; Berendsen HJC, Numerical Integration Of Cartesian Equations Of Motion Of A System With Constraints - Molecular Dynamics Of N-Alkanes. J. Comput. Phys 1977, 23, 327–341. [Google Scholar]
- 21.Nam K; Cui Q; Gao JL; York DM, Specific Reaction Parametrization Of The AM1/D Hamiltonian For Phosphoryl Transfer Reactions: H, O, And P Atoms. J. Chem. Theory Comput 2007, 3, 486–504. [DOI] [PubMed] [Google Scholar]
- 22.Kumar S; Bouzida D; Swendsen RH; Kollman PA; Rosenberg JM, The Weighted Histogram Analysis Method For Free-Energy Calculations On Biomolecules .1. The Method. J. Comput. Chem 1992, 13, 1011–1021. [Google Scholar]
- 23.Ferguson AL, BayesWHAM: A Bayesian Approach For Free Energy Estimation, Reweighting, And Uncertainty Quantification In The Weighted Histogram Analysis Method. J. Comput. Chem 2017, 38, 1583–1605. [DOI] [PubMed] [Google Scholar]
- 24.Maragliano L; Fischer A; Vanden-Eijnden E; Ciccotti G, String Method In Collective Variables: Minimum Free Energy Paths And Isocommittor Surfaces. J. Chem. Phys 2006, 125,024106. [DOI] [PubMed] [Google Scholar]
- 25.Elber R, A New Paradigm For Atomically Detailed Simulations Of Kinetics In Biophysical Systems. Q. Rev. of Biophys 2017, 50,e8. [DOI] [PubMed] [Google Scholar]
- 26.Majek P; Elber R, Milestoning Without A Reaction Coordinate. J. Chem. Theory Comput 2010, 6, 1805–1817. [DOI] [PMC free article] [PubMed] [Google Scholar]
- 27.Vanden-Eijnden E; Venturoli M, Markovian Milestoning With Voronoi Tessellations. J. Chem. Phys 2009, 130, 194101. [DOI] [PubMed] [Google Scholar]
- 28.Bello-Rivas JM; Elber R, Exact Milestoning. J. Chem. Phys 2015, 142, 094102. [DOI] [PMC free article] [PubMed] [Google Scholar]
- 29.Fathizadeh A; Elber R, Ion Permeation Through A Phospholipid Membrane: Transition State, Path Splitting, And Calculation Of Permeability. J. Chem. Theory Comput 2019, 15, 720–730. [DOI] [PMC free article] [PubMed] [Google Scholar]
- 30.Cardenas AE; Elber R, Modeling Kinetics And Equilibrium Of Membranes With Fields: Milestoning Analysis And Implication To Permeation. J. Chem. Phys 2014, 141, 054101. [DOI] [PMC free article] [PubMed] [Google Scholar]
- 31.Brajesh N; Fathizadeh A; Templeton C; He P; Arasteh S; Elber R; Buchete N; Levy RM, The Transition Between Active And Inactive Conformations Of Abl Kinase Studied By Rock Climbing And Milestoning. Biochim. et Biophys. Acta, Gen. Subj 2020, 1864, 129508. [DOI] [PMC free article] [PubMed] [Google Scholar]
- 32.Jagger BR; Lee CT; Amaro RE, Quantitative Ranking Of Ligand Binding Kinetics With A Multiscale Milestoning Simulation Approach. J. Phys. Chem. Lett 2018, 9, 4941–4948. [DOI] [PMC free article] [PubMed] [Google Scholar]
- 33.Votapka LW; Amaro RE, Multiscale Estimation Of Binding Kinetics Using Brownian Dynamics, Molecular Dynamics And Milestoning. Plos Computational Biology 2015, 11, e1004381. [DOI] [PMC free article] [PubMed] [Google Scholar]
- 34.Vijaykumar A; ten Wolde PR; Bolhuis PG, Rate Constants For Proteins Binding To Substrates With Multiple Binding Sites Using A Generalized Forward Flux Sampling Expression. J. Chem. Phys 2018, 148, 124109. [DOI] [PubMed] [Google Scholar]
- 35.Vijaykumar A; ten Wolde PR; Bolhuis PG, Generalised Expressions For The Association And Dissociation Rate Constants Of Molecules With Multiple Binding Sites. Mol. Phys 2018, 116, 3042–3054. [Google Scholar]
- 36.Zwanzig RW, High-Temperature Equation of State by a Perturbation Method .1. nonpolar gases. J. Chem. Phys 1954, 22, 1420–1426. [Google Scholar]
- 37.Phillips JC; Braun R; Wang W; Gumbart J; Tajkhorshid E; Villa E; Chipot C; Skeel RD; Kale L; Schulten K, Scalable Molecular Dynamics with NAMD. J. Comput. Chem 2005, 26, 1781–1802. [DOI] [PMC free article] [PubMed] [Google Scholar]
- 38.Essmann U; Perera L; Berkowitz ML; Darden T; Lee H; Pedersen LG, A Smooth Particle Mesh Ewald Method. J. Chem. Phys 1995, 103, 8577–8593. [Google Scholar]
- 39.Johnson KA, Conformational Coupling in DNA-Polymerase Fidelity. Ann. Rev. Biochem 1993, 62, 685–713. [DOI] [PubMed] [Google Scholar]
- 40.Patel SS; Wong I; Johnson KA, Pre-Steady-State Kinetic-Analysis of Processive DNA-Replication Including Complete Characterization of an Exonuclease-Deficient Mutant. Biochemistry 1991, 30, 511–525. [DOI] [PubMed] [Google Scholar]
- 41.Herschlag D; Piccirilli JA; Cech TR, Ribozyme-Catalyzed and Nonenzymatic Reactions of Phosphate Diesters - Rate Effects Upon Substitution of Sulfur for a Nonbridging Phosphoryl Oxygen Atom. Biochemistry 1991, 30, 4844–4854. [DOI] [PubMed] [Google Scholar]
- 42.Stec WJ; Zon G; Uznaǹski B, Reversed-Phase High-Performance Liquid Chromatographic Separation of Diastereomeric Phosphorothioate Analogues of Oligodeoxyribonucleotides and Other Backbone-Modified Congeners of DNA. J. Chromatogr. A 1985, 326, 263–280. [DOI] [PubMed] [Google Scholar]
- 43.Kellinger MW; Johnson KA, Nucleotide-Dependent Conformational Change Governs Specificity And Analog Discrimination By HIV Reverse Transcriptase. Proc. Natl Acad. Sci. U. S. A 2010, 107, 7734–9. [DOI] [PMC free article] [PubMed] [Google Scholar]
- 44.Greenough L; Schermerhorn KM; Mazzola L; Bybee J; Rivizzigno D; Cantin E; Slatko BE; Gardner AF, Adapting Capillary Gel Electrophoresis as a Sensitive, High-Throughput Method to Accelerate Characterization of Nucleic Acid Metabolic Enzymes. Nucleic Acids Res 2016, 44, e15. [DOI] [PMC free article] [PubMed] [Google Scholar]
- 45.Grossfield A http://membrane.urmc.rochester.edu/wordpress/?page_id=131 WHAM: The Weighted Histogram Analysis Method, version 2.09 (access date, April 2020).
- 46.Stevens DR; Hammes-Schiffer S, Exploring the Role of the Third Active Site Metal Ion in DNA Polymerase eta with QM/MM Free Energy Simulations. J. Am. Chem. Soc 2018, 140, 8965–8969. [DOI] [PMC free article] [PubMed] [Google Scholar]
- 47.Ovchinnikov V; Karplus M; Vanden-Eijnden E, Free Energy of Conformational Transition Paths in Biomolecules: The String Method and its Application to Myosin VI. J. Chem. Phys 2011, 134, 085103. [DOI] [PMC free article] [PubMed] [Google Scholar]
- 48.E. W; Ren WQ; Vanden-Eijnden E, Finite Temperature String Method for the Study of Rare Events. J. Phys. Chem. B 2005, 109, 6688–6693. [DOI] [PubMed] [Google Scholar]
- 49.Ma P; Cardenas AE; Chaudhari MI; Elber R; Rempe SB, The Impact of Protonation on Early Translocation of Anthrax Lethal Factor: Kinetics from Molecular Dynamics Simulations and Milestoning Theory. J. Am. Chem. Soc 2017, 139, 14837–14840. [DOI] [PMC free article] [PubMed] [Google Scholar]
- 50.Kirmizialtin S; Nguyen V; Johnson KA; Elber R, How Conformational Dynamics Of DNA Polymerase Select Correct Substrates: Experiments And Simulations. Structure 2012, 20, 618–27. [DOI] [PMC free article] [PubMed] [Google Scholar]
- 51.Kirmizialtin S; Johnson KA; Elber R, Enzyme Selectivity of HIV Reverse Transcriptase: Conformations, Ligands, and Free Energy Partition. J. Phys. Chem. B 2015, 119, 11513–26. [DOI] [PMC free article] [PubMed] [Google Scholar]
- 52.Perdew JP; Emzerhof M; Burke K, Rationale for Mixing Exact Exchange with Density Functional Approximations. J. Chem. Phys 1996, 105, 9982–9985. [Google Scholar]
- 53.Perdew JP; Burke K; Ernzerhof M, Generalized Gradient Approximation Made Simple. Phys. Rev. Lett 1996, 77, 3865–3868. [DOI] [PubMed] [Google Scholar]
- 54.Adamo C; Barone V, Toward Reliable Density Functional Methods Without Adjustable Parameters: The PBE0 Model. J. Chem. Phys 1999, 110, 6158–6170. [Google Scholar]
- 55.Neese F, The ORCA Program System. Wiley Interdisciplinary Reviews-Computational Molecular Science 2012, 2, 73–78. [Google Scholar]
- 56.Kossmann S; Neese F, Comparison of Two Efficient Approximate Hartee-Fock Approaches. Chem. Phys. Lett 2009, 481, 240–243. [Google Scholar]
Associated Data
This section collects any data citations, data availability statements, or supplementary materials included in this article.


