

Abstract
cGAS is a sensor of cytosolic DNA and responds equally to exogenous and endogenous DNA. After recognition of cytosolic dsDNA or ssDNA, cGAS synthesizes the second messenger 2′3′-cGAMP, which then binds to and activates STING. STING plays an essential role in responding to pathogenic DNA and self-DNA in the context of autoimmunity. In pathologic conditions, such as stroke or hypoxia-ischemia (HI), DNA can gain access into the cytoplasm of the cell and leak from the dying cells into the extracellular environment, which potentially activates cGAS/STING. Recent in vivo studies of myocardial ischemia, traumatic brain injury and liver damage models suggest that activation of cGAS/STING is not only a side-effect of the injury, but it can also actively contribute to cell death and apoptosis. We found, for the first time, that cGAS/STING pathway becomes activated between 24 and 48h after HI in a 10-day old rat model. Silencing STING with siRNA resulted in decreased infarction area, reduced cortical neurodegeneration, and improved neurobehavior at 48h, suggesting that STING can contribute to injury progression after HI. STING colocalized with lysosomal marker LAMP-1 and blocking STING reduced the expression of Cathepsin B and decreased the expression of Bax and caspase 3 cleavage. We observed similar protective effects after intranasal treatment with cGAS inhibitor RU.521, which were reversed by administration of STING agonist 2’3’-cGAMP. Additionally, we showed that LINE-1 retrotransposon, a potential upstream activator of cGAS/STING pathway was induced at 48h after HI, which was evidenced by increased expression of ORF1p and ORF2p proteins and increased LINE-1 DNA content in the cytosol. Blocking LINE-1 with the nucleoside analog reverse-transcriptase inhibitor (NRTI) Stavudine reduced infarction area, neuronal degeneration in the cerebral cortex, and reduced the expression of Bax and cleaved caspase 3. Thus, our results identify the cGAS/STING pathway as a potential therapeutic target to inhibit delayed neuronal death after HI.
Keywords: cGAS, STING, neurodegeneration, LINE-1, apoptosis
Introduction
Neonatal hypoxic ischemic encephalopathy (HIE) is a devastating disease affecting 4 of 1000 full term infants [1,2]. Neonatal HIE has detrimental effects on the developing brain and is among the leading causes of mortality and morbidity in infants [3,4]. Despite advances in modern technology and an increased understanding of fetal and neonatal pathologies, neonatal HIE still remains a serious condition that causes significant mortality and long-term disability such as mental retardation, cerebral palsy, and learning disabilities [5–7].
Hypoxia-ischemia (HI) is characterized by the accumulation of dead cells, compromised endogenous DNA metabolism, and DNA leakage into the cytosol [4, 8]. Presence of DNA in the cytosol constitutes a damage-associated molecular pattern (DAMP) and activates DNA recognition pathways. Identified in 2013, cytosolic DNA sensor 2′–3′ cyclic GMP–AMP (cGAMP) synthase (cGAS) binds to DNA, which leads to its activation. Following activation, cGAS undergoes a conformational change of the catalytic center and converts guanosine triphosphate (GTP) and adenosine triphosphate (ATP) into the second messenger - 2’3′-cGAMP [9]. 2’3′-cGAMP molecule is an endogenous ligand which activates the key adaptor protein - Stimulator of Interferon Genes (STING, TMEM173) [10,11], thereby leading to the production of inflammatory cytokines and chemokines [12]. It was shown that cGAMP can directly activate STING transcription [13]. A fundamental role of cGAS/STING pathway is to start the innate immune response after activation by a viral DNA, and to target an infected cell into an apoptotic cell death pathway, preventing the spread of infection [14,15]. However, as cGAS has no sequence specificity for DNA, it can also be activated by endogenous DNA [16–18]. Although separation of genomic DNA from the cytoplasm usually prevents an unintended activation of cytosolic cGAS–STING signaling in physiologic conditions, pathological conditions where DNA leaks to the cytosol can trigger detrimental responses [19]. Interestingly, recent in vivo studies demonstrated that STING contributes to apoptosis in alcoholic and non-alcoholic liver disease [20,21] and plays a detrimental role in myocardial ischemia [22,23] and traumatic brain injury [24].
In vitro studies on human myeloid and HEK293T cells revealed that activated STING traffics from the ER to the lysosome, where it triggers membrane permeabilization and lysosomal cell death (LCD) [25], characterized by rupture of lysosomes and leakage of lysosomal content into the cytosol. This form of cell death shows both apoptotic and necrotic features, and Cathepsin B release is responsible for cell autodigestion [26]. Cathepsin B is a major cysteine protease in brain tissues, expressed mainly in neurons and showed to promote neurodegeneration through apoptosis and necrosis [27,28]. STING-mediated cell death displayed apoptotic features, such as the cleavage of Bid and the activation of caspase 3. Pharmacological inhibition of lysosome function by bafilomycin or endo-lysosomal flux by thapsigargin potently protected HEK293T cells from STING-induced cell death [25]. However, the role of cGAS/STING pathway in HI or any stroke-related model has not yet been explored.
STING agonists are planned to be used in neonate patients to enhance immune responses against DNA viruses [29]. In this context, reports about proapoptotic function of STING are of major interest and concern, as apoptosis is also involved in normal brain development, and the neonatal brain may be highly susceptible to this form of cell death [30].
Previous studies showed that the cGAS-STING pathway can be activated by Long Interspersed Element class 1 (LINE-1, L1)-derived cytoplasmic DNA [31–34]. LINE-1 is the most abundant retrotransposon in mammalian genomes - LINE-1 DNA sequences comprise more than 17% of the human and rat DNA [35]. Many of these sequences are in the form of short 5′ truncated insertions, and only part of them are currently active [36]. Generally, full-length LINE-1 elements are ~6–8 kb in length, comprising a 5′-untranslated region (5′UTR), two open reading frames (ORF1 and ORF2), and a 3′UTR ending in a poly(A) tail [37]. ORF1 encodes a 40-kDa protein (ORF1p) with RNA chaperone activity, while ORF2 encodes a 150-kDa protein (ORF2p) which possesses the reverse transcriptase (RT) and endonuclease functions. LINE-1 expression and activity has been connected with neurodegeneration in adult dopaminergic neurons and embryonic midbrain neurons, and is hypothesized to contribute to neurodegenerative diseases [38,39]. We hypothesized that the cGAS/STING pathway is activated in the neonatal rat HI model and it contributes to neuronal death, and silencing STING or blocking cGAS with RU.521 will inhibit lysosomal cell death, which will be reversed by administration of STING agonist 2’3′-cGAMP. Additionally, we hypothesized that LINE-1 is an upstream target that can activate the cGAS/STING pathway after HI and that blocking LINE-1 with NRTI Stavudine can inhibit neuronal death after HI.
Materials and Methods
Animals
All experimental protocols were approved by the Institutional Animal Care and Use Committee of Loma Linda University (IACUC) in accordance with the NIH Guide for the Care and Use of Laboratory Animals. All studies comply with the ARRIVE guidelines. Sprague Dawley rat mothers, with litters of 12 pups, were purchased from Envigo (Livermore, CA). 219 ten-day-old unsexed (sex information was not collected for this study) rat pups weighing 16–20g were subjected to hypoxia-ischemia, 28 pups died during hypoxia (mortality rate 12.7%) and therefore a total of 191 pups were used in experiments. All animals were housed in a controlled humidity and temperature room with a 12h light and dark cycle and raised with free access to breast milk, water and food.
HIE model
The animal model used in this study is the standard HIE Rice-Vannucci model, with some modification, as previously described [40]. Briefly, ten-day old neonatal rat pups were placed in a temperature-controlled chamber for induction of general anesthesia. The animals were anesthetized with 3% isoflurane gas in air and maintained at 2% isoflurane in air. Throughout the surgical and postoperative period, the temperature was controlled with heating blankets and incubators. After induction of anesthesia the neck of the rats was exposed and skin prepared by swabbing the neck with alcohol. Next a small midline incision on the anterior neck was made with a No. 11 blade surgical knife. Using gentle blunt dissection, the right common carotid artery was isolated and gently separated from the surrounding structures. The carotid artery was ligated with 5-O surgical suture, and cut between the ligatures. All bleeding was controlled with gentle pressure and electrocautery as needed. After ligation of the carotid artery, the surgical field was irrigated with several drops of saline, dried, and the skin was closed with sutures. All surgeries were performed aseptically and lasted no longer than 8 minutes. After the surgical procedure was completed, the rats were allowed to recover for 1 hour. Then they were placed in an airtight jar partially submerged in a 37 °C water bath to maintain a constant temperature. A gas mixture of 8% oxygen and 92% nitrogen was delivered into the jar and the rat pups were exposed to hypoxia for 150 minutes. Thereafter, the animals were returned to their mothers. Animals were monitored daily post-op for any bleeding, swelling, pain or distress. For the sham animals, common carotid artery was exposed without ligation or cutting, and pups did not undergo the hypoxic exposure.
Drug administration
RU.521 (4.5, 45, 450 μg/kg, RU5-41-01, InvivoGen, USA) or vehicle (1%DMSO+corn oil) were administered intranasally at 2, 24 h and 48h after HI. 2’3’-cGAMP (500 μg/kg, GA3-40-07, InvivoGen, USA) or vehicle (phosphate-buffered saline, PBS) were administered intranasally at 2, 24h and 48h after HI. Stavudine (500 μg/kg, 147951, Cayman, USA) or vehicle (PBS) were administered intranasally at 2 and 24h after HI. For intranasal administrations a total of 5 μl with 1.25 μl of drug or vehicle per drop was given every 2 min in alternating nares under isoflurane anesthesia.
In vivo RNA interference (RNAi)
siRNA was used to silence STING. After the rats were anesthetized with isoflurane, they were fixed in a stereotactic frame in a prone position. A 10-μl micro syringe (Hamilton Co, USA) was inserted at 1.5 mm posterior, 1.5 mm lateral to the bregma and 2.0 mm deep from the skull surface into the right lateral ventricle. At 48h before HI induction, 2 μl of in vivo validated [41] SMARTpool Accell STING siRNA (300 pmol, E-104499-00-0005, RNA Accessions: NM_001109122.1, XM_006254601.3, Dharmacon, USA) or control siRNA (300 pmol, Accell Non-targeting siRNA, D-001910-01-05, Dharmacon, USA) was injected slowly over 5 min. The needle was left in place for an additional 10 min and then slowly withdrawn over 5 min to prevent backflow. For siRNA visualization, Accell Red DY-547-labeled siRNA (D-001960-01-05, Dharmacon, USA), and for validation of STING knockdown, STING siRNA or control siRNA was injected to P10 rats which were sacrificed 48h later.
Infract area measurements
As previously described, 2,3,5-triphenyltetrazolium chloride monohydrate (TTC) staining was used to evaluate the infarct area [42]. Rat pups were anesthetized with isoflurane and perfused transcardially with 20 ml of 4 °C PBS. The brains were removed and sectioned into coronal brain slices (2 mm) in a rat brain matrix. The slices were stained with 1% TTC (Sigma Aldrich Inc., USA) solution for 5 min, washed in PBS, and then they were digitally photographed. Un-infarcted areas of the ipsilateral hemispheres and total area of the contralateral hemispheres were traced and analyzed using Image J software (NIH, USA). The percentage of infarcted area for each slice was calculated as following formula: [(total area of contralateral hemisphere) - (area of un-infarcted area of ipsilateral hemisphere)]/(total area of contralateral hemisphere × 2).
Neurobehavioral test- Negative geotaxis
Negative geotaxis test was performed at 1h before and 24, 48 h and 72h post HI for evaluating short-term neurological function [43]. Animals which were sacrificed at 48h after HI, were tested at 1h before and 24h and 48 h after HI. The pups were put head downward on a 45-degree sloping board, the time taken for the pups to turn their body around by 180° and face upward was recorded. The maximum testing time was 60 s. Whenever a rat failed to turn its body around or failed to stay on the board, a time of 60s was recorded.
Western blotting
Whole cell fraction was used for time-course and pathway analysis experiments. Western blot was performed as previously described [44]. After TTC staining and image recording, brain slices were separated immediately into the contralateral and ipsilateral cerebrums, flash frozen in liquid nitrogen and stored at −80 °C freezer until lysis. The right/ipsilateral hemisphere tissue was homogenized in RIPA lysis buffer (Santa Cruz Biotechnology, USA) with a protease inhibitor cocktail, centrifuged at 14,000 g at 4 °C for 20 min, and then the supernatant was collected. After protein concentration assay (DC™ Protein Assay, Bio-Rad, USA), equal amounts of protein were loaded into a 7.5%–12% sodium dodecyl sulfate–polyacrylamide (SDS-PAGE) gel for electrophoresis and then transferred to a nitrocellulose membrane, which was blocked with 5% non-fat blocking grade milk (Bio-Rad, USA) for 1 h at room temperature. The membranes were incubated with the primary antibody overnight at 4 °C. The antibodies used are presented in Table S1. Goat anti-β-actin was used on the same membrane as loading control. GAPDH was used as a loading control for cytosolic fraction, and Lamin A/C was used for nuclear fraction. The membranes were then incubated with appropriate secondary antibodies (1:3000, Millipore Sigma, USA) for 1h at room temperature. Immunoreactive bands were visualized with an ECL Plus kit (American Bioscience, UK) followed by exposure to X-ray films and analyzed using Image J software (NIH, USA).
Cytosolic and nuclear fractionation
Cytosolic and nuclear fractions were isolated immediately after euthanasia using NE-PER™ Nuclear and Cytoplasmic Extraction Reagent (78833, Thermofisher, USA) according to the manufacturer’s instructions. Briefly, the brains were cut into small tissue pieces and placed in a microcentrifuge tube, washed with PBS and centrifuged at 500g for 5 minutes. Cell pellet was homogenized with CER I buffer with pestle homogenizer, vortexed and incubated on ice for 10 minutes. Then the CER II buffer was added and it was vortexed and centrifuged at 16000g for 5 minutes. The supernatant was used as a cytoplasmic fraction. The pellet was then suspended in NER buffer, vortexed and centrifuged at 16000g for 10 minutes. Supernatant was collected as a nuclear fraction.
DNA isolation and measurement of LINE-1 DNA.
Total and cytosolic DNA from the cytoplasmic fraction were purified with DNeasy kit (Qiagen). Briefly, for isolation of cytosolic DNA, rat brain homogenate was mixed with proteinase K and ethanol and pipetted into a mini spin column, which was followed by a series of centrifugations and purification. For the isolation of total DNA, rat brain was cut into small pieces, incubated with proteinase K at 56°C, and mixed with ethanol, which was followed by centrifugations and purification in a mini spin column. LINE-1 Retrotransposon content was measured by qPCR and normalized to the mitochondrial gene for cytochrome B (mtCytb) [33,45]. 50 ng of DNA was used in each PCR reaction mixture. The sequences of the primers used are provided in Table S2. Primers were designed using BLAST Primers tool and LINE-1 database http://l1base.charite.de [46].
RNA isolation and quantitative RT-PCR
Total RNA was extracted using the Qiazol reagent (Qiagen, USA) and 2 μg of RNA was subjected to reverse transcription with QuantiTect Reverse Transcription Kit (Qiagen, USA), following the manufacturer’s instructions. Transcript and DNA levels were measured using The QuantiTect SYBR Green PCR Kit (Qiagen) according to the manufacturer’s instructions. The sequences of the primers used are provided in Table S2. PCR was done in duplicate or triplicate and threshold cycle numbers were averaged for each sample. Successful amplification of products was evidenced by the amplification curve, the dissociation curve, and visualization of the qPCR products on agarose gels (Fig. S1). GAPDH was used for normalization of transcript levels and mtCytb was used for normalization of relative DNA level. A relative fold change in expression was determined using the comparative cycle threshold method (2 −ΔΔCT). Each PCR reaction mixture consisted of 20 ng of template cDNA, specific primers (Table S2) and QuantiTect SYBR Green PCR Master Mix for a total volume of 25 μl.
For relative quantification of STING and LINE-1 transcript levels in cerebral cortex, hippocampus, liver and spleen in P10 and adult rats, RNA was isolated from the tissues of P10 and 10-week old female and male rats, weighing ±200g and ±300g, respectively.
ELISA
Ipsilateral hemispheres were removed and lysed with RIPA lysis buffer on ice, and then centrifuged at ≥ 600 × g at 4°C for 15 minutes. Supernatants were then collected, and 2’3’-cGAMP level was measured with the enzyme-linked immunosorbent assay (ELISA) kit (K067-H1, Arbor Assays, USA) according to manufacturer’s instructions.
Tissue processing
Rats were deeply anesthetized and transcardially perfused with 4 °C PBS and 10% formalin. The brains were removed and fixed with 10% formalin for 24 h, and then immersed in 30% sucrose until they sank. After being embedded into OCT compound (Scigen Scientific, USA) and frozen, serial 10 μm thick coronal sections through the infarct region were cut sequentially at −20 °C with a cryostat (LM3050S; Leica Microsystems, Germany) for double immunostaining and Fluoro-Jade C.
Immunofluorescence staining
The prepared sections were permeabilized with 0.3% Triton X-100 for 30 min at room temperature and then blocked with 5% donkey serum at 37 °C for 60 min. Subsequently, each coronal section was incubated at 4 °C overnight with primary antibodies. Sections were washed in PBS and appropriate secondary, fluorescence-conjugated antibodies were applied at the dilution of 1:200 for 1 h at 37 °C and then washed in PBS. To facilitate proper photographic orientation, sections were mounted with Vectashield Antifade Mounting Medium with DAPI (Vector Laboratories Inc., USA). Images were then captured by a fluorescence microscope (Leica DMi8, Leica Microsystems, Germany).
Fluoro-Jade C staining
Animals were sacrificed at 48h after HI and Fluoro-Jade C (FJC) staining was performed according to the manufacturer’s protocol (Fluoro-Jade C Ready-to-Dilute Staining Kit, Biosensis, USA). The number of FJC-positive cells per field of view was counted manually in the ipsilateral hemispheres. Four hippocampal (bregma −3.3mm) and cortical sections (bregma −3.3mm and 0.2mm) were chosen in each brain to analyze CA1/CA3 regions, and cerebral cortex, respectively. The data was presented as the average number of FJC-positive cells/1.22 mm2 in the microscopic field. For double immunostaining with FJC, sections were incubated with antibodies against STING, cGAS, ORF1p, ORF2p overnight, followed by incubation with appropriate secondary antibody and subsequent FJC staining.
Statistical analysis
Statistical analyses were performed with SPSS v. 21.0 software (IBM, USA) and Prism 6.0 software. The data were expressed as mean ± SD. Differences between individual groups were first compared using analysis of variance (one-way ANOVA) and then post hoc testing were analyzed with Tukey or Student-Newman-Keuls multiple comparisons. Differences between two groups were compared using Student’s t-test. All reported P values were two-sided, and a value of P < 0.05 was considered statistically significant.
Results
cGAS/STING pathway is activated after HI
The relative endogenous expression levels of proteins in the brain were measured at 6h, 12h, 24h, 48h, 72h and 168h (7 days) after HI. The expression of cGAS, STING and Cathepsin B was significantly increased at 48h and 72h after HI in the ipsilateral hemisphere when compared with sham group (Fig.1A), while expression of cGAS and STING in the contralateral hemispheres was not sigificantly affected (SF2). Interestingly, we found that STING expression is continuously activated even 7 days after the initial insult, which suggests that some factors in the later phase of injury can more selectively activate STING than cGAS. Consistently, cGAS and STING transcript levels were significantly elevated at 72h after HI (Fig.1D). cGAS (Fig.1B) and STING (Fig.1C) were expressed in cortical neurons at 48h after HI in the ipsilateral hemisphere. Additionally, we found that STING was expressed in the hippocampus of the ipsilateral hemishere after HI (Fig.S4A). STING mRNA levels were higher in adult rat tissues compared to P10 rat tissues, with the highest expression in spleen (Fig.1E). Taken together, our data indicates that the cGAS/STING pathway is activated after HI.
Fig.1.
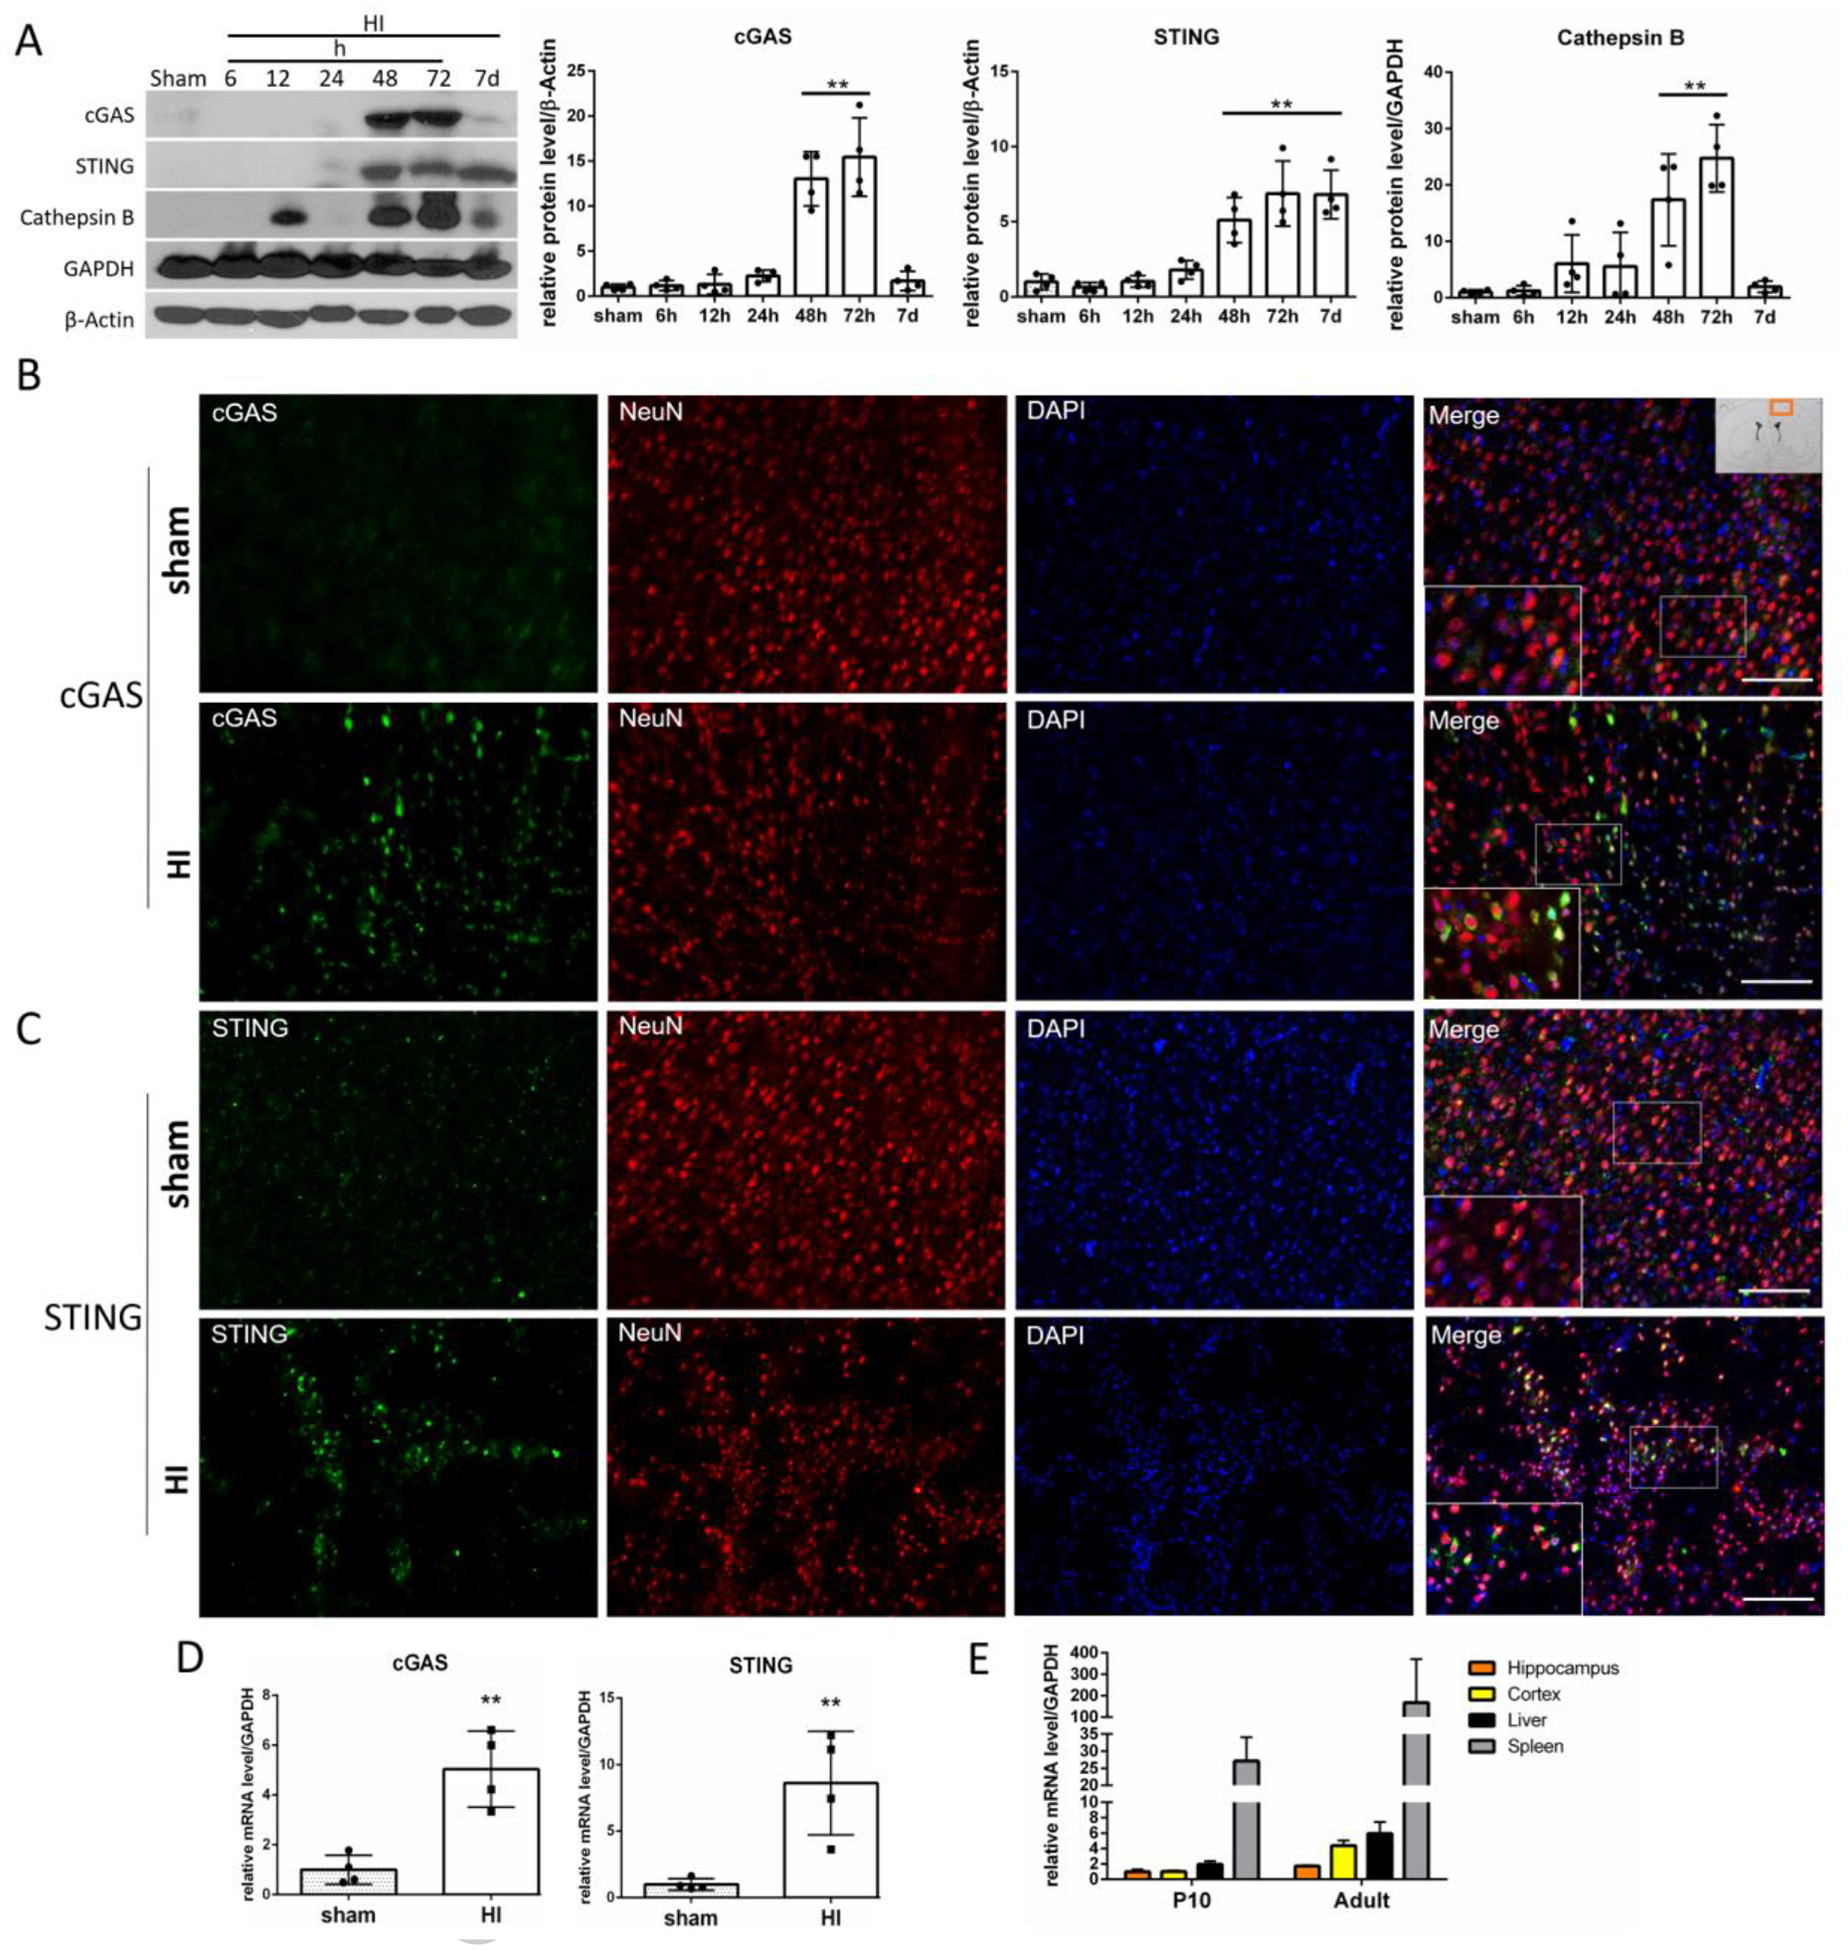
cGAS/STING pathway is activated after HI. (A) Representative western blot images and quantitative analysis of relative temporal expression of endogenous cGAS, STING and Cathepsin B in the ipsilateral hemisphere of the rat brain after hypoxia-ischemia (HI). Expression of cGAS, STING and Cathepsin B was significantly increased (p<0.01) at 48 and 72h after HI compared to sham. STING was additionally increased at 7 days after HI (p<0.01). Values are expressed as mean ± SD. **p < 0.01 vs. sham group. N = 4. Expression of cGAS (B) and STING (C) is shown by double immunofluorescence staining for cGAS/STING (green) in neurons (NeuN, red) in ipsilateral cerebral cortex in sham and HI animals 48h after HI. Scale bar 100 μm. N = 2. Exemplary cells expressing cGAS/STING are indicated with arrows. Picture in the right upper corner shows approximate location from where the images were taken. (D) cGAS and STING mRNA level quantification in ipsilateral hemisphere. cGAS and STING transcript levels were elevated at 72h after HI. Values are expressed as mean ± SD. **p < 0.01 vs. sham group. N = 4. (E) Detection of STING mRNA in rat tissues. STING mRNA levels were detected in P10 and adult rats in hippocampus, cortex, liver and spleen, with highest expression found in spleen. Values are expressed as mean ± SD. N=2–3.
STING is expressed in astrocytes and microglia in neonatal rat brain
Immunofluorescence staining showed colocalization of STING with astrocytic marker GFAP in ipsilateral hemisphere of sham and HI rats at 48h after HI (Fig.2A). Additionally, STING colocalized with microglia marker Iba-1 in sham and HI group at 48h after HI (Fig.2B). Those results demonstrate that STING is expressed in astrocytes and microglia in neonatal rat brain.
Fig. 2.
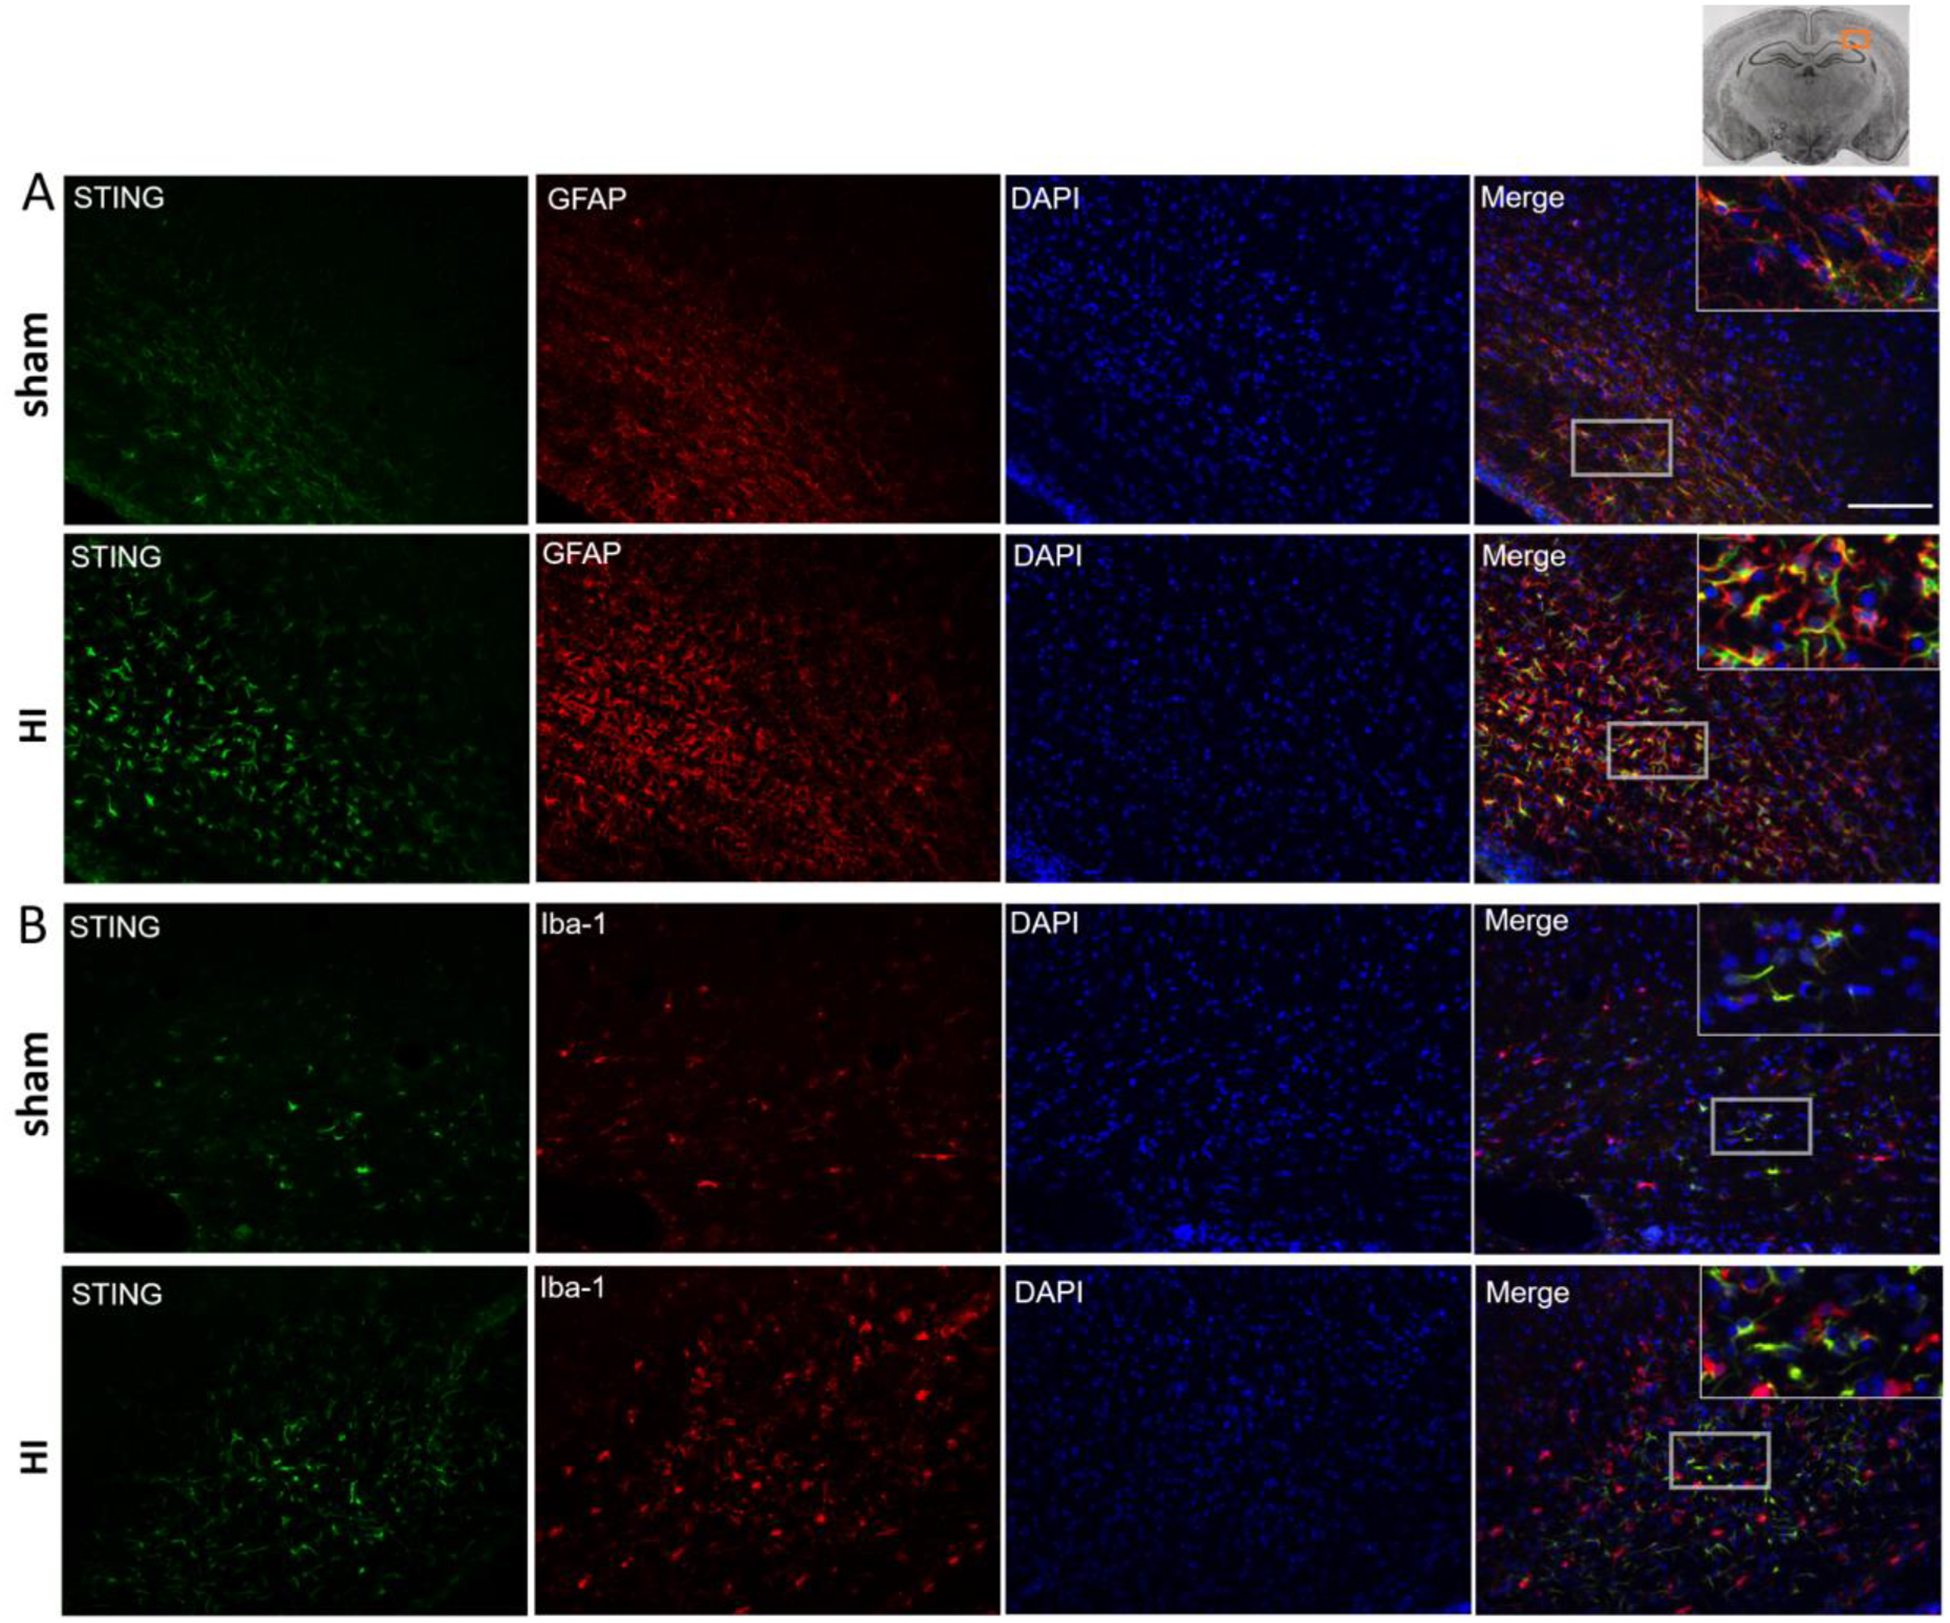
Immunofluorescence staining of STING in the rat brain in the ipsilateral hemisphere at 48 h post HI. Immunofluorescence staining showed that STING was colocalized with astrocytic marker GFAP (A) and microglia marker Iba-1 in sham and HI group. Green was for STING, Red was for GFAP (A) or Iba-1 (B), Blue was for DAPI. Merge showed the colocalization. Scale bar = 100 μm.
STING siRNA reduced HI injury and decreased Cathepsin B expression and apoptosis
Neuronal death is a key characteristic of the progression of neonatal HI injury in the neonate. Previous studies showed that the density of apoptotic cells in cortical areas and the basal ganglia increases between 24 and 72 hours and remains high 12h to 7 days post neonatal HI [47]. As neurons die over time, the brain infarction expands, which provides a target window for potential therapies [47–49]. Representative brain sections illustrate natural infarct progression between 24 and 48h after HI (Fig.3A). Our data showed that cGAS and STING are activated between 24 and 48h after HI, therefore we hypothesized that they can contribute to HI injury during the second day after the insult. First, we confirmed that siRNA targeted neurons (Fig.S3A), and effectively knocked-down STING in sham (Fig.S3B) and HI rats (Fig.3H). Our data indicates that pups with silenced STING have significantly decreased infarct volumes at 48 hours post HI compared to control pups (Fig.3B,C), and reduced neurological impairments at 48h but not at 24h after HI (Fig.3D). Neuronal degeneration in the ipsilateral hemisphere after HI was measured by Fluoro-Jade C staining. We found weak immunoreactivity for STING in the cortex of the contralateral hemisphere after HI and no FJC-positive degenerating neurons, which contrasted with strong STING expression in the ipsilateral hemisphere colocalizing with FJC-positive degenerating neurons (Fig.3E). We found a reduced number of degenerating neurons in the STING-silenced rats in the cerebral cortex, but not in CA1 and CA3 hippocampal regions, compared to control (Fig.3F). We observed that STING can be targeted to LAMP1-positive structures after HI (Fig.3G), presumably lysosomes. Compared to the control, STING inhibition resulted in reduced expression of Cathepsin B, decreased expression of Bax and decreased activation of caspase 3 at 48h after HI (Fig.3H). Thus, our data suggests, that STING may contribute to HI injury.
Fig.3.
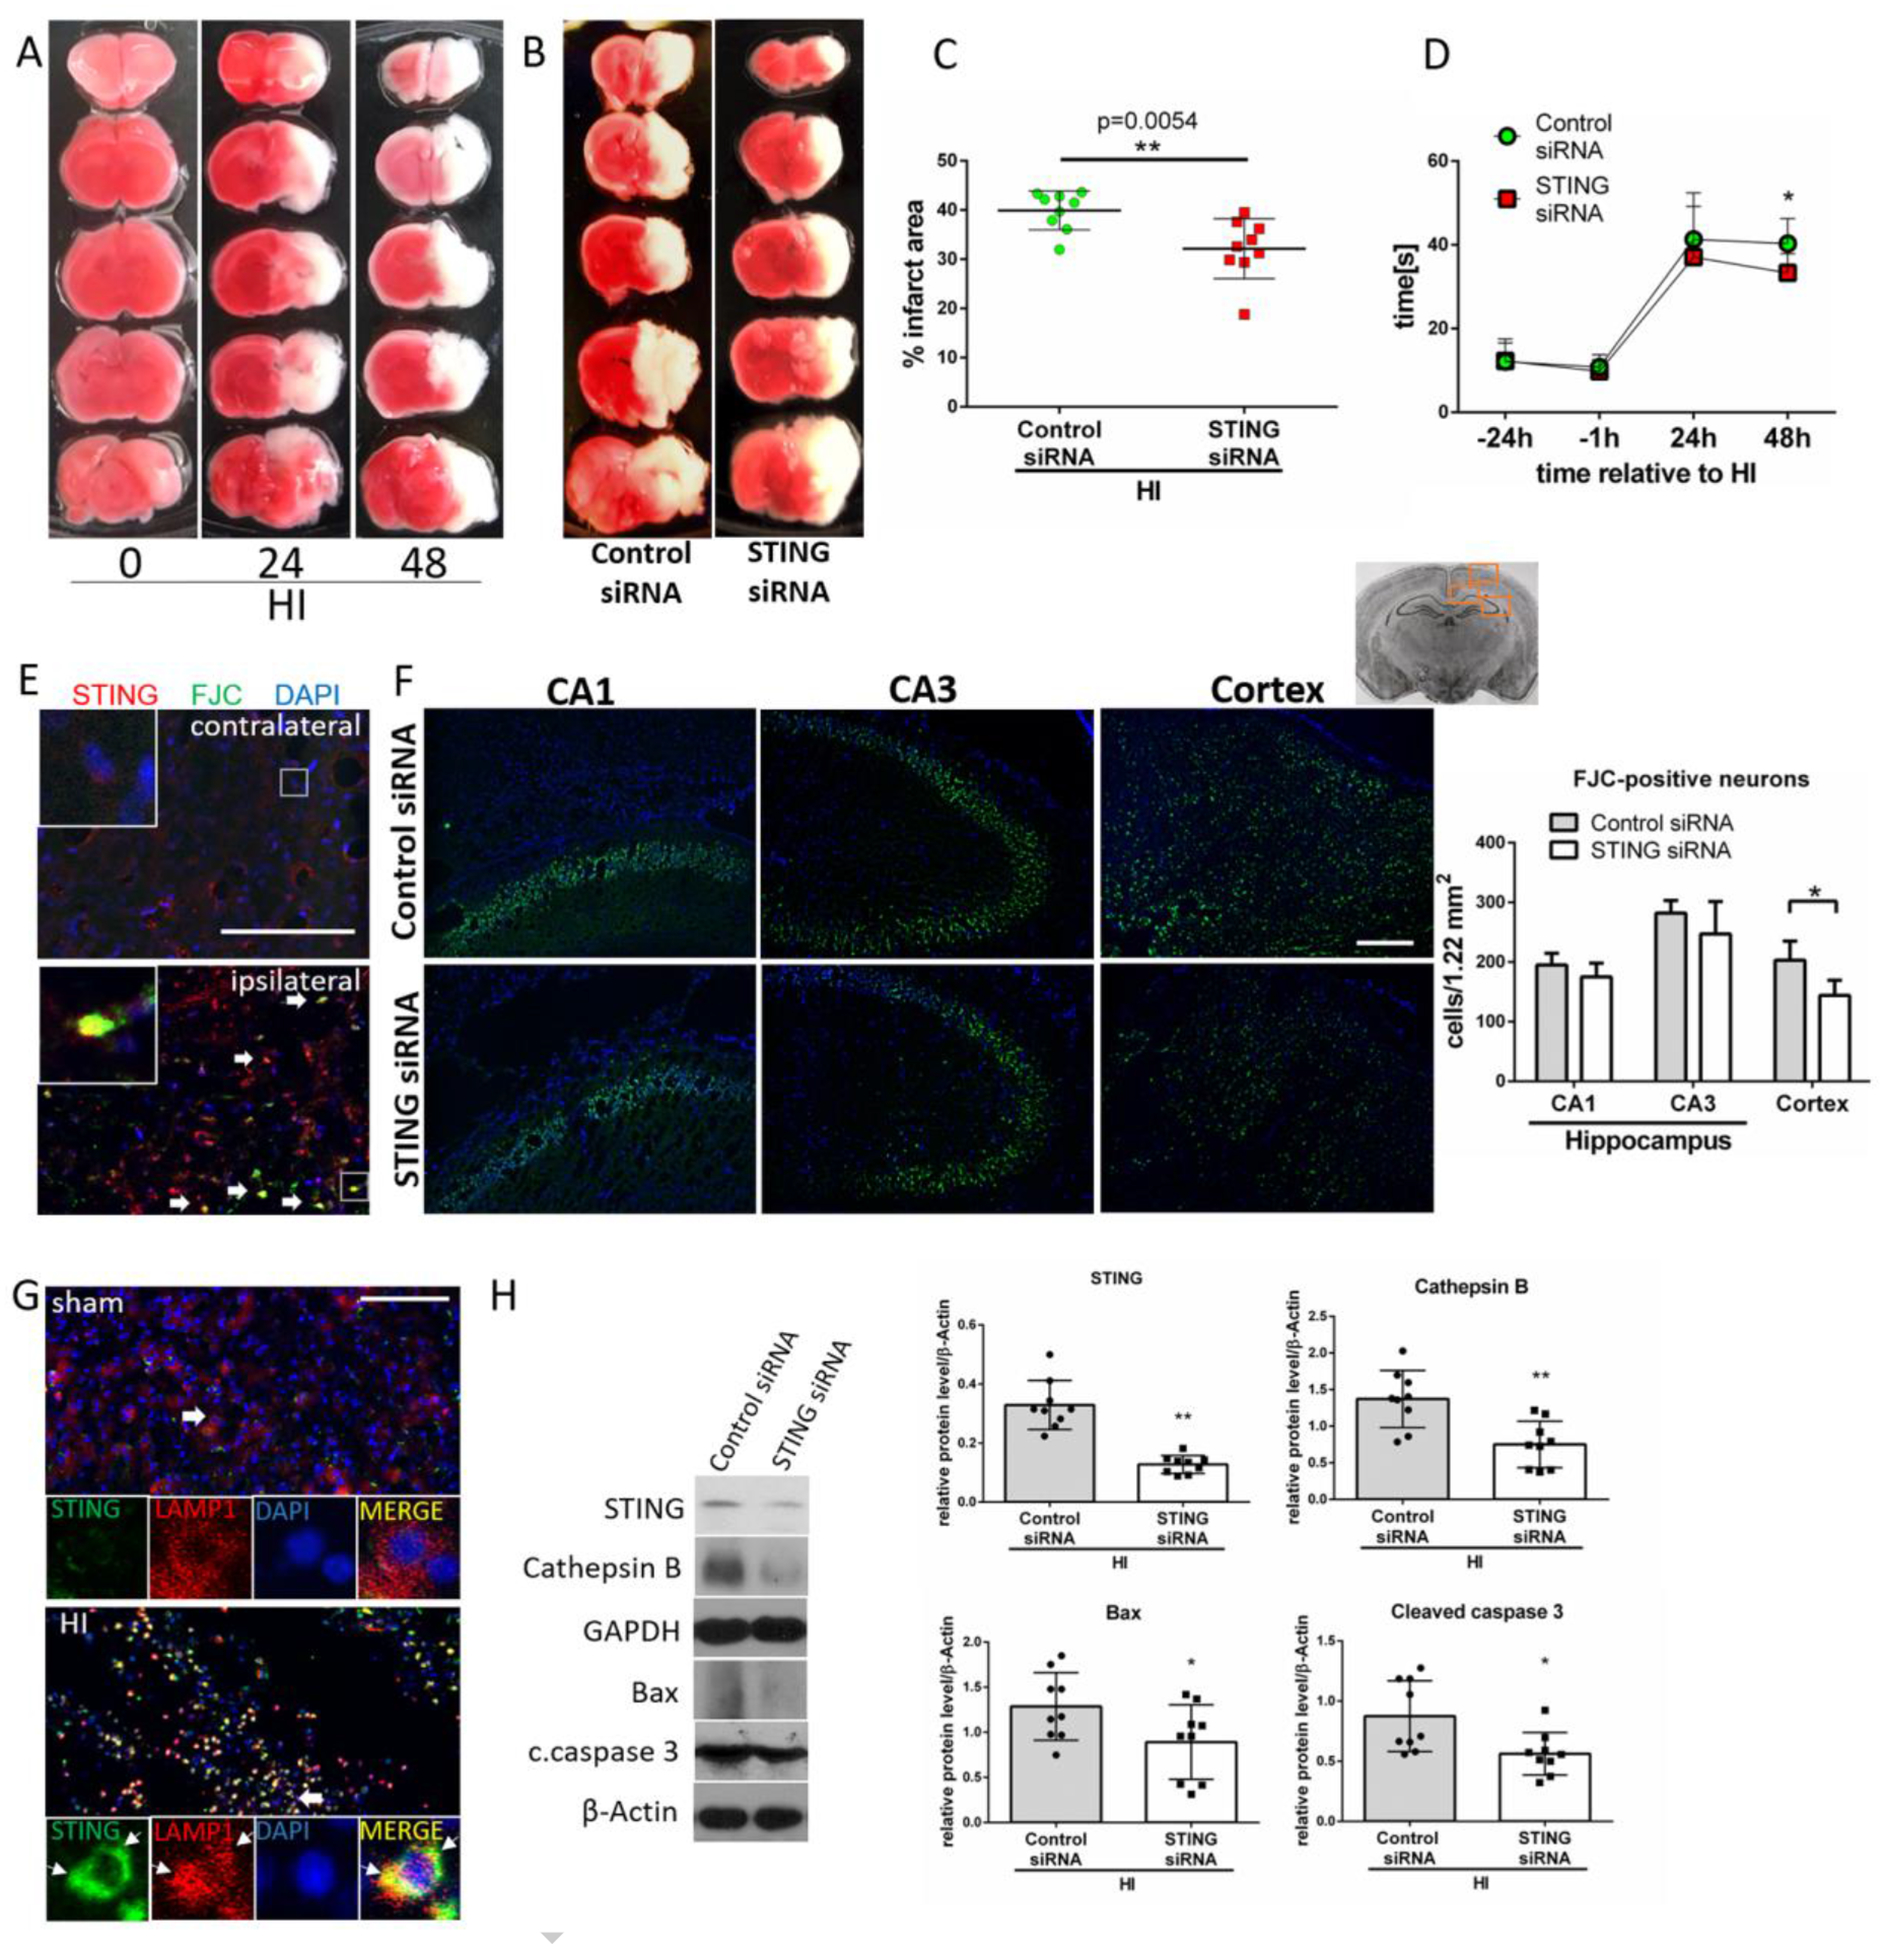
STING inhibition has neuroprotective effects in HI rats. (A) Representative images showing infarct propagation between 24 and 48h after HI. (B) Representative images of brain sections from rats administered with control or STING siRNA stained with TTC at 48h after HI. (C) Infarction area quantification. STING siRNA injection at 48h before HI significantly reduced infarction area in ipsilateral hemisphere at 48h after HI compared to control siRNA (p<0.01). N=9. (D) Negative geotaxis test results. Pups injected with STING siRNA showed decreased neurological impairments at 48h after HI (p<0.05). Two-way-ANOVA-Sidak N=13. (E) Representative microphotographs of double immunofluorescence staining for STING (red) and Fluoro-Jade C (FJC, green) in contralateral and ipsilateral hemisphere of HI rats. Exemplary cells double-positive for STING and FJC are indicated with arrows. (F) Representative images of CA1, CA3 and cerebral cortex stained with Fluoro-Jade C/DAPI and quantitative analysis of FJC-positive neurons. Silencing of STING significantly reduced number of FJC-positive neurons in cerebral cortex (p<0.05) at 48h after HI compared to control siRNA group. N=4. (G) Double immunofluorescence staining for STING and lysosomal marker LAMP1 in cerebral cortex of sham and HI rats. STING colocalized with LAMP1 puncta in ipsilateral hemisphere at 48h after HI. (H) Representative western blot images and quantitative analysis of relative expression of STING, Cathepsin B, Bax and cleaved caspase 3. Silencing of STING significantly decreased level of STING, Cathepsin B, Bax and cleaved caspase 3 in ipsilateral hemisphere at 48h after HI compared to control siRNA group. N=6. Values are expressed as mean ± SD. *p<0.05, **p < 0.01 vs. control siRNA. Scale bar 100μm.
RU.521 decreased neurodegeneration, Cathepsin B expression and apoptosis at 72h post HI
We used RU.521, a small molecule cGAS inhibitor which binds to the catalytic pocket of cGAS and inhibits its DNA-stimulated activity [50], to further confirm that the cGAS/STING pathway has detrimental functions after HI. To determine the best dosage of RU.521 treatment, three doses were used: low (4.5 μg/kg), medium (45 μg/kg) and high (450 μg/kg). RU.521 administred intranasally at a dose of 450 μg/kg significantly reduced the infarction area in the ipsilateral hemisphere at 72h after HI when compared with the vehicle group (Fig.4A,B), and significantly improved performance in the negative geotaxis test at 48h after HI (Fig.4C). No significant differences in the infarcted area and neurobehavior were found in the 4.5 μg/kg and 45 μg/kg groups when compared with the vehicle group. Thus, we chose 450 μg/kg dose to use in further experiments. No FJC-positive cells were detected in the sham group, while multiple degenerating neurons were detected in the hippocampus and cerebral cortex in the vehicle group at 48 h after HI (Fig.4D). We found that RU.521 significantly reduced the number of FJC-positive neurons in cerebral cortex in comparison to the vehicle group (Fig.4D), and that cGAS positive neurons in the ipsilateral hemisphere costained with FJC, which suggests that they underwent degeneration (Fig.4E). To investigate whether STING, Cathepsin B, Bax and caspase 3 are involved in the mechanism of RU.521 treatment after HI, these protein expression levels were tested by western blot. Western blot data showed that STING, Cathepsin B, Bax and cleaved caspase 3 expressions are significantly increased in the vehicle group when compared with the sham group (Fig.4F). Treatment with RU.521 resulted in significantly decreased expression of STING, Cathepsin B and cleaved caspase 3 compared to vehicle group (Fig.4F). These findings suggest that cGAS inhibitor RU.521 can inhbit STING and attenuate neurodegeneration after HI.
Fig.4.
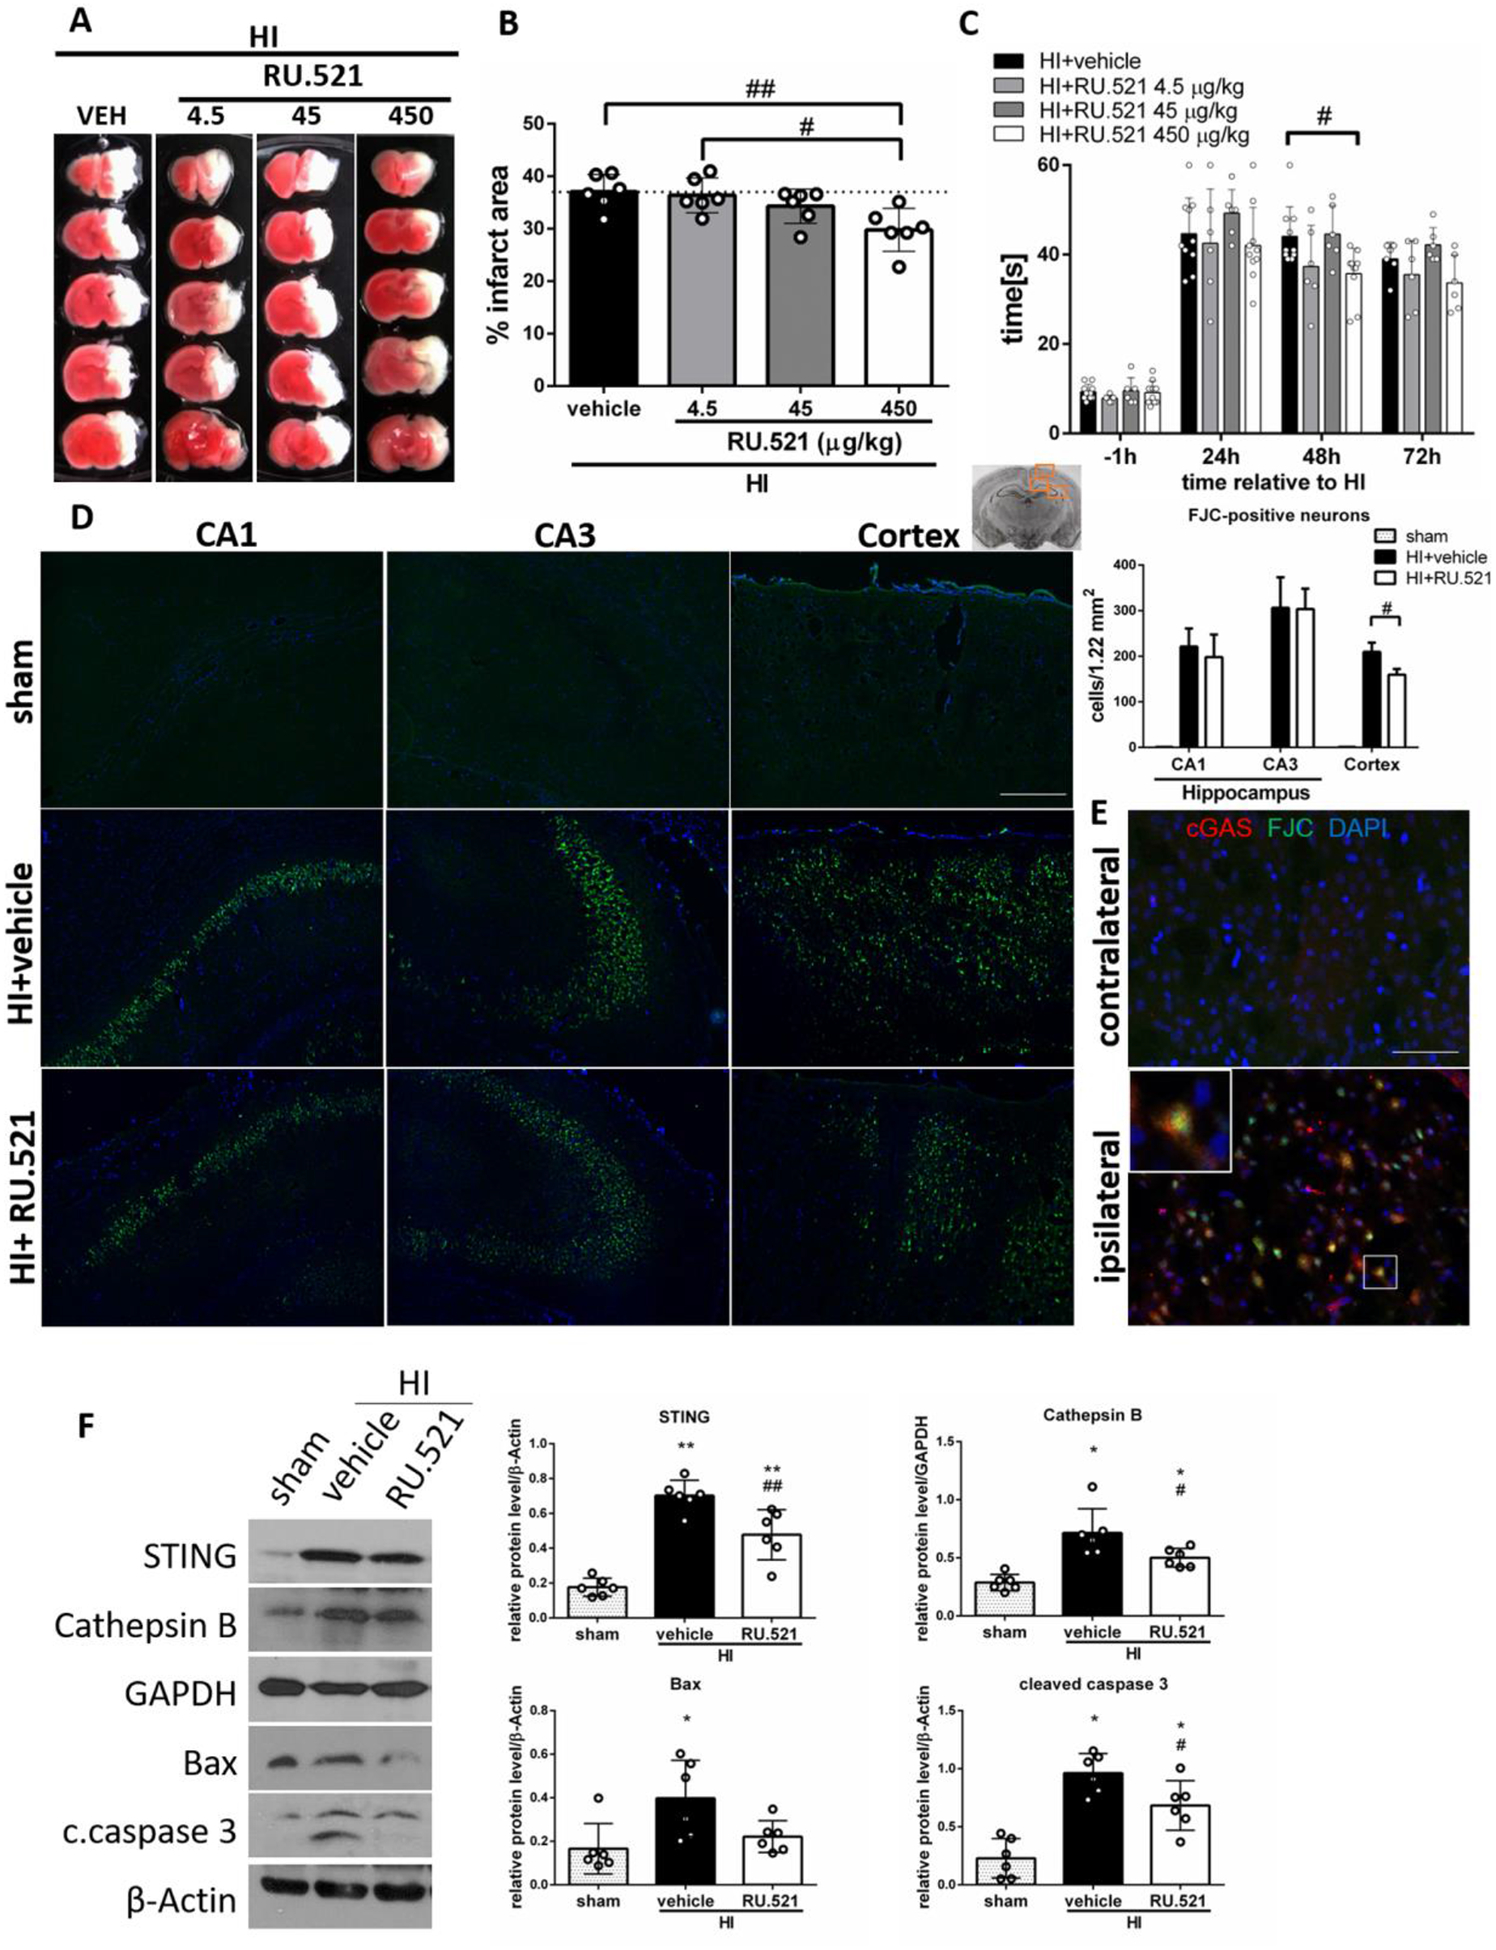
RU.521 decreases neuronal death after HI. (A) Representative pictures of TTC-stained brain sections of animals administered with intranasal RU.521 in a dose of 4.5, 45, 450 μg/kg or vehicle. (B) Quantitative analysis of infarction area showed in TTC stained brain slices. 450 μg/kg dose of cGAS inhibitor RU.521 significantly decreased infarction area at 72h after HI (p<0.01). N=6. (C) Geotaxis test showed that 450 μg/kg dose of RU.521 decreased the reflex time significantly (p<0.05) compared with the vehicle group at 48h after HI. N=6–10. (D) Representative images of CA1, CA3 and cerebral cortex stained with Fluoro-Jade C/DAPI and quantitative analysis of FJC-positive neurons. RU.521 (450 μg/kg) significantly reduced (p<0.05) the number of FJC-positive neurons in cerebral cortex of ipsilateral hemisphere at 48h after HI. N=4. Scale bar 100μm. (E) Representative microphotographs of double immunofluorescence staining for cGAS (red) and Fluoro-Jade C (green) in contralateral and ipsilateral hemisphere of HI rats. Scale bar 50μm. (F) Representative western blot images and quantitative analysis of relative expression of STING, Cathepsin B, Bax and cleaved caspase 3 at 72h after HI and after RU.521 treatment. N=6. Data presented as mean ± SD. *p<0.05, **p < 0.01 vs. sham, #p<0.05, ##p < 0.01 vs. vehicle.
Activation of STING reversed the protective effects of RU.521, increased neurodegeneration, Cathepsin B expression and apoptosis at 72h post HI
To determine STING′s role in RU.521 neuroprotective effects, we used a STING agonist - 2’3’-cGAMP. 2’3’-cGAMP, administered intranasally together with RU.521 significantly increased the infarction rate at 72h after HI in the ipsilateral hemisphere compared to rats not receiving 2’3’-cGAMP (Fig.5A,B), and worsened performance of rats in the negative geotaxis test at 48 and 72h after HI (Fig.5C). Additionally, 2’3’- cGAMP increased the number of degenerating neurons in CA1 and cerebral cortex, but not in CA3, compared to control rats (Fig.5D). We used ELISA test to measure the concentration of 2’3’-cGAMP in ipsilateral hemispheres. We showed, for the first time, that endogenous level of 2’3’-cGAMP, which is naturally synthesized by activated cGAS, was significantly increased at 72h after HI in ipsilateral hemispheres when compared to the sham group, which confirms that cGAS is activated after HI (Fig.5E). Treatment with cGAS inhibitor RU.521 significantly reduced the level of 2’3’-cGAMP, compared to the vehicle group (Fig.5E). We additionally confirmed succesfull intranasal delivery of exogenous 2’3’-cGAMP- a high level of 2’3’-cGAMP was detected in the brains of rats intranasally administered with 2’3’-cGAMP (Fig.5E). Treatment with 2’3’-cGAMP resulted in STING activation, increase of Cathepsin B level, and increased expression of Bax and cleaved caspase 3 (Fig.5F). Our data suggests that activation of STING can promote neuronal death and reverse the therapeutic effect of RU.521 and therefore RU.521 induced protection after HI is dependent on STING.
Fig.5.
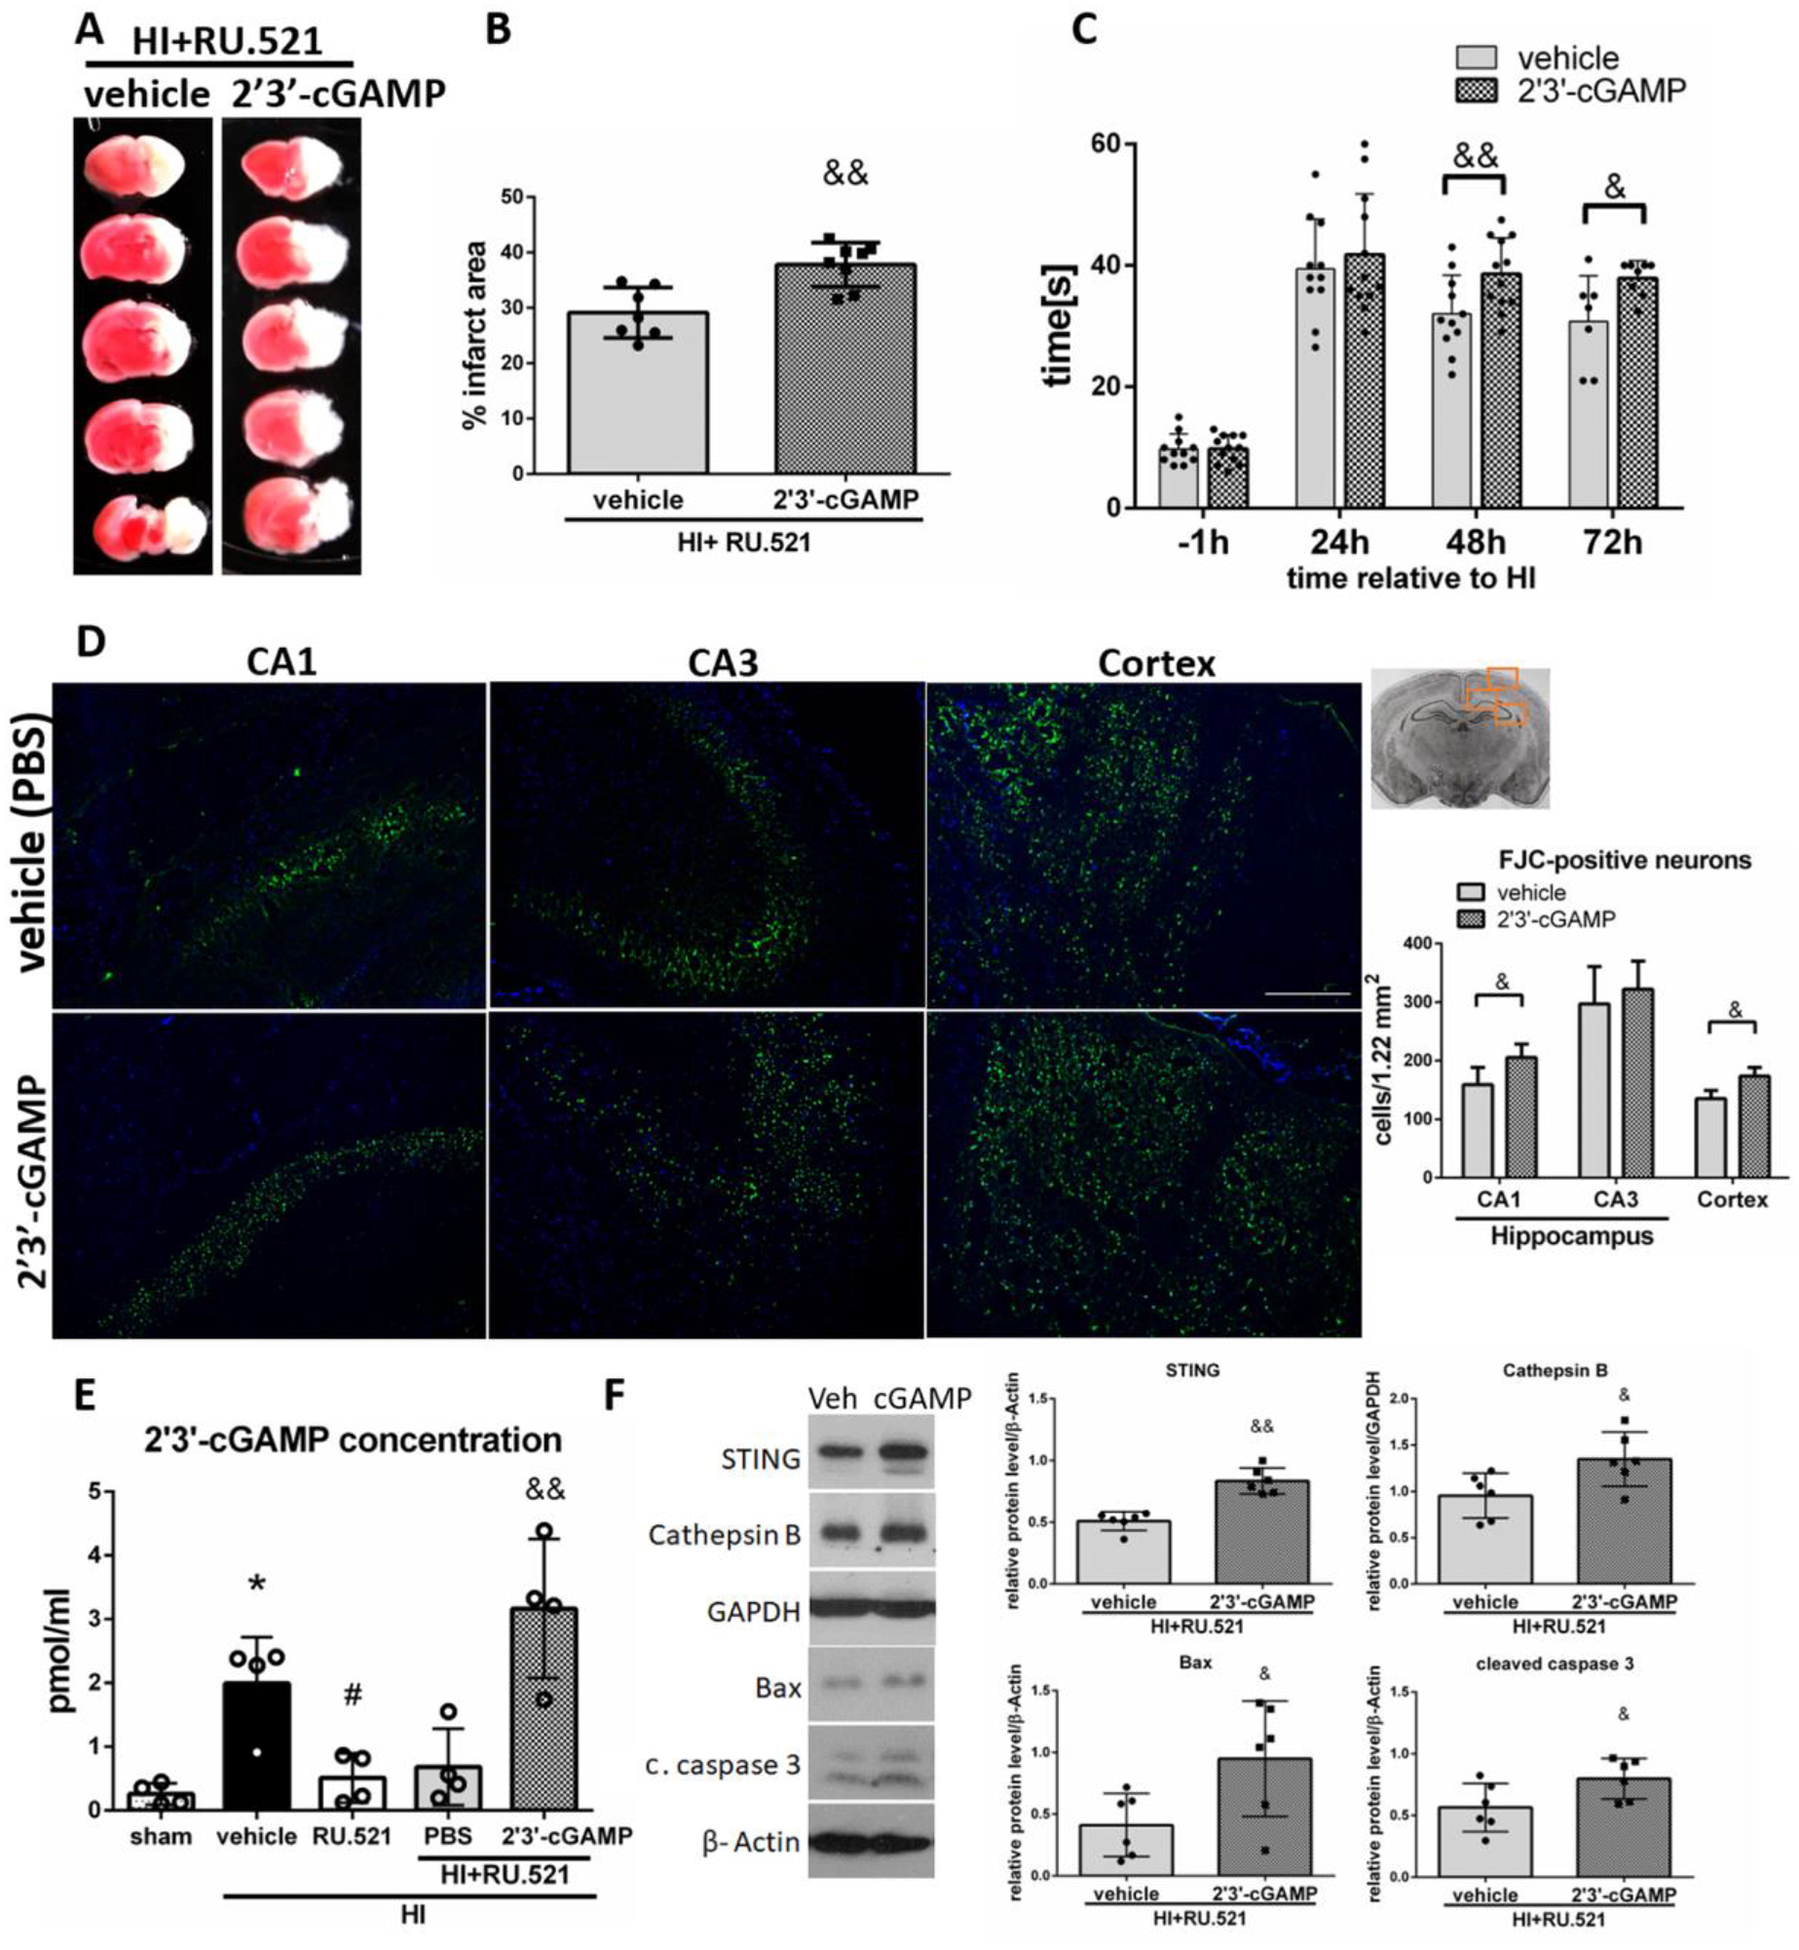
2’3’-cGAMP reverses RU.521-induced protective effects. (A) Representative brain sections of animals administered with PBS (vehicle) or 2’3’-cGAMP stained with TTC at 72h after HI. (B) Quantitative analysis of infarction area showed in TTC stained brain slices. STING agonist 2’3’-cGAMP significantly increased infarction area at 72h after HI compared to vehicle group. N=7–8. (C) Negative geotaxis test results. 2’3’-cGAMP significantly worsened rat performance in negative geotaxis test compared to vehicle group at 48 and 72h after HI. N=11–12. (D) Representative images of CA1, CA3 and cerebral cortex stained with Fluoro-Jade C/DAPI and quantitative analysis of FJC-positive neurons. 2’3’-cGAMP significantly increased the number of FJC-positive neurons in CA1 area of the hippocampus and in cerebral cortex of ipsilateral hemisphere at 48h after HI. N=4. Scale bar 100μm. (E) ELISA analysis of 2’3’-cGAMP concentration in ipsilateral hemispheres of rats at 72h after HI. N=4. (F) Representative western blot images and quantitative analysis of relative expression of STING, Cathepsin B, Bax and cleaved caspase 3 at 72h after HI. N=6. Data presented as mean ± SD. &p<0.05, &&p < 0.01 vs. 2’3’-cGAMP vehicle (PBS). *p<0.05 vs. sham, #p < 0.05 vs. vehicle. Scale bar 100μm.
LINE-1 is activated after HI
cGAS/STING pathway, which we found to be induced after HI, can be activated by LINE-1. Therefore, we hypothesized that LINE-1 is activated after HI. We found that ORF1p and ORF2p, proteins translated from LINE-1 were expressed in neurons at 48h after HI (Fig.6A), and their expression was significantly increased in the ipsilateral hemishpheres compared to sham group at 48h and 72h after HI (Fig.6B). ORF1p was also expressed in the CA1 hippocampus of the ipsilateral hemisphere after HI (Fig.S4B). Additionally, we found induction of TREX1 expression after HI (Fig.6B), which might reflect activation of compensatory mechanisms to counter LINE-1. TREX1 is a key protein involved in the inhibition of LINE-1 [36,51–53], and the negative regulator of the cGAS/STING pathway [54]. We found that TREX1, a major ER located 3′-to-5′ DNA exonuclease metabolizing cytosolic DNA derived from LINE-1 to prevent intrinsic DNA accumulation in the cytoplasm [55], was expressed in rat cortical neurons (Fig. 6C). Consistently, ORF1, ORF2 and TREX1 transcript levels were elevated at 72h after HI, which was not statistically significant (Fig.6D). We found low baseline levels of LINE1 ORF1p mRNA in tissues of naïve P10 rats compared with adult rat tissues. A patricularly high expression of LINE-1 was found in the spleen (Fig.6E), which is consistent with high baseline expression of STING.
Fig.6.
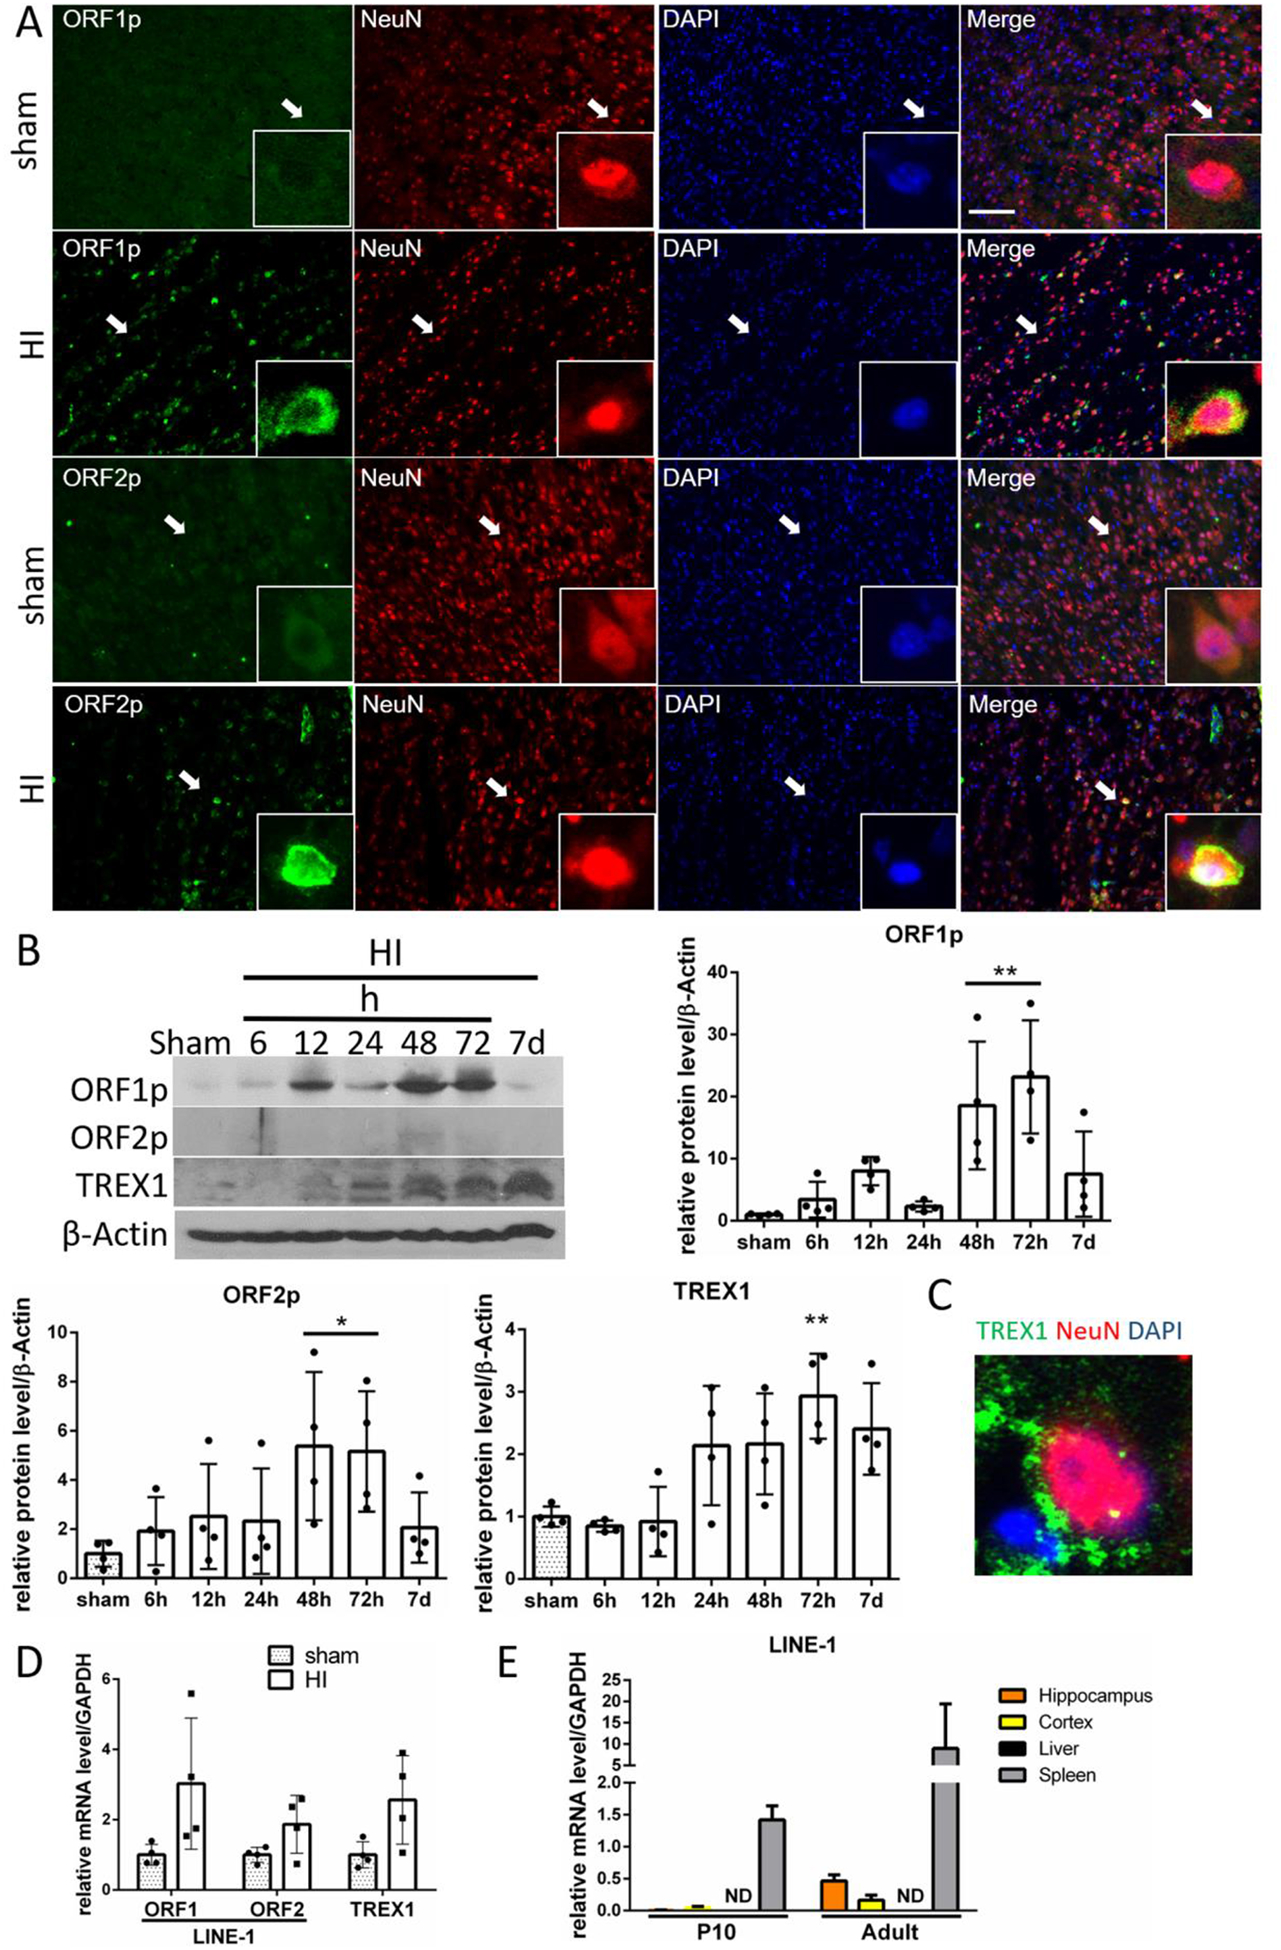
LINE-1 is activated after HI. (A) Expression of ORF1p and ORF2p proteins (green) is shown by double immunofluorescence staining in neurons (NeuN, red) in sham and HI animals in ipsilateral cerebral cortex at 48h after HI. Arrows indicate cells showed in higher magnification. N=2. (B) Representative western blot images of time-course data and quantitative analysis of relative temporal expression of endogenous ORF1p, ORF2p and TREX1 in the ipsilateral hemisphere of the rat brain after HI. Expression of ORF1p and ORF2p was significantly increased compared to sham at 48 and 72h after HI. TREX1 expression was significantly increased at 72h after HI. (C) TREX1 expression was detected in cortical neurons. (D) Relative level of ORF1, ORF2 and TREX1 mRNA at 72h after HI. (E) Detection of LINE-1 ORF1 mRNA in naïve rat tissues. LINE-1 ORF1 mRNA was detected in P10 and adult rats in hippocampus, cortex and spleen, with highest expression found in spleen. Values are expressed as mean ± SD. ND – nondetectable. N=2–3. **p < 0.01, *p < 0.05 vs. sham group. Scale bar 100μm.
LINE-1 DNA accumulates in the cytosol after HI
Since cGAS/STING pathway can be directly activated by cytosolic DNA, and particularly by LINE-1 derived cytosolic DNA, we measured LINE-1 DNA level in cytosolic fractions in ipsilateral hemisheres. We used two pairs of primers targeting different regions of LINE-1 (Fig.7A). Interestingly, we found a massive, ~100-fold increase of LINE-1 DNA levels in the cytoplasm at 48h after HI (Fig. 7B), while total cellular DNA did not show a significant increase of LINE-1 content (Fig.S5A). We validated succesful fractionation (Fig.7C), confirmed product specificity and visualized single products in the gel after electroforetic separation (Fig.7D). Next, we found a positive single-stranded DNA (ssDNA) staining in the cytoplasm of neurons at 48h after HI, but not in sham animals (Fig.7E), which indicates that there are conditions promoting cGAS/STING pathway activation after HI. It is unclear whether these ssDNA are LINE-1-derived, however it was previously shown that much of the extranuclear ssDNA detected in neural cells arises primarily by reverse transcription of LINE-1 [36]. We confirmed antibody specificity for ssDNA, as we observed a different pattern, with apparent nuclear staining with a dsDNA antibody (Fig.S5B). Together, these observations suggest that LINE-1 is activated after HI, which potentially contributes to cGAS/STING activation.
Fig.7.
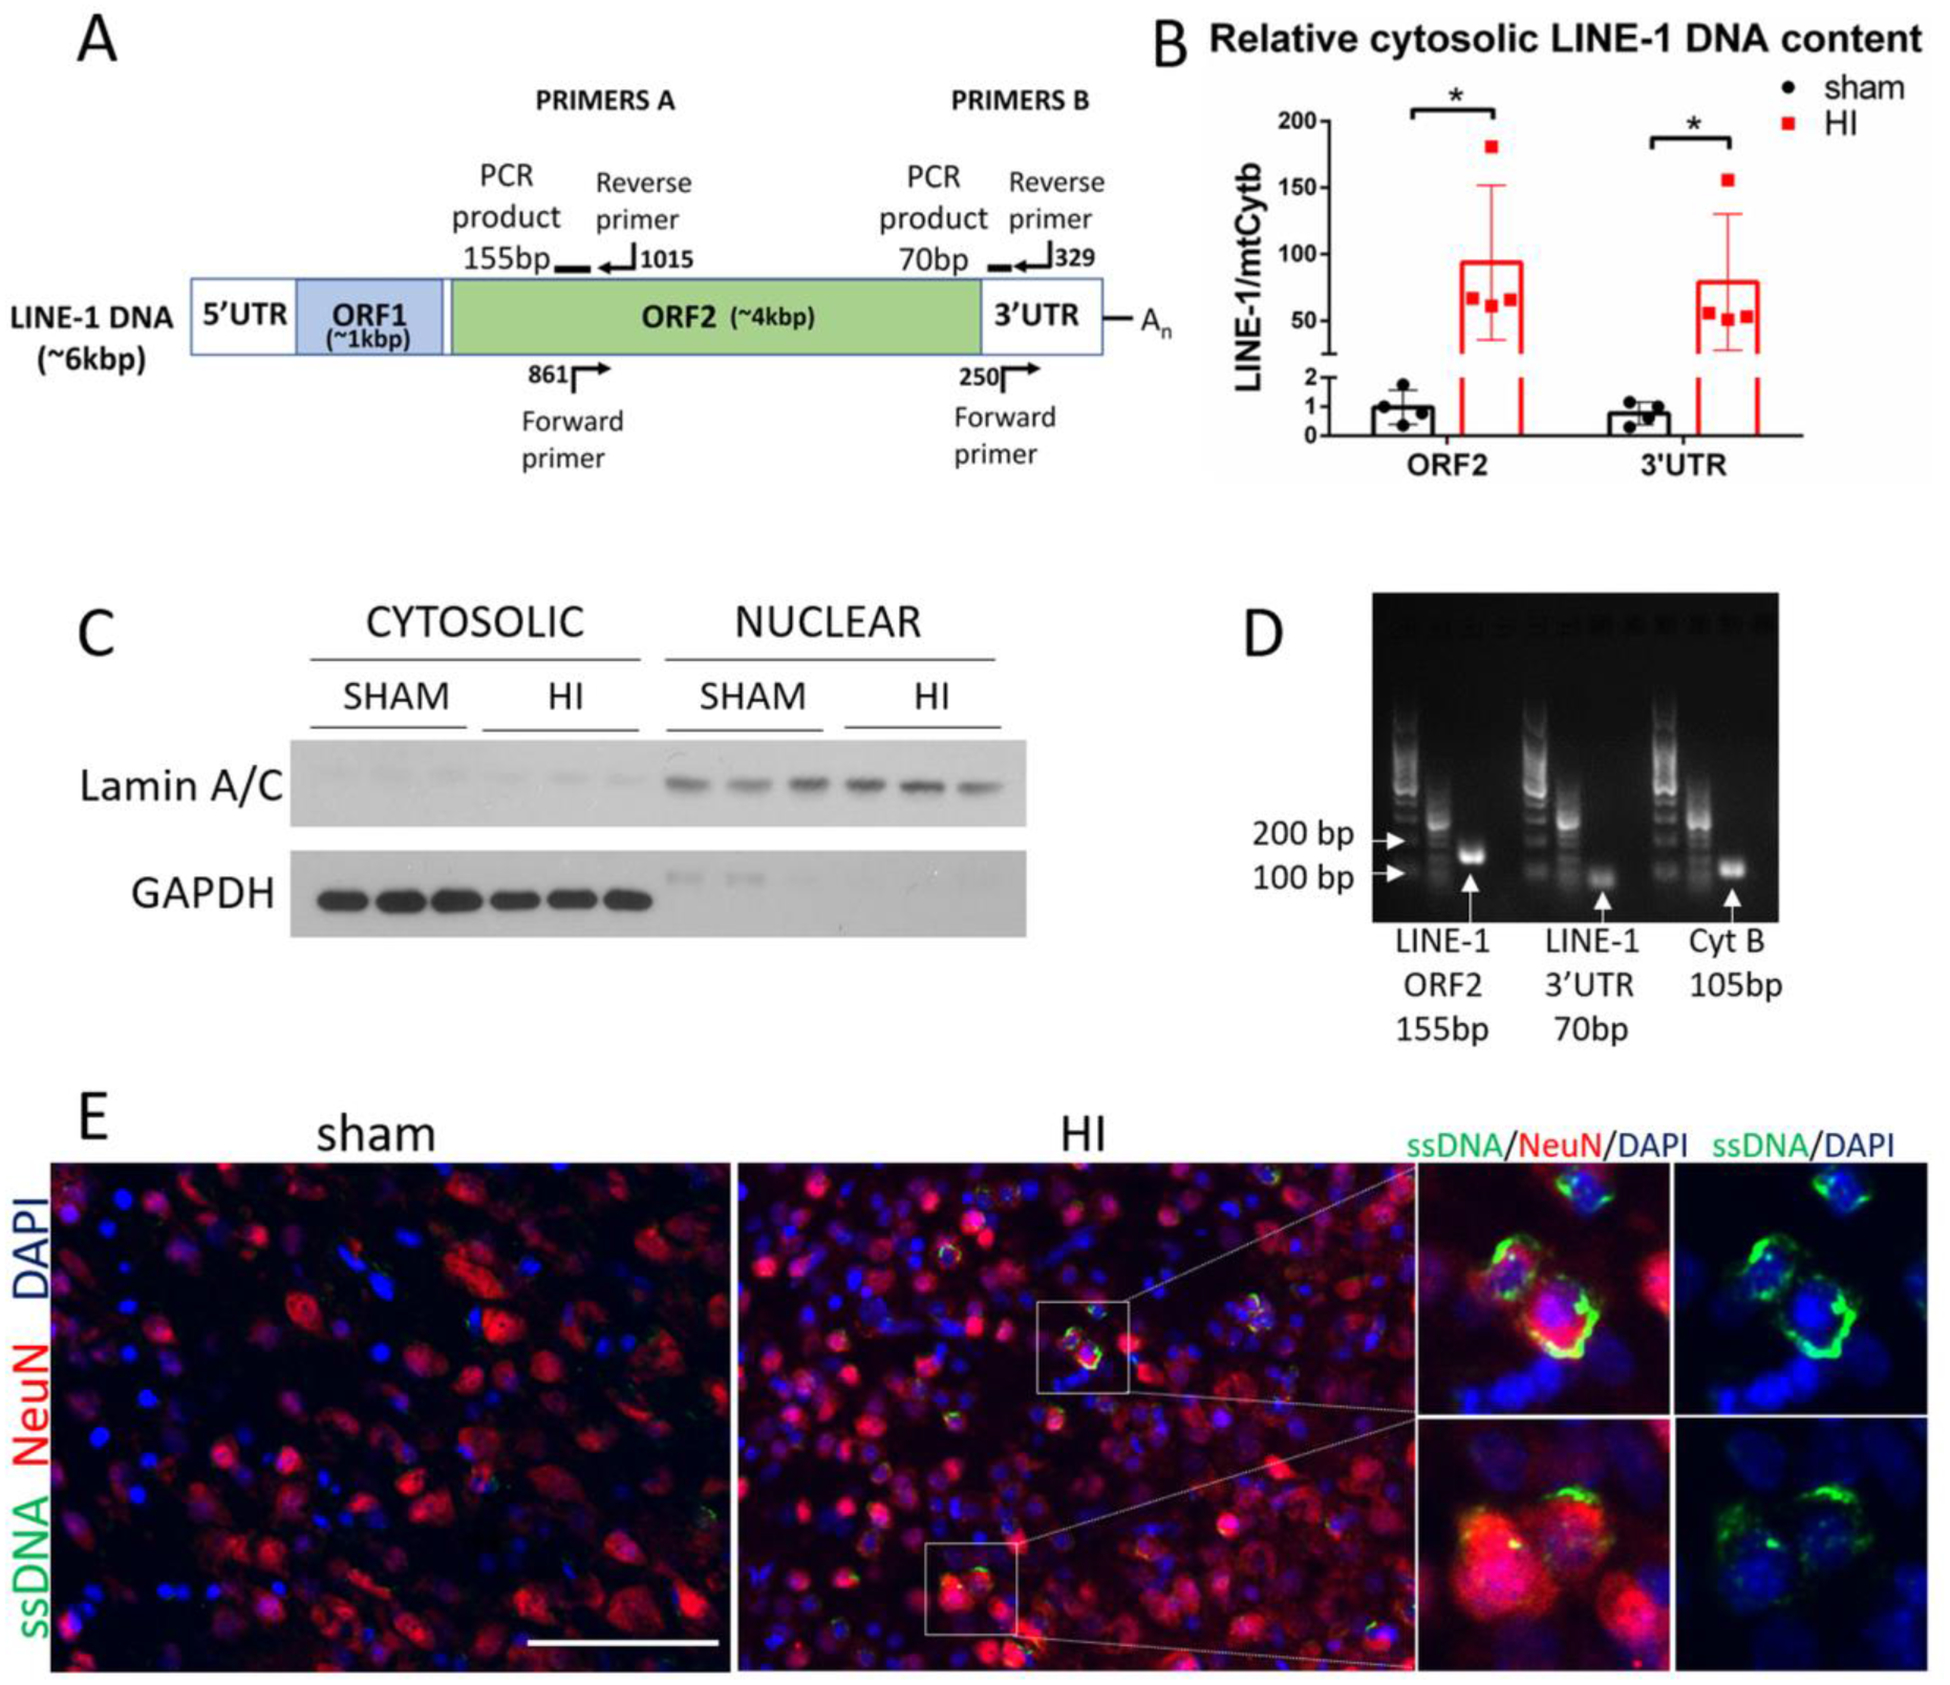
LINE-1 DNA accumulates in the cytosol after HI. (A) LINE-1 illustration showing fragments targeted with PCR primers. (B) Relative cytosolic LINE-1 DNA content in sham and HI group was quantified by PCR at 48h after HI. MtCytB was used as a reference gene. (C) Validation of cytosolic and nuclear fractionation by western blot. Cytosolic and nuclear extracts were probed with antibodies against Lamin A/C- a nuclear membrane protein, and with GAPDH – cytosolic protein. (D) LINE-1 PCR products were visualized on agarose gel. (E) Immunostaining for ssDNA in sham and HI animals at 48h after HI. N=2. Magnified panel to the right shows merged images for ssDNA and DAPI to illustrate cytosolic location of ssDNA after HI. Scale bar 100μm.
Stavudine decreased STING expression, reduced neurodegeneration in cerebral cortex and decreased apoptosis after HI
Stavudine is a well-known anti-HIV-1 drug that has been shown to inhibit LINE-1 reverse transcription [36,56,57]. Stavudine administered intranasally in a dose of 500 μg/kg significantly reduced the infarction rate in the ipsilateral hemisphere at 72h after HI (Fig.8A,B), however, it did not significantly improve performance in the negative geotaxis test (Fig.8C). We found that Stavudine significantly reduced the number of FJC-positive neurons in the cerebral cortex (Fig.8D,E), and that ORF1p and ORF2p positive neurons in cortex in ipsilateral hemisphere were also positive for FJC staining, which suggests that neurons with activated LINE-1 were degenerating (Fig.8F). We found that Stavudine reduced LINE-1 DNA content in the cytosol at 48h after HI compared to vehicle treated rats (Fig.8G) and confirmed successful fractionation (Fig.8H). Treatment with Stavudine resulted in a significant decrease of expression of STING, Bax and cleaved caspase 3, when compared to vehicle group (Fig.8I). Those results implicate that Stavudine can effectively block LINE-1 activity and decrease STING activation after HI, and therefore LINE-1 can contribute to STING activation after HI.
Fig.8.
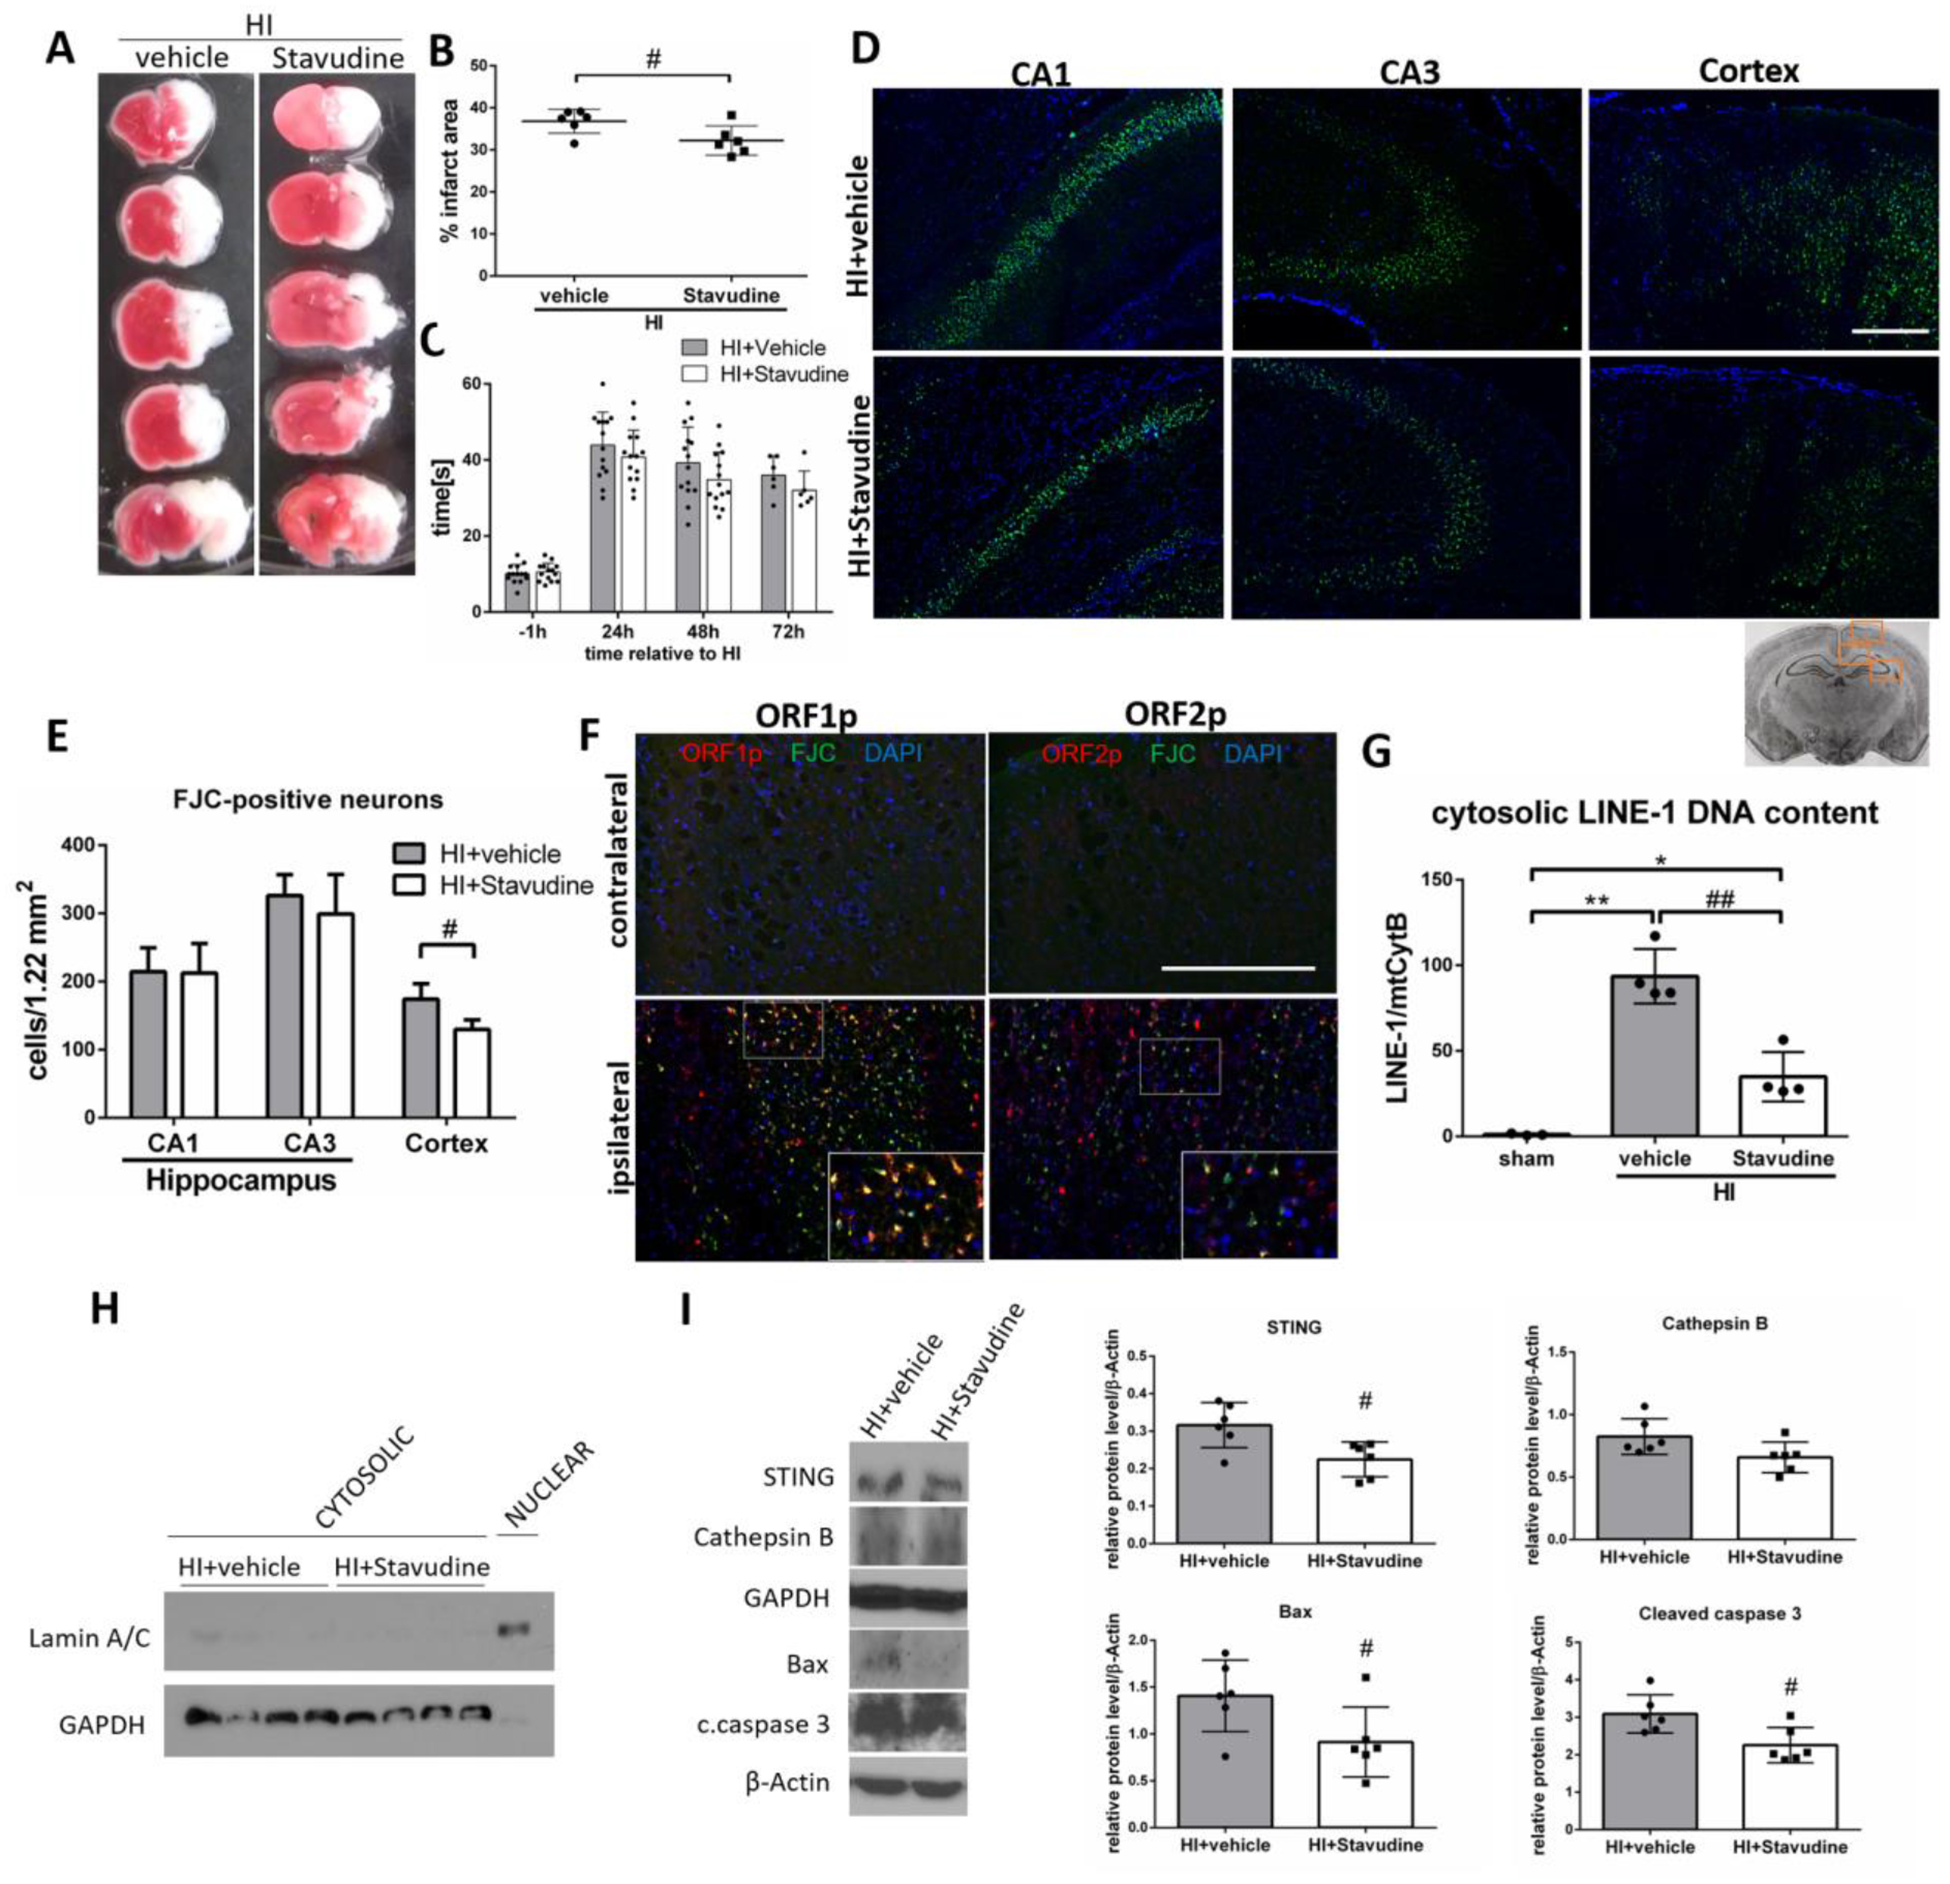
Stavudine inhibits LINE-1 and STING and decreases neuronal death in cerebral cortex after HI. (A) Representative pictures of TTC-stained brain sections of animals administered with intranasal Stavudine or vehicle. (B) Quantitative analysis of infarction area showed in TTC stained brain slices. Stavudine in a dose of 500 μg/kg significantly decreased infarction area compared to vehicle at 72h after HI (p<0.05). N=6. (C) Negative geotaxis test was performed at 1h before, and 24,48 and 72h after HI. N=6–14. (D) Representative images of CA1, CA3 and cerebral cortex stained with Fluoro-Jade C/DAPI. (E) Quantitative analysis of FJC-positive neurons. Stavudine significantly reduced the number of FJC-positive neurons in cerebral cortex of ipsilateral hemisphere compared to vehicle at 48h after HI (p<0.05). N=4. (F) Representative microphotographs of double immunofluorescence staining for ORF1p or ORF2p (red) and Fluoro-Jade C (green) in contralateral and ipsilateral hemisphere of HI rats at 48h after HI. (G) Cytosolic LINE-1 DNA content was measured in Stavudine treated rats. Stavudine significantly decreased cytosolic LINE-1 DNA content at 48h after HI compared to vehicle group. (H) Validation of cytosolic and nuclear fractionation. Cytosolic and nuclear extracts were probed with antibodies against Lamin A/C and GAPDH. (I) Representative western blot images and quantitative analysis of relative expression of STING, Cathepsin B, Bax and cleaved caspase 3 after Stavudine treatment at 72h after HI. N=6. Data presented as mean ± SD. *p<0.05, **p < 0.01 vs. sham, #p<0.05, ##p < 0.01 vs. vehicle. Scale bar 100μm.
Discussion
Eukaryotic organisms operate on the premise that no free endogenous DNA is present in the cytosol, and thus cytosolic DNA is identified as foreign (non-self). It is well recognized that the cGAS-mediated DNA signaling pathway plays an essential role in infection, inflammation, and tumor therapy [58], but recently it has been shown that it can also contribute to myocardial ischemia, liver disease and TBI. Immune response is not tissue specific, and STING has been found to participate in deleterious processes in number of tissues. Here we show, for the first time, that cGAS/STING pathway may participate in hypoxic-ischemic injury in neurons and blocking this endogenous pathway can limit the progression of neurodegeneration after HI.
A recent study showed that STING expression was induced at 24h after TBI in mice and human brain samples [24]. However, the expression of STING at later time-points after injury was not evaluated. Additionally, STING was shown to be expressed in neurons after TBI in mice [24]. Here we show, for the first time, that cGAS and STING proteins and respective mRNAs are significantly increased in the brain at 48h after HI and that cGAS and STING are expressed in neurons after HI. The activation of the cGAS/STING pathway is further supported by the increased level of 2’3’-cGAMP in ipsilateral hemispheres after HI. Additionally, we showed that the baseline STING expression in the brain is low compared with its expression in the spleen, which is unsurprising given the role of the spleen in systemic regulation of immunity, and which is consistent with other studies showing high expression of STING in human and mouse spleen [59,60]. Spleen, which is a largest pool of peripheral immune cells, has been shown to participate in pathophysiology of HI by releasing proinflammatory macrophages [61]. We have found that STING is expressed by brain resident microglia/macrophages. Considering the role of STING in modulation of inflammatory responses in various disease models, it is possible that STING contributes to neuroinflammation after HI. However, we did not measure inflammatory outcomes in this study, as we focused on neuronal mechanisms. Next, we found that silencing STING and blocking cGAS with RU.521 lowered the infarction area, decreased the number of degenerating neurons in the cerebral cortex and improved neurobehavioral outcomes after HI. A similar protective effect has been recently observed in TBI mouse model - STING KO mice exhibited a smaller lesion volume following TBI compared to control wild-type mice [24]. The mechanism of observed protection in our study included a reduction of Cathepsin B expression, and inhibition of apoptosis related Bax and cleaved caspase 3. STING has been previously shown to be implicated in apoptotic cell death. Toll cell receptor activation in STING−/− T cells increased antiapoptotic Bcl-2 and decreased proapoptotic Bax gene expression, and adding STING agonist DMXAA reversed this trend in a STING-dependent manner [14]. Prolonged activation of STING in B cells triggered mitochondria-mediated apoptosis and led to the activation of cleaved caspase 3, 9 and PARP [62]. Furthermore, STING promoted Bax activation and subsequent apoptosis of primary monocytes during human T cell leukemia virus type 1 (HTLV-1) infection [63]. Recent studies showed that STING promotes apoptosis in liver disease models. Knocking down STING in L-O2 cells led to a significant reduction in free fatty acid (FFA) -induced hepatic apoptosis, as evidenced by decreased expression of proapoptotic Bax, cleaved caspase 3 and PARP [20]. Petrasek et al. identified the central role of STING-mediated apoptosis in the development of alcoholic liver disease (ALD). The study showed that ethanol activates STING, which leads to Bax activation and contributes to hepatocyte apoptosis [21]. This pathogenic role of STING in ALD was independent of inflammation. Activating STING with 2’3’-cGAMP in our study reversed the protective effect of RU.521 and increased apoptosis. Additionally, we found that part of the neurons expressing cGAS and STING after HI were undergoing neurodegeneration. Together, our data suggests that the cGAS/STING pathway is implicated in neuronal death after HI, and at least part of it might be apoptotic.
Next we asked a question why is cGAS/STING pathway activated in neurons. As it is intuitive that cGAS/STING can be activated in microglia/macrophages – cells which are cleaning the debris after dead tissue, we were intrigued to see a robust activation of this pathway in neurons. We reasoned that cGAS can be activated by DNA from within the cell, which “escaped” from the nucleus. Natural candidates capable of such translocation are retrotransposons – mobile DNA elements which account for up to 50% of the DNA of mammals and can be present in the cytosol. They use a “copy-and-paste” mechanism and can increase in copy numbers by reverse transcription of an RNA intermediate into DNA, followed by integration into the genome. ORF1p and ORF2p proteins expression is an indirect evidence of LINE-1 activation, with ORF1p protein being the most robust indicator [64]. LINE-1 propagates through RNA sequences that are reverse transcribed into DNA. Although the canonical model of LINE-1 reverse transcription assumes it takes place in the nucleus through target-primed reverse transcription (TPRT), there is much evidence that LINE-1 cDNA can be detected in the cytoplasm, and that cytosolic reverse transcription of LINE-1 without integration also occurs [33,35,38,65,66]. We found that expression of both ORF1p and ORF2p was significantly increased after HI with an accompanying increase of LINE-1 DNA content and ssDNA found in the cytosol, which suggests that LINE-1 is activated and reverse transcription takes place after HI. Enhanced LINE-1 expression was previously detected in the adult rat striatum and dentate gyrus after methamphetamine administration [67], and in the adult midbrain dopaminergic neurons, a class of neurons that degenerate in Parkinson’s disease, in an in vivo model of acute oxidative stress induced cell death [38]. LINE-1 expression was also increased in the ischemic heart and the presence of ORF1p and ORF2p proteins was demonstrated. Generally, LINE-1 becomes activated primarily upon stress, during aging and in age-related diseases [68,69]. In agreement with this, we found that LINE-1 mRNA levels were higher in the adult rat hippocampus, cortex and spleen, when compared to P10 rats. Interestingly, similar to STING, we found the most robust expression of LINE-1 in the spleen. Consistently, Simon et al. found higher levels of LINE-1 transcripts in the spleen than in the liver and brain [34]. LINE-1 RNA has been previously detected in the liver, kidney and skeletal muscle of the adult rat [70], however, we could not detect LINE-1 mRNA in P10 or in adult rat livers.
Recent evidence suggests that LINE-1 activity in somatic tissues contributes to neurodegeneration [39,66,71], with abnormally high levels of expression of several retrotransposon families reported across a suite of neurodegenerative diseases [72]. A previous study demonstrated that LINE-1 transcriptional activation in rat chloroleukemia cells in culture induces cell death by apoptosis within 24h after population reaches the maximal density [73]. We found that neurons expressing ORF1p and ORF2p are positive for FJC, suggesting that they are undergoing degeneration. ORF2p, a protein with a reverse transcriptase activity, was activated in neurons after HI in our study, which suggests that some part of the LINE-1 DNA, which we detected in the cytosolic fraction of the ipsilateral hemispheres of rats subjected to HI, may be derived from reverse transcription of mRNA to DNA. Reverse transcription inhibitor Stavudine decreased the LINE-1 DNA content in the cytosolic fraction, suggesting that it blocked the reverse transcription of LINE-1. It was shown previously, that inhibition of LINE-1 reverse transcription led to a reduction of cytosolic DNA in TREX-1-deficient neural cells [36]. In our study Stavudine reduced the number of degenerating neurons in the cerebral cortex of the ipsilateral hemispheres after HI, which was accompanied by a reduced expression of proapoptotic proteins – Bax and cleaved caspase 3, suggesting that the protective mechanism of Stavudine might involve antiapoptotic function. Such properties of Stavudine have been demonstrated before - it has been shown that accumulation of cytosolic DNA induced toxicity in human neurons, and that Stavudine prevented the accumulation of ssDNA in the cytosol of neural cells, decreased cleaved caspase 3 expression, and prevented neuronal apoptosis [36]. It was also demonstrated that reduction of LINE-1 activity through siRNA or Stavudine, protected the embryonic midbrain neurons in culture, and the adult midbrain dopaminergic neurons [38]. A study in the isolated, perfused rat hearts showed that the direct inhibition of LINE-1 with antisense oligonucleotides reduced infarction size [74], which shows that LINE-1 can be a potential therapeutic target in ischemia. A recent study from Simon et al. supports the hypothesis that LINE-1 can elicit detrimental pathways. SIRT6 deficient tissues from KO mice accumulated abundant cytoplasmic LINE-1 cDNA, which triggered cGAS response. Use of NRTIs, among them Stavudine, significantly improved the health and lifespan of SIRT6 knockout mice and completely rescued cGAS activation [34].
We found that blocking STING, cGAS or LINE-1 has decreased neuronal death in the cerebral cortex, but not in the hippocampus. In previous studies, cell death in the hippocampus has been detected as early as 5 hours post HI injury. In the cortex, however, a different pattern of cell loss occurred, with DNA degradation not seen until 24h post-HI, mitochondria remaining intact and cells basophilic for a longer time compared to the hippocampus [48]. Fluoro-Jade B staining and terminal deoxynucleotidyl transferase-mediated dUTP-nick-end-labeling (TUNEL) analysis of the monkey brain undergoing 20 minutes whole brain ischemia followed by reperfusion showed that the motor cortex is significantly more resistant to the ischemic insult compared with CA1 [75]. Those results suggest that hippocampal neurons may be more vulnerable to the HI insult than cortical neurons [76]. We found that cGAS/STING pathway was mainly activated in the later phase, between 24 and 48h after HI, which suggests that early hippocampal neurodegeneration occurs without involvement of cGAS/STING, and that STING might be more involved in cortical than hippocampal neurodegeneration.
Cell death can take many forms, with programmed apoptotic and uncontrolled necrotic cell death marking the extremes of the spectrum of possibilities [26], and new contributing CNS-specific mechanisms discovered recently [77–79]. Studies of transient or permanent focal ischemia models suggest that apoptotic and necrotic death mechanisms are concomitantly and independently activated in the same ischemic neurons after ischemia/reperfusion [27,80]. Cathepsin B can direct the cell towards both necrosis and apoptosis. Activation of Cathepsin B leads to the rupture of cellular and lysosomal membranes, and causes autolysis and apoptosis [81]. Lysosomal rupture plays an important role in neuronal death during ischemia [26,27,82,83]. Cathepsin B’s proteolytic activity removes apoptosis-preventing Bcl-xl and degrades a cysteine protease that would otherwise have eliminated apoptosis-promoting Bax, indirectly keeping up the cellular levels of Bax. It has been reported that Cathepsin B dependent cleavage of Bid led to the permeabilization of the outer mitochondrial membrane, release of cytochrome-c into the cytosol, and activation of caspase 3 [84]. Cathepsin B was also shown to mediate the secondary neurodegeneration in the ipsilateral Substantia Nigra [81] and in the thalamus in a permanent distal branch of middle cerebral artery occlusion (dMCAO) model in adult rats [28]. In our study, inhibition of cGAS/STING signaling was accompanied by decreased Cathepsin B level and decreased Bax and cleaved caspase-3 expression.
Our study has its limitations. Firstly, our experiments focused on short-term effects of cGAS/STING inhibition in experimental HI, and it is necessary to check outcomes at longer time-point to confirm the efficacy of the treatments and assess the functional recovery. Additionally, as the effects of STING inhibition on infarction were rather mild, in the future the use of STING KO mice might be considered to check the effect of total knockout. Lastly, we didn’t test the efficacy of higher dose of RU.521, however we don’t exclude the possibility that higher dose of RU.521 might be more effective in cGAS/STING pathway inhibition. The observed protective effects of STING inhibition in our study may be also related with the role of STING in neuroinflammation. Recent study demonstrated that TBI-induced pro-inflammatory cytokines levels were suppressed in STING KO mice [24].Our next step would be to explore the hypothesis, that STING can contribute to neuroinflammation after HI.
Neurodegeneration leads to multiple behavioral abnormalities in HIE patients. From the perspective of neuronal fate after HI insults, which is regulated by multiple and complex pathways, our findings provide a new mechanism that contributes to neuronal death. Our pharmacological approach using LINE-1/cGAS/STING pathway inhibitors results in at least a partial rescue of cortical degeneration, and thus may offer new targets for therapeutic intervention against delayed neuronal death.
Supplementary Material
Fig.9.
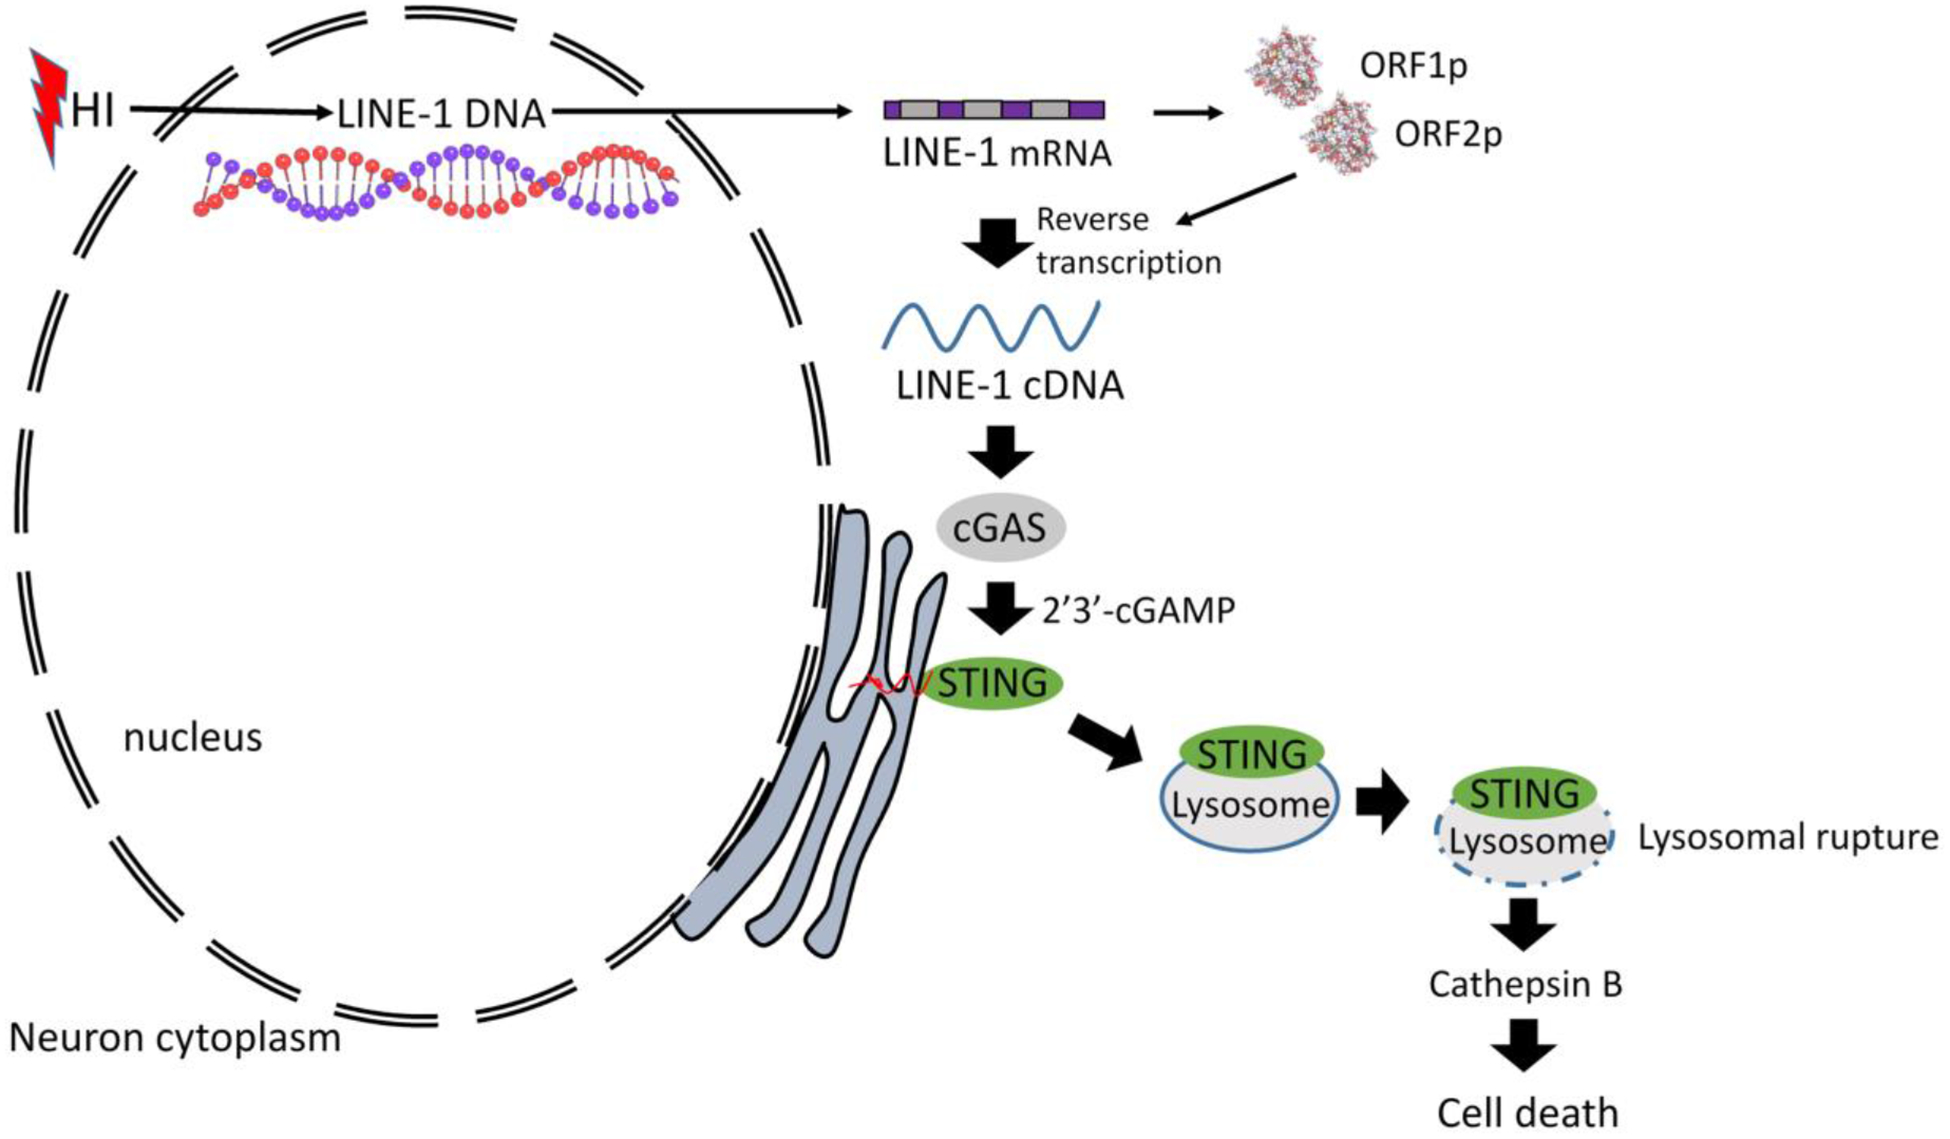
The proposed mechanism for the present study.
Highlights:
cGAS/STING pathway is activated after HI in neonatal rat brain
After HI STING localizes in lysosomes and contributes to Cathepsin B increase
Silencing of STING and inhibiting cGAS limits the progression of HI injury
2’3’-cGAMP reverses the neuroprotective effects of cGAS inhibition
LINE-1 is activated after HI and potentially contributes to cGAS/STING activation
Acknowledgments
The study was supported by a grant from National Institute of Health NS104083 to Dr. John H. Zhang.
Footnotes
Publisher's Disclaimer: This Author Accepted Manuscript is a PDF file of a an unedited peer-reviewed manuscript that has been accepted for publication but has not been copyedited or corrected. The official version of record that is published in the journal is kept up to date and so may therefore differ from this version.
Declaration of Interest
The authors declare no conflict of interest for this study.
References
- [1].Vannucci RC and Vannucci SJ, A model of perinatal hypoxic-ischemic brain damage. Ann N Y Acad Sci, 1997. 835: p. 234–49. [DOI] [PubMed] [Google Scholar]
- [2].Volpe JJ: Perinatal brain injury: from pathogenesis to neuroprotection. Ment Retard Dev Disabil Res Rev 2001, 7:56–64. [DOI] [PubMed] [Google Scholar]
- [3].Shetty J: Neonatal seizures in hypoxic-ischaemic encephalopathy--risks and benefits of anticonvulsant therapy. Dev Med Child Neurol 2015, 57 Suppl 3:40–43. [DOI] [PubMed] [Google Scholar]
- [4].Northington FJ, Chavez-Valdez R, Martin LJ: Neuronal cell death in neonatal hypoxia-ischemia. Ann Neurol 2011, 69:743–758. [DOI] [PMC free article] [PubMed] [Google Scholar]
- [5].Gill MB, Perez-Polo JR: Hypoxia ischemia-mediated cell death in neonatal rat brain. Neurochem Res 2008, 33:2379–2389. [DOI] [PubMed] [Google Scholar]
- [6].Badr Zahr LK, Purdy I. Brain injury in the infant: the old, the new, and the uncertain. J Perinat Neonatal Nurs 2006, 20:163–175; quiz 176–167. [DOI] [PubMed] [Google Scholar]
- [7].Shankaran S Hypoxic-ischemic encephalopathy and novel strategies for neuroprotection. Clin Perinatol 2012, 39:919–929. [DOI] [PubMed] [Google Scholar]
- [8].Thornton C, Leaw B, Mallard C, Nair S, Jinnai M, Hagberg H. Cell Death in the Developing Brain after Hypoxia-Ischemia. Front Cell Neurosci 2017. August 23;11:248. [DOI] [PMC free article] [PubMed] [Google Scholar]
- [9].Wu J, Sun L, Chen X, Du F, Shi H, Chen C, Chen ZJ. Cyclic GMP-AMP is an endogenous second messenger in innate immune signaling by cytosolic DNA. Science 2013. February 15;339(6121):826–30. [DOI] [PMC free article] [PubMed] [Google Scholar]
- [10].Barber GN. STING: infection, inflammation and cancer. Nature reviews Immunology 2015;15(12):760–770. [DOI] [PMC free article] [PubMed] [Google Scholar]
- [11].Paludan SR, Bowie AG. Immune sensing of DNA. Immunity 2013. May 23;38(5):870–80. [DOI] [PMC free article] [PubMed] [Google Scholar]
- [12].Chen Q, Sun L, Chen ZJ. Regulation and function of the cGAS-STING pathway of cytosolic DNA sensing. Nature immunology 2016;17(10):1142–1149. [DOI] [PubMed] [Google Scholar]
- [13].Ma F, Li B, Yu Y, Iyer SS, Sun M, Cheng G. Positive feedback regulation of type I interferon by the interferon-stimulated gene STING. EMBO Rep 2015. February;16(2):202–12. [DOI] [PMC free article] [PubMed] [Google Scholar]
- [14].Larkin B, Ilyukha V, Sorokin M, Buzdin A, Vannier E, Poltorak A. Cutting Edge: Activation of STING in T Cells Induces Type I IFN Responses and Cell Death. J Immunol 2017. July 15;199(2):397–402. [DOI] [PMC free article] [PubMed] [Google Scholar]
- [15].Sun L, Wu J, Du F, Chen X, Chen ZJ. Cyclic GMP-AMP synthase is a cytosolic DNA sensor that activates the type I interferon pathway. Science 2013. February 15;339(6121):786–91. [DOI] [PMC free article] [PubMed] [Google Scholar]
- [16].Luecke S, Holleufer A, Christensen MH, Jønsson KL, Boni GA, Sørensen LK, Johannsen M, Jakobsen MR, Hartmann R, Paludan SR. cGAS is activated by DNA in a length-dependent manner. EMBO Rep 2017. October;18(10):1707–1715. [DOI] [PMC free article] [PubMed] [Google Scholar]
- [17].Xiao TS, Fitzgerald KA. The cGAS-STING pathway for DNA sensing. Mol Cell 2013. July 25;51(2):135–9. [DOI] [PMC free article] [PubMed] [Google Scholar]
- [18].Fang C, Wei X, Wei Y. Mitochondrial DNA in the regulation of innate immune responses. Protein Cell 2016. January;7(1):11–6. [DOI] [PMC free article] [PubMed] [Google Scholar]
- [19].Glück S, Guey B, Gulen MF, Wolter K, Kang TW, Schmacke NA, Bridgeman A, Rehwinkel J, Zender L, Ablasser A. Innate immune sensing of cytosolic chromatin fragments through cGAS promotes senescence. Nat Cell Biol 2017. September;19(9):1061–1070. [DOI] [PMC free article] [PubMed] [Google Scholar]
- [20].Qiao JT, Cui C, Qing L, Wang LS, He TY, Yan F, Liu FQ, Shen YH, Hou XG, Chen L. Activation of the STING-IRF3 pathway promotes hepatocyte inflammation, apoptosis and induces metabolic disorders in nonalcoholic fatty liver disease. Metabolism 2018. April;81:13–24. [DOI] [PubMed] [Google Scholar]
- [21].Petrasek J, Iracheta-Vellve A, Csak T, Satishchandran A, Kodys K, Kurt-Jones EA, Fitzgerald KA, Szabo G. STING-IRF3 pathway links endoplasmic reticulum stress with hepatocyte apoptosis in early alcoholic liver disease. Proc Natl Acad Sci U S A 2013. October 8;110(41):16544–9. [DOI] [PMC free article] [PubMed] [Google Scholar]
- [22].Cao DJ, Schiattarella GG, Villalobos E, Jiang N, May HI, Li T, Chen ZJ, Gillette TG, Hill JA. Cytosolic DNA Sensing Promotes Macrophage Transformation and Governs Myocardial Ischemic Injury. Circulation 2018. June 12;137(24):2613–2634. [DOI] [PMC free article] [PubMed] [Google Scholar]
- [23].King KR, Aguirre AD, Ye YX, Sun Y, Roh JD, Ng RP Jr, Kohler RH, Arlauckas SP, Iwamoto Y, Savol A, Sadreyev RI, Kelly M, Fitzgibbons TP, Fitzgerald KA, Mitchison T, Libby P, Nahrendorf M, Weissleder R. IRF3 and type I interferons fuel a fatal response to myocardial infarction. Nat Med 2017. December;23(12):1481–1487. [DOI] [PMC free article] [PubMed] [Google Scholar]
- [24].Abdullah A, Zhang M, Frugier T, Bedoui S, Taylor JM, Crack PJ. STING-mediated type-I interferons contribute to the neuroinflammatory process and detrimental effects following traumatic brain injury. J Neuroinflammation 2018. November 21;15(1):323. [DOI] [PMC free article] [PubMed] [Google Scholar]
- [25].Gaidt MM, Ebert TS, Chauhan D, Ramshorn K, Pinci F, Zuber S, O’Duill F, Schmid-Burgk JL, Hoss F, Buhmann R, Wittmann G, Latz E, Subklewe M, Hornung V. The DNA Inflammasome in Human Myeloid Cells Is Initiated by a STING-Cell Death Program Upstream of NLRP3. Cell 2017. November 16;171(5):1110–1124.e18. [DOI] [PMC free article] [PubMed] [Google Scholar]
- [26].de Castro MA, Bunt G, Wouters FS. Cathepsin B launches an apoptotic exit effort upon cell death-associated disruption of lysosomes. Cell Death Discov 2016. February 29;2:16012. [DOI] [PMC free article] [PubMed] [Google Scholar]
- [27].Kilinc M, Gürsoy-Ozdemir Y, Gürer G, Erdener SE, Erdemli E, Can A, Dalkara T. Lysosomal rupture, necroapoptotic interactions and potential crosstalk between cysteine proteases in neurons shortly after focal ischemia. Neurobiol. Dis 2010, 40, 293–302. [DOI] [PubMed] [Google Scholar]
- [28].Zuo X, Hou Q, Jin J, Zhan L, Li X, Sun W, et al. Inhibition of cathepsin B alleviates secondary degeneration in ipsilateral thalamus after focal cerebral infarction in adult rats. J. Neuropathol. Exp. Neurol 2016; 75, 816–826. [DOI] [PubMed] [Google Scholar]
- [29].Wang ZS, Liu YL, Mi N, Duan DY. Intracellular DNA sensing pathway of cGAS-cGAMP is decreased in human newborns and young children. Mol Immunol 2017. July;87:76–85. [DOI] [PubMed] [Google Scholar]
- [30].Ferriero DM, Miller SP. Imaging selective vulnerability in the developing nervous system. J. Anat 2010; 217, 429–435. [DOI] [PMC free article] [PubMed] [Google Scholar]
- [31].Brégnard C, Guerra J, Déjardin S, Passalacqua F, Benkirane M, Laguette N. Upregulated LINE-1 Activity in the Fanconi Anemia Cancer Susceptibility Syndrome Leads to Spontaneous Pro-inflammatory Cytokine Production. EBioMedicine 2016. June;8:184–194. [DOI] [PMC free article] [PubMed] [Google Scholar]
- [32].De Cecco M, Ito T, Petrashen AP, Elias AE1, Skvir NJ, Criscione SW, Caligiana A, Brocculi G, Adney EM, Boeke JD, Le O, Beauséjour C, Ambati J, Ambati K, Simon M, Seluanov A, Gorbunova V, Slagboom PE, Helfand SL, Neretti N, Sedivy JM. L1 drives IFN in senescent cells and promotes age-associated inflammation. Nature 2019. February;566(7742):73–78. [DOI] [PMC free article] [PubMed] [Google Scholar]
- [33].Nakaya Y, Lilue J, Stavrou S, Moran EA, Ross SR. AIM2-Like Receptors Positively and Negatively Regulate the Interferon Response Induced by Cytosolic DNA. MBio 2017. July 5;8(4). pii: e00944–17. [DOI] [PMC free article] [PubMed] [Google Scholar]
- [34].Simon M, Van Meter M, Ablaeva J, Ke Z, Gonzalez RS, Taguchi T, De Cecco M, Leonova KI, Kogan V, Helfand SL, Neretti N, Roichman A, Cohen HY, Meer MV, Gladyshev VN, Antoch MP, Gudkov AV, Sedivy JM, Seluanov A, Gorbunova V. LINE1 Derepression in Aged Wild-Type and SIRT6-Deficient Mice Drives Inflammation. Cell Metab 2019. April 2;29(4):871–885.e5. [DOI] [PMC free article] [PubMed] [Google Scholar]
- [35].Jones RB, Song H, Xu Y, Garrison KE, Buzdin AA, Anwar N, Hunter DV, Mujib S, Mihajlovic V, Martin E, Lee E, Kuciak M, Raposo RA,A, Meiklejohn DA, Ndhlovu LC, Nixon DF, Ostrowski MA. Bozorgzad LINE-1 retrotransposable element DNA accumulates in HIV-1-infected cells. J Virol 2013. December;87(24):13307–20. [DOI] [PMC free article] [PubMed] [Google Scholar]
- [36].Thomas CA, Tejwani L, Trujillo CA, Negraes PD, Herai RH, Mesci P, Macia A, Crow YJ, Muotri AR. Modeling of TREX1-Dependent Autoimmune Disease using Human Stem Cells Highlights L1 Accumulation as a Source of Neuroinflammation. Cell Stem Cell 2017. September 7;21(3):319–331.e8. [DOI] [PMC free article] [PubMed] [Google Scholar]
- [37].Ivancevic AM, Kortschak RD, Bertozzi T, Adelson DL. LINEs between Species: Evolutionary Dynamics of LINE-1 Retrotransposons across the Eukaryotic Tree of Life. Genome Biol Evol 2016. December 14;8(11):3301–3322. [DOI] [PMC free article] [PubMed] [Google Scholar]
- [38].Blaudin de Thé FX, Rekaik H, Peze-Heidsieck E, Massiani-Beaudoin O, Joshi RL, Fuchs J, Prochiantz A. Engrailed homeoprotein blocks degeneration in adult dopaminergic neurons through LINE-1 repression. EMBO J 2018. August 1;37(15). pii: e97374. [DOI] [PMC free article] [PubMed] [Google Scholar]
- [39].Reilly MT, Faulkner GJ, Dubnau J, Ponomarev I, Gage FH. The role of transposable elements in health and diseases of the central nervous system. J Neurosci 2013; 6;33(45):17577–86. [DOI] [PMC free article] [PubMed] [Google Scholar]
- [40].Rice JE 3rd, Vannucci RC, Brierley JB. The influence of immaturity on hypoxic ischemic brain damage in the rat, Ann. Neurol 9 (2) (1981) 131–141. [DOI] [PubMed] [Google Scholar]
- [41].Nakajima H, Kubo T, Semi Y, Itakura M, Kuwamura M, Izawa T, Azuma YT, Takeuchi T. A rapid, targeted, neuron-selective, in vivo knockdown following a single intracerebroventricular injection of a novel chemically modified siRNA in the adult rat brain. J Biotechnol 2012. January 20;157(2):326–33. [DOI] [PubMed] [Google Scholar]
- [42].Liu NW, Ke CC, Zhao Y, Chen YA, Chan KC, Tan DT, et al. , Evolutional characterization of photochemically induced stroke in rats: a multimodality imaging and molecular biological study, Transl. Stroke Res 2017; 8 (3) 244–256. [DOI] [PMC free article] [PubMed] [Google Scholar]
- [43].Feather-Schussler DN, Ferguson TS. A Battery of Motor Tests in a Neonatal Mouse Model of Cerebral Palsy. J Vis Exp 2016. November 3; (117). [DOI] [PMC free article] [PubMed] [Google Scholar]
- [44].Jiang B, Li L, Chen Q, Tao Y, Yang L, Zhang B, et al. , Role of glibenclamide in brain injury after intracerebral hemorrhage, Transl. Stroke Res 8 (2) (2017) 183–193. [DOI] [PubMed] [Google Scholar]
- [45].Pokatayev V, Hasin N, Chon H, Cerritelli SM, Sakhuja K, Ward JM, Morris HD, Yan N, Crouch RJ. RNase H2 catalytic core Aicardi-Goutières syndrome-related mutant invokes cGAS-STING innate immune-sensing pathway in mice. J Exp Med 2016. March 7;213(3):329–36. [DOI] [PMC free article] [PubMed] [Google Scholar]
- [46].Penzkofer T, Jäger M, Figlerowicz M, Badge R, Mundlos S, Robinson PN,, Zemojtel T. L1Base 2: more retrotransposition-active LINE-1s, more mammalian genomes. Nucleic Acids Res 2017. January 4;45(D1):D68–D73 [DOI] [PMC free article] [PubMed] [Google Scholar]
- [47].Nakajima W, Ishida A, Lange MS, Gabrielson KL, Wilson MA, Martin LJ, Blue ME, Johnston MV: Apoptosis has a prolonged role in the neurodegeneration after hypoxic ischemia in the newborn rat. J Neurosci 2000, 20:7994–8004. [DOI] [PMC free article] [PubMed] [Google Scholar]
- [48].Beilharz EJ, Williams CE, Dragunow M, Sirimanne ES, Gluckman PD. Mechanisms of delayed cell death following hypoxic-ischemic injury in the immature rat: evidence for apoptosis during selective neuronal loss. Brain Res Mol Brain Res 1995. March;29(1):1–14. [DOI] [PubMed] [Google Scholar]
- [49].Hossain MA, Russell JC, O’Brien R, Laterra J. Neuronal pentraxin 1: a novel mediator of hypoxic-ischemic injury in neonatal brain. J Neurosci 2004. April 28;24(17):4187–96. [DOI] [PMC free article] [PubMed] [Google Scholar]
- [50].Vincent J, Adura C, Gao P, Luz A, Lama L, Asano Y, Okamoto R, Imaeda T, Aida J, Rothamel K, Gogakos T, Steinberg J, Reasoner S, Aso K, Tuschl T, Patel DJ, Glickman JF, Ascano M. Small molecule inhibition of cGAS reduces interferon expression in primary macrophages from autoimmune mice. Nat Commun 2017. September 29;8(1):750. [DOI] [PMC free article] [PubMed] [Google Scholar]
- [51].Pizarro JG, Cristofari G. Post-Transcriptional Control of LINE-1 Retrotransposition by Cellular Host Factors in Somatic Cells. Front Cell Dev Biol 2016; 4: 14. [DOI] [PMC free article] [PubMed] [Google Scholar]
- [52].Stetson DB, Ko JS, Heidmann T, Medzhitov R. Trex1 prevents cell-intrinsic initiation of autoimmunity. Cell, 134 (2008), pp. 587–598 [DOI] [PMC free article] [PubMed] [Google Scholar]
- [53].Yang YG, Lindahl T, Barnes DE. Trex1 exonuclease degrades ssDNA to prevent chronic checkpoint activation and autoimmune disease. Cell 2007; 131:873–886. [DOI] [PubMed] [Google Scholar]
- [54].Ablasser A, Hemmerling I, Schmid-Burgk JL, Behrendt R, Roers A, Hornung V. TREX1 deficiency triggers cell-autonomous immunity in a cGAS-dependent manner. J Immunol 2014. June 15;192(12):5993–7. [DOI] [PubMed] [Google Scholar]
- [55].Li P, Du J, Goodier JL, Hou J, Kang J, Kazazian HH Jr, Zhao K, Yu XF. Aicardi-Goutières syndrome protein TREX1 suppresses L1 and maintains genome integrity through exonuclease-independent ORF1p depletion. Nucleic Acids Res 2017. 5;45(8):4619–4631. [DOI] [PMC free article] [PubMed] [Google Scholar]
- [56].Dai L, Huang Q, Boeke JD. Effect of reverse transcriptase inhibitors on LINE-1 and Ty1 reverse transcriptase activities and on LINE-1 retrotransposition. BMC Biochem 2011. May 5;12:18. [DOI] [PMC free article] [PubMed] [Google Scholar]
- [57].Jones RB, Garrison KE, Wong JC, Duan EH, Nixon DF, Ostrowski MA. Nucleoside analogue reverse transcriptase inhibitors differentially inhibit human LINE-1 retrotransposition. PLoS One 2008. February 6;3(2):e1547. [DOI] [PMC free article] [PubMed] [Google Scholar]
- [58].Li T, Chen ZJ. The cGAS-cGAMP-STING pathway connects DNA damage to inflammation, senescence, and cancer. J Exp Med 2018; 7;215(5):1287–1299. [DOI] [PMC free article] [PubMed] [Google Scholar]
- [59].Fagerberg L, Hallström BM, Oksvold P, Kampf C, Djureinovic D, et al. Analysis of the human tissue-specific expression by genome-wide integration of transcriptomics and antibody-based proteomics. Mol Cell Proteomics (IF: 5.232) 2014. February;13(2):397–406. [DOI] [PMC free article] [PubMed] [Google Scholar]
- [60].Yue F, Cheng Y, Breschi A, Vierstra J, Wu W, et al. , A comparative encyclopedia of DNA elements in the mouse genome. Nature 2014; 20;515(7527):355–64. [DOI] [PMC free article] [PubMed] [Google Scholar]
- [61].Fathali N, Ostrowski RP, Hasegawa Y, Lekic T, Tang J, Zhang JH. Splenic immune cells in experimental neonatal hypoxia-ischemia. Transl Stroke Res 2013. April;4(2):208–19. [DOI] [PMC free article] [PubMed] [Google Scholar]
- [62].Tang CH, Zundell JA, Ranatunga S, Lin C, Nefedova Y, Del Valle JR, Hu CC. Agonist-Mediated Activation of STING Induces Apoptosis in Malignant B Cells. Cancer Res 2016. April 15;76(8):2137–52. [DOI] [PMC free article] [PubMed] [Google Scholar]
- [63].Liu S, Guan W. STING Signaling Promotes Apoptosis, Necrosis, and Cell Death: An Overview and Update. Mediators Inflamm 2018. November 25;2018:1202797. [DOI] [PMC free article] [PubMed] [Google Scholar]
- [64].Sharma R, Rodić N, Burns KH, Taylor MS. Immunodetection of Human LINE-1 Expression in Cultured Cells and Human Tissues. Methods Mol Biol 2016;1400:261–80. [DOI] [PMC free article] [PubMed] [Google Scholar]
- [65].Rangasamy D, Lenka N, Ohms S, Dahlstrom JE, Blackburn AC, Board PG. Activation of LINE-1 Retrotransposon Increases the Risk of Epithelial-Mesenchymal Transition and Metastasis in Epithelial Cancer. Curr Mol Med 2015;15(7):588–97. [DOI] [PMC free article] [PubMed] [Google Scholar]
- [66].Suarez NA, Macia A, Muotri AR. LINE-1 retrotransposons in healthy and diseased human brain. Dev Neurobiol 2018. May;78(5):434–455. [DOI] [PMC free article] [PubMed] [Google Scholar]
- [67].Moszczynska A, Flack A, Qiu P, Muotri AR, Killinger BA. Neurotoxic Methamphetamine Doses Increase LINE-1 Expression in the Neurogenic Zones of the Adult Rat Brain. Sci Rep 2015. October 14;5:14356. [DOI] [PMC free article] [PubMed] [Google Scholar]
- [68].Li W, Prazak L, Chatterjee N, Grüninger S, Krug L, Theodorou D, Dubnau J. Activation of transposable elements during aging and neuronal decline in Drosophila. 2013. Nat Neurosci 16: 529–531 [DOI] [PMC free article] [PubMed] [Google Scholar]
- [69].Li W, Jin Y, Prazak L, Hammell M, Dubnau J. Transposable elements in TDP-43-mediated neurodegenerative disorders. 2012. PLoS One 7: e44099. [DOI] [PMC free article] [PubMed] [Google Scholar]
- [70].Kirilyuk A, Tolstonog GV, Damert A, Held U, Hahn S, Löwer R, Buschmann C, Horn AV, Traub P, Schumann GG. Functional endogenous LINE-1 retrotransposons are expressed and mobilized in rat chloroleukemia cells. Nucleic Acids Res 2008. February;36(2):648–65. [DOI] [PMC free article] [PubMed] [Google Scholar]
- [71].Pereira GC, Sanchez L, Schaughency PM, Rubio-Roldán A, Choi JA, Planet E, Batra R, Turelli P, Trono D, Ostrow LW, Ravits J, Kazazian HH, Wheelan SJ, Heras SR, Mayer J, García-Pérez JL, Goodier JL. Properties of LINE-1 proteins and repeat element expression in the context of amyotrophic lateral sclerosis. Mob DNA 2018. December 15;9:35. [DOI] [PMC free article] [PubMed] [Google Scholar]
- [72].Krug L, Chatterjee N, Borges-Monroy R, Hearn S, Liao WW, Morrill K, Prazak L, Rozhkov N, Theodorou D, Hammell M, Dubnau J. Retrotransposon activation contributes to neurodegeneration in a Drosophila TDP-43 model of ALS. PLoS Genet 2017. March 16;13(3):e1006635. [DOI] [PMC free article] [PubMed] [Google Scholar]
- [73].Servomaa K, Rytömaa T. Suicidal death of rat chloroleukaemia cells by activation of the long interspersed repetitive DNA element (L1Rn). Cell Tissue Kinet 1988. January;21(1):33–43. [DOI] [PubMed] [Google Scholar]
- [74].Lucchinetti E, Feng J, Silva Rd, Tolstonog GV, Schaub MC, Schumann GG, Zaugg M. Inhibition of LINE-1 expression in the heart decreases ischemic damage by activation of Akt/PKB signaling. Physiol Genomics 2006. April 13;25(2):314–24. [DOI] [PubMed] [Google Scholar]
- [75].Zhu H, Yoshimoto T, Imajo-Ohmi S, Dazortsava M, Mathivanan A, Yamashima T. Why are hippocampal CA1 neurons vulnerable but motor cortex neurons resistant to transient ischemia? J Neurochem (IF: 4.609) 2012. February;120(4):574–85. [DOI] [PubMed] [Google Scholar]
- [76].Kreisman NR, Soliman S, Gozal D. Regional differences in hypoxic depolarization and swelling in hippocampal slices. J Neurophysiol (IF: 2.502) 2000. February;83(2):1031–8. [DOI] [PubMed] [Google Scholar]
- [77].Wei X, Gao H, Zou J, Liu X, Chen D, Liao J, Xu Y, Ma L, Tang B, Zhang Z, Cai X, Jin K, Xia Y, Wang Q. Contra-directional Coupling of Nur77 and Nurr1 in Neurodegeneration: A Novel Mechanism for Memantine-Induced Anti-inflammation and Anti-mitochondrial Impairment. Mol Neurobiol 2016. November;53(9):5876–5892. [DOI] [PubMed] [Google Scholar]
- [78].Cho K1. Emerging Roles of Complement Protein C1q in Neurodegeneration. Aging Dis 2019. June 1;10(3):652–663. [DOI] [PMC free article] [PubMed] [Google Scholar]
- [79].Yang Q, Huang Z, Luo Y, Zheng F, Hu Y, Liu H, Zhu S, He M, Xu D, Li Y, Yang M, Yang Y, Wei X, Gao X, Wang W, Ma J, Ma Y, Wang X, Wang Q. Inhibition of Nwd1 activity attenuates neuronal hyperexcitability and GluN2B phosphorylation in the hippocampus. EBioMedicine 2019. September;47:470–483. [DOI] [PMC free article] [PubMed] [Google Scholar]
- [80].Ünal-Çevik I, Kilinc M, Can A, Gürsoy-Ozdemir Y, Dalkara T. Apoptotic and necrotic death mechanisms are concomitantly activated in the same cell after cerebral ischemia. Stroke 2004, 35, 2189–2194. [DOI] [PubMed] [Google Scholar]
- [81].Zuo X, Hou Q, Jin J, Chen X, Zhan L, Tang Y, Shi Z, Sun W, Xu E. Inhibition of Cathepsins B Induces Neuroprotection Against Secondary Degeneration in Ipsilateral Substantia Nigra After Focal Cortical Infarction in Adult Male Rats. Front Aging Neurosci 2018. May 9;10:125. [DOI] [PMC free article] [PubMed] [Google Scholar]
- [82].Qin AP, Zhang HL, Qin ZH. Mechanisms of lysosomal proteases participating in cerebral ischemia-induced neuronal death. Neurosci Bull 2008; 24: 117–123. [DOI] [PMC free article] [PubMed] [Google Scholar]
- [83].Yamashima T, Oikawa S. The role of lysosomal rupture in neuronal death. Prog Neurobiol 2009; 89: 343–358. [DOI] [PubMed] [Google Scholar]
- [84].Xu M, Yang L, Rong JG, Ni Y, Gu WW, Luo Y, et al. Inhibition of cysteine cathepsin B and L activation in astrocytes contributes to neuroprotection against cerebral ischemia via blocking the tBid-mitochondrial apoptotic signaling pathway. Glia 2014; 62, 855–880. [DOI] [PubMed] [Google Scholar]
Associated Data
This section collects any data citations, data availability statements, or supplementary materials included in this article.