Significance
Cultural norms, collective decisions, reproductive behavior, and pathogen transmission all emerge from interaction patterns within animal social groups. These patterns of interaction support group-level phenomena that can influence an individual’s fitness. Here, we analyze social interaction networks across 20 drosophilid species through the comparative method. This study represents an attempt to understand the evolutionary forces shaping social structure in flies. This study establishes an important framework for understanding the interplay between social groups, the ecological environment, and the evolutionary history of flies. This further sets the stage for uncovering common molecular mechanisms governing social behavior in flies, which may be conserved across other animals.
Keywords: social networks, Drosophila, evolution, ecology, behavior
Abstract
Animals interact with each other in species-specific reproducible patterns. These patterns of organization are captured by social network analysis, and social interaction networks (SINs) have been described for a wide variety of species including fish, insects, birds, and mammals. The aim of this study is to understand the evolution of social organization in Drosophila. Using a comparative ecological, phylogenetic, and behavioral approach, the different properties of SINs formed by 20 drosophilids were compared. We investigate whether drosophilid network structures arise from common ancestry, a response to the species’ past climate, other social behaviors, or a combination of these factors. This study shows that differences in past climate predicted the species’ current SIN properties. The drosophilid phylogeny offered no value to predicting species’ differences in SINs through phylogenetic signal tests. This suggests that group-level social behaviors in drosophilid species are shaped by divergent climates. However, we find that the social distance at which flies interact correlated with the drosophilid phylogeny, indicating that behavioral elements of SINs have remained largely unchanged in their evolutionary history. We find a significant correlation of leg length to social distance, outlining the interdependence of anatomy and complex social structures. Although SINs display a complex evolutionary relationship across drosophilids, this study suggests that the ecology, and not common ancestry, contributes to diversity in social structure in Drosophila.
Social network analysis is a statistical tool that reveals patterns of behavior in groups, and it has been applied successfully across the taxonomic spectrum (1–4). These patterns can be examined to better understand how individuals in groups assemble and interact from several points of view, including how individuals contribute to the group, how the group influences its members, and how the environment shapes these interactions. For instance, application of network analysis has shown that the need for essential nutrients, together with nutrient availability, shapes the composition, structure, and dynamics of microbial aggregates (3). In humans, social ties in a network can predict biological phenomena, such as obesity, where social distance plays a role in its spread, but geographic distance does not (4). Comparisons of social networks between monozygotic and dizygotic twins indicate that network measures in humans are likely heritable and are subject to natural selection (5, 6). In general, social network analysis is used to understand group structure and dynamics, to reveal differences between groups, and to assess the influence of environmental factors on groups (1, 2, 7).
Although traditionally considered a solitary insect, there is a growing set of phenomena that point to a rich social life for the vinegar fly, Drosophila melanogaster. Group composition and dynamics affect the timing of circadian locomotor activity (8), frequency of copulation (9), male sperm count (10), sperm precedence (11, 12), expression of cuticular pheromones (9, 13), transcriptional activity (9), and neural plasticity (14). A female’s choice of egg-laying site may be directed by sociochemical cues (15) and influenced by behavioral dynamics between female teachers and others seeking to oviposit their brood (16). Flies display collective feeding strategies and collective escape responses, and they communicate the presence of predators and parasites (17). They engage in social learning (18–20) and display aggression (21). When a diseased individual is present, group dynamics are altered (22). Taken together, these studies, among others, illustrate the biological value of groups as well as a landscape of group dynamics among flies.
This social behavior displayed by Drosophila is amenable to social network analysis, which can be applied to better understand the importance of social interactions in a “solitary” insect. Previously, Schneider et al. (23) had shown that flies form social interaction networks (SINs) and that associated metrics are strain dependent, indicating a genetic contribution to their structure. The ability of flies to form these networks depends on chemical signaling and touch (23). Although they found no evidence that individuals play specific roles in the network, the network characteristics they measured were stable (23). Furthermore, the individuals within these networks display preferential attachment, an individual’s predisposition to interact with others of similar social status. Interestingly, D. melanogaster SINs do not depend on levels of locomotor activity or frequency of encounters but rather, on interactions between individuals in proximity, defined by distance, angle, and time criteria (23). Such criteria are commonly adopted as a proxy for relationships between individuals in other animals (7). Other groups have published on networks in D. melanogaster, including Pasquaretta et al. (24), who emphasized mathematical features of the network, and Liu et al. (25), who showed the effects of social isolation on group dynamics. In addition, Jiang et al. (26) have extended the earlier observation that group dynamics rely on touch (23). Social network analysis reveals the presence of group structure and dynamics in Drosophila that have eluded the naked eye of the human observer.
Here, we asked whether SINs occur in other Drosophila species, aside from D. melanogaster, and accordingly, how they might differ. We look for evidence that social network structure is evolving within drosophilids. Our findings show that males and females of all of these species form SINs and that the structure of the network varies across the phylogenetic tree. Similar to another study on nonhuman primates, the phylogenetic signal is low in relation to Drosophila network structure (27). Instead, differences among species are most strongly predicted by behavioral elements of the network. Historic climate patterns from the species’ collection sites correlate significantly with differences in the networks. Moreover, the combination of behavioral elements and the influence of climate patterns is stronger than either one alone in predicting most network metrics. Our data support the idea that SINs are conserved among drosophilids and that their past ecological environment contributes to their present social structure. Whereas the formation of groups has been a feature of life throughout evolutionary time, we speculate that, like the genetic substrate for learning, circadian clocks, and the animal body plan, the genetic substrate for social life in animals is part of a conserved toolkit.
Results
Variation in Social Behavior.
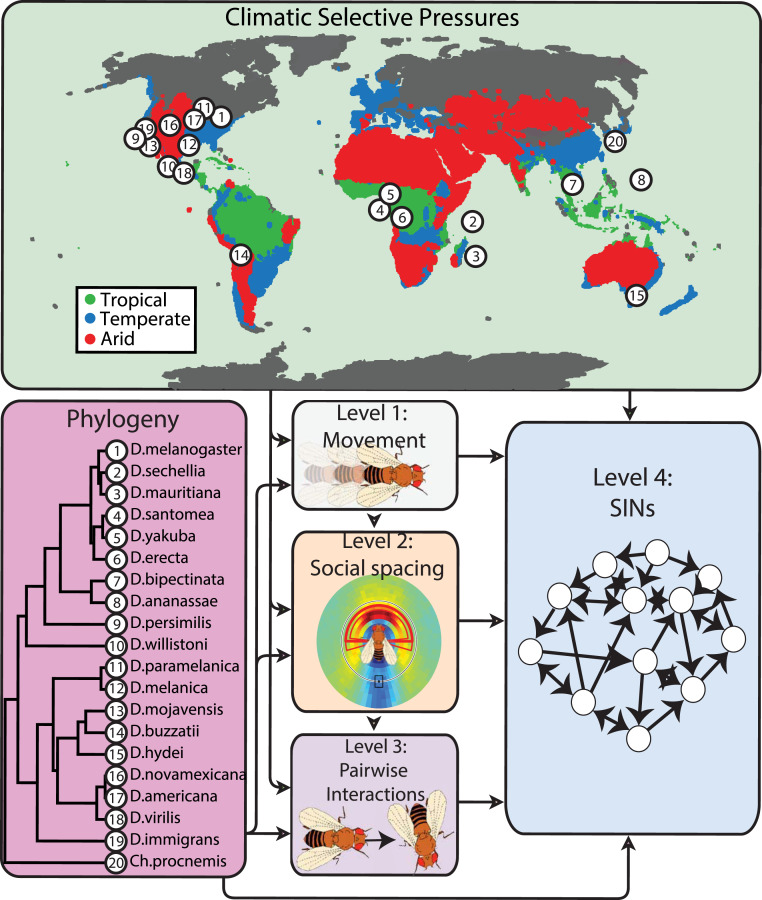
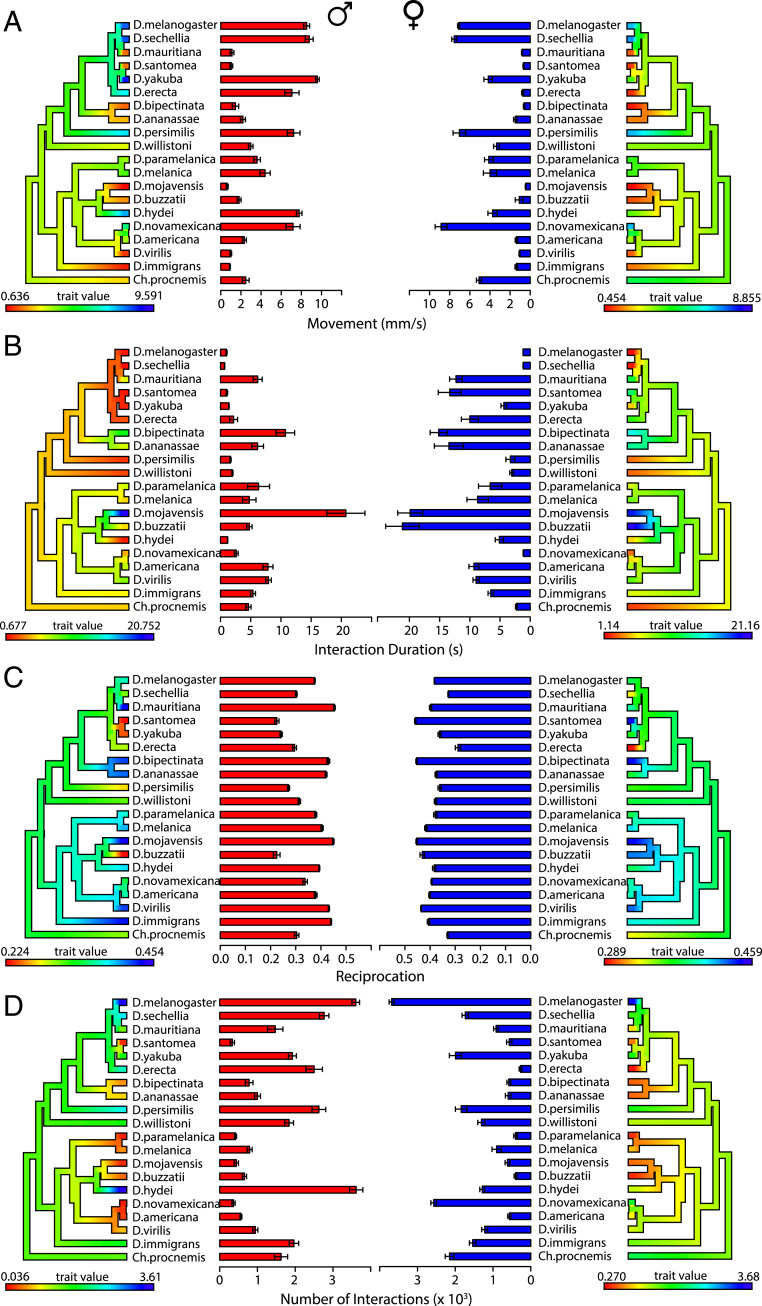
The movement, social spacing, and pairwise interactions (Fig. 1 and Table 1), which we collectively refer to as behavioral elements, vary across all species. The movement of some species, such as Drosophila mojavensis, Drosophila immigrans, Drosophila virilis, Drosophila santomea, and Drosophila mauritiana, was noticeably sedentary compared with more active species, such as D. melanogaster (Fig. 2A). Overall, the male flies in all species were more active than the female flies, except for Drosophila novamexicana and the outgroup species Chymomyza procnemis (Fig. 2). A two-way ANOVA shows significant species-by-sex interaction effects for movement (P < 0.0001) (Fig. 2).
Fig. 1.
Visual map of our aim to disentangle what influences variation in drosophilid SINs. Variation in SINs may be influenced by past climatic selective pressures, common ancestry, and through a hierarchy of behavioral elements in order of increasing complexity: movement (level 1), the social spacing between interacting flies (level 2), and pairwise social interactions (level 3). Table 1 shows definitions of each of these elements. The phylogeny (56) lists the evolutionary history of the 20 drosophilid species we studied. The world map outlines the coordinates of the geographic origin of each species stock we studied. The coloration on the map indicates tropical regions (green), arid regions (red), and temperate regions (blue) based on the Koppen–Geiger climate classification (59). Table 1 shows definitions of each behavioral measure within these three categories.
Table 1.
A glossary of all behavioral measurements discussed in this article
| Category | Term | Description | Units of measure |
Movement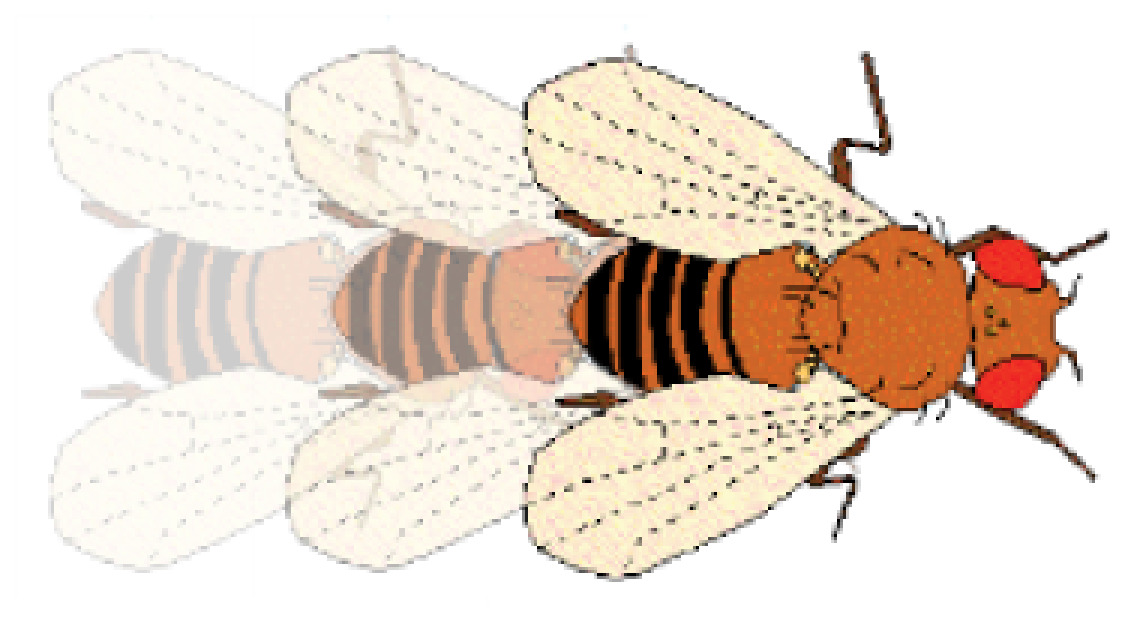
|
Movement | The mean locomotor activity of all flies within the arena. The movement score is calculated by tracking the motion of each fly in all video trials using Ctrax. | Millimeters per second |
Social spacing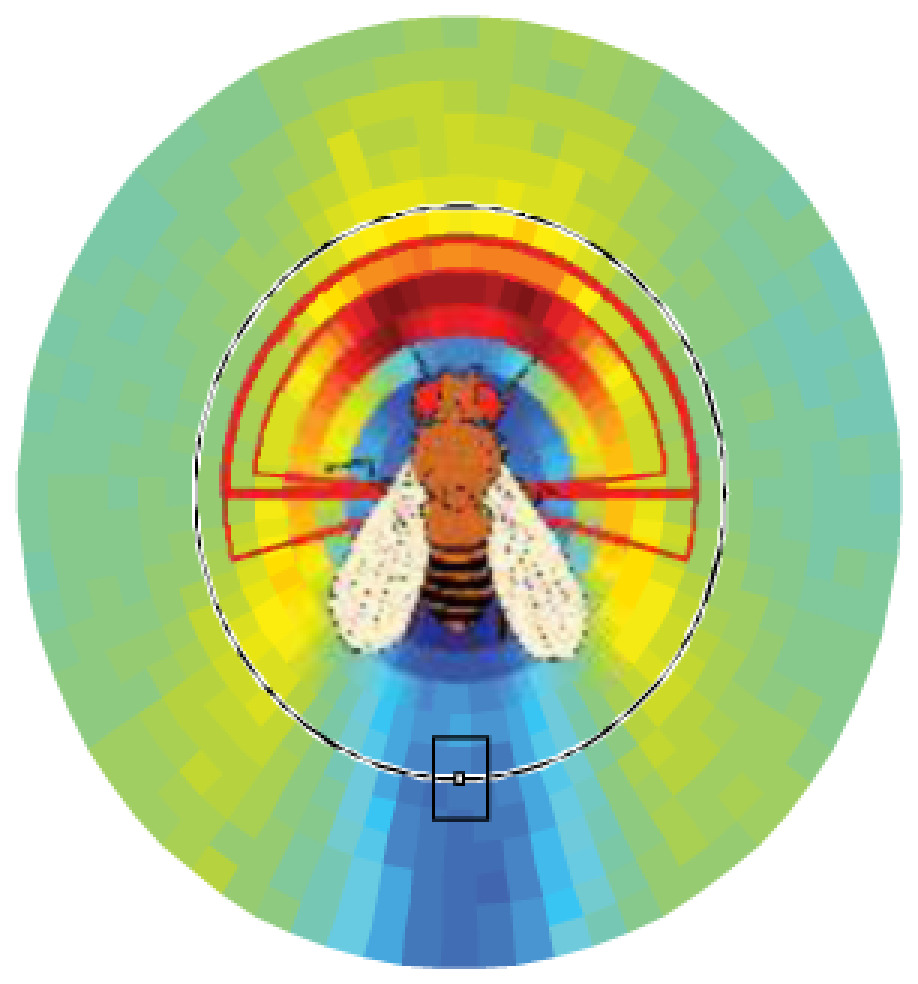
|
Distance | The minimum distance required for two or more flies to be considered in a social interaction space. | Body lengths |
| Angle | The minimum angle required for two or more flies to be considered in a social interaction space. | Degrees | |
| Time | The minimum time required to fulfill a social interaction between two or more flies within an interaction space. | Seconds | |
Pairwise interactions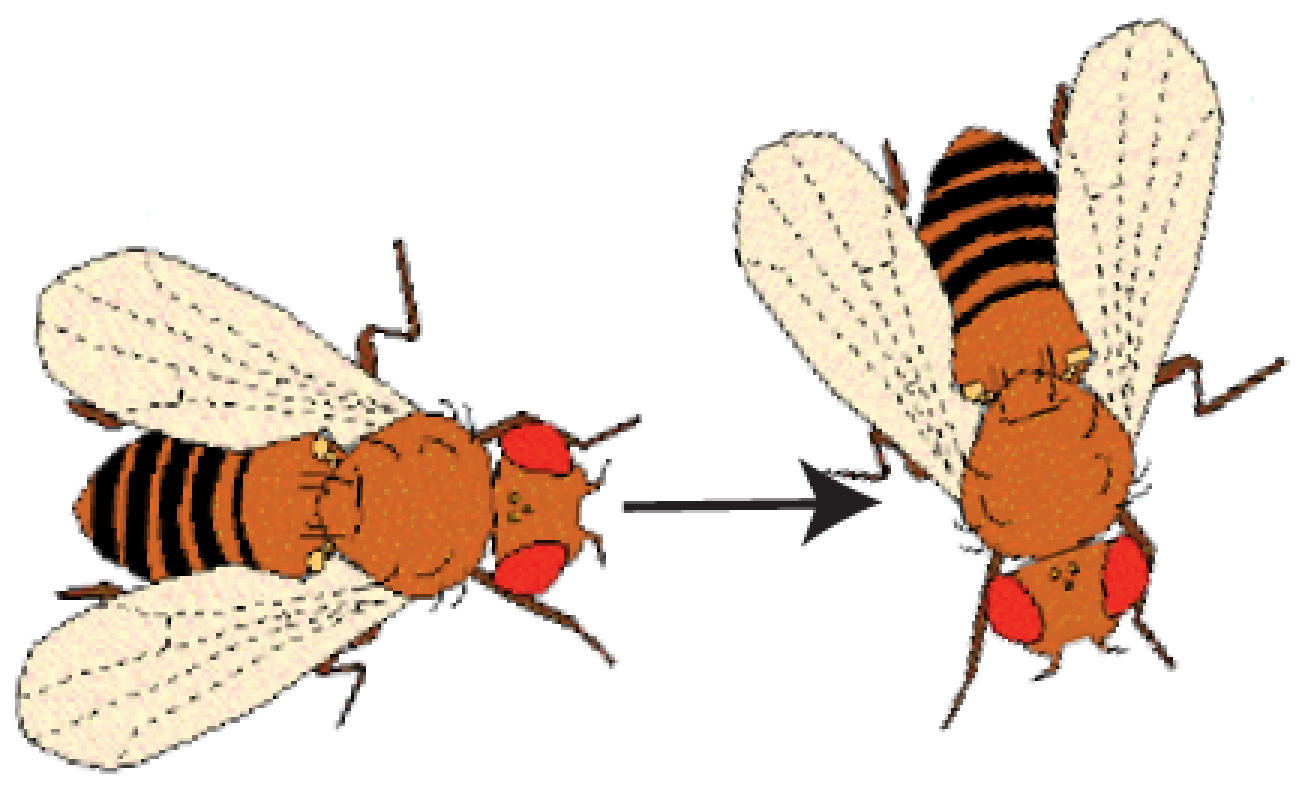
|
Interaction duration | The mean time elapsed between socially interacting flies. Requires the social spacing criteria to be fulfilled. | Seconds |
| Reciprocation | The mean proportion of social interactions that are reciprocated. Requires the social spacing criteria to be fulfilled. | Percentage | |
| No. of interactions | The mean number of social interactions, as defined by the social spacing criteria. | Total count per video trial | |
SINs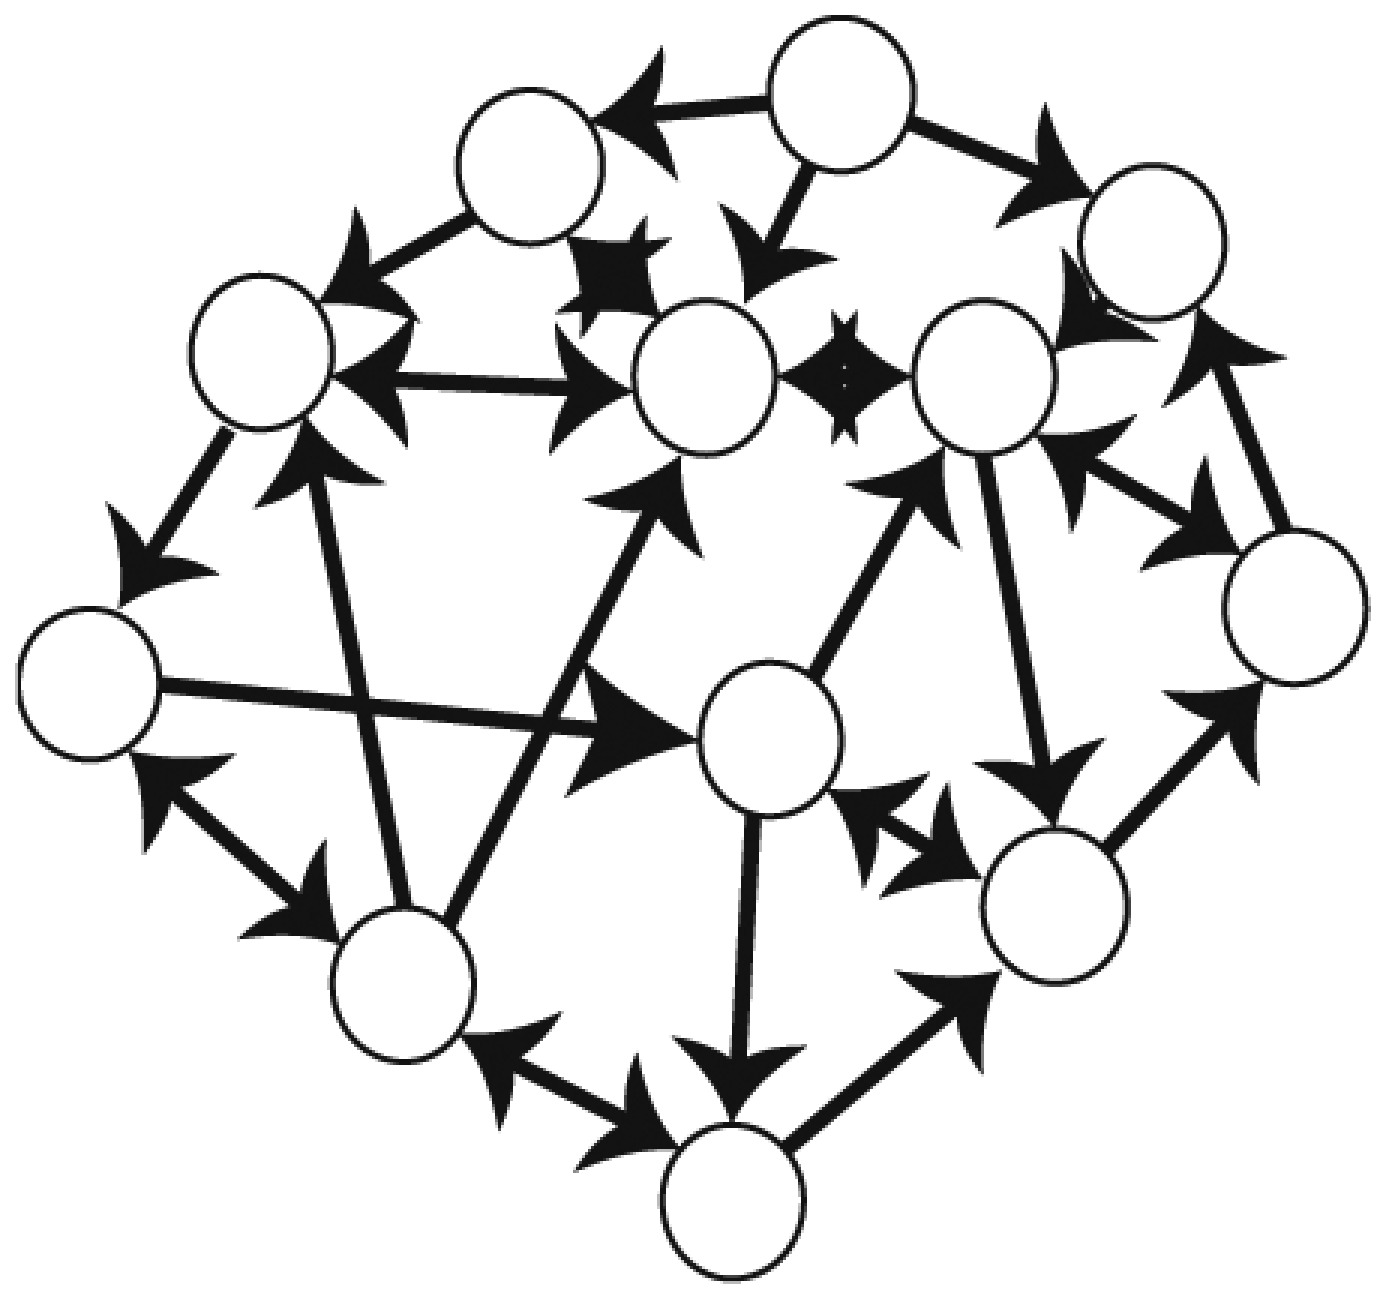
|
Assortativity | A measure of the homogeneity of the number of social interactions across all individuals. SINs with high assortativity imply that all individuals in the group interact more equally (homogeneous distribution of interactions). | z score; we standardized this measure with 10,000 randomly generated SINs* |
| Clustering coefficient | A measure of how interconnected neighbors are to one another. SINs with high clustering coefficient imply that any given individual is more likely to be connected to a cluster of interconnected neighbors. | z score; we generated 10,000 random SINs and standardized each measure* | |
| Betweenness centrality | A measure of the cohesiveness of a network. SINs with high betweenness centrality imply there are more “central “ individuals critical for maintaining the cohesion of the network relative to SINs with low betweenness centrality. | z score; we generated 10,000 random SINs and standardized each measure* | |
| Global efficiency | A measure of redundant pathways in a network. SINs with high global efficiency imply shorter paths of connection between individuals on average. | z score; we generated 10,000 random SINs and standardized each measure* |
A more comprehensive definition of each measure is in SI Appendix.
Each SIN measure was standardized according to this formula: .
Fig. 2.
Movement, interaction duration, reciprocation, and number of interactions vary across species and between groups of male flies and female flies. Each phylogenetic tree is colored using the contMap function (phytools package) according to a scale where red indicates the minimum mean measure observed and blue indicates the maximum mean measure observed. Error bars indicate SEM. (Left) Males. (Right) Females. (A) Movement. Significant species-specific effects were observed (P < 2 × 10⁻¹⁶; two-way ANOVA). Significant sex-specific effects and sex-by-species interaction effects were observed (P = 2 × 10⁻¹⁶ for both effects; two-way ANOVA). (B) Interaction duration. Significant species-specific effects were observed (P < 2 × 10⁻¹⁶; two-way ANOVA). Significant sex-specific effects and sex-by-species interaction effects were observed (P = 2 × 10⁻¹⁶ for both effects; two-way ANOVA). (C) Reciprocation. Significant species-specific effects were observed (P < 2 × 10⁻¹⁶; two-way ANOVA). Significant sex-specific effects and sex-by-species interaction effects were observed (P = 2 × 10⁻¹⁶ for both effects; two-way ANOVA). (D) Number of interactions. Significant species-specific effects were observed (P < 2.24 × 10⁻¹¹; two-way ANOVA). Significant sex-specific effects and sex-by-species interaction effects were observed (P = 2 × 10⁻¹⁶ for both effects; two-way ANOVA).
To determine how the different species interact, an automated social interaction identifier system was used (28). There were differences in the social spacing parameters across the drosophilid species in both the male and female datasets (SI Appendix, Table S2). The distance and time parameters displayed the least variation for both the male dataset (distance: 1.25 to 3.25 body lengths; time: 0.2 to 2.65 s) and the female dataset (distance: 1.25 to 2.75 body lengths; time: 0.35 to 1.85 s). In the male dataset, the species with the longest estimated distance parameter (3.25 body lengths) was the outgroup species Ch. procnemis. Aside from this exception, all Drosophila species’ distance parameters ranged from 1.25 to 2.50 body lengths (SI Appendix, Table S2). The angle parameter showed the most variation in both the male dataset (20° to 147.5°) and the female dataset (30° to 140°). Most female flies interact at a wider angle than male flies. This is especially evident in D. santomea, Drosophila yakuba, Drosophila willistoni, Drosophila persimilis, and Drosophila buzzatii, where the females have an estimated angle parameter nearly double that of the male flies (SI Appendix, Table S2). The narrow-angle parameter in these species may have resulted from the observation that males commonly approach the rear of other males as if in courtship. Overall, these data show that males and females of the same species interact differently.
There were differences in each species’ pairwise interactions. Specifically, there were significant species-by-sex interaction effects for interaction duration, reciprocation, and number of interactions (P < 0.0001 for all measures; two-way ANOVA) (Fig. 2). Female flies tended to reciprocate interactions more frequently than male flies. This may be attributable to the wider-angle parameters estimated in the female social spacing data (SI Appendix, Table S2). For interaction duration, there is a clear inverse relationship with movement, especially in the female dataset where sedentary species spent more time socially interacting on average (Fig. 2B). Species that were more active also displayed an increased mean number of social interactions (Fig. 2D). Although the sedentary species generally had a lower mean number of social interactions, all flies collectively interacted at least hundreds of times for every video trial included in the SIN analysis. Taken together, these data suggest that species-specific variation is present in the characteristics of pairwise social interactions.
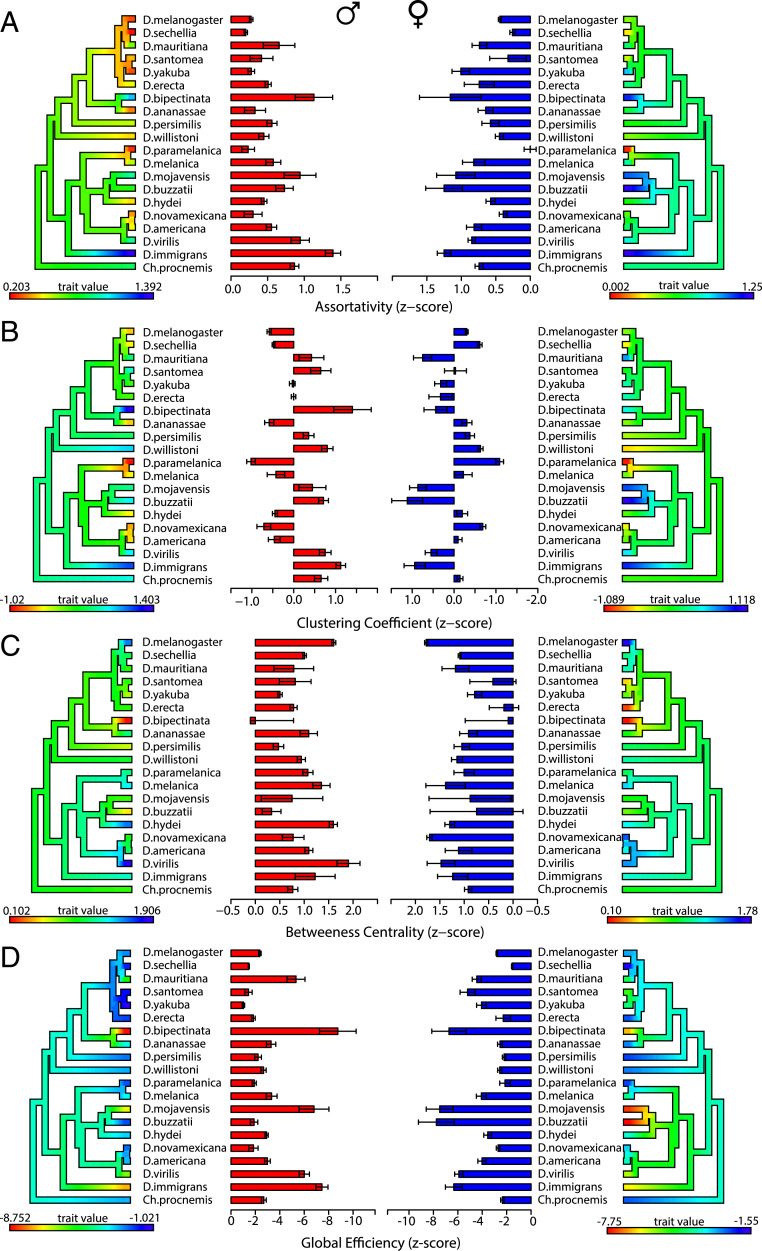
Despite the variation in the behavioral elements, all 20 species formed SINs in at least 80% of the video trials in both the male and female datasets (SI Appendix, Fig. S1). There were significant species-by-sex interaction effects for assortativity (P = 0.0007), clustering coefficient (P < 0.0001), betweenness centrality (P < 0.0001), and global efficiency (P < 0.0001; two-way ANOVA). Qualitatively, the relative species’ differences across all SIN measures appear very consistent between the male and female datasets (Fig. 3), despite the sex-specific variation observed in social spacing patterns. Clustering coefficient and global efficiency display the largest range of species’ variation (Fig. 3). Prior to collecting the data for this study, we collected preliminary data for five species. The estimated SIN measures (SI Appendix, Figs. S5 and S6) were consistent between these independent data collections. This supports previous findings that SINs are repeatable and represent group-level phenotypes (23). Overall, these data suggest that SIN structure varies across species and sex and that species’ SIN structures are stable across time.
Fig. 3.
SINs vary across species and between groups of male flies and female flies. For each measure, the x axis is expressed as a z score. Each phylogeny is colored using the contMap function (phytools package). Error bars indicate SEM. (Left) Males. (Right) Females. (A) Assortativity. Significant species-specific effects were observed (P < 2 × 10⁻¹⁶; two-way ANOVA). Significant sex-specific and sex-by-species interaction effects were observed (P = 0.0002 and P = 0.0007, respectively; two-way ANOVA). (B) Clustering coefficient. Significant species-specific effects were observed (P < 2 × 10⁻¹⁶; two-way ANOVA). No significant sex-specific effects were observed (P = 0.248; two-way ANOVA). A significant sex-by-species interaction effect was observed (P < 2 × 10⁻¹⁶; two-way ANOVA). (C) Betweenness centrality. Significant species-specific effects are observed (P < 2 × 10⁻¹⁶; two-way ANOVA). No sex-specific effects were observed (P = 0.0151; two-way ANOVA). A significant sex-by-species interaction effect was observed (P = 7.65 × 10⁻¹⁵; two-way ANOVA). (D) Global efficiency. Significant species-specific, sex-specific, and sex-by-species interaction effects were observed (P = 7.23 × 10⁻⁹, P < 2 × 10⁻¹⁶, and P < 2 × 10⁻¹⁶, respectively; two-way ANOVA). SI Appendix, Fig. S1 shows the percentage of SINs formed across all video trials, and SI Appendix, Figs. S5 and S6 shows pilot data.
Phylogenetic Signal.
Since SINs significantly vary across drosophilid species, we hypothesized that species differences may reflect phylogenetic signal, a measure of phylogenetic correlation on comparative trait data. To test this, two metrics were implemented: Blomberg’s K (29) and Pagel’s λ (30). For both measures, high phylogenetic signal results from closely related species displaying more similarity in a measured trait than species drawn at random from a given phylogeny (31). On the contrary, low phylogenetic signal results from a lack of similarity in a measured trait within clades of closely related species. Phylogenetic signal tests were applied across all of the behavioral elements (movement, social spacing, pairwise interactions). There was high phylogenetic signal for the social spacing distance parameter (Table 2). Both the K and λ tests agree on this result (α = 0.05), except for the K value in the male dataset (K = 0.26, P = 0.13). This disagreement between the two tests may result from statistical noise because a sample size of 20 species is considered minimal to detect phylogenetic signal (29, 32). When accounting for repeated tests through a Bonferroni correction, only Pagel’s λ distance parameter in females remained statistically significant (λ = 0.68, P = 0.0009). There was no evidence of high phylogenetic signal for all of the SIN measures (Table 2), indicating high divergence between closely related species (illustrated in Fig. 3).
Table 2.
Phylogenetic signal test results of all behavioral variables for K and λ in males and females
| Category | Variable | ♂ | ♀ | ||
| K | λ | K | λ | ||
Movement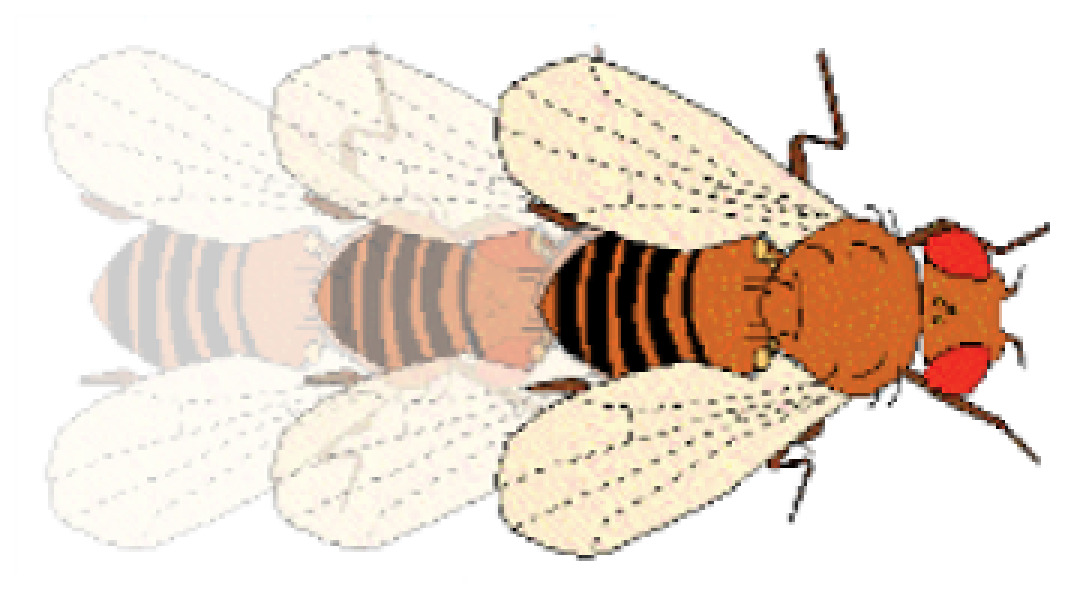
|
Movement | 0.064, P = 0.81 | 0, P = 1 | 0.040, P = 0.97 | 0, P = 1 |
Social spacing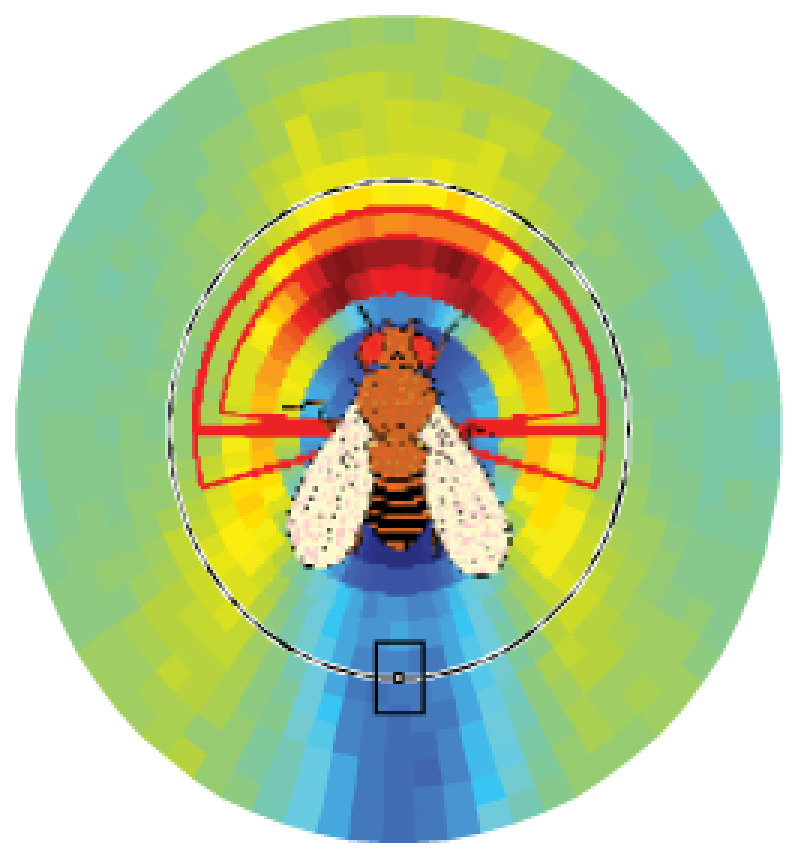
|
Distance | 0.26, P = 0.13 | 0.70, P = 0.017* | 0.39, P = 0.009* | 0.68, P = 0.0009† |
| Angle | 0.37, P = 0.034* | 0.56, P = 0.22 | 0.32, P = 0.07 | 0.22, P = 0.37 | |
| Time | 0.06, P = 0.85 | 0.54, P = 0.011* | 0.038, P = 0.97 | 0.012, P = 0.95 | |
Pairwise interactions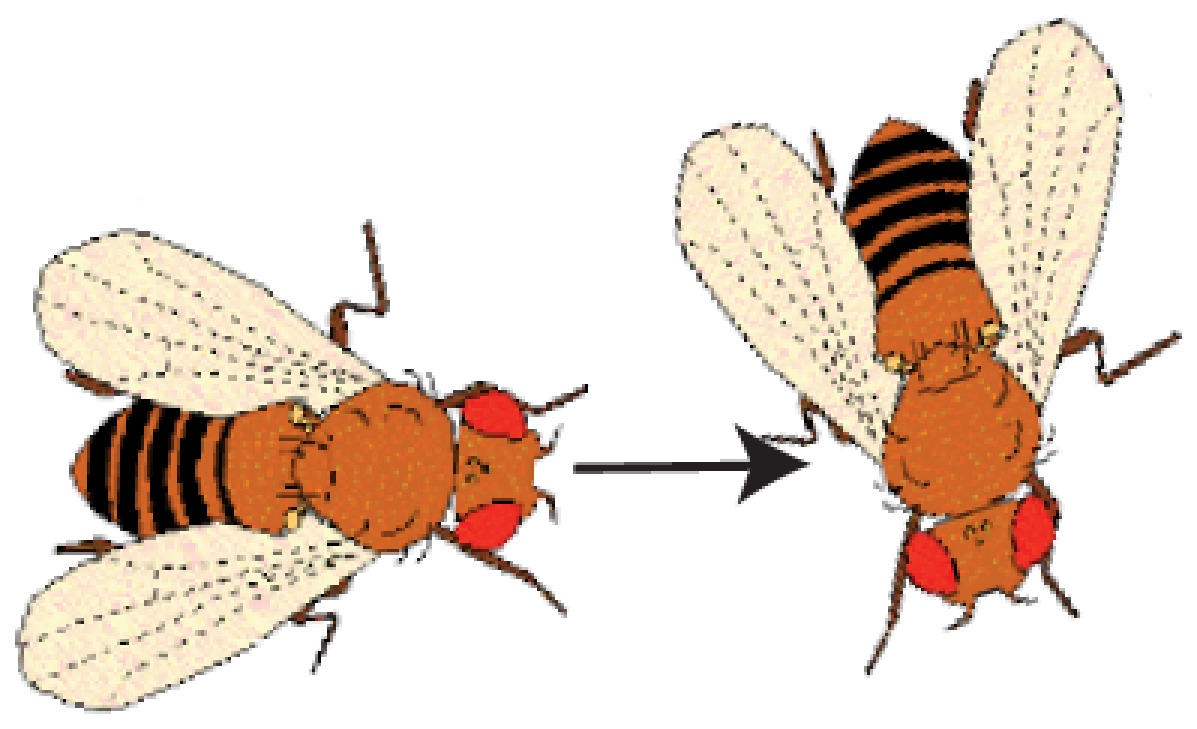
|
Interaction duration | 0.15, P = 0.82 | 0.14, P = 0.54 | 0.12, P = 0.73 | 0, P = 1 |
| Reciprocation | 0.21, P = 0.18 | 0, P = 1 | 0.17, P = 0.33 | 0.20, P = 1 | |
| No. of interactions | 0.27, P = 0.08 | 0.10, P = 1 | 0.051, P = 0.91 | 0, P = 1 | |
SINs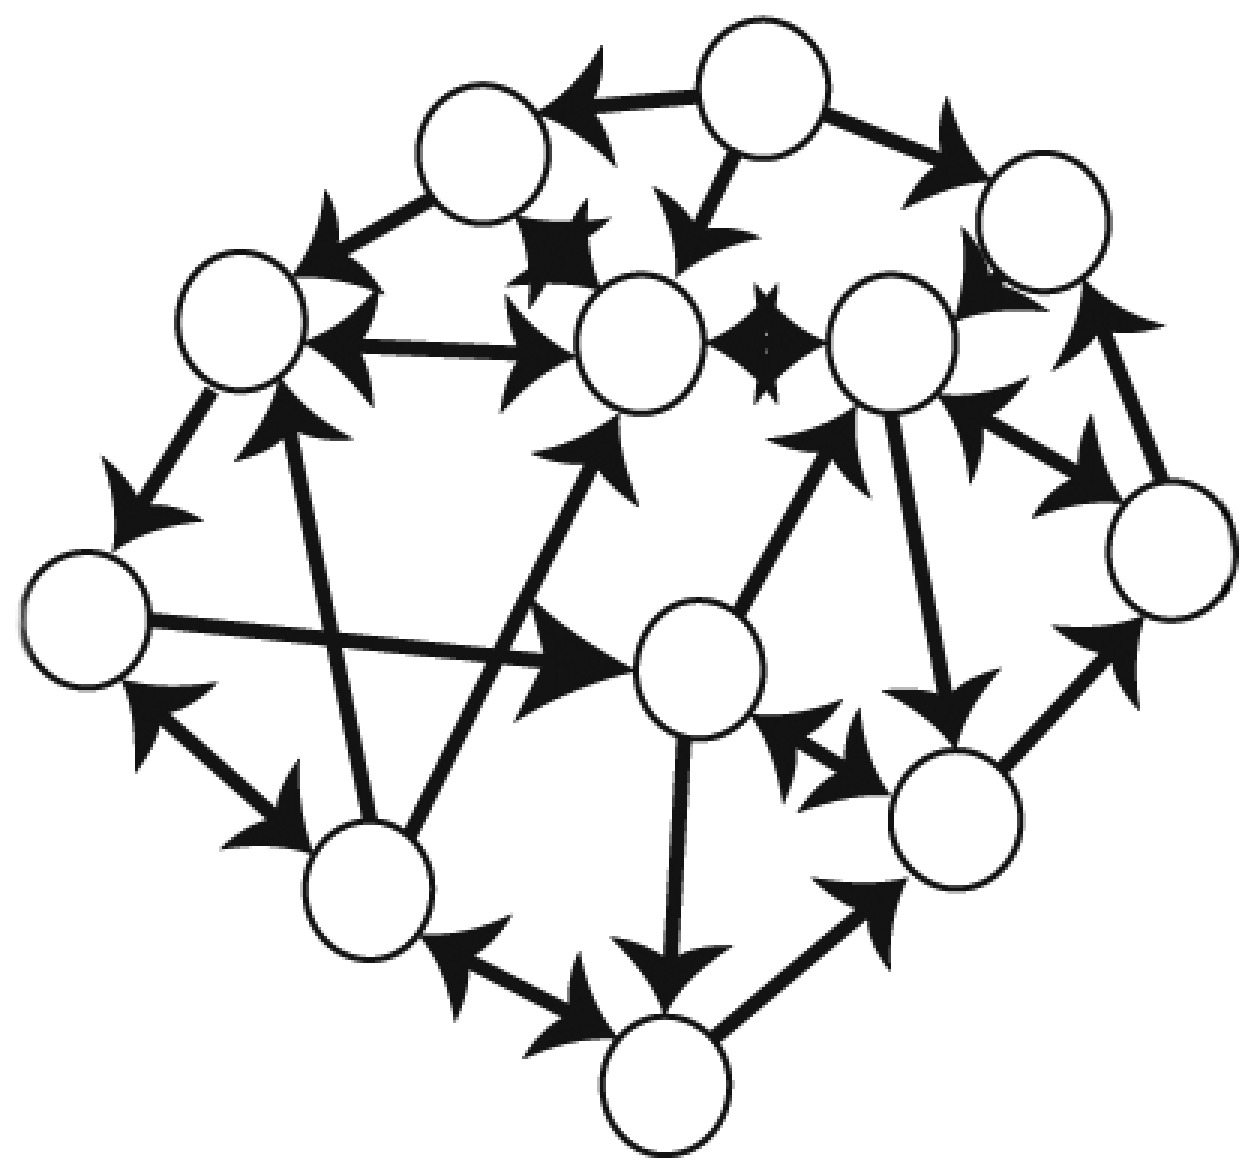
|
Assortativity | 0.33, P = 0.17 | 0.34, P = 0.58 | 0.12, P = 0.83 | 0, P = 1 |
| Clustering coefficient | 0.35, P = 0.059 | 0, P = 1 | 0.18, P = 0.56 | 0, P = 1 | |
| Betweenness centrality | 0.25, P = 0.29 | 0, P = 1 | 0.18, P = 0.56 | 0, P = 1 | |
| Global efficiency | 0.19, P = 0.37 | 0, P = 1 | 0.19, P = 0.42 | 0, P = 1 | |
Indicates marginal effects (P < 0.05).
Indicates statistically significant effects following Bonferroni correction (P < 0.002).
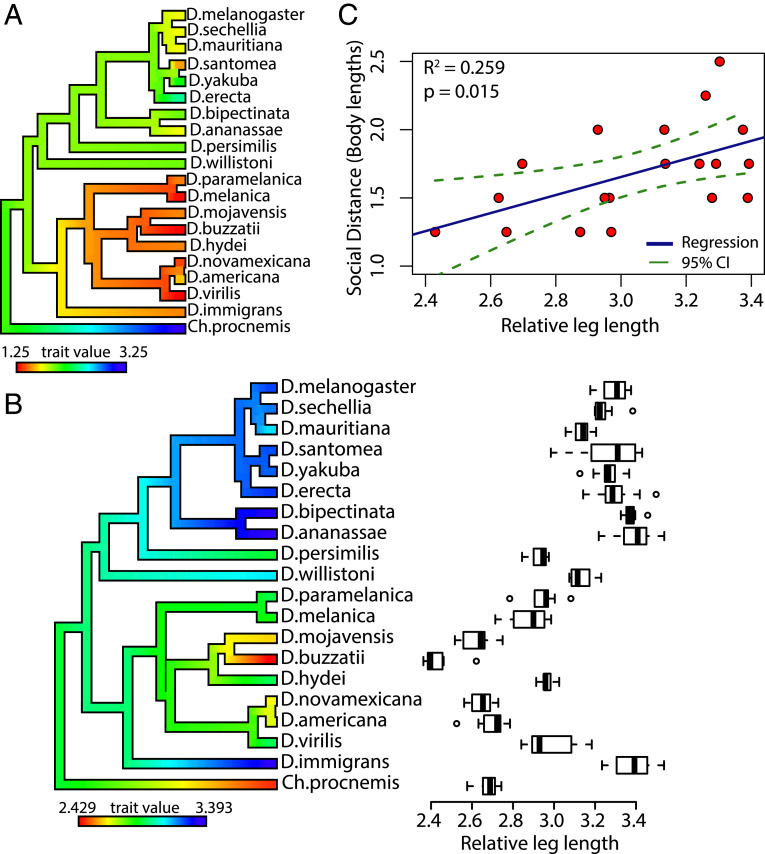
To illustrate the phylogenetic signal for the distance parameter, hereafter referred to as social distance, each species’ social distance (SI Appendix, Table S2) was mapped onto the drosophilid phylogenetic tree. This produced an evolutionary trait map that showed strong phenotypic divergence of social distance between the Drosophila and Sophophora subgenera (Fig. 4). We hypothesized that this divergence in social distance between the two subgenera may correlate with differences in leg size since 1) most of the Drosophila species were larger than the Sophophora species and 2) all species commonly extended their legs to touch conspecifics during social interactions. To test this, the legs and bodies of male flies for all 20 species were measured. To control for the differences in body sizes across all species, the relative leg length was measured (total leg length ÷ body size) (SI Appendix, Tables S3 and S4). The trait map of relative leg length shows that the Sophophora subgenus has a longer social distance with longer relative leg lengths and that the Drosophila subgenus has a shorter social distance with shorter relative leg lengths (Fig. 4). Also, there was high phylogenetic signal for the relative leg length measure (λ = 0.99, P < 0.0001; K = 1.04, P = 0.002), suggesting that morphological differences in drosophilids are phylogenetically correlated. Next, a simple linear regression model was used to test whether the relative leg length predicts social distance within the entire Drosophila genus (Fig. 4). These results show a positive correlation (R2 = 0.259, P = 0.015) between relative leg length and social distance.
Fig. 4.
Social distance and relative leg length display phylogenetic signal and are correlated. (A) Phylogenetic trait map of drosophilid species differences in social distance. The phylogeny is colored using the contMap function (phytools package) to help visualize species differences and ancestral nodes. Red indicates the minimum value, and blue indicates the maximum value observed across the species. The social distance displays divergence between the Drosophila and Sophophora subgenera. (B) Boxplot displaying drosophilid species differences across the relative leg length (total leg length/relative body size). Circles depict outliers, whiskers represent the maximum and minimum values, and the bold line within each box represents the median. The phylogeny on the y axis is colored using the contMap function (phytools). Significant phylogenetic signal was found for relative leg length (λ = 0.99, P < 0.0001; K = 1.04, P = 0.002). (C) Simple linear regression outlining the relationship between relative leg length (x axis) and social distance (y axis). SI Appendix, Tables S3 and S4 show measurements of leg length and body size across all species. All data points in the regression are from the male dataset and the outgroup species, Ch. procnemis, was omitted from the regression.
Overall, these data show that most properties of social organization in drosophilids have low phylogenetic signal, except social distance, which has strong phylogenetic signal. The data also show that leg length and body size correlate with social distance in Drosophila.
Environmental Models of Social Behavior.
Given the evidence of low phylogenetic signal in our SIN data, we next hypothesized that species’ differences may be a result of selection from their respective past environment. To investigate whether past environmental selective pressures predict current social structure across drosophilids, 19 climate variables were extracted from WorldClim (33). The 19 variables were simplified to five principal components and used as predictors to generate environmental models for each SIN measure through stepwise regressions. Temperature range, precipitation of the wettest quarter, and temperature of the coldest quarter were strong proponents in each of the climatic principal components (SI Appendix, Fig. S8). The resultant environmental models were predictive for assortativity (R2 = 0.444, P < 0.0001), clustering coefficient (R2 = 0.452, P < 0.0001), betweenness centrality (R2 = 0.314, P = 0.0008), and global efficiency (R2 = 0.352, P = 0.0003) (Fig. 5). Additional environmental models were generated via stepwise regression by fitting the five principal components to the behavioral element variables (Fig. 1 and Table 1). The subsequent environmental models were less predictive than the models for SIN measures: movement (R2 = 0.250, P = 0.0066), the social spacing parameters (distance: R2 = 0.255, P = 0.0016; angle: R2 = 0.145, P = 0.0087; time: R2 = 0.160, P = 0.0062), and the pairwise interaction variables (number of interactions: R2 = 0.208, P = 0.005; interaction duration: R2 = 0.382, P = 0.0003; reciprocation: R2 = 0.122, P = 0.034) (SI Appendix, Figs. S2–S4). Together, this indicates that climatic selective pressures correlate with group-level behaviors better than they correlate with individual behavioral elements.
Fig. 5.
Environmental, behavioral, and combined stepwise regression models of assortativity, clustering coefficient, betweenness centrality, and global efficiency. For all regressions, each data point represents the mean SIN measure for a single species. The mean SIN measures for groups of male flies and female flies were pooled into each regression and are labeled with red and blue points, respectively. Each solid trend line indicates line of best fit, and dashed lines indicate 95% CI of the model. For each model, the multivariate linear equation can be found below. All models were tested for significance using a likelihood ratio test. (A) The environmental model (Eq. 1) significantly predicts assortativity (P < 0.0001). The behavioral model (Eq. 2) significantly predicts assortativity (P < 0.0001). The combined model (Eq. 3) significantly improves the prediction of assortativity compared with behavioral model alone (P = 0.0001). (B) The environmental model (Eq. 4) significantly predicts clustering coefficient (P < 0.0001). The behavioral model (Eq. 5) significantly predicts clustering coefficient (P < 0.0001). The combined model (Eq. 6) significantly improves the prediction of clustering coefficient compared with behavioral model alone (P < 0.0001). (C) The environmental model (Eq. 7) significantly predicts betweenness centrality (P = 0.0008). The behavioral model (Eq. 8) significantly predicts betweenness centrality (P < 0.0001). The combined model (Eq. 9) does not significantly improve the prediction of betweenness centrality compared with behavioral model alone (P = 0.0504). (D) The environmental model (Eq. 10) significantly predicts global efficiency (P = 0.0003). The behavioral model (Eq. 11) significantly predicts global efficiency (P < 0.0001). The combined model (Eq. 12) significantly improves prediction of global efficiency (P < 0.0001). Eq. 1: y = 0.63 – 0.092 × [PC2] + 0.064 × [PC3] + 0.11 × [PC5]. Eq. 2: y = 0.53 – 0.081 × [movement] + 0.023 × [interaction duration] + 0.00018 × [number of interactions]. Eq. 3: y = 0.56 – 0.068 × [PC2] + 0.045 × [PC3] + 0.086 × [PC5] – 0.071 × [movement] + 0.011 × [interaction duration] + 0.00019 × [number of interactions]. Eq. 4: y = 0.047 – 0.069 × [PC1] – 0.18 × [PC2] + 0.21 × [PC5]. Eq. 5: y = 0.73 – 0.19 × [movement] – 0.0072 × [angle] + 0.04 × [interaction duration] + 0.00038 × [number of interactions]. Eq. 6: y = 0.71 – 0.014 × [PC1] – 0.15 × [PC2] + 0.14 × [PC5] – 0.16 × [movement] – 0.0067 × [angle] + 0.021 × [duration] + 0.00038 × [number of interactions]. Eq. 7: y = 0.99 + 0.07 × [PC1] + 0.057 × [PC2] – 0.13 × [PC5]. Eq. 8: y = 0.096 – 0.28 × [social distance] + 0.25 × [time] – 0.031 × [interaction duration] + 0.0002 × [number of interactions] + 2.91 × [reciprocation]. Eq. 9: y = 0.54 + 0.0065 × [PC5] + 0.055 × [PC2] – 0.11 × [PC5] – 0.39 × [social distance] + 0.23 × [time] – 0.01 × [interaction duration] + 0.0002 × [number of interactions] + 1.94 × [reciprocation]. Eq. 10: y = −3.64 + 0.55[PC2] – 0.34[PC3] – 0.58[PC5]. Eq. 11: y = 2.03 + 0.31 × [movement] – 0.14 × [interaction duration] – 0.0007 × [number of interactions] – 13 × [reciprocation]. Eq. 12: y = 2.47 + 0.33 × [PC3] – 0.38 × [PC5] + 0.26 × [movement] – 0.078 × [interaction duration] – 0.0007 × [number of interactions] – 15 × [reciprocation]. SI Appendix, Figs. S2–S4 show environmental and behavioral models of other behavioral elements. PC, principal component.
Behavioral Models of Social Behavior.
Previous studies in D. melanogaster have shown that simpler behavioral elements do not necessarily correlate to the overall SIN structure (23). To investigate whether behavioral elements predict the species differences in SINs, all of the behavioral element variables were fit to each SIN measure through stepwise regressions. The resultant behavioral models were strongly predictive for assortativity (R2 = 0.494, P < 0.0001), clustering coefficient (R2 = 0.563, P < 0.0001), betweenness centrality (R2 = 0.523, P < 0.0001), and global efficiency (R2 = 0.749, P < 0.0001) (Fig. 5). Interestingly, movement contributed to all behavioral models for SIN measures, except betweenness centrality (Fig. 5). To investigate our behavioral hierarchy, higher-order behavioral elements were correlated to their respective lower-order behavioral elements (Fig. 1). These behavioral models were strongly predictive (number of interactions: R2 = 0.538, P < 0.0001; interaction duration: R2 = 0.553, P < 0.0001; and reciprocation: R2 = 0.879, P < 0.0001) (SI Appendix, Figs. S3 and S4). Together, this suggests that more complex higher-order behaviors in Drosophila can be predicted by some lower-order behaviors but that not all lower-order behaviors (such as movement) can predict complex social structures.
Combined Models of Social Behavior.
Here, for each SIN measure, the behavioral models display a higher correlation to the SIN data than the environmental models. For a given SIN measure, if the R2 of its environmental model is close to that of its behavioral model, it would qualitatively suggest that the climate data are a very strong predictor of the species’ variation in that SIN measure. To provide a statistical framework to test whether the climate data are significant predictors of the SIN data, the environmental and behavioral models were pooled into a “combined model.” We hypothesized that the combined models would significantly improve the prediction of each SIN measure compared with the behavioral models. Likelihood ratio tests showed that the combined models significantly improve the fit over the behavioral models for assortativity (R2 = 0.673, P = 0.0001; likelihood ratio test), clustering coefficient (R2 = 0.757, P < 0.0001), and global efficiency (R2 = 0.846, P < 0.0001) (Fig. 5). The combined model for betweenness centrality remained nearly identical to the behavioral model (combined: R2 = 0.569; behavioral: R2 = 0.523), suggesting that the behavioral data alone are sufficient at predicting betweenness centrality. This analysis was repeated for the pairwise interaction variables (level 3: interaction duration, number of interactions, and reciprocation). These combined models did not significantly outperform the behavioral models (SI Appendix, Fig. S4), indicating that movement (level 1) and social space variables (level 2) are sufficient at predicting pairwise interactions (level 3). This also indicates that the climate data better correlate with group-level SIN measures than individual behavioral elements. Altogether, this suggests that the best prediction of SIN measures requires the consideration of both climate and behavioral factors. However, betweenness centrality and pairwise interactions can be sufficiently predicted by behavior alone.
Discussion
In this study, we set out to determine which factors shape social organization by studying social networks in Drosophila. To do this, a species-wide comparative method was used to explore the evolution of SINs. One caveat to our findings is that we used only one stock of each species. Although the use of one stock is still conventional (34), a new trend suggests that multiple independent strains of flies give a better estimate of the population (35). We opted to use one stock for each species to facilitate the climate analysis and to maximize the number of species that we could use in our study. This study shows that all 20 drosophilid species that were investigated form SINs (SI Appendix, Fig. S1) and that the properties of these SINs vary across species (Fig. 3). These results were consistent with a previous pilot experiment, indicating that we are capturing a reproducible, stable phenotype (SI Appendix, Figs. S5 and S6). By averaging every individual’s SIN property, we better capture the behavior of the group while acknowledging that this limits our ability to examine individuals. Although the behavioral elements investigated in this study are also behaviors found in the network, they are not all necessarily predictive of SIN structure. For example, Schneider et al. (23) previously showed that different sensory mutants in D. melanogaster show significantly different movement and rates of interaction but form SINs with the same clustering coefficient, assortativity, and betweenness centrality (23). Our data show that different combinations of behavioral elements can be used to predict SIN structure across different Drosophila species.
SIN properties correspond to low phylogenetic signal (Table 2), indicating that common ancestry does not predict species differences. The divergence of related species is evident when comparing the SIN data in a phylogenetic context (Figs. 2 and 3). Further, climate data correlate to each SIN measure (Fig. 5), which could mean that SINs adapt to changes in climate. We are not arguing that climate per se causes differences between SINs; after all, climatic pressures have been found to correlate with many aspects of drosophilid biology from cuticular hydrocarbon profiles to courtship requirements (36) and likely encompass other past pressures of the environment, such as food availability (37). Nevertheless, be it direct or indirect, we are beginning to uncover the ways in which drosophilid behavior and group structures have evolved in response to pressures exerted, at least in part, by their environments. A variety of animal social network studies indicate that how individuals organize in a group can influence their fitness and health (24, 38, 39). Ultimately, there is no clear relationship between evolutionary process and phylogenetic signal (40). Given that behavioral phenotypes of an animal are complex outputs stemming from genomic, neurological, and physiological mechanisms, group organization in drosophilids could be derived from a deeply conserved mechanism, similar to how biological clocks influence locomotor activity (41).
Ultimately, the age, diet, and environment of each species was controlled in this study to ascertain the role of genetic differences toward social behavior. There is already evidence that a standard cornmeal diet has minimal effects on social behavior of different Drosophila species (42). Testing for gene-by-environment interactions across social behaviors of drosophilid species is an interesting future direction that can determine whether specific environmental factors, such as temperature and humidity, influence SINs. Perhaps rearing each species in conditions closer to their native habitat would reveal phylogenetic signal in SINs and demonstrate plasticity in the patterns of social organization in flies.
Social distance, which represents the typical distance at which flies communicate, displays evidence of high phylogenetic signal (Table 2). Similar to other reports, most species tend to interact within one to three body lengths (23, 24, 43, 44). The distance at which flies socially interact is conserved within different clades of our tree, suggesting that social distance is under strong stabilizing selection (Fig. 4). We hypothesized that the social distance at which flies interact may correlate with leg length. In most Drosophila species, the legs contain gustatory and haptic receptors, and it is thought that touching conspecifics leads to the exchange of pheromones (45, 46), which can serve as cues about a fly’s social environment (9). It is therefore possible that flies communicate with each other using both touch and taste. Relative leg length is phylogenetically conserved and positively correlates with social distance (Fig. 4). Evidence of flies touching has been previously documented (23, 26) and witnessed in this study across all species. How flies space themselves in a social setting may be determined by leg length, and we suggest that leg length determines how close they need to be to interact. It is possible that there is an indirect evolutionary relationship between relative leg length and social distance. It is well documented that the leg length of an animal determines its maximum velocity and ability to maneuver obstacles and terrain (47, 48). Perhaps leg length in Drosophila is under strong stabilizing selection to maintain locomotor efficiency and as a result, limits the maximum social space of a fly. Alternatively, the social environment within a species may influence the evolution of their anatomy, including leg length. For example, behavioral experiments on the drosophilid species, Drosophila prolongata, revealed that the enlarged forelimbs in males may have evolved to overcome intense mating competition between rival males and highly selective mate choice in females (49). By maintaining the ability to interact and communicate with conspecifics, individuals are better equipped to survey their environment (9), locate potential mates, and find food (50), all factors that contribute to an individuals’ fitness.
Interestingly, the most sedentary species tend to organize themselves into SINs with a high clustering coefficient (Fig. 3). This could lead to a social structure where flies interact more equally (2). Some studies suggest that living in more egalitarian groups correlates with longer lifespans (51), and interestingly, some of the most sedentary species in our study, such as D. mojavensis and D. virilis, have been reported to have some of the longest life spans across the Drosophila genus (52). We argue that differences in group organization are influenced by different geographic origins and that these differences may correlate with life span and other life history characteristics.
Although movement correlated with three SIN measures, it did not correlate with betweenness centrality (Fig. 5), a SIN measure previously reported to be heritable in Drosophila (23) and humans (5). The combined model for betweenness centrality did not significantly improve the correlation compared with the behavioral model alone (Fig. 5). It seems that the climate data add no value to maximizing the prediction of betweenness centrality and that the behavioral elements are sufficient. We speculate that betweenness centrality, as a phenotype, may respond primarily to selective pressures of the social environment itself. In one study, researchers found that the willingness of individuals to share or withhold information from competitors is influenced by the composition of the social environment, which they coined “audience effects” (53). In Drosophila, audience effects may explain why flies signal fertile oviposition sites (16, 54) and the presence of predators to naïve flies (18). In the wild, flies may readily organize and transmit valuable information about their environment if the benefits of cooperation exceed the cost of competition. This may facilitate dynamic behavioral strategies, manifested in an emergent group structure, which vary across populations and species. Overall, our results suggest that betweenness centrality may measure a group-level phenotype that is genetically heritable and has been selected by pressures of the social environment. Future network studies on Drosophila, or in other animals, may be able to determine gene(s) responsible for regulating the betweenness centrality phenotype, which could lead to the discovery of conserved social mechanisms that may be found in other organisms.
We highlight how phylogeny, climate, and behavioral elements influence the social organization of drosophilids. All of the species in this study socially organize and form SINs, allowing for the possibility of dissecting the evolution of sociality in the future. We speculate that deeper elementary units of social communication are conserved across drosophilids. This is not surprising since individual flies are known to encounter and interact with other species. Recent work uncovered that flies can socially signal the presence of predators to unrelated species, suggesting that flies communicate in “dialects” with each other (18). When considering complex social organization behaviors, the ecological pressures of a species’ environment play a large role in shaping these phenotypes. However, these phenotypes shaped by the environment may depend on ancient genetic pathways, shared across many organisms, that regulate their expression. Perhaps one day, genes that influence social organization will be uncovered in Drosophila, and we will consider social organization as a behavioral phenotype that emerges from a deeply conserved genetic toolkit (55).
Materials and Methods
Summary of SINs and Other Behavioral Measures.
To determine if the different drosophilid species form SINs, we placed 12 3-d-old flies of the same sex and species in an arena and video recorded them for 30 min. We collected ∼20 videos for each species, for both groups of males and females separately. The position, orientation, and identity of each fly were tracked in every video using Ctrax (versions 0.4.2 and 0.5.19b). Each species’ social spacing patterns were acquired using an automated algorithm that estimates the distance, angle, and time parameters that approximate social interactions (28). These parameters (SI Appendix, Table S2) were applied to calculate each species’ SINs. All methods regarding the generation and analysis of SINs were done as previously described (23). Table 1 shows a summarized definition of each SIN measure calculated.
In addition to the SIN measures, other behavioral elements were estimated from the tracked videos. Table 1 shows a summary of these behavioral elements. All behavioral data plotted in Figs. 2 and 3 were first averaged across all flies in a single video and then averaged across the distribution of videos. A two-way ANOVA was used in MATLAB to test whether SINs and the behavioral elements differ by sex and across species. Due to the repeated tests on eight measures, a Bonferroni correction was employed, and all P values below 0.00625 were considered significant. Statistical details can be found in Results and figures. For the SIN measures and behavioral measures, a data point was considered an outlier if it was greater than the 75th quartile + [1.5 × interquartile range (IQR)] or lower than the 25th quartile − (1.5 × IQR). Outliers were removed from all analyses. A more detailed description of our experimental methods along with additional tests that we performed on the data are described in SI Appendix.
Phylogenetic Signal.
To determine whether the drosophilid species’ social behavior exhibits phylogenetic signal, we applied two tests: Blomberg’s K (29) and Pagel’s λ (30). Both phylogenetic signal tests evaluate whether the observed average trait data across species adhere to a model of Brownian motion across a phylogenetic tree, which approximates the expectation of evolution due to genetic drift (40). Both the K and λ values typically range on a scale from zero to one, where zero indicates low phylogenetic signal (trait evolution does not adhere to Brownian motion) and one indicates high phylogenetic signal (trait evolution adheres to Brownian motion). A published drosophilid phylogenetic tree was applied to these analyses that we pruned to include our species sample (56). Since D. novamexicana was not included in this tree, its placement and branch length were standardized based on another published phylogenetic tree of the virilis group species (57). The tree was made ultrametric in R through the “chronos” function (ape package) for all subsequent phylogenetic comparative analyses. The K and λ tests were implemented in R using the “phylosig” function (phytools package). We tested phylogenetic signal on the four SIN measures and the four behavioral elements where each species’ mean and SEM were incorporated to represent the species’ average and intraspecific variation for the trait, respectively (32). We also tested phylogenetic signal for the distance, angle, and time social spacing parameters. Since some of these variables were manually altered (SI Appendix), we did not incorporate any measure of intraspecific variation into the phylogenetic signal tests. All phylogenetic signal tests were performed separately on the male and female datasets. The estimated K values were statistically evaluated using R through permutation tests where the observed K value was compared with a null distribution of 1,000 K values, each computed by randomly shuffling the tips of the phylogenetic tree. All estimated λ values were statistically evaluated using R through likelihood ratio tests against the null hypothesis that λ = 0. All measures of phylogenetic signal and the associated P values are present in Table 2. To visualize the phylogenetic signal tests for each variable, trait data were mapped onto the drosophilid phylogeny using the “contMap” function (phytools package) in R. This function maps ancestral states for the internal nodes of the phylogeny using maximum likelihood given the trait data for each species at the tips of the tree (58). These phylogenetic trait maps are present in Figs. 2–4. Due to the repeated tests on 11 variables with two phylogenetic signal tests, a Bonferroni correction was employed, and all P values below 0.002 were considered significant.
Estimation of Environmental Variables.
We estimated climate data from latitudinal and longitudinal coordinates specific to the capture site of each drosophilid species stock (Fig. 1 and SI Appendix, Table S1). For each set of coordinates, we obtained 19 climate variables from the WorldClim database (https://www.worldclim.org/) (33). All climate variables represent the predicted climate from the Mid-Holocene period in the past. We emphasize that these climate data best capture past selective pressures that each drosophilid species adapted to. The following variables, representing temperature and precipitation patterns, were obtained: annual mean temperature (BIO1), mean diurnal range [BIO2; calculated as mean of monthly(maximum temp – minimum temp)], isothermability (BIO3; calculated as BIO2/BIO7 × 100), temperature seasonality (BIO4), maximum temperature of warmest month (BIO5), minimum temperature of coldest month (BIO6), temperature annual range (BIO7; calculated as BIO5 to BIO6), mean temperature of wettest quarter (BIO8), mean temperature of driest quarter (BIO9), mean temperature of warmest quarter (BIO10), mean temperature of coldest quarter (BIO11), annual precipitation (BIO12), precipitation of wettest month (BIO13), precipitation of driest month (BIO14), precipitation seasonality (BIO15), precipitation of wettest quarter (BIO16), precipitation of driest quarter (BIO17), precipitation of warmest quarter (BIO18), and precipitation of coldest quarter (BIO19).
Leg Measurements.
The front, middle, and rear legs were measured from a minimum of 10 individuals for all 20 drosophilid species (SI Appendix, Table S3). We first anesthetized the flies with carbon dioxide and carefully severed each leg above the femur using forceps. Each leg was placed on a flat surface and covered with a coverslip. An image was acquired for each leg using a Zeiss SteREO Discovery.V12 microscope and Zeiss ZEN (2011) software. The leg was measured in micrometers using Zeiss ZEN (2011) built-in measurement tools. The femur measurement began where the trochanter met the femur and ended at the tibia. The tibia was measured from the beginning of the tibia to the end of the tibia. The tarsi were measured from the beginning of the tarsi and ended in the middle of the claw. For each leg, the lengths of the femur, tibia, and tarsal fragments were summed. The sum of the three legs was then averaged to provide us with the total leg length.
Body Size Measurements.
The body sizes for each species were measured using the tracked videos. For each 30-min tracked video, the mean large major axis was calculated in micrometers for each fly across all frames. Then, the mean of all individual flies within each video was calculated. Therefore, each video generated a single mean body size measurement. Each species’ reported body size (SI Appendix, Table S4) was calculated by averaging the mean body size measurements from all video trials. Since the body sizes varied for each species, we calculated the relative leg length by dividing the total leg length by body size. To explore whether the relative leg length predicts the social distance measure, we generated a simple linear regression in R. In this regression, we excluded the outgroup, Ch. procnemis, since we were interested in whether social distance correlated with the total and relative leg lengths of species belonging to the Drosophila genus.
Environmental and Behavioral Regression Analysis.
To explore how climate and behavioral elements influence drosophilid species’ variation in SINs, we produced three different types of models through multivariate stepwise regressions: 1) environmental models, 2) behavioral models, and 3) combined models (Fig. 5). The environmental models were derived from the Mid-Holocene climatic data described above. We implemented a principal component analysis in MATLAB to reduce the climate variables to five principal components. Together, these components account for 92% of the observed variance in the climate data (SI Appendix, Fig. S7). To generate each environmental model, the “stepwiselm” function was implemented in MATLAB with default parameters. The five principal components served as the initial predictors for the stepwise selection. The optimal predictors that remained after forward and backward stepwise selection are listed in the equation for each environmental model (Fig. 5).
The behavioral models were produced through stepwise regressions, similar to the environmental models. The following variables served as predictors and were fit to each SIN measure: movement, social spacing parameters (distance, angle, and time), and the pairwise interaction variables (interaction duration, reciprocation, and number of interactions) (Fig. 1 and Table 1). The purpose of these models was to explore how behavioral elements predict the complex SIN measures. Like the environmental models, the predictors that remained after forward and backward selection are listed in the equation for each behavioral model (Fig. 5).
Finally, the combined models were generated by combining and fitting the predictors of the associated environmental and behavioral models to each SIN measure (Fig. 5). This was done to test if the climate data, together with the behavioral data, improve the correlation to each SIN measure. To test this, we compared the fit of the combined model to the behavioral model for each SIN measure through a likelihood ratio test. Significant results indicate that the combination of behavioral and climate variables is better at modeling the SIN measures than either the behavioral variables or climate variables alone. In total, 10 variables had behavioral and combined models generated and compared (Fig. 5 and SI Appendix, Figs. S2–S4). Therefore, we considered α ≤ 0.005 as significant through a Bonferroni correction.
Both male and female data were pooled in these regression analyses since the SIN and behavioral measures contain significant sex-by-species interaction effects (Figs. 2 and 3). All data points in the regression are the mean values for each behavioral measure.
Data Availability Statement.
All data discussed in the paper are available to readers.
Supplementary Material
Acknowledgments
We thank Leslie Vosshall, Michael Dickinson, John Ratcliffe, Rob Ness, Marc Johnson, Luke Mahler, and Jean-Christophe Billeter for helpful discussions along the way. We also thank the anonymous reviewers for their helpful suggestions. Funding for this study was provided to J.D.L. by Natural Sciences and Engineering Research Council, Canadian Institutes of Health Research, the Canada Research Chair, and Canadian Institute for Advanced Research.
Footnotes
The authors declare no competing interest.
This article is a PNAS Direct Submission.
This article contains supporting information online at https://www.pnas.org/lookup/suppl/doi:10.1073/pnas.1920642117/-/DCSupplemental.
References
- 1.Newman M., Networks: An Introduction (Oxford University Press, 2010). [Google Scholar]
- 2.Krause J., James R., Franks D. W., Croft D. P., Animal Social Networks (Oxford University Press, 2015). [Google Scholar]
- 3.Zengler K., Zaramela L. S., The social network of microorganisms: How auxotrophies shape complex communities. Nat. Rev. Microbiol. 16, 383–390 (2018). [DOI] [PMC free article] [PubMed] [Google Scholar]
- 4.Christakis N. A., Fowler J. H., The spread of obesity in a large social network over 32 years. N. Engl. J. Med. 357, 370–379 (2007). [DOI] [PubMed] [Google Scholar]
- 5.Fowler J. H., Dawes C. T., Christakis N. A., Model of genetic variation in human social networks. Proc. Natl. Acad. Sci. U.S.A. 106, 1720–1724 (2009). [DOI] [PMC free article] [PubMed] [Google Scholar]
- 6.Christakis N. A., Fowler J. H., Friendship and natural selection. Proc. Natl. Acad. Sci. U.S.A. 111 (suppl. 3), 10796–10801 (2014). [DOI] [PMC free article] [PubMed] [Google Scholar]
- 7.Farine D. R., Whitehead H., Constructing, conducting and interpreting animal social network analysis. J. Anim. Ecol. 84, 1144–1163 (2015). [DOI] [PMC free article] [PubMed] [Google Scholar]
- 8.Levine J. D., Funes P., Dowse H. B., Hall J. C., Resetting the circadian clock by social experience in Drosophila melanogaster. Science 298, 2010–2012 (2002). [DOI] [PubMed] [Google Scholar]
- 9.Krupp J. J., et al. , Social experience modifies pheromone expression and mating behavior in male Drosophila melanogaster. Curr. Biol. 18, 1373–1383 (2008). [DOI] [PubMed] [Google Scholar]
- 10.Garbaczewska M., Billeter J.-C., Levine J. D., Drosophila melanogaster males increase the number of sperm in their ejaculate when perceiving rival males. J. Insect Physiol. 59, 306–310 (2013). [DOI] [PubMed] [Google Scholar]
- 11.Billeter J. C., Jagadeesh S., Stepek N., Azanchi R., Levine J. D., Drosophila melanogaster females change mating behaviour and offspring production based on social context. Proc. Biol. Sci. 279, 2417–2425 (2012). [DOI] [PMC free article] [PubMed] [Google Scholar]
- 12.Laturney M., van Eijk R., Billeter J. C., Last male sperm precedence is modulated by female remating rate in Drosophila melanogaster. Evol. Lett. 2, 180–189 (2018). [DOI] [PMC free article] [PubMed] [Google Scholar]
- 13.Kent C., Azanchi R., Smith B., Formosa A., Levine J. D., Social context influences chemical communication in D. melanogaster males. Curr. Biol. 18, 1384–1389 (2008). [DOI] [PubMed] [Google Scholar]
- 14.Donlea J. M., Ramanan N., Shaw P. J., Use-dependent plasticity in clock neurons regulates sleep need in Drosophila. Science 324, 105–108 (2009). [DOI] [PMC free article] [PubMed] [Google Scholar]
- 15.Duménil C., et al. , Pheromonal cues deposited by mated females convey social information about egg-laying sites in Drosophila melanogaster. J. Chem. Ecol. 42, 259–269 (2016). [DOI] [PMC free article] [PubMed] [Google Scholar]
- 16.Battesti M., Moreno C., Joly D., Mery F., Spread of social information and dynamics of social transmission within Drosophila groups. Curr. Biol. 22, 309–313 (2012). [DOI] [PubMed] [Google Scholar]
- 17.Kacsoh B. Z., Bozler J., Hodge S., Ramaswami M., Bosco G., A novel paradigm for nonassociative long-term memory in Drosophila: Predator-induced changes in oviposition behavior. Genetics 199, 1143–1157 (2015). [DOI] [PMC free article] [PubMed] [Google Scholar]
- 18.Kacsoh B. Z., Bozler J., Bosco G., Correction: Drosophila species learn dialects through communal living. PLoS Genet. 14, e1007825 (2018). [DOI] [PMC free article] [PubMed] [Google Scholar]
- 19.Mery F., Kawecki T. J., A fitness cost of learning ability in Drosophila melanogaster. Proc. Biol. Sci. 270, 2465–2469 (2003). [DOI] [PMC free article] [PubMed] [Google Scholar]
- 20.Dukas R., “Insect social learning” in Encyclopedia of Animal Behavior, Breed M. D., Moore J., Eds. (Academic, London, UK, 2010), vol. 17, pp. 176–179. [Google Scholar]
- 21.Kravitz E. A., Fernandez M. P., Aggression in Drosophila. Behav. Neurosci. 129, 549–563 (2015). [DOI] [PubMed] [Google Scholar]
- 22.Dawson E. H., et al. , Social environment mediates cancer progression in Drosophila. Nat. Commun. 9, 3574 (2018). [DOI] [PMC free article] [PubMed] [Google Scholar]
- 23.Schneider J., Dickinson M. H., Levine J. D., Social structures depend on innate determinants and chemosensory processing in Drosophila. Proc. Natl. Acad. Sci. U.S.A. 109 (suppl. 2), 17174–17179 (2012). [DOI] [PMC free article] [PubMed] [Google Scholar]
- 24.Pasquaretta C., et al. , How social network structure affects decision-making in Drosophila melanogaster. Proc. Biol. Sci. 283, 20152954 (2016). [DOI] [PMC free article] [PubMed] [Google Scholar]
- 25.Liu G., et al. , A simple computer vision pipeline reveals the effects of isolation on social interaction dynamics in Drosophila. PLoS Comput. Biol. 14, e1006410 (2018). [DOI] [PMC free article] [PubMed] [Google Scholar]
- 26.Jiang L., et al. , Emergence of social cluster by collective pairwise encounters in Drosophila. eLife 9, e51921 (2020). [DOI] [PMC free article] [PubMed] [Google Scholar]
- 27.Pasquaretta C., et al. , Social networks in primates: Smart and tolerant species have more efficient networks. Sci. Rep. 4, 7600 (2014). [DOI] [PMC free article] [PubMed] [Google Scholar]
- 28.Schneider J., Levine J. D., Automated identification of social interaction criteria in Drosophila melanogaster. Biol. Lett. 10, 20140749 (2014). [DOI] [PMC free article] [PubMed] [Google Scholar]
- 29.Blomberg S. P., Garland T. Jr, Ives A. R., Testing for phylogenetic signal in comparative data: Behavioral traits are more labile. Evolution 57, 717–745 (2003). [DOI] [PubMed] [Google Scholar]
- 30.Pagel M., Inferring the historical patterns of biological evolution. Nature 401, 877–884 (1999). [DOI] [PubMed] [Google Scholar]
- 31.Blomberg S. P., Garland T. Jr, Tempo and mode in evolution: Phylogenetic inertia, adaptation and comparative methods. J. Evol. Biol. 15, 899–910 (2002). [Google Scholar]
- 32.Ives A. R., Midford P. E., Garland T. Jr, Within-species variation and measurement error in phylogenetic comparative methods. Syst. Biol. 56, 252–270 (2007). [DOI] [PubMed] [Google Scholar]
- 33.Hijmans R. J., Cameron S. E., Parra J. L., Jones P. G., Jarvis A., Very high resolution interpolated climate surfaces for global land areas. Int. J. Climatol. 25, 1965–1978 (2005). [Google Scholar]
- 34.Kellermann V., et al. , Phylogenetic constraints in key functional traits behind species’ climate niches: Patterns of desiccation and cold resistance across 95 Drosophila species. Evolution 66, 3377–3389 (2012). [DOI] [PubMed] [Google Scholar]
- 35.Anderson B. B., Scott A., Dukas R., Social behavior and activity are decoupled in larval and adult fruit flies. Behav. Ecol. 27, 820–828 (2016). [Google Scholar]
- 36.Jezovit J. A., Levine J. D., Schneider J., Phylogeny, environment and sexual communication across the Drosophila genus. J. Exp. Biol. 220, 42–52 (2017). [DOI] [PubMed] [Google Scholar]
- 37.Bergallo H. G., Magnusson W. E., Effects of climate and food availability on four rodent species in southeastern Brazil. J. Mammal. 80, 472–486 (1999). [Google Scholar]
- 38.Drewe J. A., Who infects whom? Social networks and tuberculosis transmission in wild meerkats. Proc. Biol. Sci. 277, 633–642 (2010). [DOI] [PMC free article] [PubMed] [Google Scholar]
- 39.Oh K. P., Badyaev A. V., Structure of social networks in a passerine bird: Consequences for sexual selection and the evolution of mating strategies. Am. Nat. 176, E80–E89 (2010). [DOI] [PubMed] [Google Scholar]
- 40.Revell L. J., Harmon L. J., Collar D. C., Phylogenetic signal, evolutionary process, and rate. Syst. Biol. 57, 591–601 (2008). [DOI] [PubMed] [Google Scholar]
- 41.Levine J. D., Sauman I., Imbalzano M., Reppert S. M., Jackson F. R., Period protein from the giant silkmoth Antheraea pernyi functions as a circadian clock element in Drosophila melanogaster. Neuron 15, 147–157 (1995). [DOI] [PubMed] [Google Scholar]
- 42.Shultzaberger R. K., et al. , Conservation of the behavioral and transcriptional response to social experience among Drosophilids. Genes Brain Behav. 18, e12487 (2019). [DOI] [PMC free article] [PubMed] [Google Scholar]
- 43.Durisko Z., Kemp R., Mubasher R., Dukas R., Dynamics of social behavior in fruit fly larvae. PLoS One 9, e95495 (2014). [DOI] [PMC free article] [PubMed] [Google Scholar]
- 44.Simon A. F., et al. , A simple assay to study social behavior in Drosophila: Measurement of social space within a group. Genes Brain Behav. 11, 243–252 (2012). [DOI] [PMC free article] [PubMed] [Google Scholar]
- 45.Ferveur J. F., Cuticular hydrocarbons: Their evolution and roles in Drosophila pheromonal communication. Behav. Genet. 35, 279–295 (2005). [DOI] [PubMed] [Google Scholar]
- 46.Vosshall L. B., Stocker R. F., Molecular architecture of smell and taste in Drosophila. Annu. Rev. Neurosci. 30, 505–533 (2007). [DOI] [PubMed] [Google Scholar]
- 47.Reilly S. M., McElroy E. J., Biknevicius A. R., Posture, gait and the ecological relevance of locomotor costs and energy-saving mechanisms in tetrapods. Zoology (Jena) 110, 271–289 (2007). [DOI] [PubMed] [Google Scholar]
- 48.Ramdya P., et al. , Climbing favours the tripod gait over alternative faster insect gaits. Nat. Commun. 8, 14494 (2017). [DOI] [PMC free article] [PubMed] [Google Scholar]
- 49.Setoguchi S., Kudo A., Takanashi T., Ishikawa Y., Matsuo T., Social context-dependent modification of courtship behaviour in Drosophila prolongata. Proc. Biol. Sci. 282, 20151377 (2015). [DOI] [PMC free article] [PubMed] [Google Scholar]
- 50.Lihoreau M., Clarke I. M., Buhl J., Sumpter D. J., Simpson S. J., Collective selection of food patches in Drosophila. J. Exp. Biol. 219, 668–675 (2016). [DOI] [PubMed] [Google Scholar]
- 51.Barocas A., Ilany A., Koren L., Kam M., Geffen E., Variance in centrality within rock hyrax social networks predicts adult longevity. PLoS One 6, e22375 (2011). [DOI] [PMC free article] [PubMed] [Google Scholar]
- 52.Ma S., et al. , Comparative transcriptomics across 14 Drosophila species reveals signatures of longevity. Aging Cell 17, e12740 (2018). [DOI] [PMC free article] [PubMed] [Google Scholar]
- 53.Matos R. J., Schlupp I., “Performing in front of an audience: Signalers and the social environment” in Animal Communication Networks, McGregor P. K., Ed. (Cambridge University Press, Cambridge, UK, 2005), pp. 63–83. [Google Scholar]
- 54.Sarin S., Dukas R., Social learning about egg-laying substrates in fruitflies. Proc. Biol. Sci. 276, 4323–4328 (2009). [DOI] [PMC free article] [PubMed] [Google Scholar]
- 55.Dickinson M. H., Death Valley, Drosophila, and the Devonian toolkit. Annu. Rev. Entomol. 59, 51–72 (2014). [DOI] [PubMed] [Google Scholar]
- 56.van der Linde K., Houle D., Spicer G. S., Steppan S. J., A supermatrix-based molecular phylogeny of the family Drosophilidae. Genet. Res. 92, 25–38 (2010). [DOI] [PubMed] [Google Scholar]
- 57.Spicer G. S., Bell C., Molecular phylogeny of the Drosophila virilis species group (Diptera: Drosophilidae) inferred from mitochondrial 12S and 16S ribosomal RNA genes. Ann. Entomol. Soc. Am. 95, 156–161 (2002). [Google Scholar]
- 58.Revell L. J., Two new graphical methods for mapping trait evolution on phylogenies. Methods Ecol. Evol. 4, 754–759 (2013). [Google Scholar]
- 59.Peel M. C., Finlayson B. L., McMahon T. A., Updated world map of the Köppen-Geiger climate classification. Hydrol. Earth Syst. Sci. Discuss. 4, 439–473 (2007). [Google Scholar]
Associated Data
This section collects any data citations, data availability statements, or supplementary materials included in this article.
Supplementary Materials
Data Availability Statement
All data discussed in the paper are available to readers.


