


Abstract
The structure of the 68 nt sequence with G-quadruplex forming potential within the hTERT promoter is disputed. One model features a structure with three stacked parallel G-quadruplex units, while another features an unusual duplex hairpin structure adjoined to two stacked parallel and antiparallel quadruplexes. We report here the results of an integrated structural biology study designed to distinguish between these possibilities. As part of our study, we designed a sequence with an optimized hairpin structure and show that its biophysical and biochemical properties are inconsistent with the structure formed by the hTERT wild-type sequence. By using circular dichroism, thermal denaturation, nuclear magnetic resonance spectroscopy, analytical ultracentrifugation, small-angle X-ray scattering, molecular dynamics simulations and a DNase I cleavage assay we found that the wild type hTERT core promoter folds into a stacked, three-parallel G-quadruplex structure. The hairpin structure is inconsistent with all of our experimental data obtained with the wild-type sequence. All-atom models for both structures were constructed using molecular dynamics simulations. These models accurately predicted the experimental hydrodynamic properties measured for each structure. We found with certainty that the wild-type hTERT promoter sequence does not form a hairpin structure in solution, but rather folds into a compact stacked three-G-quadruplex conformation.
INTRODUCTION
G-quadruplexes (G4s) are four-stranded non-B DNA structures formed from Hoogsteen hydrogen bonding of guanines to form stacked quartets. G-quadruplexes are known to form in the telomeres of a variety of eukaryotic organisms where their role is primarily in telomere homeostasis (1,2). Bioinformatic analyses have shown that G-quadruplex sequence motifs are concentrated in oncogene promoters (3–5), and these promoter G-quadruplexes have been under investigation for their ability to modulate gene expression (5). Many promoter G-quadruplexes are currently being investigated for their potential in modulating their respective gene products: c-MYC (6), KRAS (7), HRAS (8), HIF (9) and VEGF (10).
Human telomerase reverse transcriptase (hTERT) is the catalytic subunit of telomerase, the enzyme primarily responsible for the immortality of cancer cells. hTERT is an important oncogene with G4 motifs within its promoter (11–13). The hTERT gene encodes the reverse-transcriptase component of the human telomerase ribonucleoprotein complex (14). Telomerase (TERT) is responsible for maintenance of telomeres, and this activity is thought to be vital in cellular immortalization (15,16). TERT is normally undetectable in somatic cells (except for stem cells), and its aberrant expression is associated with 85–90% of cancers investigated (17–19). The nearly exclusive expression of TERT in cancer cells has been acknowledged for more than two decades as a target for anti-cancer therapies. Many contemporary techniques which target telomerase, such as small molecule inhibitors, gene therapy, anti-sense oligonucleotides, and immunotherapies, have demonstrated TERT inhibition as a viable mechanism in cancer treatment (20). Unfortunately, no direct inhibitors of telomerase have been clinically successful (21). Some of the more promising direct inhibitors exhibit severe toxicity in hematopoietic stem cells (22). This provides a strong rationale for investigating alternative mechanisms to prevent telomerase activity in cancer.
The wild type (WT) hTERT core promoter region (approximately −180 to +1 of transcription start site) (23) contains twelve tracts of three or more guanines which enable formation of G-quadruplexes (11–13,24). Functional genetic studies have identified point mutations within these G-tracts that are directly linked to increased expression of TERT (25). Two mutations, G124A or G146A, are found in 60–80% of urothelial carcinomas (26), 71% of melanomas (27), 83% of glioblastomas (28), as well as a variety of other cancers. These mutations result in de novo formation of E-twenty-six (ETS) transcription factor binding sites and confer a selective advantage to cancer cells by allelic recruitment of the transcription factor GABP (26,29). These mutations occur within G-tracts 5 and 8, the terminal G-tracts of the second putative quadruplex sequence (PQS2) (Figure 1) and have been suggested to impact G-quadruplex transcriptional silencing (11,24). This has been supported by a G-quadruplex-stabilizing small molecule targeting the hTERT promoter in MCF-7 breast cancer cells (30). Thus, further investigation of the secondary structure formed by the promoter DNA sequence is warranted.
Figure 1.

Comparison of WT and AH sequences and contemporary models. (A) (Top) The wild-type hTERT core promoter sequence and (bottom) the modified antiparallel hairpin (AH) sequence with PQS-1, -2 and -3 indicating the ‘putative quadruplex forming sequences’, and the artificially strengthened hairpin region shown with a dashed line. The purple and gold colors correspond to the purple and gold regions in (B). Red nucleotides indicate residues that were modified from WT to force the formation of the parallel-antiparallel stacked hairpin model as in (B). (B) The two current models proposed for the secondary structure formed in the hTERT core promoter, three parallel stacked (left) and a parallel stacked onto an antiparallel with 8 bp hairpin. The sugar phosphate backbone is shown in ribbon, guanines in G-tetrads in blue, and nucleotides involved in the hairpin shown in orange. Extraneous loop bases were removed for clarity. The purple ‘PQS1’ region reportedly adopts the same parallel conformation in both models, and this sequence has been solved (13). The gold region highlights the major difference in the two models, herein referred to as the ‘PQS23’ region.
The original three studies (11–13) of G-quadruplex forming capability of the hTERT core promoter utilized a sliding frame approach to identify G-quadruplex formation and stability. From left to right (5′ to 3′) in Figure 1A we have designated these putative quadruplex forming segments (PQS) as PQS1, PQS2 and PQS3. Isolated PQS1 has been shown to exist as a mixture of both parallel and anti-parallel (3+1) structures by nuclear magnetic resonance (NMR) spectroscopy (13). Isolated PQS3 was shown to adopt a parallel conformation (12,13), albeit with slightly lower stability than PQS1. Further support for the formation of both PQS1 and PQS3 quadruplexes in the context of the full-length sequence was observed by Taq polymerase stop assays (11,12). The PQS2 segment alone does not appear to readily form a G-quadruplex. However, using an inverted Taq polymerase stop assay, Micheli et al. (12) observed that the PQS2–PQS3 (‘PQS23’) region could potentially form stacked parallel G-quadruplexes, implying that the inter-quadruplex stacking interface provided a stabilizing effect. This observation is substantiated by the large circular dichroism (CD) signal at 260 nm for the WT PQS23 sequence (30). Micheli et al. (12) proposed a model of ‘self-organization’ that featured three contiguous stacked parallel quadruplexes, which stems from stabilization of the PQS2 through terminal G-quadruplex stacking interactions. That model was supported by subsequent biophysical studies combined with molecular dynamics simulations (24) (Figure 1B, left model). Alternatively, Palumbo et al. (11) proposed a model based on dimethylsulphate (DMS) foot-printing techniques that featured a parallel PQS1 stacked onto an antiparallel/hybrid G-quadruplex with 8-bp hairpin loop (Figure 1B, right model). A later study on the same sequence proposed a different structure (again based on DMS foot-printing) with a longer hairpin joining two parallel G-quadruplexes (31). In both cases (11,31), the CD spectra shown for the folded hTERT sequence lack the signature features expected for structures containing a significant amount of hairpin duplex component. In addition, both proposed hairpin structures contain a number of thermodynamically destabilizing features including mismatches and bulges.
The structure of the wild-type hTERT promoter sequence thus remains ambiguous. It is important to determine its structure since it is now considered a target for potential cancer drugs. For any rational structure-based design of drug candidates, it is essential to know the structure being targeted with certainty. The goal of our study is to clarify the hTERT promoter structure.
A challenge in the determination of the structures of long multimeric quadruplex-forming sequences is that conventional high-resolution NMR or crystallographic methods have yet to be successful, necessitating the use of lower-resolution methods. Herein we report the results of an integrated structural biology (32) investigation of the full-length hTERT promoter sequence using a battery of biophysical and biochemical approaches. In addition, we implemented what can be called a falsum figura (‘false shape’) strategy in which we designed and optimized a non-biological sequence that is forced into the unusual hairpin structure proposed by Palumbo et al. (11). We show that the biophysical and biochemical properties of that structure are unambiguously distinct from the structure formed by the wild-type hTERT sequence, indicating that such a structure is not the predominate folded form of the native sequence. We used classical spectroscopic techniques, hydrodynamic studies, small-angle X-ray scattering, and DNase I digestion as a biochemical probe for duplex DNA to characterize the structures, and we built all-atom models using molecular dynamics simulations to predict testable experimental properties to distinguish structural models. We conclude that the wild-type hTERT promoter sequence forms a compact structure containing three stacked parallel G-quadruplex units and that such a structure is the most appropriate target for any rational drug design effort.
MATERIALS AND METHODS
Oligonucleotides
Oligonucleotides are given in Table 1. Oligos were purchased from either IDT (Integrated DNA Technologies, Coralville, IA) or Eurofins Genomics (Louisville, KY, USA) with standard desalting unless otherwise specified. Upon receipt, stock oligos were dissolved in MilliQ ultrapure water (18.2 MΩ × cm at 25°C) at concentrations between 0.1 and 1 mM and stored at −20.0°C until use. Folding was achieved by diluting stock oligos into their respective buffer and heating to 99.9°C in a water bath for 20 min, followed by slow cooling overnight and subsequent storage at 4°C.
Table 1.
Oligonucleotide sequences used in this study
| Name | Oligonucleotide sequence 5′ to 3′ | Length | MW | E260 (M−1cm−1) |
|---|---|---|---|---|
| WT | GGGGAGGGGCTGGGAGGGCCCGGAGGGGGCTGGGCCGGGGACCCGGGAGGGGTCGGGACGGGGCGGGG | 68 | 21633 | 672671 |
| WT PQS1 | AGGGGAGGGGCTGGGAGGGC | 20 | 6369 | 202900 |
| WT PQS12 | AGGGGAGGGGCTGGGAGGGCCCGGAGGGGGCTGGGCCGGGGACCCGGGA | 49 | 15523 | 478700 |
| WT PQS23 | AGGGGGCTGGGCCGGGGACCCGGGAGGGGTCGGGACGGGGCGGGG | 45 | 14278 | 436500 |
| OP | ATGGGTGGGTGGGTGGGCCCTTAGGGTGGGTGGGTCGGGATGGGTGGGTGGGTGGGT | 57 | 18145 | 553100 |
| AH | TGGGAGGGTCTGGGAGGGCCCTTATGGGTCTGGGCCCGCGACGCGCGAGGCGTCGCGGCTGGGCGGGT | 68 | 21289 | 628400 |
| AH PQS23 | TGGGTCTGGGCCCGCGACGCGCGAGGCGTCGCGGCTGGGCGGGT | 44 | 13721 | 398100 |
| AH Hairpin | CCCGCGACGCGCGAGGCGTCGCGGCT | 26 | 7975 | 230296 |
| 1XAV | TGAGGGTGGGTAGGGTGGGTAA | 22 | 6992 | 228700 |
| Hairpin Duplex | GCATATATAGGACCCGCGAGCGGTCCTATATATGC | 35 | 10756 | 339998 |
Buffers
All buffer reagents, unless otherwise specified, were purchased from Sigma-Aldrich. TBAP folding buffer (10 mM tetrabutylammonium dihydrogen phosphate, 200 mM KCl, 1 mM EDTA, pH 7.0) was prepared by dissolving 3.4 g of tetrabutylammonium phosphate monobasic, 14.9 g KCl and 292 mg of acid EDTA in 10 ml of tetrabutylammonium hydroxide 40% solution in 900 ml of MilliQ ultrapure water and adjusted to pH 7.0 before bringing to 1 l (density = 1.0081 g/cm3, viscosity = 0.01038 poise). Phosphate (PO4) buffer (8 mM phosphate, 200 mM KCl, pH 7.2) was prepared by dissolving 1.0 g K2HPO4, 272 mg KH2PO4 and 13.9 g KCl in 900 mL of MilliQ ultrapure water and adjusting pH to 7.2 before bringing to 1 l (calculated density = 1.0081 g/cm3, calculated viscosity = 0.00996 poise). DNase I reaction buffer (4×) (80 mM Tris, 8 mM MgCl2, 40 mM KCl, pH 7.2) was prepared by dissolving 967 mg Tris base, 76 mg MgCl2 and 298 mg KCl in 90 ml of MilliQ ultrapure water and adjusted to pH 7.2 before bringing to 100 ml. All buffers were filtered through 0.2 μm filters before use.
Preparative size exclusion chromatography (SEC)
Oligonucleotide purification was achieved using SEC as detailed previously (33). Briefly, oligonucleotides were annealed at concentrations of 40–100 μM in their respective buffers, filtered through 0.2 μm filters, and injected onto an equilibrated Superdex 75 16/600 SEC column (GE Healthcare 28-9893-33) using a Waters 600 HPLC system. The flow rate was maintained at 0.5 ml/min and sample fractions were collected every 2 min from 100 to 180 min run time. The molecular weights of fractionated species were estimated based on a regression analysis of elution time versus log(MW) of protein standards (Sigma #69385), with elution profiles monitored at 260 and 280 nm. Purifications were carried out at room temperature and fractionated samples were stored at 4°C prior to concentration and downstream analysis.
DNase I degradation assay
Amplification Grade DNase I was purchased from ThermoFisher and used without further modification (ThermoFisher, #18068015). PAGE purified oligonucleotides for the hTERT WT and AH sequences were annealed in TBAP folding buffer (without EDTA) before being concentrated to ∼50 μM in Pierce protein concentrators (ThermoFisher, #88515). The oligonucleotides were subsequently diluted to 160 ng/μl in TBAP buffer and mixed in a 2:1:1 with DNase I reaction buffer and nuclease free H2O (DNA:RXN-buffer:H2O) to give a final concentration of 80 ng/μl DNA in 10 ul of reaction mix. The reactions were initiated by the addition of 1 ul DNase I (at 1 unit/μl DNase I), incubated at room temperature, and stopped at the indicated time points by the addition of 1 ul of 50 mM EDTA solution. The DNase I cleavage products were then resolved on a 5% agarose gel (∼2.5 h at ∼7 V/cm) with visualization by ethidium bromide or SYBR green stain. Gels were imaged using a PharosFX Plus imaging system (BioRad).
Circular dichroism spectroscopy (CD)
CD melting studies and spectra were collected on a Jasco-710 spectropolarimeter (Jasco Inc. Easton, MD, USA) equipped with a Peltier thermostat regulated cell holder and magnetic stirrer. CD and melting spectra were collected using the following instrument parameters: 1 cm path length quartz cuvette, 210 or 240 to 340 nm wavelength range, 1.0 nm step size, 200 nm/min scan rate, 1.0 nm bandwidth, 2 s integration time, and 4 scan accumulation. Spectra were recorded at 20.0°C and melting spectra were collected over a range of 4°C to 98°C with 2°C step intervals, 4°C/min ramp speed, and a 2-min equilibration time at each temperature before acquisition. Spectra were corrected by subtracting a buffer blank. In the case of DNase I degradation assays, the blank included DNase I. Spectra were normalized to molar circular dichroism (Δϵ) based on DNA strand concentration using the following equation:
 |
where θ is ellipticity in millidegrees, c is molar DNA concentration in mol/l, and l is the path length of the cell in cm.
For CD monitored DNase I reactions, oligonucleotides were prepared as in the standard DNase I reactions, and diluted to a final strand concentration of 3 μM in 500 μl by mixing in the same v/v ratio of DNA, MQ H2O and 4× DNase I RXN buffer. Reactions were initiated by adding 50 μl of DNase I (at 1 unit/μl DNase I) and mixing by pipetting 15 times. Reactions were monitored over a total of 4 h in a 0.5 cm path length quartz cuvette. Four hours after DNase I addition, 20 μl of a 100 μM CaCl2 solution was added (for a final concentration of ∼3.5 μM Ca2+), and the measurements were resumed to ensure that the DNase I was active.
1H Nuclear magnetic resonance (1H-NMR) spectroscopy
1D 1H-NMR spectroscopy was performed on a Bruker Avance Neo 600-MHz instrument equipped with a nitrogen-cooled Prodigy TCI cryoprobe. Experiments were performed at 25.0 or 40.0°C using standard 3- or 5-mm NMR tubes. Minimization of water signal was achieved using a water flip-back pulse sequence. For each measurement, 1024 complex points were collected with an acquisition time of 86 ms. Total scans for each spectrum are as follows: WT (4096), AH (128), OP (128), WT PQS23 (128), AH PQS23 (4). Samples were prepared by annealing in PO4 folding buffer and purified by preparative SEC. Fractions were pooled and concentrated using pre-rinsed Pall 3K MWCO concentrators, followed by addition of 5% (v/v) D2O. Final concentrations at time of analysis were: WT (150 μM), AH (225 μM), OP (140 μM), WT PQS23 (285 μM) and AH PQS23 (285 μM). After concentration an aliquot was removed from each sample and analyzed by CD and AUC to ensure that there were no conformational changes due to concentration.
Analytical ultracentrifugation (AUC)
Sedimentation velocity (SV) experiments were performed in a Beckman Coulter ProteomeLab XL-A analytical ultracentrifuge (Beckman Coulter Inc., Brea, CA, USA) at 20.0°C and 40 000 rpm in standard 2-sector cells using An50Ti or An60Ti rotors. 100 to 150 scans over an 8 h period were collected and analyzed in Sedfit using the continuous C(s) model. For the hTERT oligonucleotides (‘WT’ and ‘WT PQS23’) a concentration series of purified oligonucleotide was used to correct for any non-ideal concentration-dependency in sedimentation. This was done using the following concentrations and respective wavelengths: 2.5 mg/ml (306 nm), 1.25 mg/ml (302 nm), 0.5 mg/ml (298 nm), 0.125 mg/ml (290 nm), 0.05 mg/ml (272 nm) and 0.01 mg/ml (260 nm) at 20.0°C and 40k rpm. Buffer densities and viscosities used in the SV analyses are provided in the buffers section, and the partial specific volume was held constant at 0.55 ml/g. All large oligo sequences (>∼45 nt) regardless of purity at time of purchase had a propensity to aggregate under normal annealing conditions. Thus, all SV experiments were conducted directly after SEC purification, except when correcting for concentration effects. Estimation of weight averaged frictional ratios ( ) of the monomeric WT sequences were carried using Sedfit's C(s,ffo) model, with a frictional ratio resolution set to 10 and sedimentation coefficient resolution of 100.
SEC resolved small-angle X-ray scattering (SEC-SAXS)
SAXS was performed at BioCAT (beamline 18ID at the Advanced Photon Source, Chicago) with in-line size exclusion chromatography. Samples in a modified PO4 buffer (8 mM PO4, 185 mM KCl, 15 mM NaCl, 1 mM EDTA, pH 7.2) were loaded onto a Superdex 75 10/300 GL column, which was run at 0.7 ml/min using an AKTA Pure FPLC (GE Healthcare Life Sciences) and the eluate after it passed through the UV monitor was directed through the SAXS flow cell, which consists of a 1 mm ID quartz capillary with 50 μm walls. A co-flowing buffer sheath was used to separate the sample from the capillary walls, helping prevent radiation damage (34). Scattering intensity was recorded using a Pilatus3 1M (Dectris) detector which was placed 3.5 m from the sample giving access to a q-range of 0.004–0.4 Å−1. A series of 0.5 second exposures were acquired every 2 s during elution and data was reduced using BioXTAS RAW 1.6.3 (35). Buffer blanks were created by averaging regions flanking the elution peak and subtracted from exposures selected from the elution peak to create the I(q) versus q curves used for subsequent analyses. More information on SAXS data collection, reduction and interpretation can be found in Supplementary Table S1.
Molecular dynamics simulations
Molecular dynamics simulations were carried out on the hTERT models created previously (24) with modifications of bases where necessary using the ‘swap na’ command in UCSF Chimera 1.12 (https://www.cgl.ucsf.edu/chimera/) and manual alterations in starting atomic configurations using Schrödinger's Maestro 11.8 (https://www.schrodinger.com/). Coordinating counter ions (K+) were manually added between G-quartet stacks and minimized prior to simulations. The PDB structures were imported into the xleap module of AMBER16 (https://ambermd.org/), neutralized with K+ ions, and solvated in a rectangular box of TIP3P water molecules with a 15 Å buffer distance. All simulations were equilibrated using sander at 300 K and 1 atm using the following steps: (i) minimization of water and ions with weak restraints of 10.0 kcal/mol/Å on all nucleic acid residues (2000 cycles of minimization, 500 steepest decent before switching to conjugate gradient) and 10.0 Å cutoff, (ii) heating from 0 to 100 K over 20 ps with 50 kcal/mol/Å restraints on all nucleic acid residues, (iii) minimization of entire system without restraints (2500 cycles, 1000 steepest decent before switching to conjugate gradient) with 10 Å cutoff, (iv) heating from 100 to 300 K over 20 ps with weak restraints of 10.0 kcal/mol/Å on all nucleic acid residues and (v) equilibration at 1 atm for 100 ps with weak restraints of 10.0 kcal/mol/Å on nucleic acids. The output from equilibration was then used as the initial.rst input file for 100 ns of unrestrained MD simulations using pmemd with GPU acceleration in the isothermal isobaric ensemble (P = 1 atm, T = 300 K). Periodic boundary conditions and PME were used. 2.0 fs time steps were used with bonds involving hydrogen frozen using SHAKE (ntc = 2). The hairpin structure was manually placed in three different starting configurations and simulated three separate times until convergence was obtained. Trajectories were analyzed using the CPPTRAJ module in the AmberTools16 package (https://ambermd.org/). Hydrodynamic properties were calculated as average and standard deviation over 100 equally spaced trajectory snapshots, unless otherwise specified, using the program HYDROPRO10 (36) with the recommended parameters (37). G-quartet associated potassium ions were included (and added to the molecular weight) in the hydrodynamic calculations. Values are reported as average and standard deviations across 100 evenly spaced snapshots of the trajectories. Clustering of the hTERT trajectory was performed as described (http://www.amber.utah.edu/AMBER-workshop/London-2015/Cluster/) using the CCPTRAJ module of Amber.
Molecular visualizations
All molecular visualizations of MD trajectories and models were performed in UCSF Chimera v1.12 (https://www.cgl.ucsf.edu/chimera/).
RESULTS
Sequence design and logic
In the 2014 report from Chaires et al. (24), the authors noted that a parallel-antiparallel-hairpin structure, such as proposed by Palumbo et al., should have a CD spectrum distinctly different from that observed for the WT sequence. To validate this assertion, we modified the WT hTERT sequence to generate an optimal sequence that would fold into the hairpin structure proposed by Palumbo et al. (11) to contrast its properties with that of the WT sequence (Table 1, AH). The AH sequence was designed to include base substitutions (G>T) to restrict G-quadruplex formation to runs of only 3 guanines and modified residues in the putative hairpin region to maximize hairpin formation and concomitantly disfavor G-quadruplex formation. It is worth noting that a significant number of modifications (15 out of 68 WT bases) were required to stabilize the hairpin structure, as fewer mutations resulted in mixtures of two or more species. We also created an optimized all-parallel structure (Table 1, OP) using three runs of a canonical parallel G-quadruplex motif which retains a 6-nucleotide modified non-guanine-containing loop sequence similar to the WT (Figure 1A, segment between PQS1 and PQS2). OP was designed to minimize possible G-register exchange (38) and thereby minimize heterogeneity while retaining the three-stack G4 structure. In addition, several truncated sequences were designed to contain isolated structural elements of the longer wild-type form. These represent the first (PQS1), first and second (PQS12), and second and third (PQS23) G4 forming regions of hTERT WT. A high-resolution structure of PQS1 has been reported that can be integrated into our structural models (13). For the AH sequence analogs, a hairpin-G4 structure (AH-PQS23) and an isolated duplex hairpin (AH-hairpin) were designed. Table 1 contains the complete list of sequences used in this study.
Circular dichroism and DNase I cleavage assays reveal only G-quadruplex moieties within the wild type hTERT core promoter sequence
We began our structural investigations using CD spectroscopy in potassium buffer. The differences in the spectra of folded WT and AH are unambiguous (Figure 2A). Consistent with earlier reports (11,12,24), the strand-normalized hTERT WT spectrum exhibited strong positive molar ellipticity at 260 nm, a trough at 240 nm, and a small trailing shoulder at 290 nm. This large 260 nm amplitude is consistent with a high degree of anti–anti guanine base steps (39,40), typical of parallel quadruplexes, and could only arise from stacking of a large number of G-quartets. Indeed, the CD amplitude at 260 nm is linearly correlated with the number of stacked, parallel, G-quartets (41), so we can estimate from these data that the folded WT sequence contains nine stacked quartets. In contrast, the AH spectrum has only a modest peak at 260 nm, a trough at 245 nm, and a relatively larger shoulder at 290 nm when compared with the WT. We found that the WT CD spectrum could be reconstructed by addition of spectra obtained with the truncated sequences, PQS1 and PQS23 that are known to form only parallel quadruplex structures (Figure 2B, Table 1). In contrast, the AH spectrum can only be reconstructed using a combination of parallel G4 (PDB ID: 1XAV (42)), antiparallel-hybrid G4 (40) and duplex hairpin CD spectra (Figure 2C). The low amplitude at 260 nm for AH is consistent with the contribution of three stacked G-quartets in the parallel conformation, while the pronounced shoulder near 290 nm arises from a three-quartet antiparallel contribution. The assumed B-form duplex contributes comparatively little to the CD spectra (43).
Figure 2.

CD spectra for WT, AH, and their putative component spectra. (A) Strand-normalized CD spectra of the WT and AH sequences annealed in the presence of 200 mM K+, showing distinct differences in the troughs (∼240 nm versus 245 nm), peak height at 260 nm, and shoulder at 290 nm. (B) The WT sequence can be faithfully reconstructed (dashed line ‘sum’) from the addition of the PQS1 (red) and PQS23 (green) fragment spectra which adopt parallel topologies in 200 mM K+ buffer (as shown below). (C) The AH spectrum can be reconstructed (dashed line ‘sum’) from the addition of the parallel 1XAV (red), a hairpin (green) and an antiparallel G-quadruplex spectrum (blue).
The Hurley group recently re-investigated using DMS foot-printing the WT hTERT sequence (31) and suggested formation of a different, larger hairpin which putatively forms within the internal PQS2 region, sandwiched between two outer parallel G4s (PQS1 and PQS3). Other DNA conformational forms might contribute to CD spectra. We reasoned that it may be possible for the hairpin to adopt an A-form duplex (39), and that perhaps this might contribute to the CD magnitude at 260 nm, compensating for the magnitude expected for a parallel quadruplex forming within PQS2, complicating interpretation of the CD spectra. As an independent, selective, test for the presence of duplex regions we used an enzymatic assay to probe the structures. Any proposed hairpin structure, whether in B- or A-form, should be susceptible to cleavage by deoxyribonuclease I (DNase I), while parallel G4 structures should remain undigested due to the occluded phosphate backbone (44,45). Upon treatment with DNase I (Figure 3), we found that the WT sequence is entirely protected from DNase I cleavage while AH is degraded into discrete components (Figure 3A & B). Further, the AH cleavage bands observed after 10 min at ∼14 and ∼8 bp are approximately the sizes expected for cleavage of the antiparallel hairpin (Supplementary Figure S1) (46). A scaled-up DNase I cleavage reaction was also monitored using CD spectroscopy, revealing that there was no discernable change in the WT CD spectrum but a significant alteration of the AH CD (Figure 3C and D). The shapes of the difference spectra observed in Figure 3D for the digestion of AH over the course of the DNase I digestion are consistent with the degradation of a B-form duplex domain within the structure. Overall, these results clearly demonstrate that a DNase I-susceptible hairpin is not detectable in the WT hTERT core promoter sequence.
Figure 3.

DNase I cleavage susceptibility assay. (A) Representative agarose gel showing DNase I treatment times (NT = no treatment) in minutes for WT or AH sequences after annealing in TBAP (without EDTA). The gel shows that the WT sequence is not sensitive to nuclease cleavage, whereas the AH sequence is cleaved into discrete bands by 10 min treatment time. (B) Densitometry of the AH lanes from A with dashed lines showing the appearance of discrete bands at ∼14 bp (or ∼28 nt) and ∼8 bp (or ∼16 nt). (C, D) CD difference plots showing the change in CD signal over the DNase I treatment time course. In both windows, the left Y-axis corresponds to the black curves, which is the strand-normalized ellipticity of the WT or AH sequence pre-DNase I treatment. The right Y-axis corresponds to the colored spectra which (from blue to red) indicate the change in CD (difference spectra) from the original spectrum due to DNase I treatment. (C, inset) Color scale representing time interval from addition of DNase I (blue, time = 0) to end of experiment (red, time = 4 h). The right Y-axis is scaled such as to emphasize where changes are occurring.
Treatment of the optimized, G4-stacked, OP structure, or the truncated WT sequence (‘WT PQS23’) with DNase I had no cleavage effect, consistent with the absence of any duplex structure. A slight degradation over time was observed in the WT PQS12. In contrast, the AH truncated sequence (‘AH PQS23’) and the control AH hairpin sequence alone (‘HP’) were completely degraded by 15 min (Supplementary Figure S2).
1H-NMR confirms that the WT hTERT sequence forms only parallel quadruplexes
We next analyzed the WT and modified sequences at the atomic level using 1H-NMR to gain a better understanding of the secondary structures giving rise to the observed CD spectra (Figure 2). Figure 4A shows the Hoogsteen and Watson–Crick imino proton region of the 1H-NMR spectra (∼10–14.6 ppm) for the WT, AH, OP and truncated PQS23 sequences (Figure 4A and C), along with their respective CD spectra (Figure 4B and D). In the WT spectrum (Figure 4A, black) we observed a very broad envelope encompassing the guanine Hoogsteen imino protons between ∼10 and 12 ppm, indicative of G-quadruplex formation, along with a slight, almost negligible, signal at ∼12.9 ppm. In contrast, we find that the spectrum of AH exhibits the expected Watson–Crick-like (W.C.) base-pairing interactions for a hairpin in the region from 12.6 to 13.6 ppm, along with a broad envelope in the Hoogsteen G-quadruplex region from 10.8 to 12 ppm, confirming the presence of both duplex and G-quadruplex structures. The contrasting behavior of WT and AH show that there is no appreciable duplex base pairing in the unmodified hTERT sequence. Additional sequences were also studied by NMR. The OP sequence displays only G-quadruplex imino proton shifts in the range of 10–12 ppm, with no signals within the W.C. range. The OP sequence was created as a reference ‘idealized’ three-parallel G-quadruplex system with minimal loops connecting the stacked G4 units. Figure 4B shows that the WT and OP sequences exhibit nearly identical magnitude and shape from 220 to 270 nm by CD, the only difference being the shoulder at ∼290 nm in the WT spectrum. Importantly, we find that the strand-normalized integrated intensity in the Hoogsteen imino proton signals for the OP and WT sequences is 1.1:1 (see Supplementary Figure S3 for regions used in normalization).
Figure 4.

1H-NMR spectra and corresponding CD spectra of WT, AH, OP and truncated sequences. (A and C) Proton imino spectra from 10 to 14.6 ppm showing Watson–Crick and Hoogsteen type imino proton shifts for the OP, AH, WT and truncated sequences WT PQS23 and AH PQS23. Intensities in A are only approximate, whereas concentrations and intensities in C are the same. (B and D) Strand-normalized CD spectra corresponding to spectra in A and C, respectively.
The truncated WT PQS23 and AH PQS23 sequences also show a clear difference by NMR and CD (Figure 4C and D). With the removal of PQS1 (and ∼6 nt connecting loop region), we find that the AH PQS23 imino proton spectra resolves ∼12 G-quadruplex peaks, the number expected for a single three-tetrad G-quadruplex, with the same number W.C. imino peaks as the full-length AH construct. This is in clear contrast to the WT PQS23 segment, which displays almost twice as many G-quadruplex imino peaks by integration (1.8:1). Taken with their respective CD spectra, this clearly demonstrates that the full-length and truncated WT sequences preferentially form only parallel G-quadruplexes.
Hydrodynamic size and shape of the WT sequence indicates a very compact and globular structure
Hydrodynamic experimentation and modeling methods (47) have gone hand-in-hand in structural biology for over 75 years (48). It is now routine in our laboratory to use experimental hydrodynamic properties of nucleic acids to infer, and iteratively refine, their structural models using molecular dynamics modeling simulations (49–51). These techniques have allowed for the study of a wide array of DNA conformations in their native state and under biologically-relevant conditions (52). We used this powerful approach to examine the annealed and SEC-purified WT, AH and truncated hTERT promoter sequences by hydrodynamic, X-ray scattering, molecular dynamics and bead modeling methods.
To discern differences in the overall hydrodynamic shapes formed by the sequences listed in Table 1, we employed analytical ultracentrifugation sedimentation velocity (AUC-SV) experiments to determine sedimentation coefficients from which molecular weights and frictional coefficients may be easily calculated. The results are tabulated in Table 2. Figure 5 shows the significant difference in sedimentation coefficient distributions for the folded WT and AH sequences by C(s) species analysis (53). There is very little overlap between the WT and AH c(s) distributions, indicating different hydrodynamic shapes. The corrected S20,w values for WT and AH sequences were 3.86 ± 0.01 and 3.25 ± 0.09, respectively (Table 2)—the former WT value being consistent with our earlier report (24). (We note that the C(s) distribution of the WT shows a very slight heterogeneity with a few percent of the sample sedimenting between 2 and 3 S.)
Table 2.
Comparison of hydrodynamic properties measured by AUC-SV experiments with values calculated from molecular dynamics trajectories of given models. The table is organized such that the models with the best agreement from calculations are nearest their respective experimental values.
| WT | WT PQS23 | AH | AH PQS23 | |||||
|---|---|---|---|---|---|---|---|---|
| Property | Exp. | Parallel stacked (calc.) | Exp. | Parallel stacked (calc.) | Exp. | Hairpin (calc.) | Exp. | Hairpin (calc.) |
| Sedimentation coefficient, S20,W (×10−13 S) | 3.86 (±0.01) | 3.89 (±0.03) | 2.95 (±0.03) | 2.96 (±0.05) | 3.25 (±0.09) | 3.30 (±0.05) | 2.70 (±0.01) | 2.64 (±0.03) |
| Molecular weight (kDa) | 24.0 (±0.13) | 22.0 | 16.5 (±0.15) | 14.5 | 24.4 (±1.44) | 21.5 | 16.8 (±0.68) | 14.0 |
| Stokes radius, Rs (nm) | 2.46 (±0.01) | 2.22 (±0.02) | 2.22 (±0.04) | 1.96 (±0.03) | 2.56 (±0.07) | 2.58 (±0.03) | 2.49 (±0.07) | 2.14 (±0.02) |
| Frictional ratio, f/fo | 1.42 | 1.26 | 1.45 | 1.26 | 1.7 | 1.54 | 1.6 | 1.45 |
Figure 5.

Experimental and calculated sedimentation coefficient distributions. The red and black curves are representative SEDFIT C(s) distributions of the WT (black) and AH (red) sequences corrected to density and viscosity of water at 20.0°C (S20,w). The overlaid histograms are of sedimentation coefficient values (S20,w) obtained from hydrodynamic calculations of PDB frames extracted from 100 ns of explicit solvent MD trajectories for the stacked parallel model (black) or the hairpin model (red).
A similar trend was also observed for the truncated sequences WT PQS23 and AH PQS23 (S20,w values of 3.0 and 2.7, respectively) (Supplementary Figure S4). Since the molecular weights of the pairs of sequences in question are approximately the same (given the limit in experimental accuracy), the measured sedimentation coefficients directly report the particle frictional coefficients that reflect differences in shape. These data indicate that all WT sequences are much more compact than their AH counterparts.
To rationalize these differences in size and shape, as well as the secondary structure derived from CD and NMR studies, we used molecular dynamics simulations and hydrodynamic calculations to refine the most plausible structural models (51). These models were constructed based on the proposed secondary structures (Figure 1) in conjunction with coordinates from the protein databank (PDB). The WT all-parallel stacked and hairpin models were used from previous work (24), with the latter modified to reflect the AH sequence with optimized duplex base pairing given in Table 1. Truncated models were created simply by removal of the PQS1 and 6 nt loop region. Each model was subjected to 100 ns of unrestrained, fully solvated molecular dynamics simulation. The resulting MD trajectories were then used to calculate the hydrodynamic properties of each system (Table 2) using HYDROPRO10 (36), which calculated the sedimentation and diffusion coefficients. These experimentally accessible measures were extracted from PDB coordinates of structures in evenly spaced frames throughout the trajectories to obtain statistically meaningful ensemble values (visualized as the histogram in Figure 5 and averages in Table 2).
We found that the sedimentation coefficient for the all-parallel stacked molecular dynamics-derived model agreed extremely well with the WT experimental value (calculated S20,w = 3.89 ± 0.01 versus experimental S20,w = 3.86 ± 0.03). The AH hairpin model also agreed well with the AH experimental sedimentation coefficient (calculated S20,w = 3.30 ± 0.05 versus experimental S20,w = 3.25 ± 0.09) (Figure 5, Table 2). The agreement between WT PQS23 with a two-parallel stacked model was even closer (calculated: 2.96 ± 0.05 versus experimental: 2.95 ± 0.03). The AH-PQS23 model was also consistent with experimental data (calculated S20,w = 2.64 ± 0.03 versus experimental S20,w = 2.70 ± 0.01) (Table 2, Supplementary Figure S4). The calculated and experimental S20,w values were effectively within experimental error in all cases. These hydrodynamic studies show that the folded hTERT WT promoter is too compact to contain an extended 8 bp hairpin. In addition, it must contain fully stacked G4 units, since the more extended models with a displaced terminal G4 unit predict a sedimentation coefficient distinctly different from the observed experimental value.
Small-angle X-ray scattering (SAXS)
Figure 6 shows the results of SEC-SAXS experiments obtained with folded hTERT constructs. Supplementary Table S1 provides complete details of SAXS experiments, with all information suggested by recent publication guidelines (54). Several general qualitative conclusions can be drawn by inspection of these plots (55,56). Figure 6A and B shows the primary SAXS data. The double logarithmic plots of the scattering intensity for the WT, OP and AH structures (Figure 6B), reveal distinct differences between the structures. It is clear that scattering of WT is different from AH. The use of in-line size exclusion chromatography ensured the absence of contaminating species and sample monodispersity, which was also demonstrated by the Guinier plots shown in Figure 6C, which are linear for all samples (residuals plot for linear fits for all samples are shown to the right of panel C). Parameter estimates for the radii of gyration (Rg) obtained by analysis of Guinier plots are given in Supplementary Table S1.
Figure 6.

SEC-SAXS results for the WT (black), AH (red), and OP (green) oligonucleotides. (A) I(q) versus q as log-linear and (B) log–log plots. (C) Guinier plots (with fits shown in blue) for qRg < 1.3, along with corresponding residual plots (right). (D) P(r) versus r profiles from the data in (a and b) normalized to equal areas. (E) Normalized Kratky plots for the data in (a and b). Collection parameters, I(0), Rg, Dmax and other values can be found in Supplementary Table S1.
The differences between the WT, AH and OP are further illustrated by the pair-distance distribution (Figure 6D). The hairpin structure is inconsistent with the observed scattering of the folded wild-type hTERT sequence. For a homogeneous structure, the exact character of the P(r) plot depends on particle shape (e.g. globular, prolate, oblate) and the domain structure of the particle (57). The shape of the AH P(r) curve (Figure 6D, red), with a pronounced multimodal character, suggests the presence of multiple domains within the structure, consistent with the presence of an extend hairpin coupled to G4 units. In contrast, the WT P(r) curve (Figure 6D, black) is more symmetrical, indicative of a more compact structure. OP was designed to optimize the stacked G4 structure. Accordingly, the P(r) curve for OP (Figure 6D, green) is more symmetric (but still with a trailing edge at larger distances), consistent with a compact three-stacked G4 structure with an elongated shape. All P(r) plots yielded radii of gyration which were within 0.1 of those derived from Guinier approximation (Supplementary Table S1).
Kratky plots (Figure 6E) for WT, AH and OP provide a qualitative appraisal of the degree of unfolding and the flexibility of samples (58). Compact, fully-folded particles are expected to exhibit a Gaussian shaped curve, while unfolded or flexible particles would show nonzero plateau regions at high q. The major observation from the data in Figure 6E is that WT and OP (Figure 6E, black and green, respectively) are clearly distinguishable from AH (Figure 6E, red). A hairpin structure is inconsistent with their scattering data. WT and OP curves reach zero at high q, with nearly Gaussian shapes, indicating that they are fully folded and globular. In contrast, AH shows a more complex curve. While it seems to be nearly fully folded as judged by its intercept on the x-axis, the data for AH show a distinct plateau in the q range spanning 0.05–0.15 that indicates particle flexibility. We attribute this flexibility to the region linking the hairpin to the G-quadruplex domain, which was observed in our MD simulations (not shown). These data demonstrate that the WT sequence folds into a distinctly different compact globular structure. Supplementary Figure S5 shows the scattering behavior of the partial hTERT constructs WT-PQS23 and AH-PQS23. The general behavior and trends are similar to what was seen for the full-length constructs. Importantly, the more asymmetric hairpin-G4 structures can be clearly distinguished from compact, globular G4 structures.
Ab initio bead models for WT, OP and AH were obtained using the DAMMIF program (59), with the results shown in Supplementary Figure S6. The key point from inspection of these shapes is that both hairpin structures, AH and AH PQS23 (Supplementary Figure S6C and E), feature clear protuberances that are absent from all other structures. These protuberances are most likely the hairpin duplex domain. We are aware of the utility of SAXS data in more detailed atomistic structural modeling of macromolecules with conformational heterogeneity (60–62). Efforts in that direction are currently underway in our laboratory.
Thermal denaturation of hTERT structures
Figure 7 shows thermal denaturation studies, monitored by CD, for WT and AH structures. There are clear differences between the two structures, with hairpin-containing AH noticeably less stable. In 200 mM KCl (Figure 7A, right most panel), melting of WT is incomplete even at 98°C, while AH is clearly less thermally stable with a Tm near 79°C. By lowering the KCl concentration to 10 mM, complete thermal denaturation curves for both structures were obtained (Figure 7B). The right most panel shows that AH is thermodynamically less stable than WT. The apparent Tm values for WT and AH are 82.5 and 65.2°C, respectively, in 10 mM KCl. The 17.3°C difference in Tm shows unambiguously that the hairpin-containing structure is thermodynamically less stable. A more detailed thermodynamic analysis of the thermal stabilities of WT and AH using CD and differential scanning calorimetry will be the subject of a manuscript that is in preparation.
Figure 7.

CD thermal denaturation profiles of the hTERT WT and antiparallel hairpin sequences. (A) Strand-normalized CD spectra from 220 to 320 nm over 4–98°C for the WT and AH sequences annealed in potassium phosphate buffer with 200 mM KCl (left) with normalized melting curves (right). (B) Strand-normalized CD spectra (left) and melting curves (right) for WT and AH sequences annealed in phosphate buffer with 10 mM KCl.
DISCUSSION
The results of our integrated structural biology approach show conclusively that the 68 nt wild-type hTERT promoter DNA sequence folds into a compact G-quadruplex structure that lacks any hairpin duplex domain. A structure with three stacked G4 units in the parallel conformation is both qualitatively and quantitatively consistent with our biophysical and biochemical data (circular dichroism, thermal denaturation, analytical ultracentrifugation, SEC-small angle X-ray scattering, nuclear magnetic resonance, DNase I cleavage assays, and molecular dynamics). An optimized hairpin-containing structure based on the model proposed by Palumbo et al. (11) shows unambiguously different biophysical and biochemical properties from the wild-type sequence.
Figure 8 shows a detailed model of the hTERT promoter structure obtained by our molecular dynamics simulations. This model integrates the high-resolution structure of the PSQ1 region that was obtained by NMR by Phan and coworkers (13). The model features nine stacked G-quartets (arising from three stacked parallel G4 units), consistent with the large experimental CD amplitude observed in Figure 2. This model accurately predicts the experimentally observed WT hTERT sedimentation coefficient (Figure 5) and is qualitatively consistent with the SAXS data in Figure 6. Several features of the structure are of interest. Apart from the G4 stacking interactions, the structure shows several stabilizing loop–loop interactions, which are consistent with slight contributions to the WT 1H-NMR of base-base interactions (small peak at ∼12.9 ppm) and the lack of these in the designed OP 1H-NMR (Figure 4). In addition to the K+ ion coordination sites within G-quartets, the loop topology presents additional specific K+ binding sites. This structure presents unique groove and interfacial geometries for small molecule binding interactions. Overall, the model in Figure 8 represents an excellent target structure for rational drug discovery and development.
Figure 8.
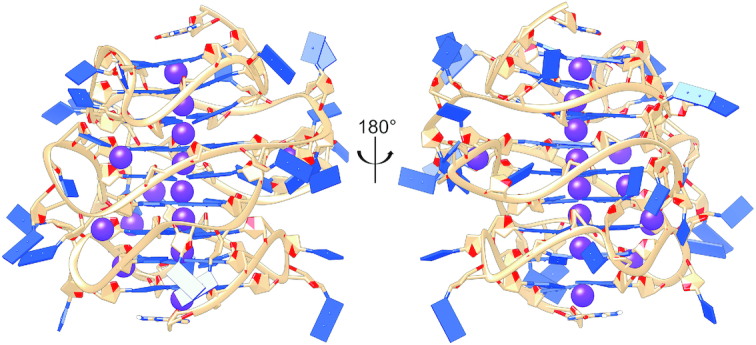
MD-derived model of the three-stacked parallel hTERT G-quadruplex. All-atom model of the stacked hTERT system (5′ top, 3′ bottom) showing phosphate backbone in tan, nucleotides in blue and potassium atoms in purple. This structure was derived from clustering over 100 ns of explicit solvent MD. The potassium ions observed in the central tetrad cavity, loops and grooves were observed in 66% of all frames used in clustering.
One of the major difficulties encountered in studying G-rich DNA sequences in their biological context is in dealing with G-tracts with greater than three guanines or with numbers of G-tract greater than four. These sequences are known for forming multiple isoforms through G-register exchange and changes in loop directionality, and often require base modifications such as inosine or thymine substitutions to select for only one structure (63). This phenomenon was observed in the hTERT PQS1 sequence (13,64). The physical consequence of G-register exchange, as shown by the Mittermaier lab (38), is an entropic stabilization of the folded state (albeit an ensemble of folded states). In addition to the five runs of three guanines, the full-length hTERT core promoter sequence has six runs of four guanines (G4) and one run of five guanines (G5) (Figure 1). This equates to a theoretical 192 isomers ([6xG4] x [1xG5] which is 26 × 31) when in the all-parallel stacked conformation, whereas this number decreases substantially to only ∼48 if in the hairpin conformation proposed by Palumbo et al. (11,38). This implies that the all-parallel stacked WT sequence would have an inherent entropic advantage over the hairpin structure, as well as increased thermodynamic stability, which is reflected in Figure 7.
Such conformational heterogeneity is also evident in structural characterizations. While the heterogeneity complicates interpretation of biophysical data, it in fact represents the reality of wild-type sequences whose complexities must be considered instead of being expeditiously simplified by arbitrary sequence modifications. In Figure 4 and Supplementary Figure S3, we observed a clear broadening of all peaks in 1H-NMR measurements of the WT sequence, suggesting the presence of parallel G-register isomers. This broadening was not exhibited by OP, which is by design a single, all-parallel stacked conformer. Moreover, we observed minor amounts of hTERT species with differing sedimentation coefficients (Figure 5, shoulder at ∼2.4 s). A possible explanation for this discrepancy is that there is a dynamic equilibrium between parallel stacked and unstacked structures. Alternatively, this could be attributed to a mixture of slow and fast rearrangements (such as G-register sliding or folding), which depending on the timescales, could easily complicate analyses (58,65). Overall, however, the major form appears consistent with the stacked conformation as in Figure 8.
G4 stacking and multimerization is now a well-known phenomenon (66). Various G-quadruplex stacking interfaces have been characterized (67–69), and the physical forces involved investigated (70). All of these support a 5′-3′ (head to tail) stacking mode, consistent with our model. However, our understanding of the biological relevance of G4 stacking is lacking. In promoters, stacked G4 structures are now speculated to be involved in a variety of roles, primarily as unique recognition sites for proteins, enhanced sensing of ligands through cooperativity, or as concentration-dependent G4 biological switches (66). In line with this is the unique opportunity of selective gene expression modulation via small molecules which stabilize or disrupt these stacking interfaces.
We have shown that these higher-order structures can be successfully examined using an integrated structural biology approach, coupled with judicious sequence design to create additional test structures with contrasting or confirmatory features. There are thousands of sequences in promoter regions in the human genome that have greater than four runs of multi-guanine tracks, yet almost all remain uncharacterized. An in-depth examination and understanding of these potential multimeric quadruplex structures will lead to the identification of unique binding sites and a potentially more selective way to target these G4 regions in the genome for transcription regulation.
DATA AVAILABILITY
Small-angle X-ray scattering data has been deposited in the publicly accessible Small Angle Scattering Biological Data Bank (https://www.sasbdb.org/) under the IDs: SASDHM3 (WT), SASDHN3 (AH), SASDHP3 (OP), SASDHQ3 (WT PQS23) and SASDHR3 (AH PQS23).
Supplementary Material
ACKNOWLEDGEMENTS
This research used resources of the Advanced Photon Source, a U.S. Department of Energy (DOE) Office of Science User Facility operated for the DOE Office of Science by Argonne National Laboratory under Contract No. DE-AC02-06CH11357. This project was supported by grant 9 P41 GM103622 from the National Institute of General Medical Sciences of the National Institutes of Health. Use of the Pilatus 3 1M detector was provided by grant 1S10OD018090-01 from NIGMS.
The content is solely the responsibility of the authors and does not necessarily reflect the official views of the National Institute of general Medical Sciences or the National Institutes of Health.
Molecular graphics and analyses performed with UCSF Chimera, developed by the Resource for Biocomputing, Visualization, and Informatics at the University of California, San Francisco, with support from NIH P41-GM103311
Notes
Present address: Clinical Translational Research Building, 505 S. Hancock St, University of Louisville, Louisville, KY 40202, USA.
SUPPLEMENTARY DATA
Supplementary Data are available at NAR Online.
FUNDING
National Institutes of Health (NIH) [GM077422]. Funding for open access charge: NIH [GM077422].
Conflict of interest statement. None declared.
REFERENCES
- 1. Wang Q., Liu J.Q., Chen Z., Zheng K.W., Chen C.Y., Hao Y.H., Tan Z.. G-quadruplex formation at the 3′ end of telomere DNA inhibits its extension by telomerase, polymerase and unwinding by helicase. Nucleic Acids Res. 2011; 39:6229–6237. [DOI] [PMC free article] [PubMed] [Google Scholar]
- 2. Rhodes D., Lipps H.J.. G-quadruplexes and their regulatory roles in biology. Nucleic Acids Res. 2015; 43:8627–8637. [DOI] [PMC free article] [PubMed] [Google Scholar]
- 3. Huppert J.L., Balasubramanian S.. Prevalence of quadruplexes in the human genome. Nucleic Acids Res. 2005; 33:2908–2916. [DOI] [PMC free article] [PubMed] [Google Scholar]
- 4. Huppert J.L., Balasubramanian S.. G-quadruplexes in promoters throughout the human genome. Nucleic Acids Res. 2007; 35:406–413. [DOI] [PMC free article] [PubMed] [Google Scholar]
- 5. Balasubramanian S., Hurley L.H., Neidle S.. Targeting G-quadruplexes in gene promoters: a novel anticancer strategy. Nat. Rev. Drug Discov. 2011; 10:261–275. [DOI] [PMC free article] [PubMed] [Google Scholar]
- 6. Siddiqui-Jain A., Grand C.L., Bearss D.J., Hurley L.H.. Direct evidence for a G-quadruplex in a promoter region and its targeting with a small molecule to repress c-MYC transcription. Proc. Natl. Acad. Sci. U.S.A. 2002; 99:11593–11598. [DOI] [PMC free article] [PubMed] [Google Scholar]
- 7. Cogoi S., Xodo L.E.. G-quadruplex formation within the promoter of the KRAS proto-oncogene and its effect on transcription. Nucleic Acids Res. 2006; 34:2536–2549. [DOI] [PMC free article] [PubMed] [Google Scholar]
- 8. Cogoi S., Shchekotikhin A.E., Xodo L.E.. HRAS is silenced by two neighboring G-quadruplexes and activated by MAZ, a zinc-finger transcription factor with DNA unfolding property. Nucleic Acids Res. 2014; 42:8379–8388. [DOI] [PMC free article] [PubMed] [Google Scholar]
- 9. Welsh S.J., Dale A.G., Lombardo C.M., Valentine H., de la Fuente M., Schatzlein A., Neidle S.. Inhibition of the hypoxia-inducible factor pathway by a G-quadruplex binding small molecule. Sci. Rep. 2013; 3:2799. [DOI] [PMC free article] [PubMed] [Google Scholar]
- 10. Wu Y., Zan L.P., Wang X.D., Lu Y.J., Ou T.M., Lin J., Huang Z.S., Gu L.Q.. Stabilization of VEGF G-quadruplex and inhibition of angiogenesis by quindoline derivatives. Biochim. Biophys. Acta. 2014; 1840:2970–2977. [DOI] [PubMed] [Google Scholar]
- 11. Palumbo S.L., Ebbinghaus S.W., Hurley L.H.. Formation of a unique end-to-end stacked pair of G-quadruplexes in the hTERT core promoter with implications for inhibition of telomerase by G-quadruplex-interactive ligands. J. Am. Chem. Soc. 2009; 131:10878–10891. [DOI] [PMC free article] [PubMed] [Google Scholar]
- 12. Micheli E., Martufi M., Cacchione S., De Santis P., Savino M.. Self-organization of G-quadruplex structures in the hTERT core promoter stabilized by polyaminic side chain perylene derivatives. Biophys. Chem. 2010; 153:43–53. [DOI] [PubMed] [Google Scholar]
- 13. Lim K.W., Lacroix L., Yue D.J., Lim J.K., Lim J.M., Phan A.T.. Coexistence of two distinct G-quadruplex conformations in the hTERT promoter. J. Am. Chem. Soc. 2010; 132:12331–12342. [DOI] [PubMed] [Google Scholar]
- 14. Cong Y.S., Wen J., Bacchetti S.. The human telomerase catalytic subunit hTERT: organization of the gene and characterization of the promoter. Hum. Mol. Genet. 1999; 8:137–142. [DOI] [PubMed] [Google Scholar]
- 15. Jafri M.A., Ansari S.A., Alqahtani M.H., Shay J.W.. Roles of telomeres and telomerase in cancer, and advances in telomerase-targeted therapies. Genome Med. 2016; 8:69. [DOI] [PMC free article] [PubMed] [Google Scholar]
- 16. Hanahan D., Weinberg R.A.. Hallmarks of cancer: the next generation. Cell. 2011; 144:646–674. [DOI] [PubMed] [Google Scholar]
- 17. Kim N.W., Piatyszek M.A., Prowse K.R., Harley C.B., West M.D., Ho P.L., Coviello G.M., Wright W.E., Weinrich S.L., Shay J.W.. Specific association of human telomerase activity with immortal cells and cancer. Science. 1994; 266:2011–2015. [DOI] [PubMed] [Google Scholar]
- 18. Shay J.W., Bacchetti S.. A survey of telomerase activity in human cancer. Eur. J. Cancer. 1997; 33:787–791. [DOI] [PubMed] [Google Scholar]
- 19. Hiyama E., Hiyama K.. Telomere and telomerase in stem cells. Br. J. Cancer. 2007; 96:1020–1024. [DOI] [PMC free article] [PubMed] [Google Scholar]
- 20. Cunningham A.P., Love W.K., Zhang R.W., Andrews L.G., Tollefsbol T.O.. Telomerase inhibition in cancer therapeutics: molecular-based approaches. Curr. Med. Chem. 2006; 13:2875–2888. [DOI] [PMC free article] [PubMed] [Google Scholar]
- 21. Gomez D.L., Armando R.G., Cerrudo C.S., Ghiringhelli P.D., Gomez D.E.. Telomerase as a cancer target. development of new molecules. Curr. Top. Med. Chem. 2016; 16:2432–2440. [DOI] [PMC free article] [PubMed] [Google Scholar]
- 22. Salloum R., Hummel T.R., Kumar S.S., Dorris K., Li S., Lin T., Daryani V.M., Stewart C.F., Miles L., Poussaint T.Y. et al.. A molecular biology and phase II study of imetelstat (GRN163L) in children with recurrent or refractory central nervous system malignancies: a pediatric brain tumor consortium study. J. Neurooncol. 2016; 129:443–451. [DOI] [PMC free article] [PubMed] [Google Scholar]
- 23. Takakura M., Kyo S., Kanaya T., Hirano H., Takeda J., Yutsudo M., Inoue M.. Cloning of human telomerase catalytic subunit (hTERT) gene promoter and identification of proximal core promoter sequences essential for transcriptional activation in immortalized and cancer cells. Cancer Res. 1999; 59:551–557. [PubMed] [Google Scholar]
- 24. Chaires J.B., Trent J.O., Gray R.D., Dean W.L., Buscaglia R., Thomas S.D., Miller D.M.. An improved model for the hTERT promoter quadruplex. PLoS One. 2014; 9:e115580. [DOI] [PMC free article] [PubMed] [Google Scholar]
- 25. Vinagre J., Almeida A., Populo H., Batista R., Lyra J., Pinto V., Coelho R., Celestino R., Prazeres H., Lima L. et al.. Frequency of TERT promoter mutations in human cancers. Nat. Commun. 2013; 4:2185. [DOI] [PubMed] [Google Scholar]
- 26. Borah S., Xi L., Zaug A.J., Powell N.M., Dancik G.M., Cohen S.B., Costello J.C., Theodorescu D., Cech T.R.. Cancer. TERT promoter mutations and telomerase reactivation in urothelial cancer. Science. 2015; 347:1006–1010. [DOI] [PMC free article] [PubMed] [Google Scholar]
- 27. Huang F.W., Hodis E., Xu M.J., Kryukov G.V., Chin L., Garraway L.A.. Highly recurrent TERT promoter mutations in human melanoma. Science. 2013; 339:957–959. [DOI] [PMC free article] [PubMed] [Google Scholar]
- 28. Killela P.J., Reitman Z.J., Jiao Y., Bettegowda C., Agrawal N., Diaz L.A. Jr, Friedman A.H., Friedman H., Gallia G.L., Giovanella B.C. et al.. TERT promoter mutations occur frequently in gliomas and a subset of tumors derived from cells with low rates of self-renewal. Proc. Natl. Acad. Sci. U.S.A. 2013; 110:6021–6026. [DOI] [PMC free article] [PubMed] [Google Scholar]
- 29. Bell R.J., Rube H.T., Kreig A., Mancini A., Fouse S.D., Nagarajan R.P., Choi S., Hong C., He D., Pekmezci M. et al.. Cancer. The transcription factor GABP selectively binds and activates the mutant TERT promoter in cancer. Science. 2015; 348:1036–1039. [DOI] [PMC free article] [PubMed] [Google Scholar]
- 30. Kang H.J., Cui Y., Yin H., Scheid A., Hendricks W.P.D., Schmidt J., Sekulic A., Kong D., Trent J.M., Gokhale V. et al.. A pharmacological chaperone molecule induces cancer cell death by restoring tertiary DNA structures in mutant hTERT promoters. J. Am. Chem. Soc. 2016; 138:13673–13692. [DOI] [PubMed] [Google Scholar]
- 31. Song J.H., Kang H.J., Luevano L.A., Gokhale V., Wu K., Pandey R., Sherry Chow H.H., Hurley L.H., Kraft A.S.. Small-molecule-targeting hairpin loop of hTERT promoter G-quadruplex induces cancer cell death. Cell Chem. Biol. 2019; 26:1110–1121. [DOI] [PMC free article] [PubMed] [Google Scholar]
- 32. Saltzberg D., Greenberg C.H., Viswanath S., Chemmama I., Webb B., Pellarin R., Echeverria I., Sali A.. Modeling biological complexes using integrative modeling platform. Methods Mol. Biol. 2019; 2022:353–377. [DOI] [PubMed] [Google Scholar]
- 33. Miller M.C., Le H.T., Dean W.L., Holt P.A., Chaires J.B., Trent J.O.. Polymorphism and resolution of oncogene promoter quadruplex-forming sequences. Org. Biomol. Chem. 2011; 9:7633–7637. [DOI] [PMC free article] [PubMed] [Google Scholar]
- 34. Kirby N., Cowieson N., Hawley A.M., Mudie S.T., McGillivray D.J., Kusel M., Samardzic-Boban V., Ryan T.M.. Improved radiation dose efficiency in solution SAXS using a sheath flow sample environment. Acta Crystallogr. D Struct. Biol. 2016; 72:1254–1266. [DOI] [PMC free article] [PubMed] [Google Scholar]
- 35. Hopkins J.B., Gillilan R.E., Skou S.. BioXTAS RAW: improvements to a free open-source program for small-angle X-ray scattering data reduction and analysis. J. Appl. Crystallogr. 2017; 50:1545–1553. [DOI] [PMC free article] [PubMed] [Google Scholar]
- 36. Ortega A., Amoros D., Garcia de la Torre J.. Prediction of hydrodynamic and other solution properties of rigid proteins from atomic- and residue-level models. Biophys. J. 2011; 101:892–898. [DOI] [PMC free article] [PubMed] [Google Scholar]
- 37. Le H.T., Buscaglia R., Dean W.L., Chaires J.B., Trent J.O.. Calculation of hydrodynamic properties for G-quadruplex nucleic acid structures from in silico bead models. Top. Curr. Chem. 2013; 330:179–210. [DOI] [PMC free article] [PubMed] [Google Scholar]
- 38. Harkness R.W.t., Mittermaier A.K.. G-register exchange dynamics in guanine quadruplexes. Nucleic Acids Res. 2016; 44:3481–3494. [DOI] [PMC free article] [PubMed] [Google Scholar]
- 39. Kypr J., Kejnovska I., Renciuk D., Vorlickova M.. Circular dichroism and conformational polymorphism of DNA. Nucleic Acids Res. 2009; 37:1713–1725. [DOI] [PMC free article] [PubMed] [Google Scholar]
- 40. Del Villar-Guerra R., Trent J.O., Chaires J.B.. G-Quadruplex secondary structure obtained from circular dichroism spectroscopy. Angew. Chem. Int. Ed. Engl. 2018; 57:7171–7175. [DOI] [PMC free article] [PubMed] [Google Scholar]
- 41. Holm A.I., Kohler B., Hoffmann S.V., Brondsted Nielsen S.. Synchrotron radiation circular dichroism of various G-quadruplex structures. Biopolymers. 2010; 93:429–433. [DOI] [PubMed] [Google Scholar]
- 42. Ambrus A., Chen D., Dai J., Jones R.A., Yang D.. Solution structure of the biologically relevant G-quadruplex element in the human c-MYC promoter. Implications for G-quadruplex stabilization. Biochemistry. 2005; 44:2048–2058. [DOI] [PubMed] [Google Scholar]
- 43. Masiero S., Trotta R., Pieraccini S., De Tito S., Perone R., Randazzo A., Spada G.P.. A non-empirical chromophoric interpretation of CD spectra of DNA G-quadruplex structures. Org. Biomol. Chem. 2010; 8:2683–2692. [DOI] [PubMed] [Google Scholar]
- 44. Galas D.J., Schmitz A.. DNAse footprinting: a simple method for the detection of protein-DNA binding specificity. Nucleic Acids Res. 1978; 5:3157–3170. [DOI] [PMC free article] [PubMed] [Google Scholar]
- 45. Brenowitz M., Senear D.F., Shea M.A., Ackers G.K.. Quantitative DNase footprint titration: a method for studying protein-DNA interactions. Methods Enzymol. 1986; 130:132–181. [DOI] [PubMed] [Google Scholar]
- 46. Herrera J.E., Chaires J.B.. Characterization of preferred deoxyribonuclease I cleavage sites. J. Mol. Biol. 1994; 236:405–411. [DOI] [PubMed] [Google Scholar]
- 47. Perrin F. Brownian motion of an ellipsoid. I. Dielectric dispersion for ellipsoidal molecules. J. Phys. Radium. 1934; 5:497–511. [Google Scholar]
- 48. Garcia de la Torre J, Harding S.E.. Hydrodynamic modelling of protein conformation in solution: ELLIPS and HYDRO. Biophys. Rev. 2013; 5:195–206. [DOI] [PMC free article] [PubMed] [Google Scholar]
- 49. Chaires J.B., Dean W.L., Le H.T., Trent J.O.. Hydrodynamic models of G-quadruplex structures. Methods Enzymol. 2015; 562:287–304. [DOI] [PMC free article] [PubMed] [Google Scholar]
- 50. Li J., Correia J.J., Wang L., Trent J.O., Chaires J.B.. Not so crystal clear: the structure of the human telomere G-quadruplex in solution differs from that present in a crystal. Nucleic Acids Res. 2005; 33:4649–4659. [DOI] [PMC free article] [PubMed] [Google Scholar]
- 51. Le H.T., Dean W.L., Buscaglia R., Chaires J.B., Trent J.O.. An investigation of G-quadruplex structural polymorphism in the human telomere using a combined approach of hydrodynamic bead modeling and molecular dynamics simulation. J. Phys. Chem. B. 2014; 118:5390–5405. [DOI] [PMC free article] [PubMed] [Google Scholar]
- 52. Miller M.C., Trent J.O.. Resolution of quadruplex polymorphism by size-exclusion chromatography. Curr. Protoc. Nucleic Acid Chem. 2011; Chapter 17:Unit17 13. [DOI] [PMC free article] [PubMed] [Google Scholar]
- 53. Schuck P. Size-distribution analysis of macromolecules by sedimentation velocity ultracentrifugation and lamm equation modeling. Biophys. J. 2000; 78:1606–1619. [DOI] [PMC free article] [PubMed] [Google Scholar]
- 54. Trewhella J., Duff A.P., Durand D., Gabel F., Guss J.M., Hendrickson W.A., Hura G.L., Jacques D.A., Kirby N.M., Kwan A.H. et al.. 2017 publication guidelines for structural modelling of small-angle scattering data from biomolecules in solution: an update. Acta Crystallogr. D Struct. Biol. 2017; 73:710–728. [DOI] [PMC free article] [PubMed] [Google Scholar]
- 55. Kikhney A.G., Svergun D.I.. A practical guide to small angle X-ray scattering (SAXS) of flexible and intrinsically disordered proteins. FEBS Lett. 2015; 589:2570–2577. [DOI] [PubMed] [Google Scholar]
- 56. Rambo R.P., Tainer J.A.. Characterizing flexible and intrinsically unstructured biological macromolecules by SAS using the Porod-Debye law. Biopolymers. 2011; 95:559–571. [DOI] [PMC free article] [PubMed] [Google Scholar]
- 57. Serdyuk I.N., Zaccai N. R., Zaccai G.. Methods in Molecular Biophysics: Structure, Dynamics, Function. 2007; Cambridge University Press. [Google Scholar]
- 58. Rambo R.P., Tainer J.A.. Improving small-angle X-ray scattering data for structural analyses of the RNA world. RNA. 2010; 16:638–646. [DOI] [PMC free article] [PubMed] [Google Scholar]
- 59. Franke D., Svergun D.I.. DAMMIF, a program for rapid ab-initio shape determination in small-angle scattering. J. Appl. Crystallogr. 2009; 42:342–346. [DOI] [PMC free article] [PubMed] [Google Scholar]
- 60. Bernado P., Mylonas E., Petoukhov M.V., Blackledge M., Svergun D.I.. Structural characterization of flexible proteins using small-angle X-ray scattering. J. Am. Chem. Soc. 2007; 129:5656–5664. [DOI] [PubMed] [Google Scholar]
- 61. Tria G., Mertens H.D., Kachala M., Svergun D.I.. Advanced ensemble modelling of flexible macromolecules using X-ray solution scattering. IUCrJ. 2015; 2:207–217. [DOI] [PMC free article] [PubMed] [Google Scholar]
- 62. Schneidman-Duhovny D., Kim S.J., Sali A.. Integrative structural modeling with small angle X-ray scattering profiles. BMC Struct. Biol. 2012; 12:17. [DOI] [PMC free article] [PubMed] [Google Scholar]
- 63. Adrian M., Heddi B., Phan A.T.. NMR spectroscopy of G-quadruplexes. Methods. 2012; 57:11–24. [DOI] [PubMed] [Google Scholar]
- 64. Grun J.T., Hennecker C., Klotzner D.P., Harkness R.W., Bessi I., Heckel A., Mittermaier A.K., Schwalbe H.. Conformational dynamics of strand register shifts in DNA G-Quadruplexes. J. Am. Chem. Soc. 2019; 142:264–273. [DOI] [PubMed] [Google Scholar]
- 65. Lebowitz J., Lewis M.S., Schuck P.. Modern analytical ultracentrifugation in protein science: a tutorial review. Protein Sci. 2002; 11:2067–2079. [DOI] [PMC free article] [PubMed] [Google Scholar]
- 66. Kolesnikova S., Curtis E.A.. Structure and function of multimeric G-quadruplexes. Molecules. 2019; 24:3074. [DOI] [PMC free article] [PubMed] [Google Scholar]
- 67. Do N.Q., Lim K.W., Teo M.H., Heddi B., Phan A.T.. Stacking of G-quadruplexes: NMR structure of a G-rich oligonucleotide with potential anti-HIV and anticancer activity. Nucleic Acids Res. 2011; 39:9448–9457. [DOI] [PMC free article] [PubMed] [Google Scholar]
- 68. Kato Y., Ohyama T., Mita H., Yamamoto Y.. Dynamics and thermodynamics of dimerization of parallel G-quadruplexed DNA formed from d(TTAGn) (n = 3-5). J. Am. Chem. Soc. 2005; 127:9980–9981. [DOI] [PubMed] [Google Scholar]
- 69. Meier M., Moya-Torres A., Krahn N.J., McDougall M.D., Orriss G.L., McRae E.K.S., Booy E.P., McEleney K., Patel T.R., McKenna S.A. et al.. Structure and hydrodynamics of a DNA G-quadruplex with a cytosine bulge. Nucleic Acids Res. 2018; 46:5319–5331. [DOI] [PMC free article] [PubMed] [Google Scholar]
- 70. Kogut M., Kleist C., Czub J.. Why do G-quadruplexes dimerize through the 5′-ends? Driving forces for G4 DNA dimerization examined in atomic detail. PLoS Comput. Biol. 2019; 15:e1007383. [DOI] [PMC free article] [PubMed] [Google Scholar]
Associated Data
This section collects any data citations, data availability statements, or supplementary materials included in this article.
Supplementary Materials
Data Availability Statement
Small-angle X-ray scattering data has been deposited in the publicly accessible Small Angle Scattering Biological Data Bank (https://www.sasbdb.org/) under the IDs: SASDHM3 (WT), SASDHN3 (AH), SASDHP3 (OP), SASDHQ3 (WT PQS23) and SASDHR3 (AH PQS23).