Abstract
Nicotinamide adenine dinucleotide phosphate (NADP+) is essential for producing NADPH, the primary cofactor for reductive metabolism. We find that growth factor signaling through the phosphoinositide 3-kinase (PI3K)–Akt pathway induces acute synthesis of NADP+ and NADPH. Akt phosphorylates NAD kinase (NADK), the sole cytosolic enzyme that catalyzes the synthesis of NADP+ from NAD+ (the oxidized form of NADH), on three serine residues (Ser44, Ser46, and Ser48) within an amino-terminal domain. This phosphorylation stimulates NADK activity both in cells and directly in vitro, thereby increasing NADP+ production. A rare isoform of NADK (isoform 3) lacking this regulatory region exhibits constitutively increased activity. These data indicate that Akt-mediated phosphorylation of NADK stimulates its activity to increase NADP+ production through relief of an autoinhibitory function inherent to its amino terminus.
Cellular metabolic activity is influenced by intracellular nutrients, as well as exogenous growth factors, cytokines, and hormones, and metabolic changes occur rapidly in response to these cellular growth signals. The growth factor–stimulated phosphoinositide 3-kinase (PI3K)–Akt–mechanistic target of rapamycin complex 1 (mTORC1) signaling network promotes anabolic metabolism through both direct phosphorylation of metabolic enzymes and indirectly through the regulation of downstream transcription factors (1, 2). Key anabolic processes regulated by this signaling network, such as lipid synthesis, require an abundant supply of reducing power in the form of NADPH, which is oxidized to nicotinamide adenine dinucleotide phosphate (NADP+) during reductive biosynthesis. Several dehydrogenases, including glucose-6-phosphate dehydrogenase (G6PD), are required to regenerate NADPH from NADP+, which is a limiting substrate for these enzymes (3–5).
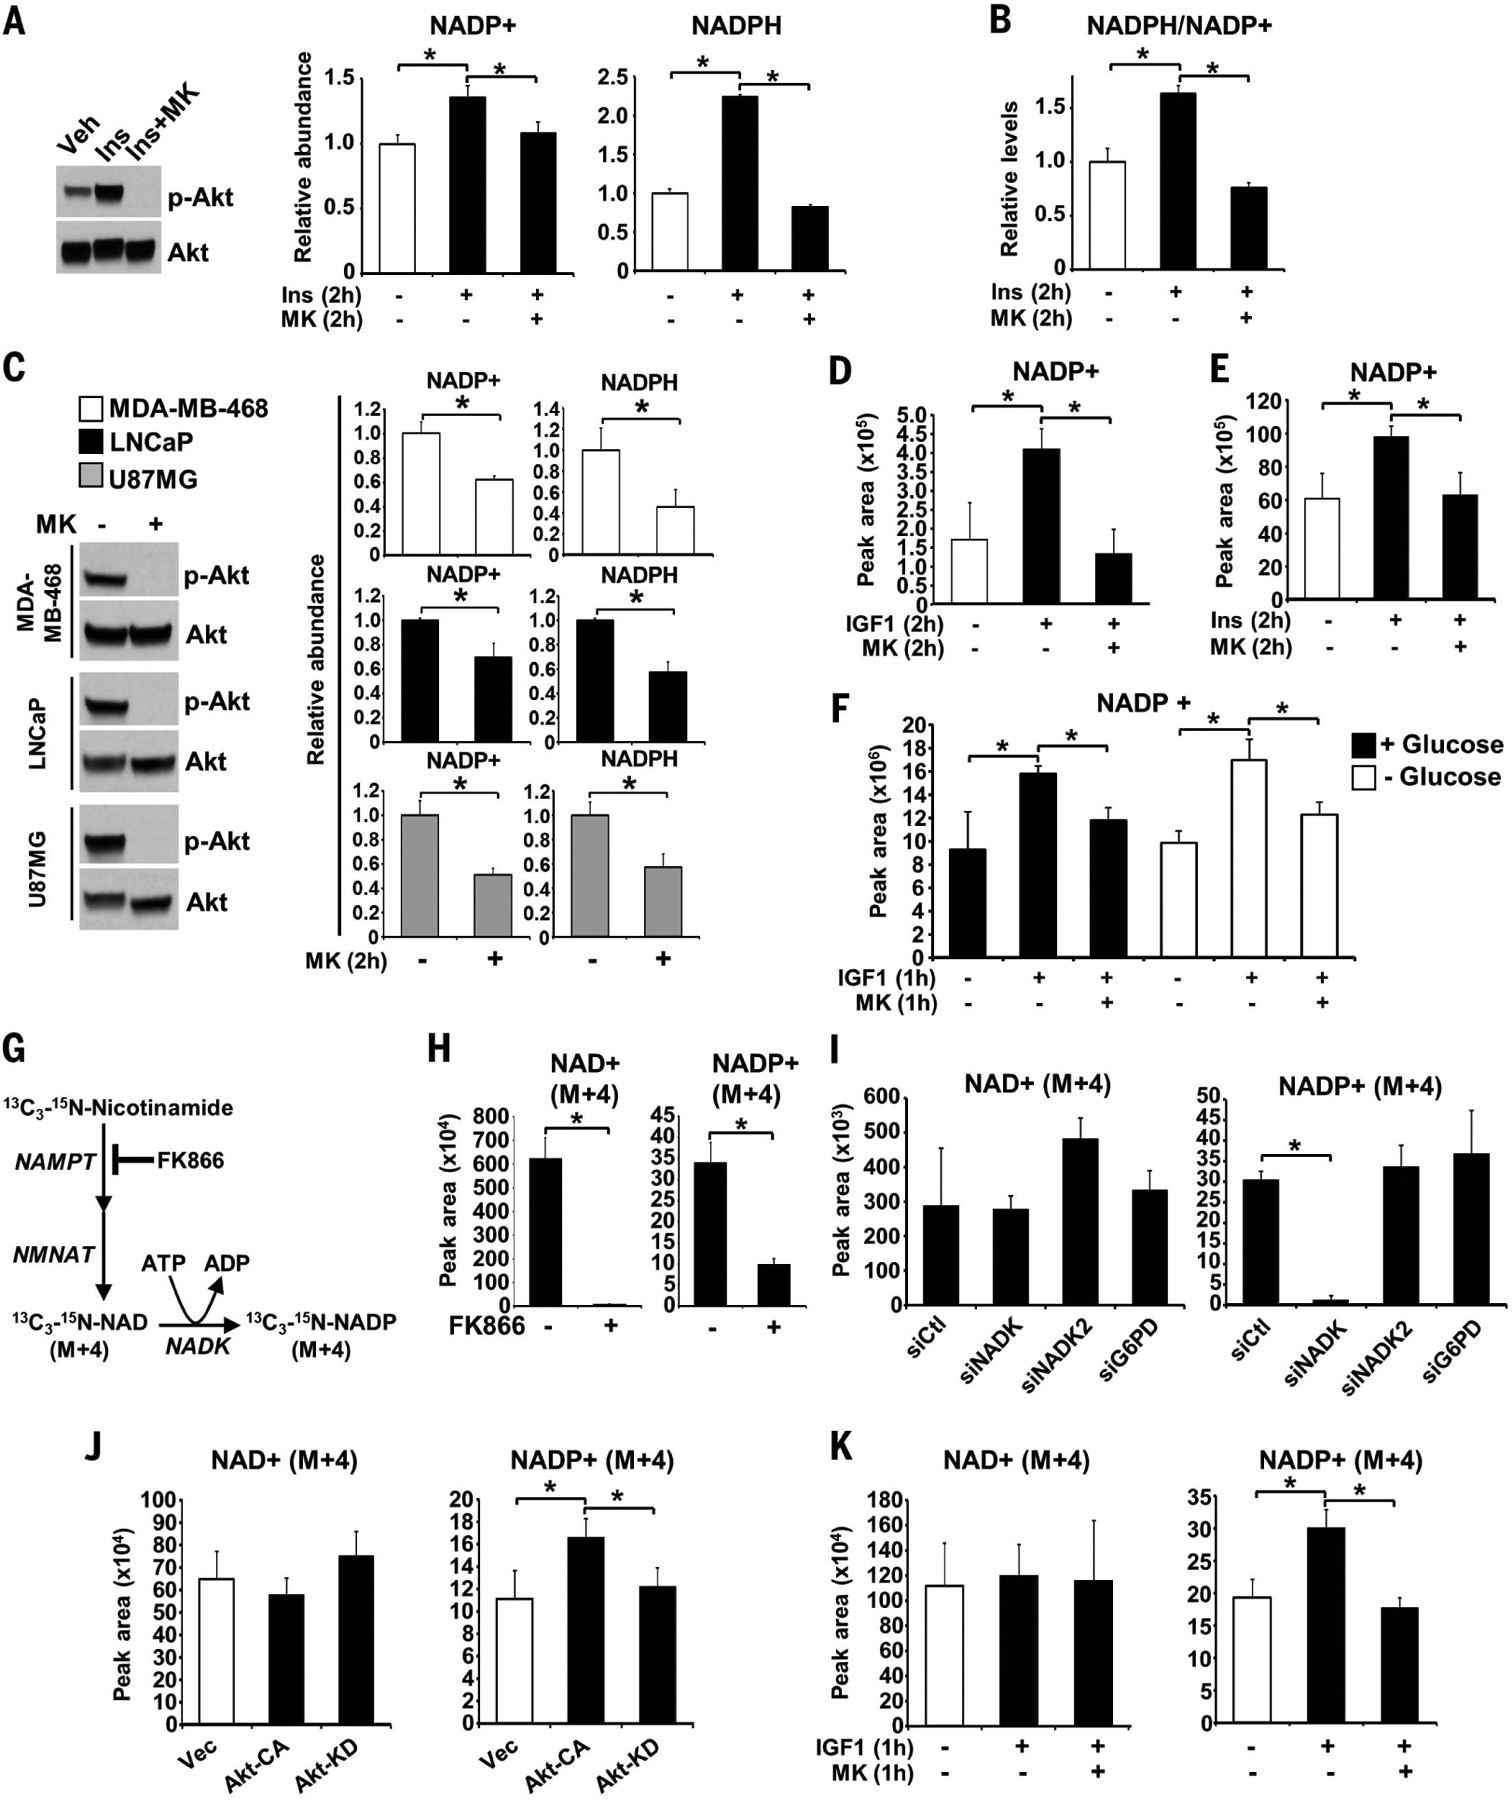
To better understand how growth factor signaling influences cellular reducing power, we measured relative changes in NADP+, NADPH, and their ratio in response to insulin stimulation of human embryonic kidney 293E (HEK293E) cells in a validated enzyme-linked assay (fig. S1A). NADP+, NADPH, and the ratio of NADPH to NADP+ all increased upon 2-hour stimulation with insulin, and these increases were entirely blocked by pretreatment of cells with MK-2206, a highly selective Akt inhibitor (6) (Fig. 1, A and B). Akt inhibition also lowered the abundance of both NADP+ and NADPH in cells grown in full serum (fig. S1B) and in three different cancer cell lines lacking the PTEN tumor suppressor, which exhibit growth factor–independent PI3K-Akt signaling (Fig. 1C). These Akt-dependent changes were reproduced using an independent enzyme-linked assay (fig. S1, C and D). These findings indicate that NADP(H) biosynthesis, in addition to cycling between the oxidized (NADP+) and reduced (NADPH) forms, might be responsive to Akt signaling.
Fig. 1. Akt activation stimulates the synthesis of NADP+.

(A and B) Immunoblots and relative abundance and ratio of NADP(H) quantified from serum-deprived HEK293E cells that were pretreated for 30 min with the Akt inhibitor MK-2206 (MK) (2 μM) before treatment with insulin (Ins) (0.5 μM, 2 hours). Veh, vehicle. (C) Immunoblots and relative abundance of NADP(H) from serum-deprived PTEN-deficient cell lines treated for 2 hours with vehicle or MK-2206 (2 μM).(D to F) Normalized peak areas of NADP+ measured by LC-MS/MS from HEK293E cells treated with IGF-1 (100 ng/ml) for 2 hours (D) or 1 hour (F) and MEFs treated with insulin (0.5 μM, 2 hours) (E) after 30-min pretreatment with MK-2206 (2 μM were treated with MK-2206. (G) Schematic of labeling. NMNAT, nicotinamide mononucleotide adenylyl transferase. (H) Normalized peak areas of labeled metabolites from HEK293E cells labeled for 1 hour with 13C3-15N-nicotinamide after treatment with the NAMPT inhibitor FK866 (0.1 μM, 16 hours). (I and J) As in (H), but in cells transfected with control (siCtl), NADK, NADK2, or G6PD siRNAs (I) or in cells transfected with empty vector (Vec), Akt-CA, or Akt-KD and serum-deprived for 16 hours (J). (K) As in (H), but in serum-deprived (16 hours) cells pretreated with MK-2206 (2 μM, 30 min) before IGF-1 stimulation (100 ng/ml, 1 hour). [(A) to (F) and (H) to (K)] Data are presented as the mean ± SD of biological quadruplicates and are representative of at least two independent experiments. *P < 0.05 for pairwise comparisons calculated using a two-tailed Student’s t test.
We next measured the steady-state abundance of NAD+ (the oxidized form of NADH) and NADP+ using liquid-chromatography tandem mass spectrometry (LC-MS/MS). Stimulation with insulin-like growth factor 1 (IGF-1) or insulin led to an Akt-dependent increase in NADP+ in both HEK293E cells and mouse embryonic fibroblasts (MEFs), with smaller variable changes in NAD+ (Fig. 1, D and E, and fig. S1, E and F). Akt inhibition similarly decreased NADP+, but not NAD+, in U87MG cells (fig. S1G). The IGF-1–stimulated increase in NADP+ was resistant to the mTORC1 inhibitor rapamycin (fig. S1H). To determine the global effects of acute insulin stimulation (1 hour) on intracellular metabolite abundance, HeLa cells were analyzed by metabolomics (fig. S2A). Insulin increased NADP+ in these cells, whereas NAD+ and most other metabolites showed little to no steady-state changes. Insulin-stimulated cells also had increased 6-phosphogluconate, the product of the NADP+-utilizing enzyme G6PD. Among the other metabolites induced by 1-hour insulin stimulation in HeLa cells were glycolytic intermediates, consistent with the role of Akt in control of glucose uptake and glycolysis (2), and pyrimidine synthesis intermediates, consistent with the direct induction of this pathway downstream of mTORC1 (7, 8). Changes in glucose metabolism did not affect the induced production of NADP+ in HEK293E cells because IGF-1 stimulated a similar Akt-dependent increase in NADP+ both in the presence and absence of exogenous glucose (Fig. 1F and fig. S2, B and C).
To determine whether the effects of Akt signaling on the steady-state pool of NADP+ reflected changes in de novo NADP+ synthesis, stable isotope tracing with 13C3-15N-nicotinamide was employed with a 1-hour pulse label (Fig. 1G and fig. S3A). Reflecting substantial differences in both the sizes of steady-state pools and rates of flux (9), measurements of fractional abundance revealed that over 75% of cellular nicotinamide was labeled after the 1-hour pulse, whereas only ~10% and ~3% of the NAD+ and NADP+ pools, respectively, were labeled (fig. S3B). Inhibition of the NAD+ salvage enzyme nicotinamide phosphoribosyltransferase (NAMPT) with the selective inhibitor FK866 decreased the appearance and fractional enrichment of the M+4 derivatives of NAD+ and NADP+, serving as pathway validation (Fig. 1H and fig. S3B). Small interfering RNA (siRNA)–mediated depletion of cytosolic NADK, but not the mitochondrial NADK2 or the NADPH-producing G6PD, greatly decreased the synthesis and fractional enrichment of NADP+ but not NAD+ (Fig. 1I and fig. S3, C and D). Reciprocally, exogenous over-expression of NADK increased NADP+ labeling (fig. S3E), further indicating the specificity of this isotopic tracing method for NADK activity. Expression of constitutively active Akt (Akt-CA), but not catalytically inactive Akt (Akt-KD), increased NADP+ synthesis without effects on NAD+ labeling (Fig. 1J), and similar results were observed in mammary epithelial MCF10A cells stably expressing an active oncogenic mutant of Akt2 [Glu17→Lys (E17K)] compared with cells expressing wild-type Akt2 (fig. S3F). IGF-1, administered with the 1-hour labeling, also stimulated an increase in the synthesis of NADP+, but not NAD+, which was blocked in cells treated with MK-2206 (Fig. 1K and fig. S3G). These findings indicate that Akt induces the synthesis of NADP+ from a substantially larger pool of NAD+ (9), a reaction catalyzed by NADK.
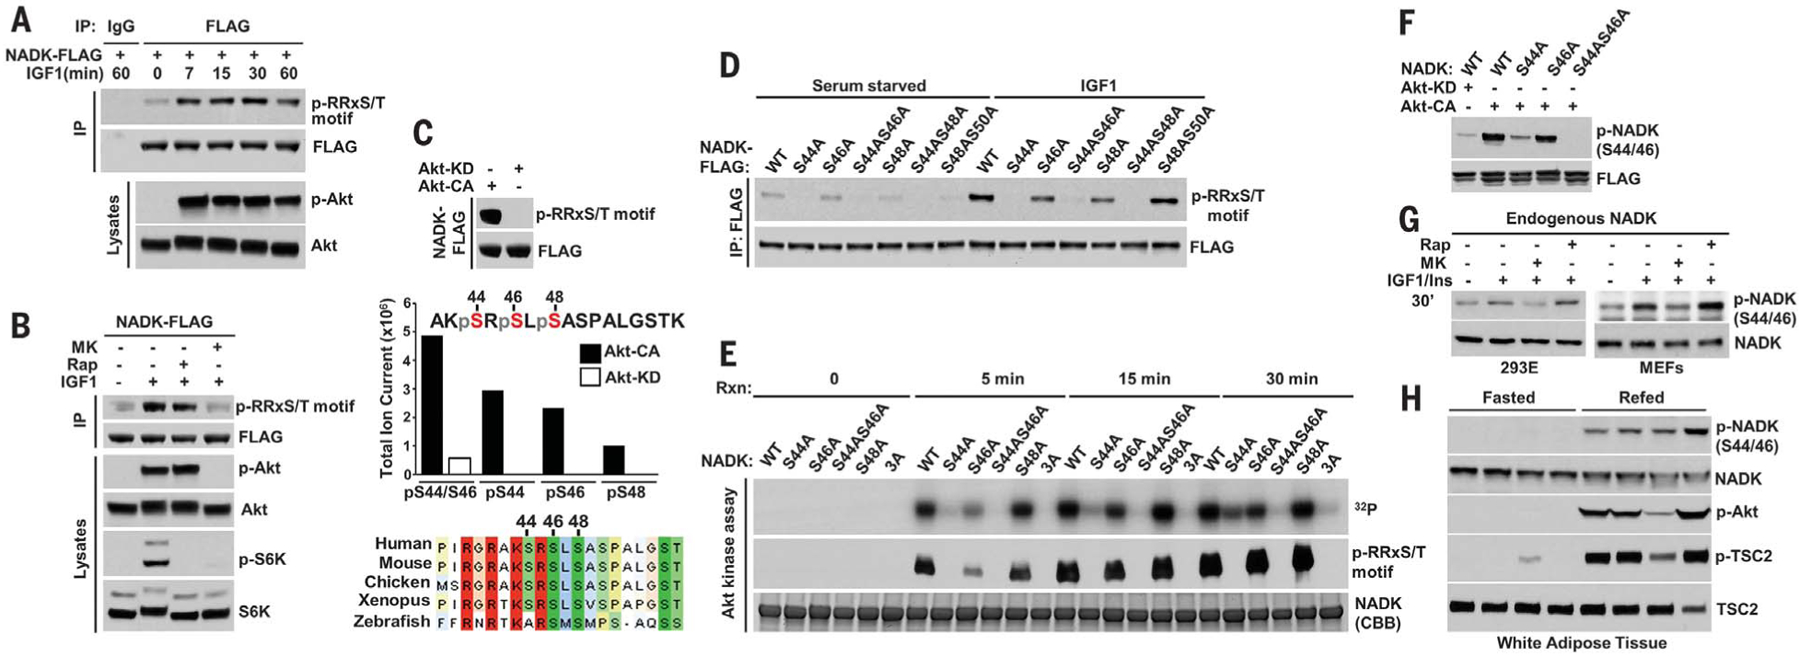
Although NADK abundance can affect intracellular concentration of NADP(H) (10), Akt signaling affected neither NADK transcript nor protein abundance (fig. S4, A and B). However, a phospho-motif antibody was found to specifically recognize NADK from IGF-1–stimulated cells (Fig. 2A), and this phosphorylation was sensitive to MK-2206 but not to rapamycin (Fig. 2B). Small-molecule inhibitors of signaling components upstream of Akt also inhibited IGF-1–stimulated phosphorylation of NADK (fig. S4C). Expression of Akt-CA, but not Akt-KD, resulted in increased, growth factor–independent phosphorylation of NADK (Fig. 2C). LC-MS/MS analysis of phosphopeptides from NADK immunopurified from these cells revealed that NADK peptides either singly phosphorylated at S44, S46, or S48 or doubly phosphorylated at S44 and S46 were enriched in cells expressing Akt-CA (Fig. 2C). This cluster of phospho-sites is conserved among vertebrate NADK orthologs and contains three overlapping consensus motifs for Akt and related kinases (Fig. 2C) (2). Recognition of NADK with the phospho-motif antibody was lost in cells expressing an NADK-S44A mutation, and small decreases were observed with S46A and S48A mutants (Fig. 2D). In vitro kinase assays on recombinant, purified NADK variants over a reaction time course demonstrated that S44 and S46 are the primary sites directly phosphorylated by Akt (Fig. 2E and fig. S4, D and E). A phospho-NADK antibody specific to phosphorylated S44 and S46 (Fig. 2F) confirmed that IGF-1, insulin, and lipopolysaccharide stimulated an Akt-dependent phosphorylation of these sites on endogenous NADK in HEK293E cells, MEFs, and primary bone-marrow-derived macrophages, respectively (Fig. 2G and fig. S4F). A previous study reported that Ca2+/calmodulin kinase II can phosphorylate the N-terminal region of NADK in vitro (11), but such regulation does not appear to influence the Akt sites identified here, as S44-S46 phosphorylation is unaffected by treatment with a calcium ionophore (fig. S4G). Finally, NADK phosphorylation coincided with the feeding-induced activation of Akt signaling in the white adipose tissue of mice (Fig. 2H).
Fig. 2. NADK is a direct substrate of Akt.

(A) HEK293E cells transfected with NADK-FLAG were serum-deprived (16 hours) then stimlated with IGF-1 (100 ng/ml). Immunoprecipitates (IP) were immunoblotted. IgG, immunoglobulin G. (B) As in (A), but cells were pretreated for 30 min with vehicle, Akt inhibitor MK-2206 (2 μM), or rapamycin (Rap) (20 nM) and then stimulated with IGF-1 (100 ng/ml, 30 min). (C) NADK-FLAG was cotransfected with Akt-CA or Akt-KD and cells were serum-deprived (16 hours). FLAG immunoprecipitates were immunoblotted and the indicated phosphopeptides on human NADK were identified by LC-MS/MS. Single-letter abbreviations for the amino acid residues are as follows: A, Ala; F, Phe; G, Gly; I, Ile; K, Lys; L, Leu; M, Met; N, Asn; P, Pro; Q, Gln; R, Arg; S, Ser; T, Thr; V, Val; and Y, Tyr. (D) Cells were transfected with NADK variants and treated as in (A), with IGF-1 (30 min). (E) Kinase assays with active Akt and recombinant NADK variants were done over the indicated reaction times (Rxn) and subjected to autoradiography and immunoblot. CBB, Coomassie brilliant blue staining. (F) As in (C), but FLAG immunoprecipates were immunoblotted with a phospho-NADK-S44/46 antibody. (G) HEK293E and MEF cells were deprived of serum (16 hours), pretreated 30 min with MK-2206 (2 μM) or rapamycin (20 nM), then stimulated with IGF-1 (100 ng/ml, HEK293E) or insulin (100 nM, MEF). (H) White adipose tissue extracts from mice that were fasted (12 hours) or fasted then refed (12 hours) were immunoblotted.
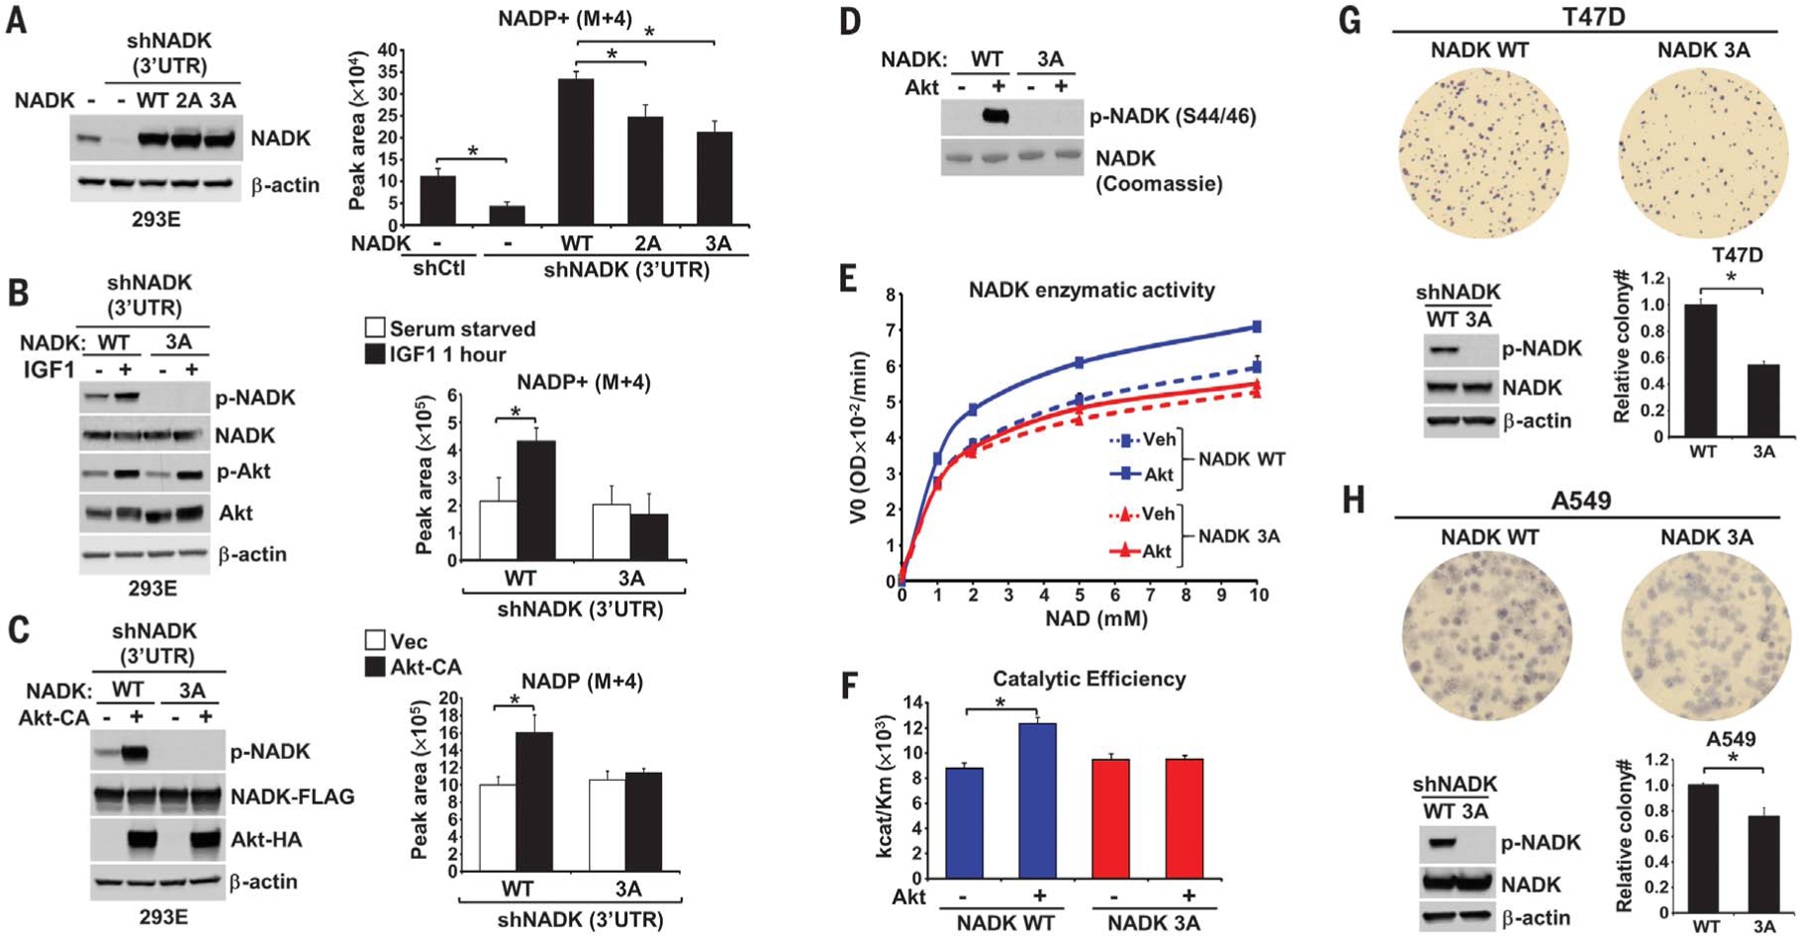
To determine the functional significance of Akt-mediated phosphorylation of NADK, endogenous NADK was depleted in HEK293E and U87MG cells, leading to decreased intracellular NADP+ (fig. S5, A and B), followed by stable reconstitution with cDNAs encoding wild-type and phospho-mutants of NADK [S44AS46A (2A) or S44A-S46A-S48A (3A)]. The exogenous proteins were expressed at similar levels but had elevated abundance compared with endogenous NADK (Fig. 3A and fig. S5B). 13C3-15N-nicotinamide tracing demonstrated that the phospho-mutants had diminished ability to synthesize NADP+ compared with that of the wild-type enzyme in both HEK293E cells in full serum (Fig. 3A) and U87MG cells without serum (fig. S5B). IGF-1 stimulated new NADP+ synthesis in cells expressing wild-type NADK but failed to do so in cells expressing the Akt phosphorylation-site mutant of NADK, despite normal activation of Akt (Fig. 3B). Similarly, expression of Akt-CA increased the synthesis of new NADP+ in cells expressing wild-type but not phospho-mutant NADK (Fig. 3C). To determine whether Akt-mediated phosphorylation directly affects NADK function, we assayed its enzymatic activity in vitro over a range of NAD+ concentrations (Fig. 3, D to F, and fig. S5C). Wild-type NADK and the 3A mutant exhibited similar enzymatic activity, which is consistent with the data in Fig. 3, B and C, from unstimulated cells, demonstrating that the phospho-mutant is not impaired in its basal activity. Direct in vitro phosphorylation by Akt increased the catalytic activity (Vmax) of wild-type NADK but had no effect on the activity of the phospho-mutant of NADK. NADK phosphorylation did not affect its affinity (Km, the Michaelis constant) for NAD+ (fig. S5D) but increased its catalytic efficiency (kcat/Km, where kcat is the rate of catalysis) (Fig. 3F). Nearly identical results were obtained with recombinant NADK purified from Escherichia coli (fig. S5E). These data demonstrate that the rapid growth factor–induced synthesis of NADP+ results from direct stimulatory effects on NADK enzymatic activity through Akt-mediated phosphorylation of these conserved residues within its N-terminal region.
Fig. 3. Akt-mediated phosphorylation of NADK stimulates NADP+ synthesis.

(A) HEK293E cells with stable shRNA-mediated knockdown of NADK were stably transfected with vector (−), NADK (WT), or NADK-S44/46A (2A) or -S44/46/48A (3A). Normalized peak areas of labeled (M+4) NADP+ from cells labeled 30 min with 13C3-15N-nicotinamide are graphed. 3′UTR, 3′ untranslated region. (B) As in (A), but cells were deprived of serum overnight and stimulated with IGF-1 (100 ng/ml, 1 hour), with labeling for the final 30 min. (C) As in (A), but cells were cotransfected with NADK-WT or −3A and either empty vector (−) or Akt-CA and serum-deprived overnight. [(A) to (C)] Data are presented as the mean ± SD of biological quadruplicates and are representative of at least two independent experiments. (D to F) NADK-WT or −3A immunopurified from HEK293E cells were phosphorylated with purified active Akt in vitro and subjected to immunoblot and Coomassie staining (D) and an NADK activity assay [(E) and (F)]. Data are presented as the mean ± SD of biological duplicates and are representative of three independent experiments. V0, reaction velocity; OD, optical density. (G and H) Soft agar colony formation assay from T47D (G) and A549 (H) cells with stable shRNA-mediated knockdown of NADK and stably reconstituted with NADK-WT or −3A. T47D images were magnified three times. Relative colony counts are presented as the mean ± SD of biological triplicates and are representative of two independent experiments. *P < 0.05 for pairwise comparisons calculated using a two-tailed Student’s t test.
The importance of NADK phosphorylation on the cellular property of colony formation in soft agar was assayed in two distinct cancer cell lines: an oncogenic PI3K-driven breast cancer line (T47D) and an oncogenic K-Ras–driven lung cancer line (A549), both of which exhibit constitutive phosphorylation of these regulatory sites on NADK (Fig. 3, G and H). Stable short hairpin RNA (shRNA)–mediated depletion of NADK strongly decreased colony formation in these cell lines (fig. S5F). The NADK-depleted cells were stably reconstituted with wild-type NADK or the NADK-3A mutant, which displayed identical protein abundance (Fig. 3, G and H). Although both the wild type and 3A mutant of NADK restored colony-forming capabilities, the cells expressing the 3A mutant exhibited a 46% (T47D) and 25% (A549) decrease in colony number relative to wild-type NADK-expressing cells. This finding is consistent with the fact that blocking NADK phosphorylation does not influence its basal enzymatic activity but rather inhibits its ability to be further stimulated by growth signaling.
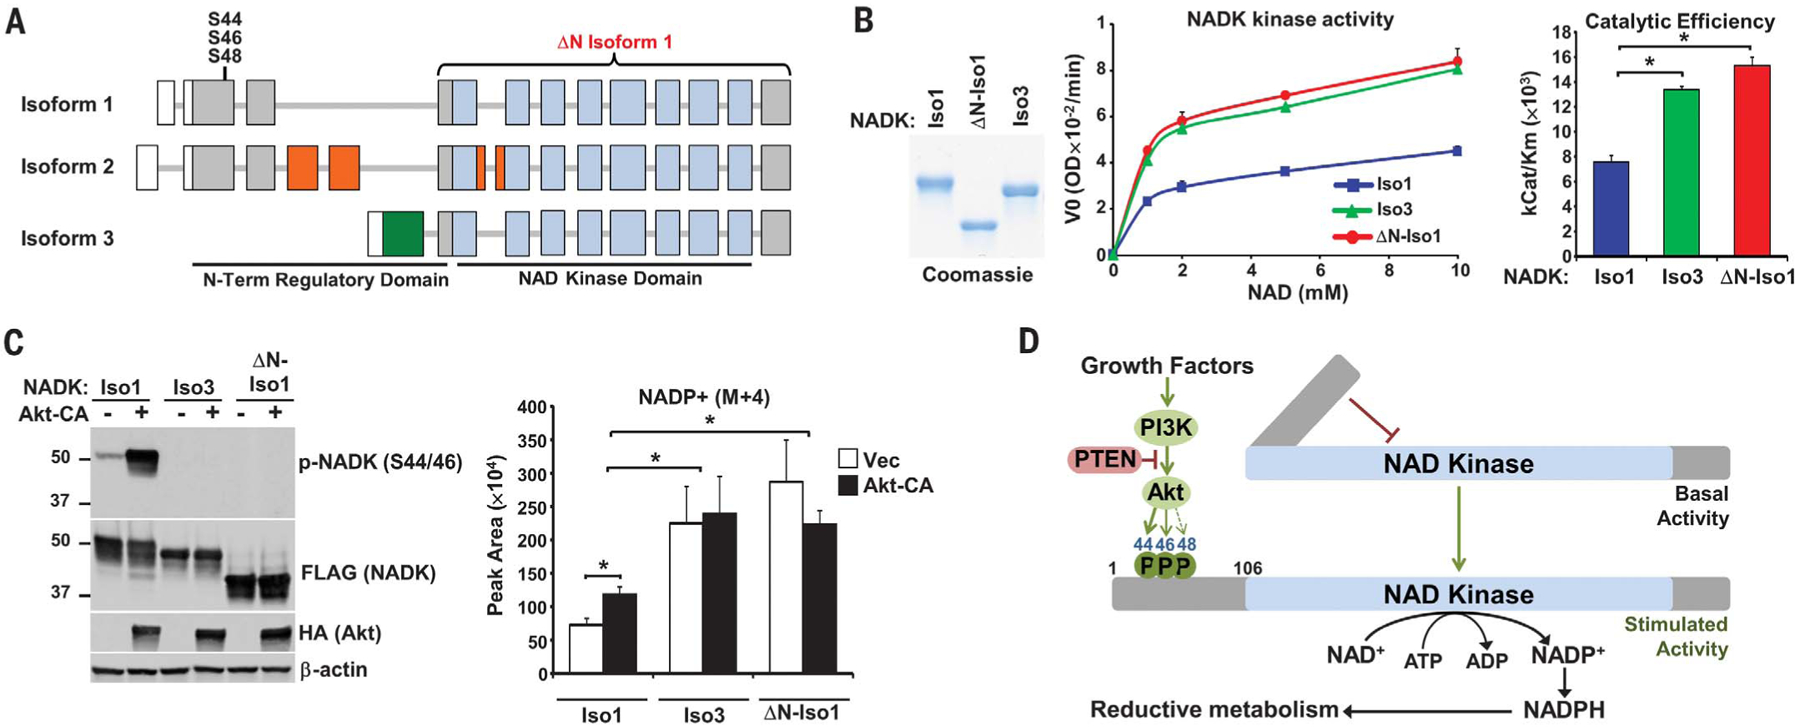
Databases of mRNA transcripts enable us to predict the existence of a rare variant of NADK (isoform 3) that is generated through alternative transcriptional start and encodes NADK lacking the N-terminal region shared by the two major isoforms (isoforms 1 and 2), which contains the Akt phosphorylation sites (Fig. 4A and fig. S6). Analyses of the RNA sequencing data in the Genotype-Tissue Expression (GTEx) database found isoform 3–specific sequences expressed at low abundance relative to those of isoform 1, with a close correlation in expression patterns between these two isoforms across tissues (fig. S7). A comparison of the enzymatic activity of isoform 1, isoform 3, and a mutant of isoform 1 lacking its N-terminal regulatory domain (ΔN isoform 1) found that both isoform 3 and ΔN isoform 1 exhibit greatly increased enzymatic activity, without effects on the Km (Fig. 4B and fig. S8A). Likewise, expression of isoform 3 and ΔN isoform 1 in cells depleted of endogenous NADK led to increased basal synthesis of NADP+, with a concomitant decrease in labeled NAD+ (Fig. 4C and fig. S8, B and C). In contrast to cells expressing isoform 1, those expressing NADK derivatives lacking the N-terminal regulatory domain showed no increase in NADP+ synthesis in response to activated Akt (Fig. 4C). Enhanced NADP+ synthesis from reconstituted ΔN isoform 1 was also observed in HEK293E cells with CRISPR-Cas9 knockout of NADK and U87MG cells depleted of NADK (fig. S8, D and E).
Fig. 4. The N-terminal domain of NADK attenuates its catalytic activity.

(A) Schematic of NADK isoform exons, with untranslated regions (white), kinase domain (blue), and regions unique to isoforms 2 (orange) and 3 (green) depicted. (B) NADK isoforms immunopurified from serum-deprived HEK293E cells were subjected to Coomassie staining and an NADK activity assay. Data are presented as the mean ± SD of biological duplicates and are representative of three independent experiments. *P < 0.05. (C) HEK293E cells with stable shRNA-mediated knockdown of NADK were co-transfected with NADK isoforms and either empty vector (−) or Akt-CA, serum-deprived overnight, and labeled for 30 min with 13C3-15N-nicotinamide. Normalized peak areas are presented as the mean ± SD of biological quadruplicates and are representative of two independent experiments. *P < 0.05. (D) Model of NADK activation by Akt signaling.
These findings demonstrate that the N-terminal domain of NADK serves to dampen NADK activity, an inhibitory effect that is relieved by Akt-mediated phosphorylation of the conserved motifs in this region (Fig. 4D). This regulation links growth factor signaling to an acute increase in the production of cellular NADP+, which is the rate-limiting substrate for NADPH production (4, 5). Given the regulatory role of the N-terminal region of NADK demonstrated here, it seems likely that other signaling events will also impinge on this domain to control the NADP(H) pool available for cellular reducing power (11).
Supplementary Material
ACKNOWLEDGMENTS
We thank C. C. Dibble for materials, M. Yuan for technical assistance, and J. Hirschfeld and T. Wiederhold of Cell Signaling Technologies for phospho-NADK antibody development.
Funding: This research was supported by NIH grants R00-CA194192 (I.B.-S.), P01-CA120964 (B.D.M. and J.M.A.), and R35-CA197459 (B.D.M.).
Footnotes
Competing interests: B.D.M. is a shareholder and scientific advisory board member for Navitor Pharmaceuticals and LAM Therapeutics. All other authors declare no competing interests.
Data and materials availability: All data are available in the manuscript or supplementary materials. Figure S7 data were curated from GTEx (https://gtexportal.org/home/).
REFERENCES AND NOTES
- 1.Ben-Sahra I, Manning BD, Curr. Opin. Cell Biol 45, 72–82 (2017). [DOI] [PMC free article] [PubMed] [Google Scholar]
- 2.Manning BD, Toker A, Cell 169, 381–405 (2017). [DOI] [PMC free article] [PubMed] [Google Scholar]
- 3.Agledal L, Niere M, Ziegler M, Redox Rep. 15, 2–10 (2010). [DOI] [PMC free article] [PubMed] [Google Scholar]
- 4.Stanton RC, IUBMB Life 64, 362–369 (2012). [DOI] [PMC free article] [PubMed] [Google Scholar]
- 5.DeBerardinis RJ, Chandel NS, Sci. Adv 2, e1600200 (2016). [DOI] [PMC free article] [PubMed] [Google Scholar]
- 6.Hirai H et al. , Mol. Cancer Ther 9, 1956–1967 (2010). [DOI] [PubMed] [Google Scholar]
- 7.Ben-Sahra I, Howell JJ, Asara JM, Manning BD, Science 339, 1323–1328 (2013). [DOI] [PMC free article] [PubMed] [Google Scholar]
- 8.Robitaille AM et al. , Science 339, 1320–1323 (2013). [DOI] [PubMed] [Google Scholar]
- 9.Liu L et al. , Cell Metab. 27, 1067–1080.e5 (2018). [DOI] [PMC free article] [PubMed] [Google Scholar]
- 10.Pollak N, Niere M, Ziegler M, J. Biol. Chem 282, 33562–33571 (2007). [DOI] [PubMed] [Google Scholar]
- 11.Love NR et al. , Proc. Natl. Acad. Sci. U.S.A 112, 1386–1391 (2015). [DOI] [PMC free article] [PubMed] [Google Scholar]
Associated Data
This section collects any data citations, data availability statements, or supplementary materials included in this article.


