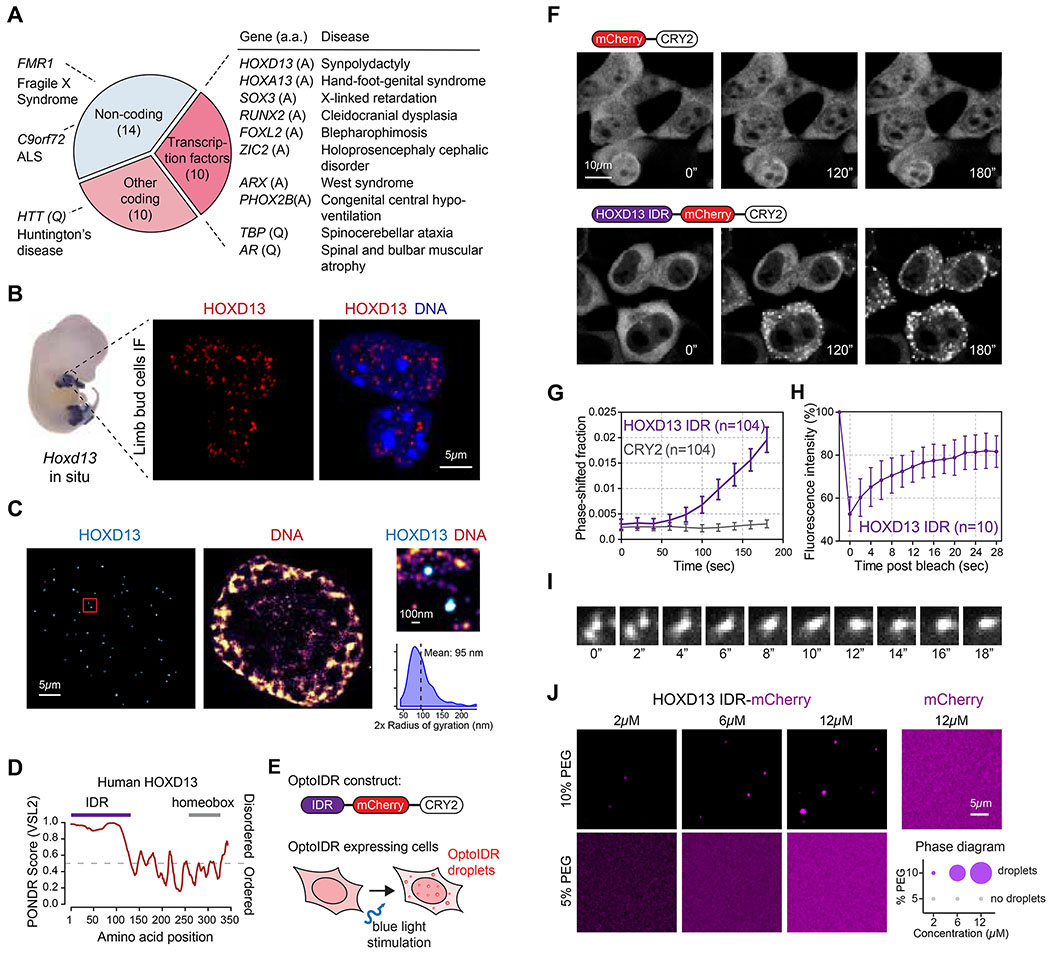
Figure 1. The HOXD13 IDR drives phase separation.
(A) Disease-associated repeat expansions in humans. (a.a: amino acid)
(B) (left) Hoxd13 whole mount in situ hybridization in an E12.5 mouse embryo. (right) HOXD13 Immunofluorescence (IF) in E12.5 mouse limb bud cells.
(C) Stochastic optical reconstruction microscopy (STORM) images of E12.5 mouse limb bud cells. The zoomed-in area on the right is highlighted with a red box on the left.
(D) Graph plotting intrinsic disorder for human HOXD13. The IDR cloned for subsequent experiments is highlighted with a purple bar.
(E) Scheme of the optoDroplet assay. The optoIDR construct consists of the HOXD13 IDR fused to mCherry and the A. thaliana CRY2 PHR domain.
(F) Representative images of live HEK-293T cells expressing mCherry-CRY2 (top) and HOXD13 IDR-mCherry-CRY2 (bottom) fusion proteins. Cells were stimulated with 488nm laser every 20s for 3 minutes.
(G) Quantification of the fraction of the cytoplasmic area occupied by HOXD13 IDR-mCherry-CRY2 and mCherry-CRY2 droplets in HEK-293T cells over time. Data displayed as mean+/− SEM.
(H) Fluorescence intensity of HOXD13 IDR-mCherry-CRY2 droplets before, during and after photobleaching. Data displayed as mean+/−SD.
(I) Time lapse images of a droplet fusion event in HEK-293T cells expressing HOXD13 IDR-mCherry-CRY2 fusion protein.
(J) (left) Representative images of droplet formation by purified HOXD13-mCherry and mCherry at the indicated concentrations. (right) Phase diagram of HOXD13-mCherry in the presence of different concentrations of PEG-8000. The size of the circles is proportional to the size of droplets detected in the respective buffer conditions.
See also Figure S1.

