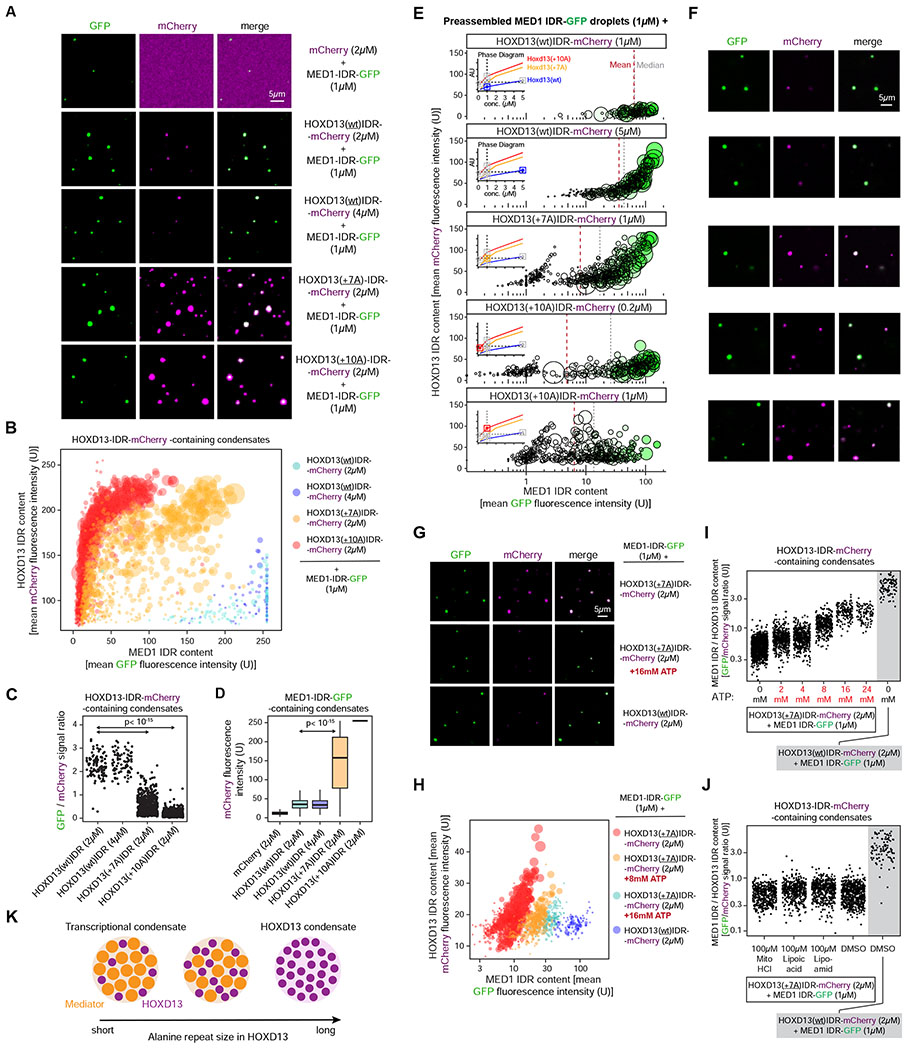
Figure 3. Synpolydactyly-associated repeat expansions alter the composition of Hoxd13-containing condensates in vitro.
(A) Representative images of droplet formation by purified MED1-IDR-GFP and HOXD13 IDR-mCherry fusion proteins in droplet formation buffer.
(B) Quantification of GFP and mCherry fluorescence intensity in HOXD13 IDR-mCherry containing droplets in the indicated MED1 IDR-GFP mixing experiments. Each dot represents one droplet, and the size of the dot is proportional to the size of the droplet.
(C) Quantification of the ratio of GFP and mCherry fluorescence intensity in HOXD13 IDR-mCherry containing droplets in the indicated MED1 IDR-GFP mixing experiments. P value is from a Welch’s t-test.
(D) Quantification of mCherry fluorescence intensity in MED1 IDR-GFP containing droplets in the indicated MED1 IDR-GFP mixing experiments. P value is from a Welch’s t-test.
(E) Quantification of GFP and mCherry fluorescence intensity in HOXD13 IDR-mCherry containing droplets. Each dot represents one droplet. The size of the dot is proportional to the size of the droplet, and the color of the dot is scaled to the MED1 signal in the droplet. The insets show a simplified phase diagram of HOXD13 IDRs based on the data displayed in Figure 2H. x-axis is in log10 scale.
(F) Representative images of the mixtures in (E).
(G) Representative images of droplets formed by purified MED1-IDR-GFP and HOXD13 IDR-mCherry fusion proteins.
(H) Quantification of GFP and mCherry fluorescence intensity in HOXD13 IDR-mCherry containing droplets in the indicated MED1 IDR-GFP mixing experiments. Each dot represents one droplet, and the size of the dot is proportional to the size of the droplet. x-axis is in log10 scale.
(I-J) Quantification of the ratio of GFP and mCherry fluorescence in HOXD13 IDR-mCherry containing droplets in the indicated mixing experiments. In (I), the y-axis is in log10 scale.
(K) Condensate unblending model of the impact of HOXD13 alanine repeat expansions.

