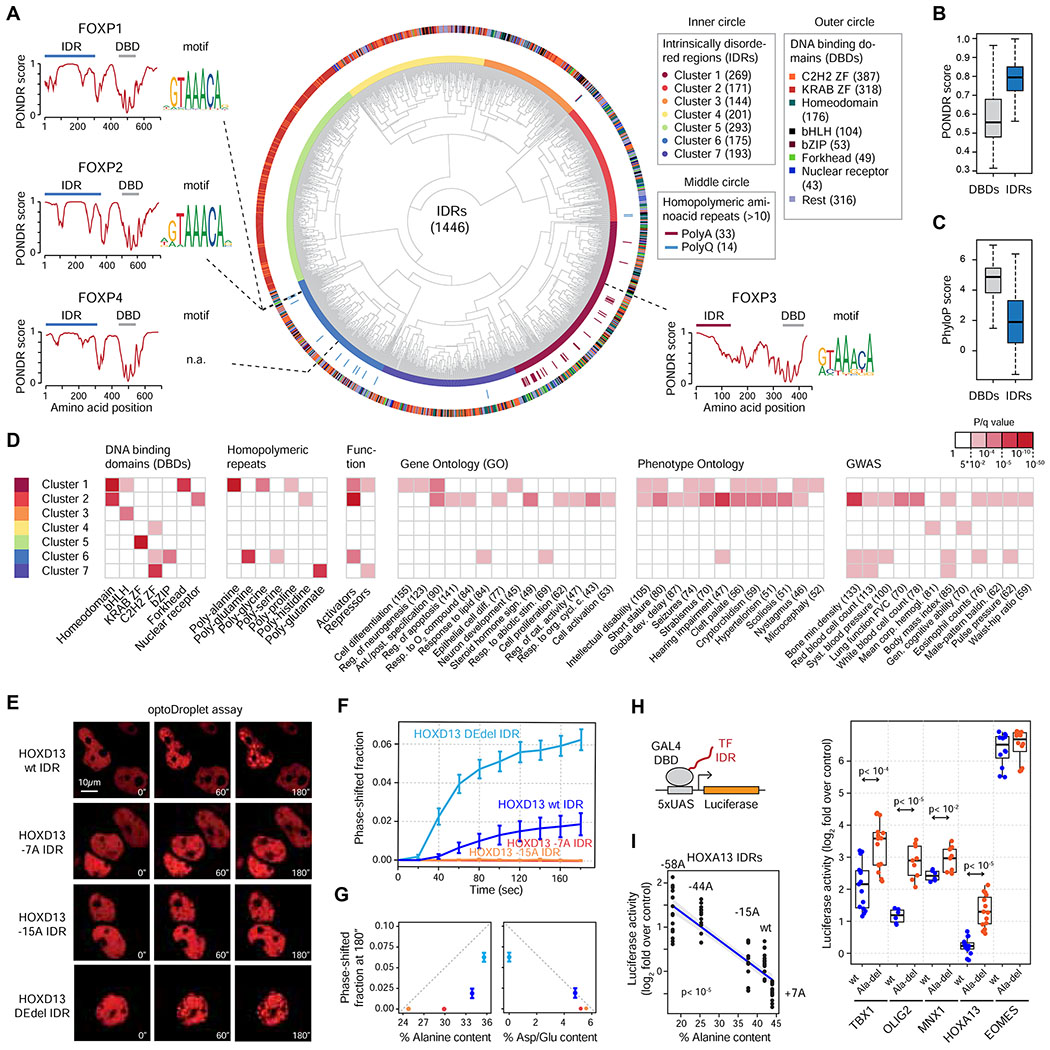
Figure 7. A catalog of human transcription factor IDRs.
(A) Classification of human TF IDRs. The inner circle depicts the clusters of TF IDRs. The outer circle includes the annotation of the DBDs of the TFs whose IDRs were classified in the inner circle.
(B) Boxplot of PONDR scores (disorder) of human TF DBDs and IDRs.
(C) Boxplot of phyloP scores (conservation) of human TF DBDs and IDRs
(D) Enrichment of TFs whose IDRs belong to the seven IDR clusters for the indicated sequence features, functional and phenotypic categories. Red box highlights significant enrichment (q<0.05).
(E) Representative images of HEK-293T cells expressing the indicated HOXD13 IDR-mCherry-CRY2 fusion proteins. Cells were stimulated with 488nm laser every 20s for 3 minutes.
(F) Quantification of the fraction of the nuclear area occupied by HOXD13 IDR-mCherry-CRY2 droplets in HEK-293T cells over time. Data displayed as mean+/−SEM.
(G) Plot of the nuclear area occupied by HOXD13 IDR-mCherry-CRY2 droplets versus the Alanine content and Asp/Glu content of the IDR constructs. Data displayed as mean+/−SEM.
(H) (left): GAL4 activation assay schematic. The luciferase reporter plasmid, and the expression vector for the GAL4 DBD-TF IDR fusion proteins were transfected into HEK-293T cells. (right): Luciferase reporter activity of the indicated TF IDRs fused to GAL4-DBD. P values are from a Welch’s t-test.
(I) Normalized luciferase activity of the indicated HOXA13 IDRs fused to GAL4 DBD. The blue line is a linear regression line, and the grey zones denote the 95% conference interval. P value is from a t-test.
See also Figure S7.

