

Abstract
2-Phenylethanol (2-PE) with a pleasant rose-like odor is a valuable aroma compound used in many fields. 2-PE production by yeast is considered a promising alternative to chemical synthesis and extraction from natural materials. In this report, the strain YF1702 produced a significantly higher level of 2-PE when compared with other strains isolated from Baijiu-producing environments. According to morphological properties, physiological and biochemical characteristics, and 26S rDNA sequence analysis, strain YF1702 was identified as Pichia kudriavzevii. The optimal fermentation conditions of YF1702 for producing 2-PE were obtained by single-factor experiments, Plackett–Burman design, steepest ascent design, and response surface methodology. The optimal inoculation conditions for strain YF1702 were 50 g/L glucose, 6.0 g/L yeast extract, 10.7 g/L L-Phe, and 32 g/L Tween-60. The optimal fermentation conditions were pH 2.3, 26 °C, 210 rpm shaking, an inoculum size of 0.4% (v/v), and a loading volume of 25.5 mL/250 mL for 56 h. Under these optimal conditions 2-PE production by YF1702 was 5.09 g/L. This strain has the potential to increase the content of 2-PE in Baijiu production and enhance the aroma characteristics of Baijiu.
Keywords: 2-Phenylethanol, Baijiu, L-Phenylalanine, Optimization, Pichia kudriavzevii
Introduction
2-Phenylethanol (2-PE) is a valuable aroma compound found in fragrances, preservatives, perfumes, cosmetics and detergents, and is used in the pharmaceutical and food industries (e.g., soft drinks, candy, ice cream, pudding, chewing gum, cookies) because of its pleasant rose-like odor (Martinez-Avila et al. 2019; Okuniewska et al. 2017). Because of its pleasant flavor, 2-PE has huge market demand with global use greater than 10,000 tons per annum and revenue from 2-PE production estimated to have reached 700 million dollars in 2019 (Suastegui and Shao 2016; Tian et al. 2015). The production of 2-PE by various approaches has attracted attention because 2-PE is the second most used flavor substance.
The current production process of 2-PE is based on chemical synthesis (alkylation of benzene), which yields undesired side products and toxic compounds (Kirm et al. 2005; Nomura et al. 2001). In addition, chemical synthesis of 2-PE is not an environmentally friendly process, involves the use of petrochemicals and sometimes high-temperature conditions, and causes off-odors that alter the organoleptic profiles of the products (Etschmann et al. 2002; Kirm et al. 2005; Yadav and Lawate 2013). Thus, consumers generally prefer natural 2-PE above synthetically produced 2-PE because the natural product is healthier and environmentally friendly (Carlquist et al. 2015). In addition, 2-PE must be obtained by technological routes starting with substrates that are from natural sources according to the new directives of European and American legislation (Kernon and Skelton 1993; Smith and Dransfield 1991). Thus, the search for alternative routes to obtain natural 2-PE has become a major research topic (Martinez-Avila et al. 2018). There are two possible methods for obtaining natural 2-PE: extraction from natural materials, such as rose petals, hyacinths, or jasmine and microbial fermentation (biosynthesis or biotransformation) (Martinez-Avila et al. 2019). However, recovery of 2-PE from natural sources is often a complex process that is expensive because multiple separation steps are required and the yield of 2-PE is low (Bialecka-Florjanczyk et al. 2012; Chreptowicz et al. 2016). Therefore, natural 2-PE extracted from materials is costly and cannot meet the growing market demand because of the scarcity of raw materials (Hua and Xu 2011; Mei et al. 2009). Recent reports have shown that microbial production appears to be a more competitive approach for 2-PE extraction from raw materials (Chreptowicz et al. 2016). Thus, attention toward the bioproduction of 2-PE has progressively increased. The most promising producers of 2-PE are yeasts, which can produce 2-PE by the Erlich pathway from L-phenylalanine (L-Phe) or by de novo synthesis from sugars (Mierzejewska et al. 2017). Therefore, the route of 2-PE production by yeasts seems to be the most promising alternative to chemical synthesis.
Recently, many studies have reported the potential of yeast to produce 2-PE from L-Phe as the precursor, and Saccharomyces cerevisiae (S. cerevisiae) is considered to be the most effective producer of 2-PE (Hua et al. 2010; Huang et al. 2015; Lima et al. 2018). Importantly, there are a number of reports describing of characterization of other potential 2-PE-producing yeast strains, such as Kluyveromyces marxianus, Pichia fermentans and Metschnikowia chrysoperlae, which are able to grow in a greater diversity of carbon sources and temperatures, and capable of producing different compounds when compared with that of S. cerevisiae (Fabre et al. 1998; Huang et al. 2001; Lima et al. 2018; Martinez-Avila et al. 2019; Mierzejewska et al. 2017). During the production of Baijiu, numerous microorganisms are created and enriched, which includes a variety of aroma-producing yeasts (non-Saccharomyces yeast) (Fan et al. 2018, 2019a). However, characterization and use of these aroma-producing yeast strains for the production of aroma compounds have not been explored in detail (Fan et al. 2018). In this context, we evaluated the potential of various yeast strains previously isolated from the Baijiu-making environment to produce 2-PE. In this study, the Pichia kudriavzevii (P. kudriavzevii) YF1702 strain was identified as the best producer of 2-PE. P. kudriavzevii strains are considered suitable for aromatic compound production (Shi et al. 2019). However, there are only a few reports describing the production of 2-PE by P. kudriavzevii (Chreptowicz et al. 2018; Xu et al. 2017). Thus, the objective of this report was to screen yeast with a high 2-PE yield from Baijiu environments and apply statistical methods to optimize the fermentation parameters of this yeast strain for enhancing 2-PE production. The results of our study identified that the P. kudriavzevii YF1702 strain screened from the Baijiu-making environment has the potential to produce a good yield of 2-PE, which was higher than most strains reported previously (Chreptowicz et al. 2018; Etschmann et al. 2003).
Material and methods
Materials, reagents and media preparation
Daqu (a starting material used for Baijiu production), Jiupei (fermented grains for Baijiu distillation) or soil was collected from different Baijiu-making enterprises to screen for yeast strains. 2-PE, L-Phe and chromatographic grade methanol were purchased from Sigma-Aldrich (St. Louis, Mo, USA). All other chemicals were analytical grade and commercially available unless otherwise stated. Yeast extract peptone dextrose (YPD) medium was prepared with 20 g glucose, 20 g peptone, 10 g yeast extract powder, 20 g agar powder and 1000 mL ddH2O, pH 6.0–6.2. The initial working culture (IWC) contained per liter: 100 g glucose, 10 g L-Phe (analytical grade), 5 g KH2PO4, 0.2 g MgSO4·7H2O and 3 g yeast extract, pH 4.98. Sorghum hydrolysate medium (SHM) was prepared as described previously (Fan et al. 2018). All media were autoclaved at 115 °C for 20 min.
Screening for yeasts
Yeasts were isolated as reported previously (Xu et al. 2017). Five grams of various Daqu, Jiupei or soil samples were added to 45 mL sterilized ddH2O. After dilution using suitable gradients, 1 mL suspensions with different concentrations were poured into plates with approximately 15 mL YPD and inverted cultured at 30 ℃ for 2–3 days. Single colonies with different morphologies were selected from the plates and examined by microscopy. Each isolated colony was inoculated into an YPD medium slant tube and numbered. Primary screening was performed in IWC to obtain yeasts with the potential to produce 2-PE. Each yeast strain was pre-cultured in a YPD liquid medium, then inoculated into 50 mL IWC with 0.1 mL activated yeast cell solution, which was adjusted to a concentration of 1 × 10⁶ cells/mL by using a blood cell counting plate, and cultured in a 28 °C incubator at 180 rpm for 48 h. After fermentation, media were centrifuged at 13,751×g for 10 min. The supernatants were filtered and 2-PE production was examined by using high-performance liquid chromatography (HPLC). The yeast strain that produced the highest concentration of 2-PE was selected for further characterization. Experiments were conducted in triplicate.
Identification and biochemical characteristics of yeast
The target yeast strain was characterized by morphological and physiological characteristics, and molecular identification, as described by Fan et al. (2018).
Biochemical characteristics, including temperature, pH, NaCl concentration, glucose tolerance, sucrose tolerance, ethanol tolerance and 2-PE tolerance were determined by monitoring the OD560 of the YPD medium, as reported previously (Fan et al. 2018). The characteristics of the aroma compounds produced by the target yeast in SHM were carried out according to a previous report (Xu et al. 2017).
The molecular identification of YF1702 was conducted based on amplification and sequencing of the 26S rDNA (D1/D2 region) using universal primers (NL1: 5ʹ-GCATATCAATAAGCGGAGGAAAAG-3ʹ and NL4: 5ʹ-GGTCCGTGTTTCAAGACGG-3ʹ). DNA from the YF1702 strain was extracted by the cetyl trimethyl ammonium bromide method (Zhao et al. 2017). PCR was performed as described previously (Fan et al. 2018). After purification using the QIAquick Gel Extraction kit (Qiagen, Germany), amplified PCR products were sent to the Beijing Genomics Institute for sequencing. Sequenced data were aligned and analyzed using the National Center for Biotechnology Information (NCBI) GenBank to find the closest homologue of the isolates. Using the neighbor-joining method with bootstrap analysis, a phylogenetic tree was constructed by using MEGA 5 software (https://www.megasoftware.net) to obtain molecular phylogeny information.
Optimization of the production conditions by single factor design
Various cultivation conditions, including glucose concentration, L-Phe concentration, time point of L-Phe addition, temperature, shaking speed, loading volume, pH, inoculum size, surfactant types, Tween-60 concentration, yeast extract concentration and time, were optimized for 2-PE production, using the classical approach of varying only one variable per test (Table 1). Optimized conditions were then used sequentially in subsequent fermentations. 2-PE production was carried out under submerged fermentation using IWC, as described above.
Table 1.
Factors and levels of single factor design
| Factor | Level/type |
|---|---|
| Glucose concentration (g/L) | 25, 50, 100, 150, 200 and 250 |
| Yeast concentration (g/L) | 0, 2, 4, 6, 8 and 10 |
| L-Phe concentraion (g/L) | 0, 5, 10, 15, 20, 25 and 30 |
| pH | 1, 2, 3, 4, 5, 6, 7 and nature pH (4.98) |
| Temperature (oC) | 20, 22, 24, 26, 28, 30 and 32 |
| Shaking speed (rpm) | 90, 120, 150, 180, 210, 240 and 270 |
| Loading volume (mL/250 mL) | 25, 50, 75, 100 and 125 |
| Inoculum size (%, v/v) | 0.1, 0.2, 0.4, 0.8, 1.6, 3.2, 6.4 and 12.8 |
| Time point of L-Phe addition (h) | 0, 12, 24, 36, 48 and 60 |
| Time (h) | 0, 12, 24, 36, 48, 60 and 72 |
| Surfactant types | Control, glycerol, Tween-20, Tween-40, Tween-60, Tween-80, Triton X-100 and Triton X-114 |
| Tween-60 concentration (g/L) | 0, 2, 4, 8, 16, 32, 64 and 128 |
Optimization of the production conditions by Plackett–Burman (PB) design
The PB design for eight variables, including yeast extract concentration (X1), L-Phe concentration (X2), pH (X3), temperature (X4), shaking speed (X5), loading volume (X6), Tween-60 concentration (X7) and culture time (X8), at two levels were used for screening, according to the results from the single factor experiments (Table 2). Each variable is represented at two levels, high and low, which are denoted by (+ 1) and (−1), respectively (Table 2). The design was run in a single block and the order of the experiments was fully randomized. The PB design and the response value of 2-PE production are shown in Table 3. A regression model was obtained based on the experimental data by Minitab software 17.1 (Minitab, Inc. USA). The statistical significance was determined by F-value analysis, and the proportion of variance explained by the model obtained was given by the multiple coefficient of determination, R2.
Table 2.
Levels of the variables and statistical analysis in PB design for 2-PE production
| Code | Variable | Low level (-1) | High level (+ 1) | Effect (EXi) | F values | P values | Rank | Significance |
|---|---|---|---|---|---|---|---|---|
| X1 | Yeast extract concentration (g/L) | 2 | 10 | − 0.0408 | 0.10 | 0.757 | 8 | |
| X2 | L-Phe concentration (g/L) | 5 | 15 | 1.2643 | 99.48 | 0.000 | 2 | ** |
| X3 | pH | 1 | 3 | 1.4225 | 125.93 | 0.000 | 1 | ** |
| X4 | Temperature (oC) | 22 | 30 | 0.4097 | 10.45 | 0.014 | 5 | * |
| X5 | Shaking speed (rpm) | 210 | 270 | − 0.0411 | 0.10 | 0.755 | 7 | |
| X6 | Loading volume (mL/250 mL) | 12.5 | 37.5 | − 1.1368 | 80.43 | 0.000 | 3 | ** |
| X7 | Tween-60 concentration (g/L) | 16 | 48 | 0.2909 | 5.27 | 0.055 | 6 | |
| X8 | Time (h) | 48 | 72 | 0.5553 | 19.19 | 0.003 | 4 | ** |
*Significant at 5% level (P < 0.05); **Significant at 1% level (P < 0.01)
Table 3.
PB design matrix for evaluating factors influencing 2-PE production
| Run order | Std Order | X1 (g/L) | X2 (g/L) | X3 | X4 (oC) | X5 (rpm) | X6 (mL/250 mL) | X7 (g/L) | X8 (h) | 2-PE concentration (g/L) |
|---|---|---|---|---|---|---|---|---|---|---|
| 1 | 8 | 2 | 5 | 3 | 30 | 270 | 12.5 | 48 | 72 | 4.19 |
| 2 | 16 | 6 | 10 | 2 | 26 | 240 | 25 | 32 | 60 | 4.73 |
| 3 | 1 | 10 | 5 | 3 | 22 | 210 | 12.5 | 48 | 72 | 4.21 |
| 4 | 12 | 2 | 5 | 1 | 22 | 210 | 12.5 | 16 | 48 | 1.76 |
| 5 | 10 | 10 | 5 | 1 | 22 | 270 | 37.5 | 48 | 48 | 0.63 |
| 6 | 6 | 10 | 15 | 3 | 22 | 270 | 37.5 | 16 | 72 | 3.78 |
| 7 | 3 | 2 | 15 | 3 | 22 | 270 | 12.5 | 16 | 48 | 4.43 |
| 8 | 13 | 6 | 10 | 2 | 26 | 240 | 25 | 32 | 60 | 4.54 |
| 9 | 5 | 10 | 15 | 1 | 30 | 270 | 12.5 | 48 | 48 | 3.86 |
| 10 | 15 | 6 | 10 | 2 | 26 | 240 | 25 | 3.2 | 60 | 4.77 |
| 11 | 14 | 6 | 10 | 2 | 26 | 240 | 25 | 32 | 60 | 4.53 |
| 12 | 11 | 2 | 15 | 1 | 22 | 210 | 37.5 | 48 | 72 | 2.75 |
| 13 | 9 | 2 | 5 | 1 | 30 | 270 | 37.5 | 16 | 72 | 1.77 |
| 14 | 2 | 10 | 15 | 1 | 30 | 210 | 12.5 | 16 | 72 | 3.74 |
| 15 | 4 | 10 | 5 | 3 | 30 | 210 | 37.5 | 16 | 48 | 2.43 |
| 16 | 7 | 2 | 15 | 3 | 30 | 210 | 37.5 | 48 | 48 | 4.01 |
| 17 | 17 | 6 | 10 | 2 | 26 | 240 | 25 | 32 | 60 | 4.77 |
Optimization of the production conditions by steepest ascent path design
Important variables obtained by PB design were screened by the regression model and were used to construct the steepest ascent path. The direction of the steepest ascent path can be determined by regression results. Experiments were conducted along the steepest ascent path and practical experience until 2-PE production showed no further increase (Table 4). 2-PE production was determined to be highest by the steepest ascent path design, and the near optimal point was used as the center point of the response surface methodology (RSM).
Table 4.
Experimental designs and the results of steepest ascent for 2-PE production
| Groups | pH | L-Phe concentration (g/L) | Loading volume (mL/250 mL) | Time (h) | Temperature (oC) | 2-PE concentration (g/L) |
|---|---|---|---|---|---|---|
| 1 | 1.0 | 5.0 | 37.5 | 48 | 22 | 0.01 |
| 2 | 1.5 | 7.5 | 32.5 | 52 | 24 | 4.01 |
| 3 | 2.0 | 10.0 | 27.5 | 56 | 26 | 4.97 |
| 4 | 2.5 | 12.5 | 22.5 | 60 | 28 | 4.79 |
| 5 | 3.0 | 15.0 | 17.5 | 64 | 30 | 4.85 |
Optimization of the production conditions by RSM design
Once variables with statistically significant influence on the responses by PB design and center point were identified by the steepest ascent path design, RSM was used to optimize the screened variables for enhanced 2-PE production based on the Box-Behnken experimental design (BBD, Design-expert 11). The design is listed in Table 5 with three factors [initial pH (A), L-Phe concentration (B), and loading volume (C)] and three levels, including five replicates at the center point, and these were used for fitting a 2nd-order response surface. Each experiment was performed in triplicate and the average 2-PE production values were taken as the response.
Table 5.
The BBD design and the responses of the dependent variables
| Test number | pH | L-Phe concentration (g/L) | Loaded liquid (mL/250 mL) | 2-PE concentration (g/L) | |||
|---|---|---|---|---|---|---|---|
| A | Code A | B | Code B | C | Code C | Y | |
| 1 | 2.0 | 0 | 7.5 | − 1 | 32.5 | + 1 | 3.88 |
| 2 | 2.0 | 0 | 10.0 | 0 | 27.5 | 0 | 4.93 |
| 3 | 1.5 | − 1 | 7.5 | − 1 | 27.5 | 0 | 3.90 |
| 4 | 2.5 | + 1 | 10.0 | 0 | 32.5 | + 1 | 4.51 |
| 5 | 1.5 | − 1 | 10.0 | 0 | 32.5 | + 1 | 4.08 |
| 6 | 1.5 | − 1 | 10.0 | 0 | 22.5 | − 1 | 4.39 |
| 7 | 2.5 | + 1 | 7.5 | − 1 | 27.5 | 0 | 4.51 |
| 8 | 2.5 | + 1 | 12.5 | + 1 | 27.5 | 0 | 4.73 |
| 9 | 2.0 | 0 | 10.0 | 0 | 27.5 | 0 | 4.97 |
| 10 | 2.0 | 0 | 12.5 | + 1 | 22.5 | − 1 | 4.75 |
| 11 | 2.5 | + 1 | 10.0 | 0 | 22.5 | − 1 | 5.08 |
| 12 | 1.5 | − 1 | 12.5 | + 1 | 27.5 | 0 | 4.33 |
| 13 | 2.0 | 0 | 12.5 | + 1 | 32.5 | + 1 | 4.65 |
| 14 | 2.0 | 0 | 10.0 | 0 | 27.5 | 0 | 5.02 |
| 15 | 2.0 | 0 | 7.5 | − 1 | 22.5 | − 1 | 4.17 |
| 16 | 2.0 | 0 | 10.0 | 0 | 27.5 | 0 | 4.89 |
| 17 | 2.0 | 0 | 10.0 | 0 | 27.5 | 0 | 5.01 |
Analytical methods
The optical density (OD) of cells was measured at 560 nm. The 2-PE and L-Phe concentrations were determined using a 1260 series HPLC (Agilent, Santa Clara, CA, USA) equipped with a ZORBAX Eclipse Plus C18 column (4.6 × 250 mm, 5 µm), as detailed by Xu et al. (2017). After centrifugation and filtering, a 10 µL sample was injected onto the column, which was maintained at 30 °C with 50% (v/v) methanol as the mobile phase and a flow rate of 0.5 mL/min for 20 min. A UV-detector was used at a fixed wavelength of 260 nm. The aroma compounds were analyzed using gas chromatography-mass spectrometry (GC–MS; Trace MS/GC; Thermo Quest Finnigan Co., Silicon Valley, CA, USA) under the conditions given in the methods (Fan et al. 2018).
Statistical analysis
Statistical differences of the assessed strategies were analyzed using a one-way ANOVA (P < 0.05) with the Tukey test. Assays have been conducted at least in triplicate, and the reported values correspond to the mean value and its standard deviation. Minitab 17.1 (Minitab Inc.), SPSS 24.0 (IBM Corp., New York, NY, USA), OriginPro 9.1 (OriginLab, Northampton, MA, USA), Design-expert 11 (Stat-Ease, Inc. USA) and Excel 2016 (Microsoft, USA) were used to analyze data.
Results and discussion
Yeast screening for 2-PE production
A number of yeast strains can produce 2-PE through the Ehrlich pathway. However, the development of a commercial cultivation process for the bioproduction of 2-PE by yeasts may be restricted because of low yields and intolerance to high 2-PE concentrations for these yeast strains. Selection of suitable yeast strains, and the optimization of the medium composition and cultivation conditions are required to overcome low 2-PE productivity (Eshkol et al. 2009). In this study, a total of 107 yeast strains were isolated from samples associated with the production of Baijiu. Each was inoculated into IWC to verify the production of 2-PE from L-Phe. Almost all yeasts were capable of producing 2-PE to some extent, but only 19 yeasts produced 2-PE concentrations exceeding 1.5 g/L. Table 6 lists the top ten 2-PE-producing yeasts, which are superior to previously identified yeasts (Etschmann et al. 2003) and are similar to other primary screening reports (Chreptowicz et al. 2018; Lima et al. 2018). Strain YF1702 produced a significantly higher level of 2-PE than other reported yeasts (Etschmann et al. 2003) and this level is superior to other strains producing 2-PE that were identified from primary screening (Chreptowicz et al. 2018; Lima et al. 2018). Thus, YF1702 was chosen as the target strain in the following experiments. The results also revealed that there are many yeast strains that can produce 2-PE in the Baijiu-producing environment.
Table 6.
The top ten yeasts for 2-PE production in our study
| No | 2-PE production (g/L) | No | 2-PE production (g/L) |
|---|---|---|---|
| F1912 | 1.76 | X3401 | 2.20 |
| F1914 | 2.21 | F1904 | 2.24 |
| F1903 | 1.70 | F12502 | 1.83 |
| F1905 | 1.73 | F1702 | 2.33 |
| F1703 | 2.06 | F3201 | 1.91 |
The toppest 2-PE-producing yeast by primary screening was in bold
Identification of YF1702
Colonies of strain YF1702 on YPD were white, raised, had wet and smooth surfaces with inerratic edges. The cells of YF1702 were fusiform, occasionally long and narrow, and asexual budding reproduction occurred at one end of the cells. In addition, no pseudohyphae were found for YF1702. Thus, strain YF1702 has the typical morphology of yeast. The physiological characteristics of strain YF1702 are shown in Table 7 and Fig. 1. Acid production and aerogenesis were observed when the yeast was fermented in the presence of glucose and d-fructose. In the presence of d -arabinose, saccharose, lactose, or maltose as the sole carbon sources, YF1702 only produced acid, and this strain could not ferment d-galactose, l-sorbose and d-xylose to produce acid or gas. YF1702 could assimilate glucose, d-fructose, d-galactose, d-arabinose, d-xylose, saccharose, lactose, maltose, ethanol, soluble starch, d-ribose, and d-raffinose, but not l-sorbose, cellobiose, synanthrin, glycerol, mannose, and α-lactose. Urea, ammonium sulfate, potassium nitrate, and L-Phe could be used as the sole nitrogen source for growth, but not potassium nitrite, ammonium nitrate, sodium nitrate, sodium nitrite, and aluminum nitrate. YF1702 could reduce nitrate, utilize citrate, hydrolyze starch, and was able to decompose tryptophan to indole. The Voges-Proskauer reaction, methyl red test, hydrogen sulfide test, and gelatin liquefaction test were negative, whereas the milk litmus test was positive. Growth was observed over the range of 15–45 °C (optimum 30 °C), pH 1.0–11.0 (optimum pH 6.0), NaCl concentrations of 0–10% (w/v), 2-PE concentrations of 0–5.5 g/L (Fig. 1), glucose concentrations of 0–90% (w/v), saccharose concentrations of 0–90% (w/v) and ethanol concentrations of 0–9% (v/v). According to the data from the physiological characteristics, the strain was preliminarily confirmed as Pichia sp.
Table 7.
Physiological and biochemical characteristics of strain YF1702
| Sugar fermentation tests | |||||
|---|---|---|---|---|---|
| Sugars | Characteristics of YF1702 | Sugars | Characteristics of YF1702 | Sugars | Characteristics of YF1702 |
| d-Glucose | Acid and gas production | d-Galactose | No acid, no gas | d-Maltose | Acid production, no gas |
| d-Saccharose | Acid production, no gas | d-Lactose | Acid production, no gas | d-Fructose | Acid and gas production |
| L-Sorbose | No acid, no gas | d-Arabinose | Acid production, no gas | d-Xylose | No acid, no gas |
| Carbon source assimilation tests | |||||
|---|---|---|---|---|---|
| Carbon sources | Characteristics of YF1702 | Carbon sources | Characteristics of YF1702 | Carbon sources | Characteristics of YF1702 |
| d-Glucose | + | d-Galactose | + | d-Maltose | + |
| d-Saccharose | + | d-Lactose | + | d-Fructose | + |
| l-Sorbose | − | d-Arabinose | + | d-Xylose | + |
| Glycerol | − | Ethanol | + | Mannose | − |
| Soluble starch | + | α-Lactose | − | Cellobiose | − |
| Synanthrin | − | d-Ribose | + | d-Raffinose | + |
| Nitrogen source assimilation tests | |||||
|---|---|---|---|---|---|
| Nitrogen sources | Characteristics of YF1702 | Nitrogen sources | Characteristics of YF1702 | Nitrogen sources | Characteristics of YF1702 |
| Urea | + | Potassium nitrite | − | Ammonium sulfate | + |
| Potassium nitrate | + | L-Phenylalanine | + | Ammonium nitrate | − |
| Sodium nitrate | − | Sodium nitrite | − | Aluminium nitrate | − |
| Other tests | |||||
| Starch hydrolysis test | + | Methyl red test | − | Indole test | − |
| Voges-Proskauer test | − | Hydrogen sulfide test | − | Citrate test | + |
| Urea test | + | Gelatin liquidized test | − | Litmus test | + |
| Sodium chloride osmolarity test | 0–10% (w/v) | Glucose osmolarity test | 0–90% (w/v) | Saccharose osmolarity test | 0–90% (w/v) |
| Ethanol tolerance test | 0–9% (v/v) | Growth temperature range | 15–45 °C (optimum 30 °C) | Growth pH range | 1.0–11.0 (optimum pH 6.0) |
+ Positive response, − Negative response
Fig. 1.
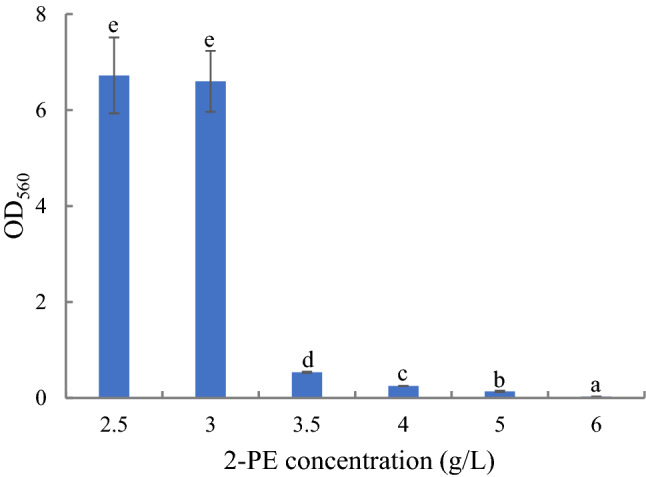
The results of 2-PE tolerance (2.5, 3, 3.5, 4, 5, and 6 g/L) of strain YF1702. Same letters in the column indicate that the data do not differ significantly at 5% probability by the Tukey test
The gene sequence obtained from YF1702 was submitted to the GenBank with the accession number MN886501 and was queried against the NCBI database (https://www.ncbi.nlm.nih.gov/). The analysis showed that Issatchenkia orientalis (EU543688.1), P. kudriavzevii (KC616319.1), and P. kudriavzevii (HQ149323.1) had high homology with YF1702, with a sequence similarity of 99%. A phylogenetic tree was constructed for related strains using MEGA 7.0.14 software (https://www.megasoftware.net) of the neighbor-joining statistical method to reveal the evolutionary distance between the yeast strains (Fig. 2). The closest relative to strain YF1702 was P. kudriavzevii (KX118628.1) because of clustering into a branch between them. Overall, according to the analysis of morphological, physiological, and biochemical characteristics, and phylogenetic analysis, strain YF1702 was identified to be P. kudriavzevii.
Fig. 2.

Neighbor-joining phylogenetic tree based on 26S rDNA (D1/D2 region) gene sequence of strain YF1702 and its closest relative species
Aroma compounds produced by YF1702
As YF1702 was selected from Baijiu environment, the study of volatile compounds produced by this strain should aid our understanding of how this strain influences the Baijiu brewing process. Therefore, we used the hydrolysate prepared from sorghum, which is the main material for Baijiu-making, as a medium to analyze the volatile compounds produced by a pure culture of YF1702. A total of 38 volatile compounds (13 esters, ten alcohols, three acids, three alkanes, two aldehydes, two phenols, one quinone, one ketone, one thiazoles, one furan and one other compound) produced by YF1702 were identified by HS–SPME–GC–MS (Table 8) in SHM. These volatile compounds produced by YF1702 could improve the quality of Baijiu significantly. Esters with fruity aromas are the most important compounds in Baijiu and strongly affect Baijiu quality (Fan et al. 2019b). Notably, strain YF1702 produced a few esters, which were identified as the main esters, and include ethyl acetate (with pear-like and banana-like aromas), furfuryl acetate (contributing to sweet, fruity and caramel aromas), phenylmethyl acetate (with fruity and jasmine aromas), geranyl acetate (with floral aromas), phenethyl butyrate (with floral aromas), ethyl phenylacetate (with rosy and honey aromas), γ-nonalactone (with sweet and coconut aromas), isopropyl palmitate (with ester aromas) and dibutyl phthalate (with aromatic odor) (Fan and Qian 2006; Hao et al. 2014; McGinty et al. 2012; Wang et al. 2016, 2015). In addition, YF1702 produced linalool with sweet woody aromas, 3-methylthio-propanol with onion, sweet meat and broth odor, geraniol, and isogeraniol with a hops odor and trans-nerolidol with healthcare benefits (Fan et al. 2019c). Importantly, strain YF1702 was capable of producing 2-PE via the de novo pathway. YF1702 produced octanoic acid (sweaty and cheesy), benzaldehyde (fruity and berry), beta-damascenone (floral and fruity aromas), 2,4-ditertbutylphenol (fruity) and 1,2-benzothiazole (meaty and nutty) (Fan and Qian 2006; Zhao et al. 2016; Zhou et al. 2017, 2018). Thus, strain YF1702 from the Baijiu-making environment can produce many flavor compounds and thus influence the quality of Baijiu.
Table 8.
The volatile compounds production by YF1702 in the SHM
| Classify | Compound | Concentration (mg/L) | Classify | Compound | Concentration (mg/L) | ||
|---|---|---|---|---|---|---|---|
| YF1702 | HSM | YF1702 | HSM | ||||
| Esters | Ethyl acetate | 0.064 | – | Alcohols | 1-Propanol, 2-methyl- | 0.145 | – |
| Isobutyl acetate | 0.270 | – | 1-Pentanol | 0.012 | – | ||
| 1-Butanol, 3-methyl-, acetate | 0.053 | – | Linalool | 6.763 | – | ||
| 2-Furanmethanol, acetate | 5.476 | – | 1-Butanol, 3-methyl- | 5.468 | – | ||
| Acetic acid, phenylmethyl ester | 4.874 | – | 1-Propanol,3-(methylthio)- | 3.878 | – | ||
| Geranyl acetate | 10.957 | – | 3,6-Octadien-1-ol, 3,7-dimethyl-, (Z)- | 7.191 | – | ||
| Benzeneacetic acid, ethyl ester | 5.547 | – | Geraniol | 1.098 | – | ||
| Acetic acid, 2-phenylethyl ester | 0.006 | – | Phenylethyl alcohol | 0.018 | – | ||
| Propanoic acid, 2-phenylethyl ester | 0.53 | – | 1,6,10-Dodecatrien-3-ol | 4.677 | – | ||
| 2(3H)-Furanone, dihydro-5-pentyl- | 3.194 | – | 2,6,10-Dodecatrien-1-ol, 3,7,11-trimethyl- | 0.503 | – | ||
| á-Phenylethyl butyrate | 16.499 | – | Acids | Propanoic acid, 2-methyl- | 0.387 | – | |
| Isopropyl palmitate | 10.353 | – | 1-Butanol, 3-methyl- | 0.491 | – | ||
| Dibutyl phthalate | 3.239 | – | Octanoic acid | 3.075 | – | ||
| Hydrocarbons | Tetradecane | 15.068 | – | Quinones | 2,5-di-tert-Butyl-1, 4-benzoquinone | 7.557 | – |
| pentadecane | 12.530 | – | Thiazoles | 1,2-Benzisothiazole | 4.258 | – | |
| Hexadecane | 9.842 | – | Phenol | 2-Methoxy-4-vinylphenol | 0.697 | 0.003 | |
| Aldehydes and Ketones | Benzaldehyde | 2.188 | – | 2,4-Di-tert-butylphenol | 1.445 | – | |
| Benzaldehyde, 2,4-dimethyl- | 0.165 | – | Vinyl guaiacol | – | 0.02 | ||
| 2-Buten-1-one, 1-(2,6,6-trimethyl-1, 3-cyclohexadien-1-yl)-,(E)- | 4.400 | – | Furan | Benzofuran, 2,3-dihydro- | 0.806 | – | |
| Anhydride class | 2,2-Dimethylpropanoic anhydride | 3.077 | – | ||||
– Not detected
Optimization of the production conditions by single factor design
Previous reports have shown that glucose concentration influences 2-PE production (Eshkol et al. 2009). Therefore, the effect of glucose concentration on 2-PE production was evaluated. Although 2-PE production was essentially constant as the glucose concentration increased, which is similar to a previous report, 2-PE production was observed to increase slightly as the glucose concentration reached 50 g/L, with a 2-PE production value of 2.83 g/L (data not shown) (Etschmann et al. 2003). Lu et al. studied Candida glycerinogenes and found the highest 2-PE levels at a glucose concentration of 90 g/L (2016). Similar to our results, Candida produces a constant 2-PE level over a glucose concentration range of 10–50 g/L (Seo and Ahn 2003). However, in contrast to our results, Eshkol et al. found that 2-PE levels increase as the glucose concentration increases to an optimum of 20 g/L, followed by a decrease and plateauing at 30–40 g/L (2009). Under high glucose concentrations, yeast may produce some ethanol via the glycolysis pathway, and the presence of ethanol in combination with 2-PE is more toxic. Therefore, it is assumed that the growth of yeast cells was inhibited by the formation of ethanol at high glucose concentrations (Eshkol et al. 2009). The varying optimal glucose concentration for 2-PE production with various yeasts may be caused by different tolerances to 2-PE, ethanol, or glucose.
Yeast extracts contain a large number of growth factors such as amino acids, vitamins, and microelements, and these growth factors affect yeast growth and the accumulation of yeast metabolites (Huang et al. 2015). Although the nitrogen source plays a crucial role in determining the pathway yeast utilize for 2-PE production and previous reports have shown that the Ehrlich pathway is active when L-Phe represents the sole nitrogen, many other studies have shown that 2-PE production increases after adding yeast extract (Fabre et al. 1998; Huang et al. 2000, 2015; Lima et al. 2018; Mierzejewska et al. 2017; Sendovski et al. 2010). Our results also showed that the addition of yeast extract was beneficial for the synthesis of 2-PE by strain YF1702. The results presented in Fig. 3a shows that YF1702 could produce higher levels of 2-PE when 2–6 g/L of yeast extract was present, and the highest yield of 2-PE was 2.77 g/L when 6 g/L of yeast extract was used. However, when the concentration of yeast extract was ≥ 8 g/L, 2-PE production decreased, which may be because of the inhibition of the Ehrlich pathway at higher concentrations of yeast extract. Here, at low yeast extract concentrations the addition of the extract provides valuable growth factors, whereas, at higher concentrations, the yeast extract is used as a nitrogen source, leading to the inhibition of the Ehrlich pathway. This was similar to the results of Huang et al. (2015) and Xu et al. (2017) where yeast synthesize more 2-PE when a low amount of yeast extract (5 g/L) was added.
Fig. 3.

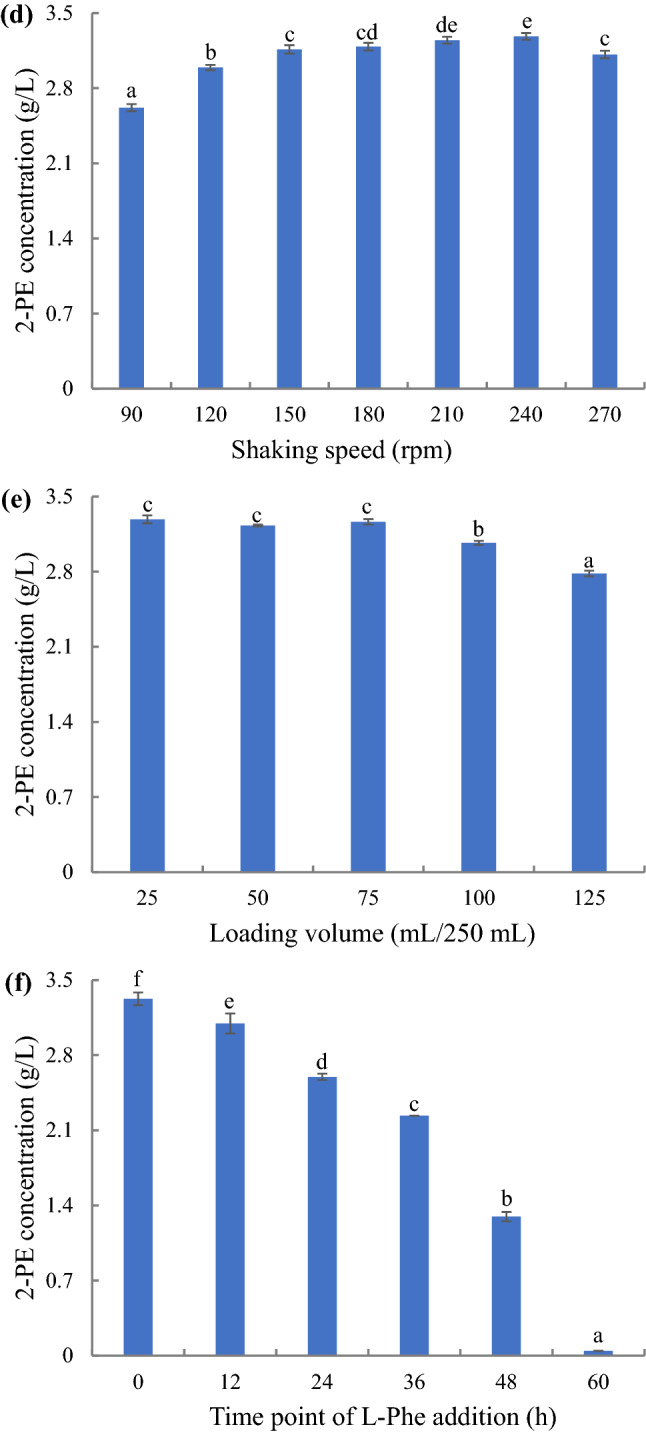
Effect of yeast extract concentration (0, 2, 4, 6, 8 and 10 g/L) (a), L-Phe concentration (0, 5, 10, 15, 20, 25 and 30 g/L) (b), temperature (20, 22, 24, 26, 28, 30 and 32 °C) (c), shaking speed (90, 120, 150, 180, 210, 240 and 270 rpm) (d), loading volume (25, 50, 75, 100 and 125 mL/250 mL) (e), time point of L-Phe addition (0, 12, 24, 36, 48 and 60 h) (f), time (0, 12, 24, 36, 48, 60 and 72 h) (g), surfactant types (glycerol, Tween-20, Tween-40, Tween-60, Tween-80, Triton X-100 and Triton X-114) (h) and Tween-60 concentration (0, 2, 4, 8, 16, 32, 64 and 128 g/L) (i) on 2-PE concentration. Same letters in the column indicates that the data do not differ significantly at 5% probability by the Tukey test
Yeast produces 2-PE by using L-Phe and the Ehrlich pathway. Thus, we evaluated the effect of L-Phe concentration on 2-PE production by YF1702. L-Phe concentrations above 10.0 g/L did not cause an increase in 2-PE production (Fig. 3b). Similar results were reported for P. kudriavzevii Y1511 and K. marxianus CBS 600 where 2-PE production was higher when the concentration of L-Phe was approximately 10 g/L (Etschmann et al. 2004; Xu et al. 2017). In contrast, Fabre et al. (1998) reported that K. marxianus produced the highest 2-PE at an L-Phe concentration of 2 g/L, and in the study by Grygier et al. (2015) the highest yield of 2-PE was obtained with Galactomyces geotrichum MK017 at L-Phe concentrations of 21 g/L. These results indicate that different yeast strains require different L-Phe concentrations for the high production of 2-PE. Noteworthy, L-Phe was not totally consumed at the concentrations used. Additionally, its consumption decreased at higher L-Phe concentrations, which is in agreement with the study by Lima et al. (2018).
The optimum pH for 2-PE production was measured over the range of 1–7 (data not shown). The yield of 2-PE from YF1702 first increased and then decreased with increasing pH with the highest yield of 2-PE obtained when the pH was 2, which is not in agreement with other studies (Eun and Chang 2007; Grygier et al. 2015; Huang et al. 2015; Xu et al. 2017). In general, the optimal pH for 2-PE production has been reported to be between 5 and 6, which is consistent with the optimal growth pH of yeast (Eun and Chang 2007). However, this was not observed for strain YF1702 (the optimal growth pH is 6), which may be because of the complexity of the Baijiu brewing environment, resulting in a wide range of pH adaptations (Table 7). This result also highlights the advantages of this yeast in future applications.
In view of the growth temperature range of YF1702, the optimum temperature for 2-PE production was measured from 20 to 32 ℃. 2-PE production initially increased as the temperature was raised and then at the higher temperatures the production yield decreased (Fig. 3c). When the temperature range was 24–30 ℃, the yield of 2-PE from YF1702 was highest, which is consistent with the growth temperature range of YF1702 (Fig. 3c and Table 7). This temperature growth result is similar to previous reports (Huang et al. 2015; Lima et al. 2018; Xu et al. 2017). Reduction in the growth rate, oxidative capacity, and activity of 2-PE synthesis-related enzymes, which may be affected at low or high temperatures, leads to low 2-PE production (Huang et al. 2001; Lu et al. 2016; Stark et al. 2002).
Although yeast belongs to facultative anaerobic microorganisms, the oxygen concentration required for the preparation of different products by yeast varies. We investigated shaking speed and loading volume to study the effect of dissolved oxygen on the production of 2-PE by YF1702. The results showed that the amount of 2-PE produced by YF1702 first increased and then decreased with increasing shaking speed and decreased with increasing loading volume (Figs. 3d, e). Shu et al. (2018) reported that bioconversion of L-Phe to 2-PE is enhanced via an oxygen control strategy. Under anaerobic fermentation conditions the rate of 2-PE production was equal to zero, whereas a different trend was observed when using aerobic fermentation; the production rate of 2-PE was significantly higher than anaerobic. This conclusion has also been confirmed in other studies (Huang et al. 2015).
Although L-Phe is the key substrate for the yeast to produce 2-PE through the Ehrlich pathway, there is no information detailing the optimal time point for L-Phe addition. The time point of L-Phe addition on 2-PE production by YF1702 was studied. The results showed that 2-PE production by YF1702 decreased when the time point of L-Phe addition was delayed (Fig. 3f). This may be because L-Phe is not only required for 2-PE production but is also an amino acid required for optimum growth of yeast. In addition, when L-Phe is added during the initial stages of culturing, 2-PE will be transformed earlier through the Ehrlich pathway, thereby leading to a higher accumulation of 2-PE. Previous reports showed that L-Phe consumption relies on either ATP or the electrochemical gradient generated from glucose catabolism, and 2-PE uncouples anabolism from catabolism under energy-limited conditions (Lima et al. 2018; Stark et al. 2003). The early addition of L-Phe to the culture aided synthesis of 2-PE because of the high concentration of glucose present in the culture and the existence of sufficient energy when compared with adding L-Phe at a later culturing time point.
In general, at a low inoculum size, the yield of 2-PE should be less because of a longer delay period and lower yield rate, whereas at a high inoculum size, the yield of 2-PE should also be less because of a lack of nutrients or oxygen (Fan et al. 2019c). We observed that the inoculum size (over the range of 0.1%–12.8%, v/v) had no significant effect on 2-PE production by YF1702 because of superior growth conditions, such as sufficient yeast extract, and the highest value was observed when the inoculum size was 0.4% with a 2-PE production value of 3.32 g/L (data not shown).
The results presented in Fig. 3g shows the effect of the culture time on the production of 2-PE by YF1702. The results showed that 2-PE production by YF1702 increased as the culturing period increased. 2-PE production was 3.32 g/L when the fermentation period reached 60 h, and then the production level remained essentially unchanged. The results also showed that the trend of 2-PE production by YF1702 is similar to that of its growth, indicating that 2-PE production by YF1702 is accompanied by its growth, and further shows that L-Phe contributes to the growth of YF1702. In addition, the molar yield of 2-PE was 0.45, which is similar to K. marxianus but lower than many other reports (Etschmann et al. 2005; Hua et al. 2010; Huang et al. 2001). Thus, further optimization of the fermentation conditions is required to improve the molar yield of 2-PE.
Surfactants, such as Tween and Triton, can affect the level of dissolved oxygen in the fermentation process and the permeability of the cell membrane, which is conducive for improving enzyme production of microbial fermentation; however, no research on the effect of surfactants on 2-PE production by yeast has been conducted (Fan et al. 2013). The effects of Tween and Triton on 2-PE production by YF1702 were investigated. The results showed that the Triton series inhibited 2-PE production by FY1702, whereas the effect of the Tween series on 2-PE production varied. Here Tween-20 was found to inhibit 2-PE production, whereas the other Tweens promoted production (Fig. 3h). Among them, Tween-60 yielded the best results. Compared with the control, the presence of Tween-60 increased the production of 2-PE by 12.4%. In addition, glycerin has a slight inhibitory effect on 2-PE production. Figure 3i shows the effect of the Tween-60 concentration on 2-PE production by the strain YF1702. We observed that 2-PE production initially increased and then decreased as the concentration of Tween-60 increased. This suggests that low concentrations of Tween-60 aid dissolution of oxygen, whereas Tween-60 at higher concentrations permeabilizes the cell membrane, which reduces growth and metabolism of YF1702 (Fan et al. 2013).
Optimization of the production conditions by PB design
2-PE production was then evaluated by the PB design approach and the results are presented in Table 3. Changes in 2-PE production ranged from 0.63 g/L to 4.73 g/L. The polynomial equation that explains 2-PE production is:
| 1 |
where Y is the predicted response, and X1, X2, X3, X4, X5, X6, X7, and X8 represent yeast extract concentration, L-Phe concentration, pH, temperature, shaking speed, loading volume, Tween-60 concentration and time.
The adequacy of the model was tested using Fisher’s test for analysis of variance (ANOVA). ANOVA showed that the model is significant as the F value for the model is 57.13. The P-value of the model is significant (0.000); generally P values less than 0.05 are desirable.
PB design analysis was performed by calculating the coefficient of regression and the statistical confidence level. Based on the model and the Pareto chart (Fig. 4), parameters were classified according to their effects. Five variables, pH (X3), L-Phe concentration (X2), loading volume (X6), time (X8), and temperature (X4), out of the eight variables examined significantly influenced 2-PE production at the 5% level of significance. X6 had a negative coefficient, whereas the other four variables showed positive coefficients (Table 2). Thus, the addition of loading volume should be avoided in subsequent experiments because it does not enhance 2-PE production. These five parameters were studied further, since the other three parameters, X1, X5, and X7, were found to have an insignificant effect on 2-PE production (Table 2).
Fig. 4.

Standardized Pareto chart showing the effect of variables on 2-PE concentration. X1, yeast extract concentration; X2, L-Phe concentration; X3, pH; X4, temperature; X5, shaking speed; X6, loading volume; X7, Tween-60 concentration; X8, time
Optimization of the production conditions by steepest ascent path design
Based on the above regression analysis of PB design, the path of the steepest ascent was employed to find the correct direction for changing variables. To obtain maximum 2-PE production, the loading volume variable was designed to decrease, whereas variables X3, X2, X8 and X4 were designed to increase (Table 4). The results showed that the yield plateaued at run three with the highest response of 4.97 g/L under cultivation for 56 h at 26 °C, pH 2.0, and 10.0 g/L of L-Phe with a loading volume of 27.5 mL/250 mL. Thus, the third set of tests was used as the central point of the response surface.
Optimization of the production conditions by RSM design
A three-factor and three-level BBD was used to analyze the interactions between the three factors to identify the best fermentation conditions. The design and results are shown in Table 5. The results in Table 5 show that there is considerable variation in 2-PE production, which is dependent on the different nutrient concentrations and culture conditions. Maximum 2-PE production was 5.08 g/L in test number 11 and the minimum was 3.88 g/L in test number 1. The center point in the design was repeated five times to obtain an error.
The ANOVA (F-test) shows that the 2nd model matches the experimental data closely. A lower value of the coefficient of variation (CV = 2.77%) indicates greater reliability of the experiments performed. The determination coefficient (R2) indicates that the sample variation of 95.55% for 2-PE production is attributed to the independent variables and only about 4.45% of the total variation cannot be explained by the model. Here, the correlation coefficient value (R = 0.9775) for Eq. 2 indicates a close agreement between the experimental results and the theoretical values predicted by the model equation. Linear and quadratic terms were significant at the 5% level.
The F-value and the corresponding P-value, along with the parameter estimate, are given in Table 9. The parameter estimates and the corresponding P-values suggest that among the independent variables A (pH), B (L-Phe concentration), and C (loading volume) had a significant effect on 2-PE production. Positive coefficients for A and B indicated that 2-PE production increased linearly. The quadric term of these three variables also had a significant effect, whereas there was no evidence of interaction among them that would contribute to the response at a significant level.
Table 9.
Regression coefficients and their significances for 2-PE production from the results of the BBD
| Source | Sum of Squares | df | Mean square | F-Value | P-Value | Significant |
|---|---|---|---|---|---|---|
| Model | 2.42 | 9 | 0.2691 | 16.72 | 0.0006 | ** |
| A-pH | 0.5671 | 1 | 0.5671 | 35.24 | 0.0006 | ** |
| B-L-Phe concentration | 0.5000 | 1 | 0.5000 | 31.07 | 0.0008 | ** |
| C-Loading volume | 0.2016 | 1 | 0.2016 | 12.53 | 0.0095 | ** |
| AB | 0.0110 | 1 | 0.0110 | 0.6851 | 0.4352 | |
| AC | 0.0169 | 1 | 0.0169 | 1.05 | 0.3396 | |
| BC | 0.0090 | 1 | 0.0090 | 0.5608 | 0.4783 | |
| A2 | 0.2056 | 1 | 0.2056 | 12.78 | 0.0090 | ** |
| B2 | 0.5874 | 1 | 0.5874 | 36.50 | 0.0005 | ** |
| C2 | 0.2151 | 1 | 0.2151 | 13.36 | 0.0081 | ** |
| Residual | 0.1127 | 7 | 0.0161 | |||
| Lack of Fit | 0.0928 | 3 | 0.0309 | 6.22 | 0.0548 | Not significant |
| Pure Error | 0.0199 | 4 | 0.0050 | |||
| Cor Total | 2.53 | 16 | ||||
| R2 = 0.9555 | R2Adj = 0.8984 | CV = 2.77% |
“**”Significant at 1% level (P < 0.01)
By applying multiple regression analyses on the experimental data, the following 2nd-order polynomial coded equation was found to explain 2-PE production:
| 2 |
where Y is the predicted response.
Response surface plots for 2-PE production by the above model are shown in Fig. 5, which depicted the interactions between two variables by keeping the third variables at their zero levels. Figure 5a shows a three-dimensional (3D) plot of the effects of A (pH) and B (L-Phe concentration) on 2-PE production. As shown in Fig. 5a, 2-PE production was higher than 4.5 g/L when A was in the range of 1.9–2.5 and B in the range of 9.5–12.5 g/L. Clearly the effects of A (pH) and C (loading volume) on 2-PE production by YF1702 showed that pH was more important than loading volume (Fig. 5b). Here, 2-PE concentrations ranged from 3.90 to 5.08 g/L when the pH was raised, whereas 2-PE production did not change significantly as a function of different loading volumes. Figure 5c presents a 3D plot showing the effects of B (L-Phe concentration) and C (loading volume) on 2-PE production. The L-Phe concentration was more important than loading volume on 2-PE production, with 2-PE production ranging from 3.88 to 5.08 g/L when increasing the L-Phe concentration, whereas there was minimal change in 2-PE production as the loading volume was varied.
Fig. 5.

The 3D surface interaction of variable (L-Phe concentration, pH and loading volume) on the 2-PE concentration–response using the BBD. (a), Interaction of L-Phe concentration and pH; (b), interaction of loading volume and pH; (c), interaction of loading volume and L-Phe concentration
The optimal values of the variables giving the highest yield of the 2-PE production were derived by the software (Design-expert 11) with the following critical values: A (pH) = 2.31, B (L-Phe concentration) = 10.66 g/L and C (loading volume) = 25.43 mL/250 mL. The maximum predicted value of Y was 5.11 g/L. According to results of the statistically designed experiments, the optimized process parameters were: 50 g/L glucose, pH 2.3, 6.0 g/L yeast extract, 10.7 g/L L-Phe, 26 °C, shaking speed 210 rpm, loading volume 25.5 mL/250 mL, inoculum size 0.4% (v/v), the time point of L-Phe addition 0 h, culturing period 56 h and 32 g/L Tween-60. To test the reliability of the model in predicting optimal responses and in accordance with the optimization results obtained from RSM with the desired function, verification experiments were carried out at the optimal levels. 2-PE production was 5.09 g/L at the selected optimum conditions, which was 118.5% higher than the value before optimization (2.33 g/L) and the experimental yield was close to the predicted value (5.11 g/L). The predicted results matched well with the experimental results obtained using optimal conditions, which validated the RSM models. Moreover, the molar yield of 2-PE was 0.64, which is similar to previously reported molar yields for other yeasts, such as S. cerevisiae, and P. fermentans (Hua et al. 2010; Huang et al. 2001; Mei et al. 2009). However, this molar yield is lower than that obtained by a fed-batch and continuous process or by applying a two-phase fermentation method (Kim et al. 2014; Wang et al. 2011). Therefore, future research will involve testing a fed-batch and continuous process or by applying a two-phase fermentation method to improve the yield of 2-PE with P. kudriavzevii YF1702.
Conclusion
In this study, a few strains of yeast that produced a high yield of 2-PE were selected from the Baijiu-producing environment. Among them, the P. kudriavzevii YF1702 strain was the best producer of 2-PE, and there are a few studies on the production of 2-PE by P. kudriavzevii. We then used an optimization strategy, including single factor design, PB design, steepest ascent path design and RSM design, to improve 2-PE production by YF1702. After optimization, the 2-PE production was 5.09 g/L, which was a 1.18 times enhancement in 2-PE production when compared with that of the original cultivation conditions used. The following conditions provided the optimal 2-PE yield: 50 g/L glucose, pH 2.3, 6.0 g/L yeast extract, 10.7 g/L L-Phe, 26 °C, shaking speed 210 rpm, loading volume 25.5 mL/250 mL, inoculum size 0.4% (v/v), time point of L-Phe addition 0 h, culturing period 56 h and 32 g/L Tween-60. The research presented in this report should help explore and develop the important microbial resources present in the Baijiu-producing environment.
Acknowledgements
We thank Andrew Dingley for insightful discussions and providing language help. This research was supported by the National Natural Science Foundation of China (No. 31701592, 31830069, and 31671798), General Project of Scientific Research Program of Beijing Municipal Education Commission (grant number KM201910011006/PXM2019_014213_000007) and Quality Construction of Talents Training/First-class Speciality Construction/Food Science and Engineering (PXM2019_014213_000010).
Compliance with ethical standards
Conflict of interest
The authors declare no competing financial interest.
Ethical statement
This article does not contain any studies with human participants or animals performed by any of the authors.
Footnotes
Guangsen Fan and Liujie Cheng contributed equally to this work.
References
- Bialecka-Florjanczyk E, Krzyczkowska J, Stolarzewicz I, Kapturowska A. Synthesis of 2-phenylethyl acetate in the presence of Yarrowia lipolytica KKP 379 biomass. J Mol Catal B-Enzym. 2012;74:241–245. doi: 10.1016/j.molcatb.2011.10.010. [DOI] [Google Scholar]
- Carlquist M, Gibson B, Yuceer YK, Paraskevopoulou A, Sandell M, Angelov AI, Gotcheva V, Angelov AD, Etschmann M, de Billerbeck GM, Liden G. Process engineering for bioflavour production with metabolically active yeasts—a mini-review. Yeast. 2015;32:123–143. doi: 10.1002/yea.3058. [DOI] [PubMed] [Google Scholar]
- Chreptowicz K, Sternicka MK, Kowalska PD, Mierzejewska J. Screening of yeasts for the production of 2-phenylethanol (rose aroma) in organic waste-based media. Lett Appl Microbiol. 2018;66:153–160. doi: 10.1111/lam.12835. [DOI] [PubMed] [Google Scholar]
- Chreptowicz K, Wielechowska M, Glowczyk-Zubek J, Rybak E, Mierzejewska J. Production of natural 2-phenylethanol: from biotransformation to purified product. Food Bioprod Process. 2016;100:275–281. doi: 10.1016/j.fbp.2016.07.011. [DOI] [Google Scholar]
- Eshkol N, Sendovski M, Bahalul M, Katz-Ezov T, Kashi Y, Fishman A. Production of 2-phenylethanol from L-phenylalanine by a stress tolerant Saccharomyces cerevisiae strain. J Appl Microbiol. 2009;106:534–542. doi: 10.1111/j.1365-2672.2008.04023.x. [DOI] [PubMed] [Google Scholar]
- Etschmann M, Bluemke W, Sell D, Schrader J. Biotechnological production of 2-phenylethanol. Appl Microbiol Biot. 2002;59:1–8. doi: 10.1007/s00253-002-0992-x. [DOI] [PubMed] [Google Scholar]
- Etschmann M, Sell D, Schrader J. Screening of yeasts for the production of the aroma compound 2-phenylethanol in a molasses-based medium. Biotechnol Lett. 2003;25:531–536. doi: 10.1023/A:1022890119847. [DOI] [PubMed] [Google Scholar]
- Etschmann M, Sell D, Schrader J. Medium optimization for the production of the aroma compound 2-phenylethanol using a genetic algorithm. J Mol Catal B-Enzym. 2004;29:187–193. doi: 10.1016/j.molcatb.2003.10.014. [DOI] [Google Scholar]
- Etschmann M, Sell D, Schrader J. Production of 2-phenylethanol and 2-phenylethylacetate from L-phenylalanine by coupling whole-cell biocatalysis with organophilic pervaporation. Biotechnol Bioeng. 2005;92:624–634. doi: 10.1002/bit.20655. [DOI] [PubMed] [Google Scholar]
- Eun KM, Chang KS. Optimization of culture conditions for phenylethyl alcohol production by Pichia anomala SKM-T using response surface methodology. Food Sci Biotechnol. 2007;16:159–162. [Google Scholar]
- Fabre CE, Blanc PJ, Goma G. Production of 2-phenylethyl alcohol by Kluyveromyces marxianus. Biotechnol Progr. 1998;14:270–274. doi: 10.1021/bp9701022. [DOI] [PubMed] [Google Scholar]
- Fan GS, Fu ZL, Sun BG, Zhang YH, Wang XL, Xia YQ, Huang MQ, Li XT. Roles of aging in the production of light-flavored Daqu. J Biosci Bioeng. 2019;127:309–317. doi: 10.1016/j.jbiosc.2018.08.005. [DOI] [PubMed] [Google Scholar]
- Fan GS, Fu ZL, Teng C, Wu QH, Liu PX, Yang R, Minhazul KAHM, Li XT. Comprehensive analysis of different grades of roasted-sesame-like flavored Daqu. Int J Food Prop. 2019;22:1205–1222. doi: 10.1080/10942912.2019.1635154. [DOI] [Google Scholar]
- Fan GS, Liu PX, Wu QH, Fu ZL, Cheng LJ, Zhu YT, Zhu YP, Yang R, Li XT. Optimization of cultural conditions for ethyl alcohol production by Saccharomyces cerevisiae YF1914 in aerobic conditions and its aroma-producing characteristics. Sci Technol Food Ind. 2019;40:52–58. doi: 10.13386/j.issn1002-0306.2019.13.009. [DOI] [Google Scholar]
- Fan GS, Sun BG, Xu D, Teng C, Fu ZL, Du YH, Li XT. Isolation and identification of high-yield ethyl acetate-producing yeast from Gujinggong Daqu and its fermentation characteristics. J Am Soc Brew Chem. 2018;76:117–124. doi: 10.1080/03610470.2017.1396849. [DOI] [Google Scholar]
- Fan GS, Yang SQ, Yan QJ, Yan Y, Jiang ZQ. Optimization of xylanase production from Thermomyces lanuginosus CAU44 by solid-state fermentation. Sci Technol Food Ind. 2013;33:219–224. doi: 10.13386/j.issn1002-0306.2012.06.037. [DOI] [Google Scholar]
- Fan WL, Qian MC. Characterization of aroma compounds of Chinese "Wuliangye" and "Jiannanchun" liquors by aroma extract dilution analysis. J Agr Food Chem. 2006;54:2695–2704. doi: 10.1021/jf052635t. [DOI] [PubMed] [Google Scholar]
- Grygier A, Majcher M, Myszka K. Analysis of the ability to form 2-phenylethyl alcohol by Galactomyces geotrichum MK017. Zywnosc. 2015;22:74–83. doi: 10.15193/zntj/2015/100/041. [DOI] [Google Scholar]
- Hao RJ, Zhang QX, Yang WR, Wang J, Pan HT, Cheng TR. Study on the difference in characteristic scent between Prunus mume and its interspecific hybrids. J Nucl Agric Sci. 2014;28:808–816. doi: 10.11869/j.issn.100-8551.2014.05.0808. [DOI] [Google Scholar]
- Hua DL, Lin S, Li YF, Chen H, Zhang ZB, Du Y, Zhang XH, Xu P. Enhanced 2-phenylethanol production from L-phenylalanine via in situ product adsorption. Biocatal Biotransfor. 2010;28:259–266. doi: 10.3109/10242422.2010.500724. [DOI] [Google Scholar]
- Hua DL, Xu P. Recent advances in biotechnological production of 2-phenylethanol. Biotechnol Adv. 2011;29:654–660. doi: 10.1016/j.biotechadv.2011.05.001. [DOI] [PubMed] [Google Scholar]
- Huang CJ, Lee SL, Chou CC. Production and molar yield of 2-phenylethanol by Pichia fermentans L-5 as affected by some medium components. J Biosci Bioeng. 2000;90:142–147. doi: 10.1263/jbb.90.142. [DOI] [PubMed] [Google Scholar]
- Huang CJ, Lee SL, Chou CC. Production of 2-phenylethanol, a flavor ingredient, by Pichia fermentans L-5 under various culture conditions. Food Res Int. 2001;34:277–282. doi: 10.1016/S0963-9969(00)00164-2. [DOI] [Google Scholar]
- Huang XP, Huang GC, Liu L, Xiong DW, Zhang T. The optimization of bioconversion conditions for the production of 2-phenylethanol with Saccharomyces cerevisiae SH003. Food Res Dev. 2015;36:154–158. doi: 10.3969/j.issn.1005-6521.2015.22.040. [DOI] [Google Scholar]
- Kernon J, Skelton L. Current issues in European and US federal food regulations. Trends Food Sci Tech. 1993;4:203–209. doi: 10.1016/0924-2244(93)90152-Z. [DOI] [Google Scholar]
- Kim B, Cho BR, Hahn JS. Metabolic engineering of Saccharomyces cerevisiae for the production of 2-Phenylethanol via Ehrlich pathway. Biotechnol Bioeng. 2014;111:115–124. doi: 10.1002/bit.24993. [DOI] [PubMed] [Google Scholar]
- Kirm I, Medina E, Rodriguez X, Cesteros Y, Salagre P, Sueiras JE. Preparation of 2-phenylethanol by catalytic selective hydrogenation of styrene oxide using palladium catalysts. J Mol Catal A-Chem. 2005;239:215–221. doi: 10.1016/j.molcata.2005.06.032. [DOI] [Google Scholar]
- Lima LAD, Diniz RHS, Queiroz MVD, Fietto LG, Silveira WBD. Screening of yeasts isolated from Brazilian environments for the 2-phenylethanol (2-PE) production. Biotechnol Bioproc E. 2018;23:326–332. doi: 10.1007/s12257-018-0119-6. [DOI] [Google Scholar]
- Lu XY, Wang YQ, Zong H, Ji H, Zhuge B, Dong ZL. Bioconversion of L-phenylalanine to 2-phenylethanol by the novel stress-tolerant yeast Candida glycerinogenes WL2002-5. Bioengineered. 2016;7:418–423. doi: 10.1080/21655979.2016.1171437. [DOI] [PMC free article] [PubMed] [Google Scholar]
- Martinez-Avila O, Sanchez A, Font X, Barrena R. Bioprocesses for 2-phenylethanol and 2-phenylethyl acetate production: current state and perspectives. Appl Microbiol Biot. 2018;102:9991–10004. doi: 10.1007/s00253-018-9384-8. [DOI] [PubMed] [Google Scholar]
- Martinez-Avila O, Sanchez A, Font X, Barrena R. Fed-batch and sequential-batch approaches to enhance the bioproduction of 2-phenylethanol and 2-phenethyl acetate in solid-state fermentation residue-based systems. J Agr Food Chem. 2019;67:3389–3399. doi: 10.1021/acs.jafc.9b00524. [DOI] [PubMed] [Google Scholar]
- McGinty D, Letizia CS, Api AM. Fragrance material review on phenethyl butyrate. Food Chem Toxicol. 2012;502:S398–S401. doi: 10.1016/j.fct.2012.02.061. [DOI] [PubMed] [Google Scholar]
- Mei JF, Min H, Lue ZM. Enhanced biotransformation of L-phenylalanine to 2-phenylethanol using an in situ product adsorption technique. Process Biochem. 2009;44:886–890. doi: 10.1016/j.procbio.2009.04.012. [DOI] [Google Scholar]
- Mierzejewska J, Tymoszewska A, Chreptowicz K, Krol K. Mating of 2 laboratory Saccharomyces cerevisiae strains resulted in enhanced production of 2-phenylethanol by biotransformation of l-phenylalanine. J Mol Microb Biotech. 2017;27:81–90. doi: 10.1159/000455169. [DOI] [PubMed] [Google Scholar]
- Nomura K, Ogura H, Imanishi Y. Direct synthesis of 2-phenylethanol by hydrogenation of methyl phenylacetate using homogeneous ruthenium-phosphine catalysis under low hydrogen pressure. J Mol Catal A-Chem. 2001;166:345–349. doi: 10.1016/S1381-1169(00)00476-3. [DOI] [Google Scholar]
- Okuniewska P, Domanska U, Wieckowski M, Mierzejewska J. Recovery of 2-phenylethanol from aqueous solutions of biosynthesis using ionic liquids. Sep Purif Technol. 2017;188:530–538. doi: 10.1016/j.seppur.2017.07.071. [DOI] [Google Scholar]
- Sendovski M, Nir N, Fishman A. Bioproduction of 2-phenylethanol in a biphasic ionic liquid aqueous system. J Agr Food Chem. 2010;58:2260–2265. doi: 10.1021/jf903879x. [DOI] [PubMed] [Google Scholar]
- Seo WT, Ahn KC. Production of phenylethanol from l-phenylalanine by Candida sp S-8. Food Sci Biotechnol. 2003;12:644–648. [Google Scholar]
- Shi WK, Wang J, Chen FS, Zhang XY. Effect of Issatchenkia terricola and Pichia kudriavzevii on wine flavor and quality through simultaneous and sequential co-fermentation with Saccharomyces cerevisiae. LWT Food Sci Technol. 2019;116:108477. doi: 10.1016/j.lwt.2019.108477. [DOI] [Google Scholar]
- Shu CH, Chen YJ, Nirwana WOC, Cahyani C. Enhanced bioconversion of l-phenylalanine into 2-phenylethanol via an oxygen control strategy and in situ product recovery. J Chem Technol Biot. 2018;93:3035–3043. doi: 10.1002/jctb.5662. [DOI] [Google Scholar]
- Smith J, Dransfield J. European and US federal food regulations: current issues. Trends Food Sci Tech. 1991;2:236–240. doi: 10.1016/0924-2244(91)90703-L. [DOI] [Google Scholar]
- Stark D, Munch T, Sonnleitner B, Marison IW, von Stockar U. Extractive bioconversion of 2-phenylethanol from l-phenylalanine by Saccharomyces cerevisiae. Biotechnol Progr. 2002;18:514–523. doi: 10.1021/bp020006n. [DOI] [PubMed] [Google Scholar]
- Stark D, Zala D, Munch T, Sonnleitner B, Marison IW, von Stockar U. Inhibition aspects of the bioconversion of l-phenylalanine to 2-phenylethanol by Saccharomyces cerevisiae. Enzyme Microb Tech. 2003;32:212–223. doi: 10.1016/S0141-0229(02)00237-5. [DOI] [Google Scholar]
- Suastegui M, Shao Z. Yeast factories for the production of aromatic compounds: from building blocks to plant secondary metabolites. J Ind Microbiol Biot. 2016;43:1611–1624. doi: 10.1007/s10295-016-1824-9. [DOI] [PubMed] [Google Scholar]
- Tian X, Ye R, Wang JW, Chen YF, Cai BG, Guan SM, Rong SF, Li QQ. Effects of aroma quality on the biotransformation of natural 2-phenylethanol produced using ascorbic acid. Electron J Biotechn. 2015;18:286–290. doi: 10.1016/j.ejbt.2015.05.003. [DOI] [Google Scholar]
- Wang DW, Ma YS, Li N, Jin FS. Influence of aging time on aroma components and full-bodied flavor of fermented Lentinula edodes wine. Food Sci. 2016;37:80–85. doi: 10.7506/spkx1002-6630-201614014. [DOI] [Google Scholar]
- Wang H, Dong Q, Meng C, Shi XA, Guo Y. A continuous and adsorptive bioprocess for efficient production of the natural aroma chemical 2-phenylethanol with yeast. Enzyme Microb Tech. 2011;48:404–407. doi: 10.1016/j.enzmictec.2011.01.006. [DOI] [PubMed] [Google Scholar]
- Wang L, Jiang W, Liu YM, Liu X, Wang DL, Song HL, Liu MY. Analysis of aroma-active compounds in hop by GC–O–MS. Chin J Anal Lab. 2015;34:640–644. doi: 10.13595/j.cnki.issn1000-0720.2015.0139. [DOI] [Google Scholar]
- Xu D, Fan GS, Fu ZL, Ma C, Sun XT, Yang R, Sun BG, Li XT. Screening of a high-yield beta-phenylethanol yeast and optimization of its cultural conditions. Sci Technol Food Ind. 2017;38:151–158. doi: 10.13386/j.issn1002-0306.2017.05.020. [DOI] [Google Scholar]
- Yadav GD, Lawate YS. Hydrogenation of styrene oxide to 2-Phenyl ethanol over polyurea microencapsulated mono- and bimetallic nanocatalysts: sctivity, selectivity, and kinetic modeling. Ind Eng Chem Res. 2013;52:4027–4039. doi: 10.1021/ie302587j. [DOI] [Google Scholar]
- Zhao CQ, Yan XL, Yang ST, Chen FF. Screening of Bacillus strains from Luzhou-flavor liquor making for high-yield ethyl hexanoate and low-yield propanol. Lwt-Food Sci Technol. 2017;77:60–66. doi: 10.1016/j.lwt.2016.11.035. [DOI] [Google Scholar]
- Zhao DR, Zhang LM, Zhang FG, Sun JY, Sun XT, Huang MQ, Zheng FP, Sun BG. Analysis of sulfur-containing compounds in sesame-flavor Chinese liquor by solid phase microextraction and liquid-liquid extraction coupled with GC–MS. Food Sci. 2016;37:99–106. doi: 10.7506/spkx1002-6630-201622014. [DOI] [Google Scholar]
- Zhou WJ, Wang P, Zhan P, Tian HL. Screening and identification of flavor characteristics of three pear wines based on odor activity value using partial least squares regression. Food Sci. 2017;38:138–143. doi: 10.7506/spkx1002-6630-201714021. [DOI] [Google Scholar]
- Zhou WJ, Zhang F, Wang P, Zhan P, Tian HL. GC-MS/GC-O combined with chemometrics for the screening and identification of aroma characteristics of Korla pear wine. Food Sci. 2018;39:222–227. doi: 10.7506/spkx1002-6630-201810034. [DOI] [Google Scholar]