

Abstract
Metastable phenotypic state transitions in cancer cells can lead to the development of transient adaptive resistance or tolerance to chemotherapy. Here, we report that the acquisition of a phenotype marked by increased abundance of CD44 (CD44Hi) by breast cancer cells as a tolerance response to routinely used cytotoxic drugs, such as taxanes, activated a metabolic switch that conferred tolerance against unrelated standard-of-care chemotherapeutic agents, such as anthracyclines. We characterized the sequence of molecular events that connected the induced CD44Hi phenotype to increased activity of both the glycolytic and oxidative pathways and glucose flux through the pentose phosphate pathway (PPP). When given in a specific order, a combination of taxanes, anthracyclines, and inhibitors of glucose-6-phosphate dehydrogenase (G6PD), an enzyme involved in glucose metabolism, improved survival in mouse models of breast cancer. The same sequence of the three-drug combination reduced the viability of patient breast tumor samples in an explant system. Our findings highlight a convergence between phenotypic and metabolic state transitions that confers a survival advantage to cancer cells against clinically used drug combinations. Pharmacologically targeting this convergence could overcome cross-drug tolerance and could emerge as a new paradigm in the treatment of cancer.
INTRODUCTION
The development of drug resistance is a major cause of cancer mortality(1). The classical model of non-reversible drug resistance is built on Darwinian principles of natural selection of acquired heritable mutations(2). However, newer models have highlighted that drug resistance can evolve from non-mutational dynamics, mainly caused by tumor heterogeneity(1, 3). For example, cancer stem cells (CSCs) can confer intrinsic resistance to chemotherapy(4). Other evidence implicates dynamic phenotypic heterogeneity, which can be induced and molecularly ‘re-trained’ by chemotherapy to result in the acquisition of drug-tolerant states (5–7). In an effort to thwart acquired resistance, clinicians combine drugs into single regimens, especially in aggressive diseases such as triple negative breast cancer (TNBC) (8, 9). However, these efforts too often fail, and the mechanisms of drug-induced adaptive resistance or tolerance to combinations of drugs is poorly elucidated.
Dysregulated metabolism is a hallmark of tumorigenesis. Tumor metabolism is characterized by respiratory insufficiency and a dependence on glycolysis and lactate production, which is defined as the Warburg effect(10–12). Together with increased glutamine uptake and glutaminolysis, this dysregulated glycolytic state supports the production of precursors for biological macromolecule biosynthesis that facilitate tumor progression(13). Oncogenic pathways underlie this intrinsic metabolic state(14). The contribution of dysregulated metabolic phenotypes in drug tolerance and therapy failure is less understood.
We have previously shown that treatment of breast cancer cells with taxanes can induce a phenotypic transition, converting a CD44Lo to CD44Hi phenotype and conferring a transient tolerance to taxanes(5, 15), which we characterized using mathematical models as a metastable hybrid state(16). These drug-tolerant cells are cross-tolerant to other classes of drugs such as anthracyclines (doxorubicin). This attains clinical importance because the combination of taxanes and anthracyclines is the mainstay of chemotherapy in multiple subtypes of breast cancer, including first-line chemotherapy for aggressive types such as TNBC (17). Here, using in vitro and in vivo experiments, mathematical modeling, and clinical explant studies, we interrogated the molecular signaling effort that drives cross-drug tolerance, and provided new potential therapeutic strategies and molecular inhibitors that could thwart combination drug resistance. We demonstrated that the phenotypic cell state transition induced by taxanes resulted in metabolic reprogramming characterized by enhanced glycolytic and oxidative respiration in breast cancer cells. We showed that a 3-drug schedule that disrupted this metabolic network conferred a vulnerability to specific drug combinations, suggesting that metabolic inhibitors could emerge as an approach towards overcoming chemotherapy tolerance and increase the efficacy of current combination therapy. This study establishes a network that interconnects phenotypic plasticity and metabolic state transitions underlying chemotherapy cross-drug tolerance.
RESULTS
Adaptive resistance to taxanes drives cross-tolerance
TNBC is a challenging disease to treat due to the limited repertoire of drugs that are active against it, which includes emerging immunotherapies that have yet to show durable effect (18). A report at the 2018 American Society of Clinical Oncology (ASCO) Annual Meeting showed that treating TNBC patients with taxanes before anthracyclines in combination regimen improves response and survival(19), yet this ‘optimal’ sequence of drugs still results in a high rate of relapse (17). To examine combination therapy resistance that develops when drugs are applied in optimal schedules, we tested the effect of different schedules of taxanes and anthracyclines in vitro, confirming clinical evidence that docetaxel treatment prior to doxorubicin treatment most effectively eliminates TNBC cells, although this left a significant proportion of cells viable (Fig. 1A). We have reported that taxanes can induce a transient resistance, which produces what we defined as drug-tolerant cancer cells (DTCCs) that can evade pressure from a single drug (Fig. S1A)(5). We previously characterized the DTCCs as a metastable CD44HiCD24Hi phenotype, which arise from CD44LoCD24Lo cancer cells, and that can acquire tolerance to taxanes by transiently evolving into the phenotypically-altered state (5, 16). However, we have yet to understand whether phenotypic transitioning can also confer cross-drug resistance or tolerance to multiple unrelated but clinically-relevant combination therapies.
Figure 1. DTCCs exhibit increased glycolysis and oxidative respiration.
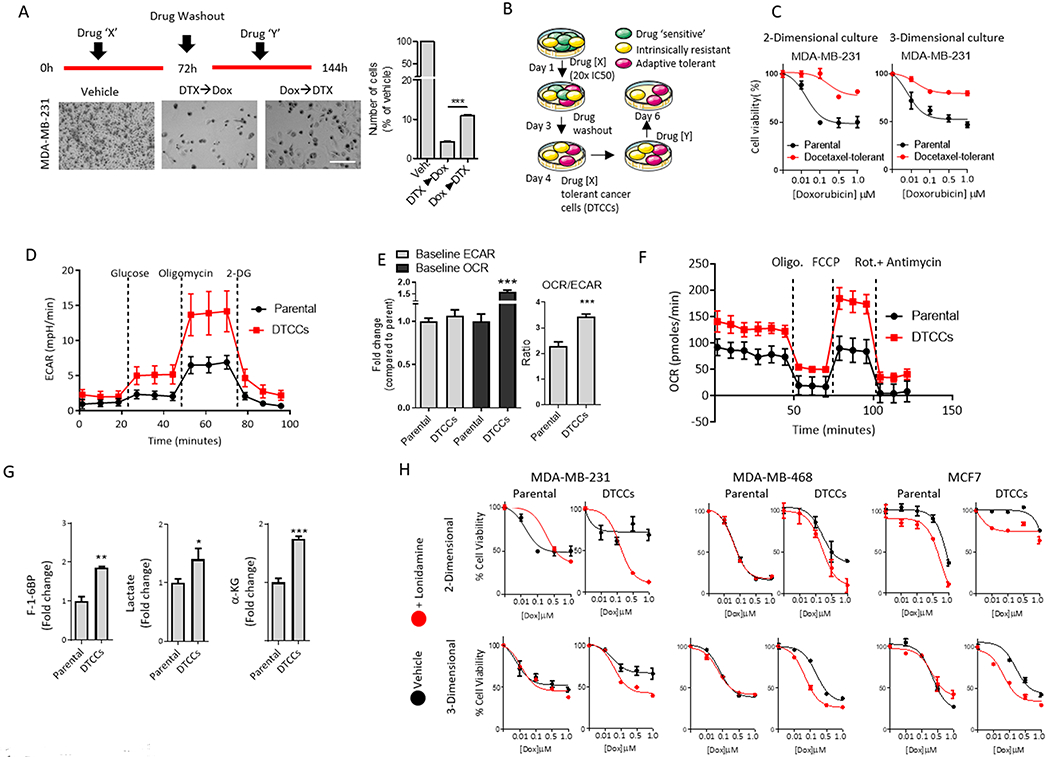
(A) Representative brightfield microscopy images of TNBC MDA-MB-231 cells treated with a combination of docetaxel (DTX) and doxorubicin (Dox), administered in specific temporal order (see schematic above bright-field images). Histogram quantifies the percentage of residual cells in each treatment group compared to vehicle-treated (Veh.) arm. Scale bar=50μm. Data shown are mean ± SEM of N>3 biological replicates per group ***p<0.001 by t-test. (B) Schematic illustrates the generation of DTCCs. After treatment with a high-dose of primary agent (drug X=taxane), the subset of drug tolerant cancer cells (DTCCs) was selected. Re-treatment of DTCCs with drug Y was performed to test for cross-drug tolerance. (C) Viability curve for parental cells and DTCCs in response to doxorubicin treatment in 2-D and 3-D cell cultures. Data represents mean ± SEM (N>15 biological replicates per group). (D) Bioenergetics trace from Seahorse analysis shows the glycolysis stress test in MDA-MB-231 parental cells or DTCCs exposed to D-Glucose (12 mM), Oligomycin (1 μM) and 2-Deoxyglucose (50 mM). N=5 biological replicates per group. (E) Ratio of baseline OCR and ECAR demonstrate relative levels of oxygen consumption in MDA-MB-231 parental cells and DTCCs in glucose-containing medium. N=5 biological replicates per group. ***p<0.001 by t-test. (F) Bioenergetics trace from Seahorse XF24 analysis shows the mitochondrial stress test in MDA-MB-231 parental or DTCCs exposed to oligomycin (1 μM), FCCP (1 μM), Rotenone/antimycin (1 μM). N=5 biological replicates per group. (G) Total pooled metabolites were analyzed by LC/MS. Histograms show the fold change in the ratio of each metabolite pool to total protein from each cell line. N=3 biological replicates per group, ***p<0.001, **p<0.01 by t-test. F-1-6BP, fructose 1,6-bisphosphate. α-KG, α-ketoglutarate. (H) Viability curves for multiple breast cancer cell lines in a drug naïve state (parental) or drug tolerant state induced by docetaxel exposure (DTCCs). Cells were cultured in either 2-D or 3-D models and subsequently treated with doxorubicin in the presence or absence of the glucose metabolism inhibitor lonidamine (100 μM). N>10 biological replicates per group.
Using two- and three-dimensional (2-D and 3-D, respectively) (20) cultures of cells that have acquired a tolerance to taxane chemotherapy (taxane-DTCCs) or drug naïve parental cells, we tested cross-sensitivity to another anthracycline, doxorubicin (Fig. 1B). DTCCs exhibited cross-tolerance to doxorubicin at clinically relevant concentrations as evidenced by the shift in the concentration-response curves to the right (Fig. 1C and S1B), which is not an effect of P-glycoprotein-mediated drug efflux because P-glycoproteins are not over-expressed in DTCCs (5). Similarly, prostate cancer cells (DU-145) that were treated with cabazitaxel exhibited cross-drug tolerance to both doxorubicin and 5FU (Fig. S1C). This cross-tolerance is clinically important because these drugs are routinely used in combination regimens (9, 21, 22).
A drug-induced metabolic cell state shift drives adaptive cross-drug tolerance
Given the pervasive linkage between metabolism and resistance (23, 24), we wanted to investigate the metabolic phenotype of DTCCs. We found that ATP content was increased as determined by colorimetric detection of a byproduct of glycerol phosphorylation, and glucose uptake was significantly increased compared to that in parental cancer cells, as evidenced from the influx rate of 2-(N-(7-Nitrobenz-2-oxa-1,3-diazol-4-yl) amino)-2-Deoxyglucose (2-NBDG) (Fig. S1D,E). Next, we characterized glycolysis and oxidative respiration by measuring the extracellular acidification rate (ECAR) and oxygen consumption rate (OCR). Glucose-starved parental cancer cells or DTCCs were exposed to glucose, treated with the ATP synthase inhibitor oligomycin, and treated with the glucose analog 2-DG to suppress glycolytic activity. DTCCs displayed augmented ECAR in the presence of glucose and inhibitors of oxidative phosphorylation as compared to parental cancer cells (Fig.1D). Furthermore, completely eliminating mitochondrial activity with targeted inhibitors of ATP, OXPHOS uncoupling and complex I/III disruption (oligomycin, FCCP and rotenone/antimycin, respectively) resulted in changes in ECAR that suggested a shift in bioenergetics towards glycolysis in DTCCs compared to parental cells (Fig. S1F). We then analyzed mitochondrial bioenergetics by detecting OCR. DTCCs displayed an increase in the OCR/ECAR ratio compared to drug naïve parental cells (Fig.1E). The combination of oligomycin and FCCP resulted in a substantially higher OCR in DTCCs than in parental cells (Fig. 1F, Fig. S1G), suggesting that mitochondria in DTCCs were more functional and exhibited greater plasticity under stress. To test these findings, we traced a stable carbon isotope 13C6 D-glucose through glycolysis, using liquid chromatography in tandem with mass spectrometry (LC/MS). After normalizing to total protein in each cell line, we detected an increase in pooled metabolites of glycolysis metabolism, specifically fructose 1,6-bisphosphate and lactate, as well as the TCA cycle intermediate α-ketoglutarate (α-KG), in the DTCCs compared to parental cells (Fig. 1G). Supporting these findings, fractional labeling of glutamate and α-KG at steady state revealed an increased contribution of glucose to TCA cycle intermediates in DTCCs compared to parental cells (Fig. S1H).
Finally, we tested whether this altered metabolic phenotype contributed to the adaptive cross-drug tolerance to doxorubicin in DTCCs. We used a pharmacological inhibitor of glucose metabolism, lonidamine(25, 26), which alone minimally affected the viability of parental or taxane-DTCCs (Fig. S2A). In contrast, across multiple cell lines in 2-D and 3-D in vitro cultures, the combination of lonidamine with doxorubicin resulted in significantly increased cell death in taxane-DTCCs as compared with treatment of doxorubicin alone, implicating the augmented metabolic state of DTCCs in cross-drug tolerance to doxorubicin (Fig.1H and Fig. S2B). A similar observation was made with DU-145 cabazitaxel-DTCCs, which were significantly more sensitive to the combination of cytotoxic drugs and lonidamine than parental cells (Fig. S2C).
A sequentially-activated signaling network drives drug-induced phenotypic and metabolic reprogramming
To study the link between phenotypic plasticity and metabolic re-reprogramming under drug pressure, we exposed cells to an acute, sublethal dose of docetaxel (Fig. 2A), which allowed us to dissect signaling mechanisms without the potential confounding effect of changes in cell numbers or selection of a subtype of cells(5). Flow cytometry showed that CD44 expression was induced as an early response within 4 hours of drug exposure. In contrast, glucose uptake was a delayed response, which did not increase until 24 hours of drug exposure (Fig. 2B). An immunoarray over the same drug dose and time course revealed that the expression of a set of cytokines implicated in cell host-responses such as interferon gamma (IFN-γ), granulocyte-macrophage colony-stimulating factor (GM-CSF) and interleukin-23 (IL-23) was evident within 4 hours (Fig. 2C). The increase in CD44 expression occurred in drug naïve parental cells upon exposure to recombinant IFN-γ, GM-CSF, or IL-23 (Fig. S3A). Furthermore, inhibition of cytokine-induced NFκb signaling with Bay-11 or neutralizing antibodies targeting IFN-γ, GM-CSF and IL-23 returned the taxane-induced CD44 expression to baseline (Fig. 2D). These data suggested that the cytokine-mediated cell host-response could be involved in the phenotypic cell state transition as a result of CD44 induction.
Figure 2. Drug-induced CD44 expression is implicated in glucose uptake through scaffold-dependent AKT activation.
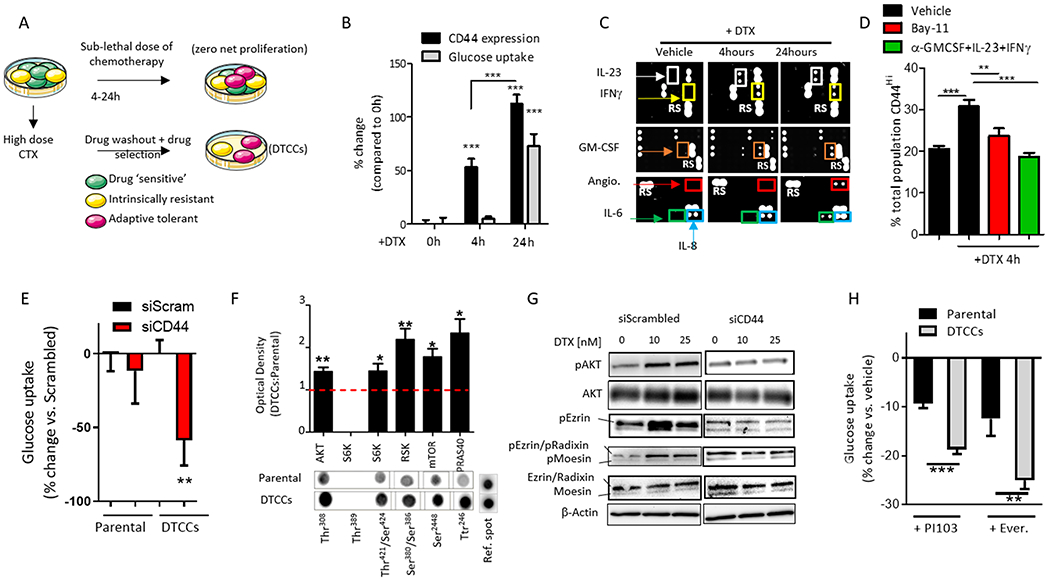
(A) Schematic shows in vitro experimental design used to study phenotypic state transitions induced by short exposure to chemotherapy (CTX) at time points that result in a net 0 proliferation rate. (B) Quantification of cell surface CD44 expression (black bars) or glucose uptake (grey bars) in MDA-MB-231 cells exposed to a sub-lethal dose of docetaxel (DTX, 25 nM) for 4 hours and 24 hours, as determined by flow cytometry and expressed as mean fluorescent intensity (% increase compared to 0 hours). N=5 biological replicates per group. ***p<0.001 by One-way ANOVA. (C) Representative images of a cytokine and chemokine immunoarray of parental MDA-MB-231 cells treated with a sub-lethal dose of DTX (25 nM) for 4 hours and 24 hours. N=4 biological replicates per group. (D) Quantification of CD44 cell surface expression by flow cytometry on MDA-MB-231 cells treated with DTX (25nM, 4h) +/− the NFκB inhibitor Bay-11 (10 μM) or neutralizing antibodies (2 μg/ml). N=5 biological replicates per group. **p<0.01, ***p<0.001 determined by One-way ANOVA. (E) Quantification of 2-NBDG (glucose) uptake in MDA-MB-231 parental cells or DTCCs transfected with siRNA targeting CD44 or a scrambled control, as determined by flow cytometry and expressed as the % change compared to scrambled control. N>3 biological replicates per group. **p<0.01 by t-test. (F) Quantification of the phosphorylation of the indicated proteins in MDA-MB-231 parental cells or DTCCs. Values indicate the optical density of phosphorylated residues from an immunoarray normalized to total protein content and expressed as a ratio of Parental:DTCCs. Lower panels show a representative immunoarray image including the reference spots for the membrane. N=4 biological replicates per group. *p<0.05 **p<0.01 by One-way ANOVA. (G) Representative Western blot of phosphorylated (p) and total protein levels in MDA-MB-231 cells treated with a sub-lethal dose DTX (10 nM or 25 nM for 24 hours) following transfection with siRNA targeting CD44 or scrambled control. N=3 biological replicates per group. (H) Quantification of 2-NBDG (glucose) uptake by flow cytometry in MDA-MB-231 parental cells or DTCCs incubated with the PI3K inhibitor PI103 or the mTORC1 inhibitor everolimus (Ever.) for 3 hours. Values are expressed as % change from vehicle-treated control group for the cell line. N>4 biological replicates per group, ***p<0.001 **p<0.01 by t-test.
A second set of cytokines related to oxidative stress (IL-8, IL-6 and angiogenin) (27) were increased at the later time point (24 hours), similar to drug-induced glucose uptake (Fig. 2C), a finding that was supported by a fluorescent reporter for oxidative stress (Fig. S3B). Although certain cytokines can drive glucose uptake in a cell autonomous fashion(28), we determined that none of the cytokines identified in the array (IFN-γ, GM-CSF, IL-23, IL-8 and IL-6) were independently capable of increasing glucose uptake in the drug naïve parental cells even after 24 hours of incubation (Fig. S3C). A microarray confirmed the induction of the mRNAs encoding specific transcription factors in cancer cells in response to docetaxel pressure at early and late time-points (Fig. S3D). These results implicate a network of proteins in driving the metabolic switch in a sequentially-activated fashion.
To study the functional relationships and interdependence of the drug-induced metastable phenotype and metabolic switch we used siRNA-directed knockdown of CD44, which significantly blocked glucose uptake in the DTCCs compared to parental cells (Fig. 2E). CD44 is associated with the phosphoinositide 3-kinase (PI3K)/Akt pathway (29), a regulator of glucose and metabolic homeostasis(30), which was activated in DTCCs (Fig. 2F). Knockdown of CD44 attenuated drug-induced Akt activity (Fig. S3E) and the activation of the ezrin/radixin/moesin (ERM) complex (31) under docetaxel pressure (Fig. 2G, Fig. S3F). Activated ezrin and Akt together promote the epithelial-mesenchyme transition (32). Finally, pharmacological inhibitors of PI3K (PI103) or downstream mTORC1 (everolimus) decreased glucose uptake in DTCCs to a greater degree than in the parental population (Fig. 2H), suggesting a reliance on this signaling network in DTCCs for glucose metabolism.
Enhanced mitochondrial respiration and redox homeostasis characterize the drug-tolerant cell phenotype
Highly metabolic mitochondria drive reactive oxygen species (ROS) generation (33). Because oxygen consumption was high in DTCCs (Fig. 1E), we used a mitochondrial fluorogenic probe (MitoSOX) to determine whether acquired tolerance to chemotherapy correlated with superoxide O2− production at the single cell level (Fig. 3A). We determined that survival to taxane chemotherapy was associated with an early (4-8 hours) burst of ROS production (Fig. 3B). Supporting this finding, DTCCs exhibited enhanced oxidative and reductive stress compared to parental cells, as determined by CM-DCFDA fluorescence and nitroreductase activity assay, respectively (Fig. 3C). Indeed, the increase in ROS was time-dependent (Fig. 3D). We found that DTCCs showed elevated expression of peroxisome proliferator activated receptor gamma coactivator 1 alpha (PGC1α) (34) (Fig. 3E) and increased number and size of mitochondria, as determined by electron microscopy (Fig. 3F), suggesting an increase in mitochondrial biogenesis (35). Finally, we treated the DTCCs with diphenylene iodonium (DPI), a non-specific inhibitor of flavoproteins that also inhibits NADPH oxidase (NOX) (36, 37). We observed that ROS was significantly reduced in DTCCs compared to parental cells in the presence of DPI (Fig. S4A), which coincided with the decrease in the expression of pro-oxidant cytokines at the later time point (Fig. S4B).
Figure 3. An oxidative burst and mitochondrial plasticity drive a glucose shunt towards the PPP, leading to a cross-drug tolerant phenotype.
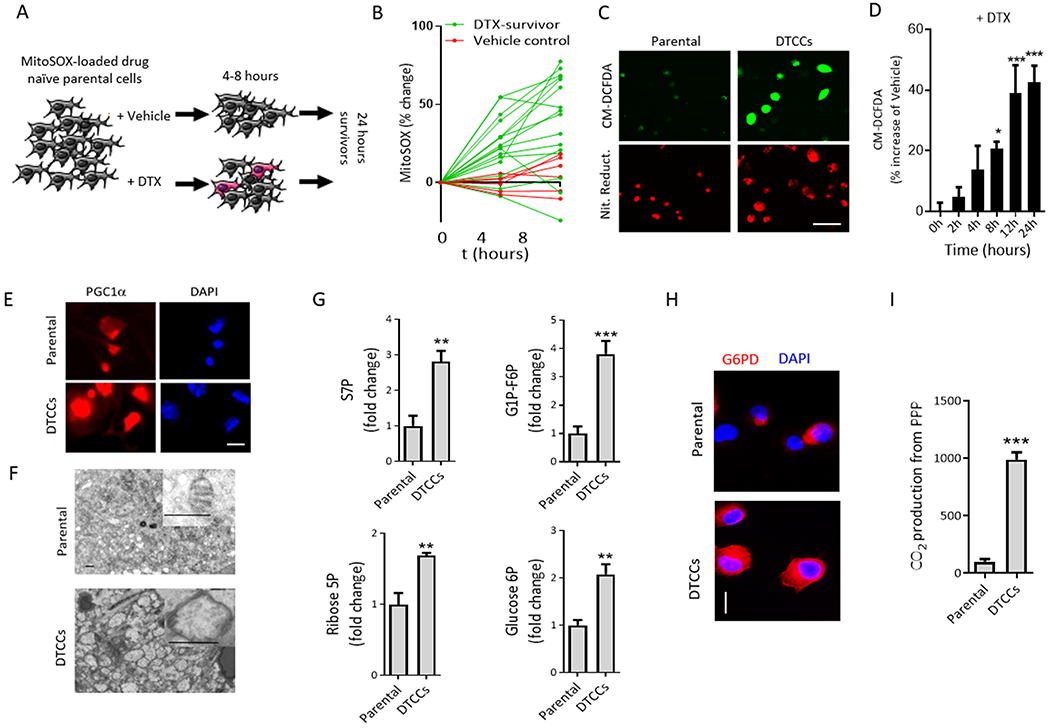
(A) Schematic to measure mitochondrial superoxide in MDA-MB-231 parental cells following exposure to a lethal concentration of docetaxel (DTX) (50 nM). (B) The fluorescence of the mitochondrially-localized probe MitoSOX was quantified and plotted. Cells that remained viable at 24 hours post-chemotherapy were termed DTX-survivors (green lines) compared with the vehicle control group (red lines). Each line is a single cell. (C) Representative images of fluorescent probes for ROS (CM-DCFDA) or reductive stress (Nitro Reductase, Nit. Reduct.) in drug naïve parental cells or DTCCs. N=3 biological replicates per group. Scale bar=50 μm. (D) Intracellular ROS in MDA-MB-231 cells exposed to a sublethal dose of DTX (25 nM) quantified with flow cytometry of CM-DCFDA fluorescence. N>5 biological replicates per group. *p<0.05 ***p<0.001 by One-way ANOVA. (E) Representative immunofluorescent images of PGC1α in MDA-MB-231 parental cells () or DTCCs. N=3 biological replicates per group. Scale bar=12 μm. (F) Representative electron microscopy images show MDA-MB-231 parental cells or DTCCs. Inset shows representative mitochondria from each cell line. N>3 biological replicates per group. Scale bar=500 nm. (G) Total pooled metabolites were analyzed by LC/MS. Histograms show the fold change in the ratio of each metabolite pool to total protein from each cell line. N=3 biological replicates per group. ***p<0.001, **p<0.01 by t-test. (H) Representative fluorescent microscopy images show G6PD in MDA-MB-231 parental cells or DTCCs. N=3 biological replicates per group. Scale bar=25 μm. (I) Relative PPP rates were obtained by measuring the differences between radiolabeled CO2 released after cells incubated with (6-14C) glucose from the CO2 released from (1-14C) glucose. N=3 biological replicates per group. **p<0.01 by t-test.
ROS and AKT may coordinately drive glucose into the pentose phosphate pathway in drug-tolerant cells
High levels of ROS can lead to cell damage and death(38), but DTCCs were viable. Cells can survive high ROS levels by invoking antioxidant pathways. Treatment with the antioxidant TEMPOL and a mitochondrially-targeted version (Mito-TEMPOL) increased the fraction of DTCCs (Fig. S4C), consistent with previous evidence that ROS contributes to taxane-induced cell death (39). We hypothesized that DTCCs could cope better with increased environmental ROS than parental cells. Therefore, we tested the buffering capacity of parental cells and DTCCs by measuring intracellular ROS in the presence of nitroprusside, which inhibits superoxide dismutase (40), or 3-amino-1,2,4-triazole (3-AT), which inhibits catalase (41). CM-DCFDA fluorescence revealed that both nitroprusside and 3-AT increased ROS in DTCCs to a significantly greater extent than parental cells (Fig. S4D). We next tested the role of the pentose phosphate pathway (PPP), which increases the intracellular levels of reduced glutathione (GSH), a robust antioxidant(11). First, the incorporation of radiolabeled C14 glucose into RNA was increased in DTCCs compared to parental cells, which was suppressed by inhibiting glucose metabolism with lonidamine (Fig. S4E). Second, LC/MS revealed an increase in glycolytic analytes, including intermediate PPP sugars, ribose 5-P and sedoheptulose 7-P (S7P) in DTCCs compared to parental cells (Fig. 3G). Third, immunofluorescence analysis showed that GP6D expression was increased in DTCCs compared to parental cells (Fig. 3H). Fourth, using 5,5’-dithio-bis(2-nitrobenzoic acid) (DTNB)-based enzymatic recycling, we observed that the global ratio of GSH to glutathione disulfide (GSSG) was higher in DTCCs than in parental cells (Fig. S4F), which was blunted by treatment with catalase(42) or PI103 (Fig. S4G). Finally, analysis of PPP activity showed an increased contribution of C1 compared to C6 CO2 arising from the PPP in DTCCs (Fig. 3I). These data suggest that the temporally activated, drug-induced signaling network is connected to a burst of glucose metabolism that supports a recalibrated redox state in part due to increased activity of the PPP.
HIF1α-driven Glut1 expression contributes to drug-induced glucose metabolism in DTCCs
We next studied transcription factors associated with increased oxidative stress. Hypoxia-inducible factor 1 alpha (HIF1α) is activated by ROS (43) and affects glucose uptake by transcriptionally activating the expression of Glut1, which encodes a glucose transporter (44). Confocal imaging revealed that the increase in HIF1α abundance and nuclear localization correlated with ROS levels in DTCCs but not in parental cells, an effect that was attenuated by catalase (Fig. 4A–C). Furthermore, Western blotting revealed a time-dependent increase in Glut1 expression upon drug exposure, which was abrogated with siRNA-mediated knockdown of HIF1α (Fig. 4D, Fig. S5A). Knockdown of HIF1α also decreased glucose uptake in DTCCs (Fig. S5B). Furthermore, subcellular fractionation revealed increased Glut1 surface expression in DTCCs compared to parental cells, an increase that was stunted by an AKT inhibitor or CD44 siRNA (Fig. 4E). Together, these data help to establish a signaling mechanism that drives a temporally-induced network and results in a metabolic switch and cross-drug tolerant phenotype (Fig. 4F).
Figure 4. HIF1-α augments glucose shunt through Glut1 expression.
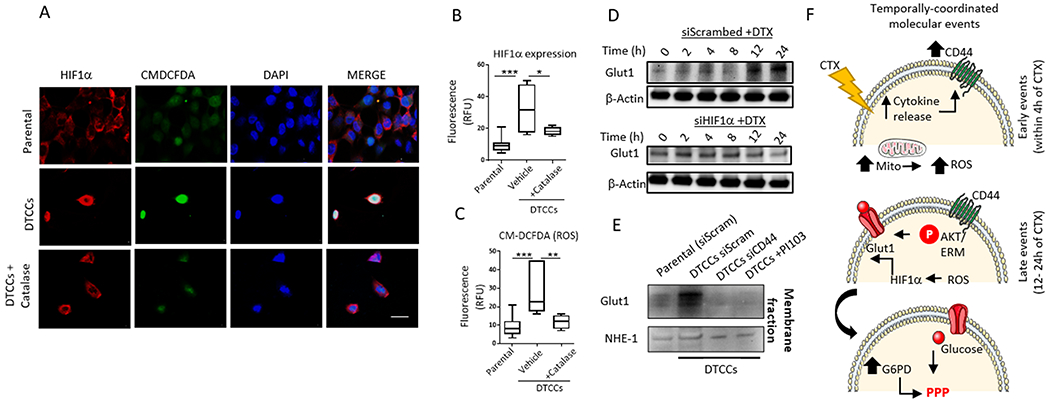
(A) Representative confocal microscopy shows expression and localization of HIF1α and reactive oxygen species (as detected by CM-DCFDA) in MDA-MB-231 parental cells or DTCCs in the presence or absence of the antioxidant catalase. N=3 biological replicates per group. Scale bar = 12 μm. (B-C) Quantification of fluorescence signal intensity from confocal imaging for HIF1α expression or CM-DCFDA. Data shown are from N>25 cells in a minimum of 3 fields per condition. N=3 individual experiments performed on separate days per group. *p<0.05 **p<0.01, ***p<0.001 by One-way ANOVA. (D) MDA-MB-231 cells transfected with siRNA targeting HIF1α or scrambled control and exposed to a sub-lethal dose of docetaxel (25 nM) for the indicated amounts of time were immunoblotted for Glut1. N=2 biological replicates. (E) Membrane fractions from MDA-MB-231 parental cells or DTCCs were immunoblotted for Glut1. DTCCs were treated with siRNA targeting CD44 or scrambled control or treated with the PI3K inhibitor PI103. NHE-1 served as the loading control for the membrane fraction. N=2 biological replicates. (F) Schematic of the temporally-activated, drug-induced signaling network implicated in producing a cross-drug tolerant phenotype. CTX, chemotherapeutic.
Pharmacologically ablating G6PD overcomes cross-tolerance to anthracyclines
PPP intermediates and downstream products, including GSH, can confer resistance to chemotherapy agents like doxorubicin and 5FU(45–49). We hypothesized that the drug-induced increase in PPP activity in DTCCs may contribute to the cross-tolerance to anthracyclines. Indeed, ectopic expression of G6PD and exogenous addition of GSH or NADPH in drug naïve parental cells phenocopied doxorubicin-adaptive tolerance (Fig. S5C,D). We tested this hypothesis using the G6PD inhibitor CB-83 (50), which reversed cross-tolerance to doxorubicin as evidenced by the decreased cell viability of DTCCs (Fig. 5A). CB-83 did not affect cell survival in response to doxorubicin in parental cells or in response to the Akt inhibitor PI-103 (Fig. 5A). We next determined preliminary structure-activity relationships for a small library of G6PD inhibitors based on the CB-70 core (50) (Fig. 5B). We confirmed that these G6PD inhibitors increased ROS levels in DTCCs (Fig. S6A) but did not affect cell survival in drug naïve parental cells or in DTCCs when administered alone (Fig. S6B). However, co-administration of G6PD inhibitors with the anthracycline idarubicin reduced the proportion of DTCCs (Fig. 5C) in a manner dependent on G6PD (Fig. 5D, Fig. S6C).
Figure 5. Mathematical validation of cross-tolerance and prediction of dosing sequence.
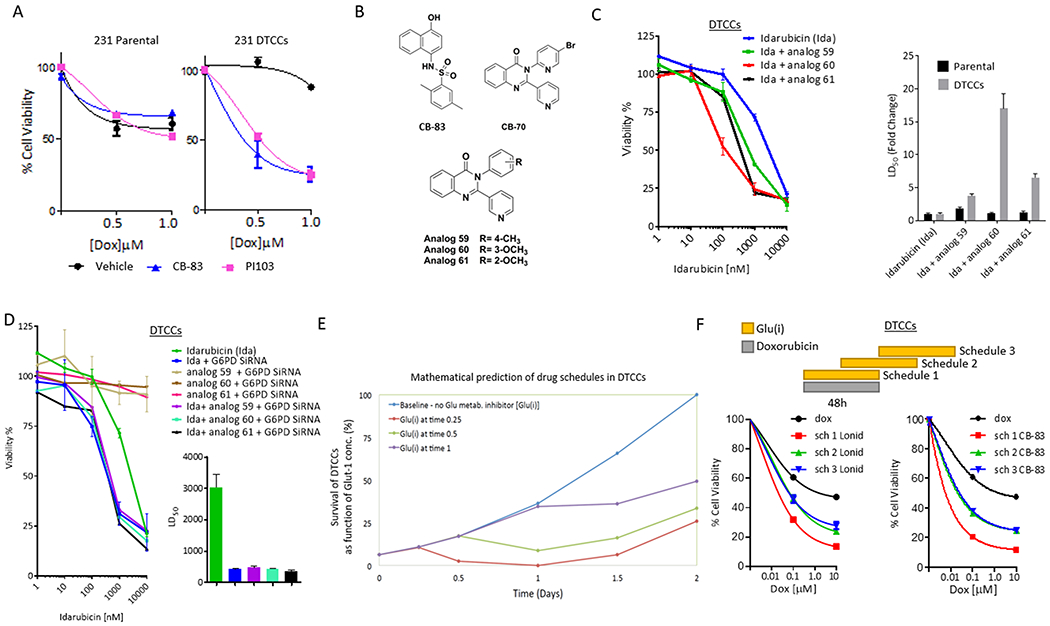
(A) Cell viability analyses of MDA-MB-231 parental cells or DTCCs treated with a combination of doxorubicin and PI103 (5 µM) or CB-83 (10 µM). Data shown are mean ± SEM. , N=5 biological replicates per group. (B) Chemical structure of G6PD inhibitors. (C) Cell viability analysis of MDA-MB-231 DTCCs in the presence of idarubicin (Ida) or combinations of Ida and G6PD inhibitors (5μM) N=3 biological replicates per group (left). Graph shows the LD50 for each drug combination (right). (D) Cell viability analysis of MDA-MB-231 DTCCs in the presence of Ida +/− siRNA targeting G6PD +/− G6PD inhibitors (left). Graph shows the IC50 for siRNA-treated cohorts (right). N=3 biological replicates per group. (E) Mathematical model prediction shows the relative number of cells surviving treatment with Doxorubicin at varying times in the drug schedule with a glucose metabolism inhibitor [Glu(i)]. The model assumes cells have transitioned into a drug tolerant state as a result of docetaxel treatment. Theoretical dynamics are plotted against time. (F) Cell viability analysis of MDA-MB-231 DTCCs treated for 96 hours according to three distinct schedules in which doxorubicin was treated simultaneously with a glucose metabolism inhibitor [Glu(i) = lonidamine at 100 μM or CB-83 at 10 μM] (schedule 1) or in a time delayed fashion (schedules 2 and 3). N=3 biological replicates per group.
Mathematical modeling using temporal signaling dynamics predicts optimal 3-drug schedules to ablate cross-drug tolerance
Drug scheduling and sequencing is emerging as an important yet complex consideration for cancer treatment (5, 51, 52). Given the temporal signaling dynamics we observed above, which connect phenotypic plasticity and metabolic remodeling, we performed mathematical modeling to predict the best temporal sequence of our proposed 3-drug schedule (taxane, anthracycline, and a G6PD inhibitor). Based on the biological mechanism described above, we constructed a minimalistic systems biology model (Fig. S7A,B) in which the associated parameters between proteins were inferred from published independent studies. Simulating the temporal relationships between activated proteins under taxane drug challenge indicated a theoretically predicted, temporally-delayed combination effect between HIF1α and Glut1, which were required for increased metabolic activity after taxane exposure (Fig. S7C).
This model allowed us to simulate drug schedules that best target the metabolic reprogramming and thus increase the efficacy of the drug combination of taxane and anthracyclines. We wrote the corresponding differential equations with the estimated parameters. Primarily, we assumed that cells transitioned into a drug-tolerant state that develops after docetaxel exposure. We then modelled the tumor-killing effect of a glucose metabolism inhibitor [Glu(i)] if it were incorporated into various drug schedules with doxorubicin. This model is equivalent to the biological effect of Glu(i) and doxorubicin on the taxane-induced metabolically transitioned cell. The simulation then determined how the addition of Glu(i) resulted in reduced glucose flux through the PPP, which may affect cell response to combination drug therapies in specific sequences. Survival was assumed to be linearly related to the level of glucose flux. We developed in silico models that predicted the effect of administering doxorubicin before Glu(i) and vice versa. In both cases, the model described achievement of maximal antitumor efficacy when Glu(i) and doxorubicin were incorporated simultaneously into the drug schedule following docetaxel treatment (Fig. 5E and S7D).
Timing the sequence of anthracyclines, G6PD inhibitors and taxanes improves antitumor effect in vitro and in vivo
Next, we tested the mathematical prediction by treating DTCCs with a combination of an anthracycline (doxorubicin) and lonidamine or CB-83 in specific sequences over the course of 96 hours (Fig. 5F, upper panel). Consistent with the in silico model, DTCCs were most susceptible to doxorubicin when the metabolic inhibitors were administered simultaneously with doxorubicin after cells had already been exposed to docetaxel (Fig. 5F, lower panels). These data support the notion that understanding the dynamics of the sequentially-activated signaling network, which was validated by mathematical assumptions, is critical to assign a drug schedule that overcomes cross-drug tolerance and thwarts resistance development.
To test the efficacy of our combination therapy sequencing in vivo, we used a syngeneic orthotopic 4T1 mammary carcinoma model. First, we treated tumor-bearing mice with two cycles of docetaxel chemotherapy at the maximum tolerated dose and assessed the tumors for the expression and localization of Glut1 and the uptake of glucose in the refractory tumor tissue following therapy pressure (Fig. 6A, arms 1 and 2). Monitoring the uptake of glucose using 2-NBDG and using TUNEL staining on the tumor sections revealed that glucose uptake was increased in the tumor tissue that survived docetaxel treatment compared to vehicle-treated control cohorts (Fig. 6B). Furthermore, quantification of total glucose levels validated that docetaxel stimulated an increase in glucose uptake in malignant tissue compared to that in normal tissue (Fig. 6C). Consistent with our previous observations(5), confocal microscopy revealed increased intratumoral CD44 expression and enhanced Glut1 expression in the taxane-treated group as compared with vehicle-treated controls (Fig. 6D). Confocal imaging revealed that the viable fractions of tumor from docetaxel-treated mice showed marked membrane expression of CD44 and Glut1 compared to vehicle-treated tumors (Fig. S8).
Figure 6. Inhibiting drug-induced glucose metabolism overcomes cross-tolerance and improves antitumor outcome and survival in vivo and in human tumor explants.
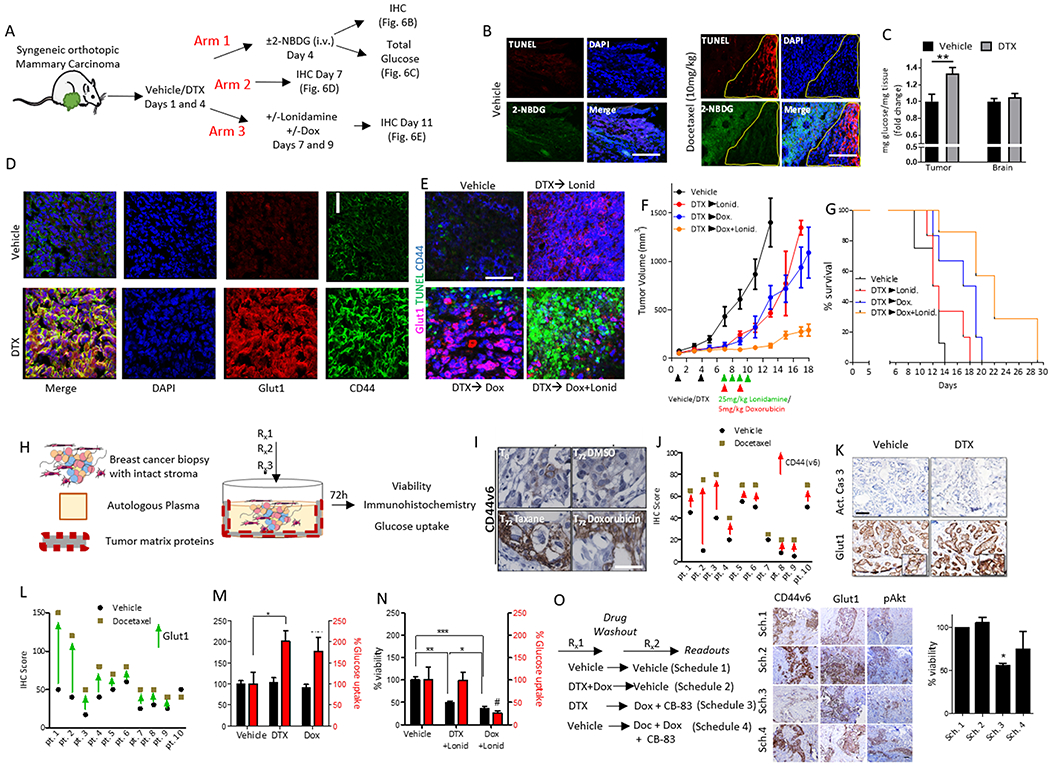
(A) Schematic illustrates the strategies used to assess residual syngeneic, orthotopic mammary carcinomas after docetaxel treatment (10 mg/kg). Glucose uptake was analyzed by 2-NBDG tracing or whole tumor glucose levels (Arm 1). Glut1 and CD44 abundance was assessed by immunohistochemistry (IHC) (Arm 2). The residual tumor after sequential addition of docetaxel with doxorubicin and/or lonidamine at the indicated doses was analyzed as Arm 3. (B) Representative confocal images of tumor sections from the 4T-1 syngeneic mammary carcinoma model treated as per Arm 1 (vehicle, left panel or docetaxel, right panel). Green indicates glucose (2-NBDG) update and red indicates TUNEL-positive cells. Images are representative of the overall increase in signal intensity; N=3 mice per group. Scale bar=100 μm. (C) Total glucose levels from brain and tumor tissue homogenate were obtained from tumor bearing mice after administration with vehicle or docetaxel (10 mg/kg,12 hours). N=6 mice per group. Error bars indicate SEM. **p<0.01 by t-test. (D) Representative confocal microscopy images show total CD44 and Glut1 expression in tumor tissue isolated from mice in Arm 2. N=3 mice per group. Scale bar=25 µm. (E) Representative confocal images show TUNEL (an apoptosis marker), CD44 and Glut1 signal intensity in tumors taken from mice in Arm 3. N=4 mice per group. Scale bar=40 µm. (F) Tumor growth curves of orthotopic syngeneic mammary carcinomas implanted in mice treated with docetaxel (10 mg/kg) or vehicle and sequentially treated with doxorubicin (5 mg/kg) or lonidamine (Lonid.; 25 mg/kg) on the days indicated by the treatment regimen in lower panel. (G) Kaplan–Meier survival graph of mice orthotopically implanted with syngeneic mammary carcinomas and given the treatment regimens described earlier (N=7 mice in all treatment groups, N=8 mice for vehicle). (H) Schematic illustrates the human tumor explant model used to measure tumor viability and glucose uptake and for immunohistochemistry. (I) Representative immunohistochemistry shows the expression of CD44 variant isoform 6 (CD44v6) in explant tumor tissue at baseline or treated with docetaxel (taxane), doxorubicin or DMSO vehicle. N=10 different patient samples. Scale bar = 50 µm. (J) Graph shows histologic quantification of CD44v6 staining intensity in matching patient explants treated with vehicle or docetaxel. (K) Representative immunohistochemistry for Glut1 or cleaved caspase-3 (Act. Cas 3) in explant tumor tissue treated with vehicle or docetaxel. N=10 different patient samples. Scale bar = 50 µm. (L) Graph shows histologic quantification of Glut1 staining intensity in patient explants treated with vehicle or docetaxel. (M) Cell viability analyses (black bars) or glucose uptake (red bars) of explant tumor tissue following incubation with the indicated chemotherapy. N=3 biological replicates per group. Error bars indicate SEM. *p<0.05 by One-way ANOVA. (N) Cell viability analyses (black bars) or glucose uptake (red bars) of explant tumor tissue following incubation with the indicated chemotherapy in the presence of the glucose metabolism inhibitor, lonidamine (Lonid.) (quantified at 72h). N=10 biological replicates per group, Error bars indicate SEM. *p<0.05, **p<0.01, ***p<0.001 by One-way ANOVA. (O) CANscript™ was performed using time-separated drug combinations (36 hours per treatment arm). Representative images show immunohistochemistry for proteins that correlate to a phenotypic switch (CD44v6, Glut1, pAKT and pPRAS40). Graph (far right panel) shows cell viability in the treated implants. N=5 biological replicates per group. *p<0.05. Scale bar = 30 µm. Sch., schedule.
In a parallel study, we tested the role of metabolic state transition in cross-drug tolerance by using the glucose metabolism inhibitor lonidamine in the regimen in which low-dose doxorubicin treatment was followed by taxane treatment (Fig. 6A, arm 3). Neither doxorubicin nor lonidamine alone resulted in further induction of cell death following docetaxel treatment (Fig. 6E). However, when doxorubicin and lonidamine were given together after treatment with docetaxel, we observed pronounced cell death as indicated by TUNEL staining, along with diminished co-expression of CD44 and Glut1. Furthermore, tumor growth curves showed that the triple drug combination stunted tumor growth compared to any one of these drugs alone (Fig. 6F). Kaplan-Meier survival plots demonstrated improved survival in tumor-bearing mice treated with the combination regimen in which lonidamine was administered simultaneously with doxorubicin after treatment with docetaxel (Fig. 6G). Similarly, incorporation of the PI3K inhibitor PI103 into the 3-drug schedule also reduced tumor growth (Fig. S9, A to C). Notably, the glucose metabolism inhibitor in combination with a taxane was no better than a combination of doxorubicin and a taxane.
Anticancer effect of a temporally-sequenced 3-drug schedule is identified with an ex vivo model
To evaluate the clinical implications of these findings, we used a human cancer explant assay that closely models the clinical response and resistance to therapy(53). Explants were generated from fresh tumor biopsy isolated from taxane-refractory breast cancer patients and cultured ex vivo on matched tumor matrix proteins and supplemented with autologous patient plasma. The explants were treated with cytotoxic chemotherapies at clinically reported Cmax doses for 72 hours (Fig. 6H). Docetaxel treatment led to an increase in the expression of Glut1 and CD44v6, as determined by immunohistochemistry (Fig. 6I–L, Table S1). Consistent with the in vitro and in vivo observations, docetaxel and doxorubicin treatment led to increased glucose uptake in the explants (Fig. 6M) without modulating viability. Although the combination of docetaxel and lonidamine decreased cell viability, the surviving cells exhibited high glucose uptake. In contrast, the combination of doxorubicin and lonidamine led to concomitant loss of viable cell populations and reduced glucose uptake, suggesting that the glucose metabolism inhibitor sensitized the metabolically active DTCCs to doxorubicin (Fig. 6N). Using the human explant model, we tested the combination therapy administered in various sequences and schedules (Fig.6O, Table S2). Docetaxel followed by co-administration of doxorubicin and the G6PD inhibitor CB-83 led to the greatest attenuation of the drug-tolerant phenotype, as assessed by the expression of CD44v6, Glu1, phosphorylated AKT and phosphorylated PRAS40, and induced the greatest amount of cell death compared to the two-drug combination (Fig. 6O).
Discussion
We have only begun unravelling the full complexity underlying chemotherapy failure. For example, tumor heterogeneity is increasingly being viewed as a major contributor in relapse(54–57). The emerging understanding that cancer cells do not lie in discrete pools but exist in a continuum between states and that cancer cells can transition across this continuum is reshaping our understanding of resistance and the design of new chemotherapy regimens(7, 51). Similarly, newer functions of tumor metabolism are emerging, such as in the regulation of tumor-immune interface(58). Here we showed that cancer cells could alter their metabolic state in response to chemotherapy to develop cross-tolerance to other chemotherapeutic agents. We also established a network that links phenotypic cell state transitions and transient tumor dormancy (5) with metabolic reprogramming in drug-tolerant cancer cells. In contrast to the pervading paradigm that augmented metabolic cell states are coincidental to enhanced proliferation (59), we identified this metabolic reprogramming to occur when cells are not actively proliferating (5), a mechanism to perpetuate repair during stress. Finally, we demonstrated that this metabolic reprogramming confers a vulnerability that can be exploited by combining inhibitors of PI3K/Akt, G6PD or glucose metabolism with cytotoxic drugs, resulting in increased anti-tumor efficacy and survival.
The Warburg effect is the pervading dogma of cancer metabolism, in which cancer cells convert glucose into lactate as a result of respiratory insufficiency(12) (fig. S10). Elliott et al. reported that the Warburg effect could arise clinically due to severely reduced numbers of mitochondria and abnormal mitochondrial ultrastructure in breast cancer cells(60). Additionally, glucose can suppress respiration, known as the Crabtree effect(61). In contrast, we observed that the DTCCs further augmented their glycolytic state in a manner that was associated with increased oxidative potential and mitochondrial flux. This evidence for a high rate of metabolism is consistent with our evidence for increased cell sizes, which is induced after exposure to drug (15). Moreover, OXPHOS restriction resulted in increased glycolysis, suggesting that mitochondrial plasticity in DTCCs was increased beyond that of the parental cells. Our data challenge the notion that mitochondria are dysfunctional in malignant tissue (62), and support that tumor cell mitochondria may play an essential role in tumorigenesis(63). For example, Dupuy et al. have described glycolysis and OXPHOS as drivers of a metastatic phenotype (64). Our study thus adds to the complexity of tumor heterogeneity and further supports the hypothesis that cancer cells can potentially exist in various metabolic states, which has implications in resistance and potentially other malignant phenotypes.
We observed a biphasic regulation of the metabolic switch that drives the increased glycolytic and respiratory state in response to chemotherapy in DTCCs. In the first phase, exposure to taxane chemotherapy induced the expression of cytokines that are implicated in host cell response. The increase in CD44 expression in the DTCCs is anticipated to be a component of this response. As previously reported, this increase in CD44 occurs in a CD44Lo cell population (5). CD44 scaffolds with the ERM complex (31), which can activate Akt (32), and both properties of CD44 appear to play a role in augmenting glucose utilization in DTCCs. Moreover, Akt regulates metabolism by increasing glucose uptake mediated by Glut1(65). mTOR and S6K1, which are downstream targets of Akt, promote a high rate of oxidative phosphorylation in cancer cells(66) which is partly sustained by glutamine anaplerosis that enabled cancer cells to escape glycolytic addiction. Cross talk may exist between the chemotherapy-induced metabolic phenotype observed in our study and glutaminolysis, which needs to be dissected in the future. The increased intracellular glucose is processed by mitochondria in DTCCs, where increased OXPHOS results in the generation of ROS and increased HIF1α expression. The delayed expression of a second set of cytokines (IL-8, IL-6 and angiogenin) was therefore consistent with the temporal induction of an oxidative stress response. HIF1α expression increases Glut1 expression, which facilitates the second phase of glucose uptake. Indeed, mitochondrial bursts can initiate and build up an oxidative stress response in cells, in part due to increased activity of NOX (37). Our evidence that the NOX inhibitor DPI suppresses global ROS production in DTCCs is thus consistent with the hypothesis that mitochondrial NOX is requisite for ROS imbalance in DTCCs. We observed that oxidative stress is associated with the activation of HIF1α, which is implicated in increasing the glycolytic flux through the PPP (67). Even in the absence of mitochondrial activity, there was residual oxygen consumption. These two mechanisms act sequentially to augment glucose flux through the PPP in DTCCs. The enhanced glucose flux leads to increased glutathione synthesis as a compensatory redox recalibration, which results in the induction of an adaptive cross-tolerance against distinct chemotherapy agents, including anthracyclines (Fig. S10).
Although therapeutic targeting of cancer metabolism is an attractive strategy, the existence of multiple compensatory mechanisms has meant that clinical trials with metabolic inhibitors have not been successful (68). For example, CSCs dynamically shift between OXPHOS and glycolytic states depending on oxygen status, which makes therapeutic tractability a challenge(69). Similarly, we showed that DTCCs could dynamically switch to a new metastable, metabolic state. Our results suggest it may be more strategic to disrupt the metabolic state transition that occurs following chemotherapy, and thus potentially sensitize the cells that would have otherwise developed cross-tolerance to combination therapy. That is to say, introducing the first drug (taxanes) in a sequence of drugs in combination (anthracyclines and glucose metabolism inhibition), this 3-drug sequential approach is distinct from previous reports that have employed a simple, two-drug combinations of lonidamine and doxorubicin. Lonidamine can have off-target effects, and therefore we also used CB-83 and several other distinct analogs that target G6PD, which validated that metabolic inhibitors could sensitize DTCCs to chemotherapy. Although the use of pharmacological inhibitors and siRNA-targeted knockdown allowed us to dissect the sequence of events underlying the metabolic state transition, the results with the small molecule inhibitors in the human explant models highlight the potential clinical utility of drug combinations with an integrated metabolic inhibitor.
In summary, the current study identifies a convergence of phenotypic and metabolic cell state transitions underlying cross-tolerance to chemotherapy. Furthermore, we propose new treatments for cancer that use temporal combinations, in which a cytotoxic agent can induce a metabolic state transition that is vulnerable to a combination of a metabolic inhibitor and a second therapeutic agent. Such combination therapies will require exquisite control over temporal sequencing, which can be uncovered using mathematical modeling. We envisage that this integration of a combinatorial approach of targeting metabolic transitions with chemotherapy and mathematical modeling will provide new therapeutic options in the management of cancer.
Methods
Chemicals and reagents
Unless noted otherwise, all reagents, small molecule inhibitors and chemotherapies were of the highest grade and purchased from Sigma-Aldrich. Lonidamine was purchased from Tocris biosciences. Everolimus was purchased from SelleckChem. Doxorubicin, PI103 were purchased from LC Labs. All chemotherapeutics and small molecule inhibitors were dissolved in DMSO to a stock concentration of 10 mM and kept frozen except for compounds used for animal studies, which were freshly prepared at the indicated concentrations. Recombinant IL-23, IFN-γ, GM-CSF, IL-6 and IL-8 were purchased from Biolegend. The G6PD inhibitor CB-83 was originally reported in Preuss et al. by the Chembridge ID#6138697, which was purchased from ChemBridge (50). The G6PD inhibitors, compounds 59, 60, and 61, were obtained from ChemDiv; purity (of >95%) and identity was confirmed by the medicinal chemistry core at Sanford Burnham Prebys by LC-MS and 1H NMR. Analog 59 was 2-(pyridin-3-yl)-3-(p-tolyl)quinazolin-4(3H)-one. Analog 60 was 3-(3-methoxyphenyl)-2-(pyridin-3-yl)quinazolin-4(3H)-one, Analog 61 was 3-(2-methoxyphenyl)-2-(pyridin-3-yl)quinazolin-4(3H)-one.
Cell culture and gene knockdown with siRNA
MDA-MB-231 (ATCC), MDA-MB-468, MCF7 and 4T-1 mammary carcinoma cells (ATCC) were cultured in DMEM containing 10% Fetal Bovine Serum (FBS) at 37 °C and 5% CO2. Cell lines were validated for absence of mycoplasma prior to use by ATCC. DU145 cells were provided by A. Mizokami (Kanazawa University Graduate School of Medical Sciences, Japan) (70) and cultured in DMEM containing 10% FBS. For the resistant line, 100 nM paclitaxel was included in the culture media. During treatments with chemotherapeutics, cells were grown to semi-confluence and treated with the indicated concentrations in serum-containing medium for the indicated time points. When small molecule inhibitors were included in treatments, they were added simultaneously with the chemotherapeutics. For siRNA gene knockdown, cells were transfected with silencer-select siRNA plasmids (Ambion, Invitrogen) pan-CD44#1 (s2682) pan-CD44#2 (s2681), HIF1α#1 (s6539) and HIF1α#2 (s6541), G6PD#1 (s5447) G6PD #2 (s5446) using lipofectamine 2000 (Invitrogen) following the manufacturer’s protocol and cultured for 72 hours prior to treatment. Scrambled siRNA was used as a control. For chemotherapeutic treatment experiments, cancer cells were plated at a density of 0.5-1x10⁵ cells/mL and allowed to adhere for 24-48 hours. When cells reached ~70% confluency they were treated with cytotoxic agents at the indicated concentrations for 24-48 hours and utilized for subsequent assays. For experiments in which a shorter incubation was used (15 min-4 hours) fresh media was added 24 hours before the addition of the chemotherapeutic, which was suspended to stock concentration in PBS. To generate DTCCs, cells were treated for 48 hours with a chemotherapeutic. Following washes with PBS, adherent cells were trypsinized and re-plated at a density of 1.5-2x10⁵ cells/mL and cultured in serum-containing medium. After 24 hours incubation, floating cells were removed and the remaining cells were washed with 1x PBS and considered to be DTCCs. A population of drug naïve parental cells was always cultured alongside DTCCs and fresh media was added at every interval that the DTCCs received fresh media. 3-D cell culture models were developed using the Organogenix Nano Culture Plates (NCP) following the manufacturer’s protocol (MBLI).
In vitro metabolic and oxidative stress experiments
In vitro detection of glucose uptake was performed using 2-(N-7-Nitrobenz-2-oxa-1,3-diazol-4-yl)Amino)-2-Deoxyglucose (2-NBDG) (Invitrogen), dissolved in DMSO to 50 mM. Cells were pre-treated with kinase inhibitors or vehicle for 3 hours in glucose- and phenol red-free media before the addition of 50 μM 2-NBDG and subsequently read by flow cytometry (excitation: 488 nm; emission: 535 nm). To measure ROS, cells were pre-loaded with CM-DCFDA (1 μM), washed 2 times with PBS and subsequently treated with H2O2 or vehicle. Cells were preincubated with kinase inhibitors for 3 hours prior to CM-DCFDA loading. Fluorescence was then determined by flow cytometry (excitation: 488 nm; emission: 535 nm). For experiments in which catalase was incorporated, we preincubated cells with 2000 U/mL catalase (liquid stock from bovine, Sigma, St. Louis, MO) for 3-6 hours before adding a fluorescent probe. For the following assays, cells were trypsinized and counted by Nexcelom cell counter before analysis to measure values per cell. Reduced glutathione was determined using a colorimetric glutathione recycling system by DTNB following the manufacturer’s protocol (Biovision). ATP analysis was performed using the ATP colorimetric analysis kit that measures a product of glycerol phosphorylation (Biovision) according to the manufacturer’s protocol. Reductive stress was detected using the Enzo nitroreductase hypoxia kit (Enzo Life Sciences) following the manufacturer’s protocol and visualized by fluorescent microscopy. A set of non-docetaxel-treated control cells loaded with fluorescent probe were compared against docetaxel-treated cells to derive a % redox stress increase which was calculated as the fluorescence intensity of the nitroreductase probe per cell and expressed as the increase compared to vehicle-treated cells.
Seahorse XF24 was used to determine the bioenergetics profile of parental and DTCCs with the mitochondrial stress test or the glycolysis stress test following the manufacturer’s protocol. Briefly, DTCCs or drug naïve parental cells were cultured as described above, and then plated directly into the XF24 plates at 100,000 cells/mL for 24 hours to allow adherence. For the glycolysis stress test, cells were first incubated with glucose free base media for 30 min prior to analysis. Basal oxygen consumption rates (OCR) and extracellular acidification rates/proton production rates (ECAR/PPR) were calculated using 2 min mix and 8 min measure cycles for up to 150 min. Seahorse Bio Base Media without phenol red and DMEM standard solution were used for the glycolysis stress test and mitochondria stress test, respectively. The glycolysis stress test was performed by introducing D-Glucose (12 mM), Oligomycin (1 μM) and 2-Deoxyglucose (50 mM). The mitochondrial stress test was performed by exposing cells to oligomycin (1 μM), FCCP (1 μM), Rotenone/antimycin (1 μM). Following analyses, experimental data was normalized to protein content as determined by bicinchoninic acid assay (BCA assay, Thermo Fisher).
Electron microscopy
Cells were fixed for at least 2 hours at room temperature in 2% formaldehyde, pH 7.4; washed in 0.1 M cacodylate buffer; postfixed with 1% Osmiumtetroxide (OsO4)/1.5% Potassiumferrocyanide(KFeCN6) for 1 hour; washed twice with water and once with maleate buffer (MB); incubated in 1% uranyl acetate in MB for 1 hour; washed twice with water; and dehydrated with grades of alcohol (10 min each; 50%, 70%, 90%, 2x 10 min 100%). The samples were then put in propyleneoxide for 1 hour and infiltrated overnight in a 1:1 mixture of propyleneoxide and TAAB Epon (Marivac Canada Inc.). The following day the samples were embedded in TAAB Epon and polymerized at 60 °C for 48 hours. Ultra-thin sections (about 60 nm) were cut on a Reichert Ultracut-S microtome, picked up onto copper grids stained with lead citrate and imaged with a JEOL 1200EX Transmission electron microscope or a TecnaiG² Spirit BioTWIN coupled to an AMT 2k CCD camera.
Steady state glucose tracing measurements by LC/MS analysis
MDA-MB-231 parental cells or a DTCC subset (generated as described above) were incubated for 8 hours with 13C-D-Glucose (Cambridge Isotope Labs). Isolation was performed as described previously(71). Briefly, cells were washed once with 1 mL cold (4 °C) 0.9% NaCl and 1 mL of extraction mixture was added containing 80% methanol with metabolomics amino acid mix MSK-A2-1.2 (Cambridge Isotope Labs). Isolation of cells and subsequent steps were performed using reagents stored at −80 °C and the collection was done on dry ice to mitigate metabolic flux during isolation. Dried metabolite extracts were resuspended in 100 μL water and subjected to LC/MS analysis on a QExactive mass spectrometer coupled to a Dionex Ultimate 3000 UPLC system. Labeled and unlabeled metabolites were identified by exact mass (10 ppm window) and retention time (0.5 min window) referencing an in-house library of chemical standards. Fractional labeling of each isotopomer was calculated as the raw peak area of the isotopomer divided by the sum of raw peak areas for all isotopomers of that metabolite. Pool sizes were calculated as the sum of raw peak areas of all isotopomers of a metabolite divided by the raw peak area of the appropriate internal standard. The internal standard used for each metabolite was pre-selected based on similarity of chemical structure and retention time.
Detection of released CO2 by radioactive glucose for PPP flux
Radioactive CO2 detection was performed as described previously (72). Briefly, equal number of cells (parental or DTCCs) were cultured for 24 hours and serum starved and incubated with 0.5 μCi/ml D-(1-14C(U)) glucose and 0.5 μCi/mL D- (6-14C(U)) glucose (PerkinElmer). 200 μL of 4M H2SO4 was added to cells and incubated at 37 °C for 1.5 hours to permit release of 14CO2. Each plate had a taped piece of Whatman paper facing the inside of the dish wetted with 100 μL of phenylethylamine-methanol (1:1) to trap CO2. Filter papers were removed and transferred to scintillation vials for counting. The amount of 14CO2 trapped on the paper dishes was determined using a liquid scintillator analyzer (TriCarb 2800TR, PerkinElmer). PPP flux was determined by subtracting the development of C6-14CO2 from C1-14CO2 per cell volume (protein quantification based on the BSA assay).
In vivo Experiments
All animal studies were performed under approved IACUC protocol at Harvard Medical School and Brigham and Women’s Hospital and handled in accordance with institutional guidelines. 1x10⁶ 4T-1 (human epidermal growth factor receptor-2 negative [HER2-], estrogen receptor negative [ER-], progesterone receptor negative [PR-]) mouse mammary carcinoma cells suspended in 100 μL PBS were injected in the left flank (for heterotopic implantation) or mammary fat pad (for orthotopic implantation) of 5-6 week old female Balb/C mice. Docetaxel was dissolved in pure Ethanol at a concentration of 50 mg/mL mixed 1:1 with Polysorbate 80 (Tween 80) and brought to a final working concentration with PBS. Doxorubicin and PI103 were dissolved in DMSO and brought to a final working concentration in PBS. Londiamine was administered as a 50 μL intraperitoneal injection in DMSO. A DMSO vehicle was administered to the control groups. Tumor volumes were assessed by the following formula: (width x width x length)/2 and values were utilized to calculate tumor specific growth rate by the algorithm (ln[V2/V1]/[t2-t1]) where V=volume and t=time in days. For in vivo analysis of 2-NBDG uptake, mice were treated as indicated (docetaxel was given intratumorally or intravenously) and monitored until tumors reached ~300 mm3. Subsequently, mice were intravenously injected with 10 mg/kg 2-NBDG 2 hours prior to sacrificing and harvesting of tumors. TUNEL staining was performed to visualize regions of apoptosis using the TUNEL assay kit and performed on frozen section slides according to the manufacturer’s protocol (Roche). Glucose quantitation (mg/dL) was measured using the onetouch lifescan glucose monitor (Life Scan, Inc. Militipas, CA) by calculating mg of glucose per volume of tissue homogenate (in PBS) and normalized as a ratio of mg/dL of glucose to mg of tissue homogenized. Typically, >250 mg of tissue was homogenized in 500 μL of PBS to achieve a readable value. For animal experiments, cohorts were randomized prior to experimental conditions and analyses were performed by a blinded third party.
Human explant studies
Fresh anonymous human breast cancer tissues were assessed by CANscript™. Samples taken from patients refractory to taxane-containing regimens and at varying disease stages were obtained from Mitra Biotech collected under IRB approval from HCG Bangalore Institute of Oncology with written consent from each patient. Fresh tumor tissues were collected from breast cancer patients immediately after surgical resection at HCG cancer hospital, Bangalore, India. The tumor samples were transported to the laboratory at 4 °C, in appropriate transport buffer within 60 min post-resection, for ex vivo studies and molecular and pathological evaluation as described previously (53). Tissues were cut into thin sections and cultured in 96 well plates using optimized conditions. Tumors were treated with a taxane or doxorubicin at Cmax for 72 hours. DMSO was used as a vehicle control. After treatment, tumor cell viability was measured and immunohistochemistry was performed. Glucose uptake was evaluated 72 hours post culture.
Changes in Glut1 and CD44v6 and cleaved caspase-3 before and after drug treatment were evaluated by immunohistochemistry using specific antibodies. Initial antigen retrieval of FFPE sections was done in Antigen Unmasking Solution (Citrate based, Vector Laboratories) in a microwave for 30 min. Endogenous peroxidase was quenched with 3% H2O2 for 15 min. Protein blocking was carried out at room temperature for 1 hour with 10% goat serum. FFPE sections were incubated with primary antibodies at room temperature for 1 hour. Rabbit polyclonal Glut1 antibody (Abcam) was used at a 1:200 dilution and mouse monoclonal anti CD44v6 antibody (clone VFF-18, Abcam) was used at a dilution of 1:500. Induction of apoptosis was detected by staining for cleaved caspase-3 using a rabbit polyclonal antibody directed against cleaved caspase-3 (Asp175) antibody (Cell Signaling Technology) at a 1:600 dilution for 1 hour at room temperature. All sections were incubated with HRP-conjugated secondary antibody (SignalStain® Boost IHC Detection Reagent; Cell Signaling Technology) for 1 hour at room temperature. Chromogenic signal was developed with 3,3’-diaminobenzidine (DAB Peroxidase Substrate Kit; Vector Laboratories). Tissues were counterstained with hematoxylin (Papanicolaous solution 1a). Scoring and calculation of drug induced inhibition of individual tumor explants were performed as described previously (72).
Tumor cell viability was assessed by Cell Counting Kit-8 (CCK-8) (Dojindo). CCK-8 solution was added and cells were incubated at 37 °C for 3 hours in a 5% CO2 incubator under humidified conditions. The absorbance was measured at 450 nm using a multimode microplate reader (Enspire, Perkin Elmer). Baseline samples (T0) were used to normalize inter-sample variation. The results were expressed as a percentage of viability or inhibition relative to untreated controls.
Glucose uptake assay was carried 72 hours post culture. Culture supernatant (2 µL) was added to 200 µL of glucose reagent (Liquixx Glucose Reagent, Erbaa). All readings along with glucose standard (100 mg/dL) were performed in triplicate. The plate was incubated at room temperature for 5 min on a plate shaker at medium speed and the absorbance was measured at 505 nm using a multimode plate reader (Perkin Elmer).
In vitro cytotoxicity and cell viability assays
Following drug incubation, cells were washed and suspended in phenol red-free RPMI or DMEM and subsequently treated with MTS reagent using the manufacturer’s protocol (Promega Corp.). Trypan blue exclusion by bright field microscopy was used to confirm the percentage of dead cells. For combination treatments (CB-83, PI103 or lonidamine + doxorubicin), cell viabilities were normalized based on their toxicity profile with the targeted agent. For example, in the case of lonidamine + doxorubicin, cell viabilities were determined to be ~77% in both the parental and DTCC fractions at the dose applied (100 μM), and this value was then normalized to 100% before doxorubicin was added.
Flow cytometry analyses
Cells were cultured as indicated, removed from culture dishes with accutase stem-pro dissociation reagent (Invitrogen, Carlsbad CA) and fixed with 4% paraformaldehyde in PBS for 30 min at room temperature, washed twice with PBS and blocked in 10% goat serum (v/v). Whenever necessary, cells were permeabilized with 0.05% saponin in PBS. Cells were incubated with CD44-APC (BD biosciences, San Jose, CA) overnight at 4 °C and analyzed by FACS (C6 Accuri cyomteters Inc.). Data analysis was performed with FlowJo software (Tree Star Inc.) and Accuri cFlow plus software to obtain and confirm mean fluorescent intensity (GNU.org).
High-density immunoarrays
The Proteome Profiler™ or cytokine array panels (R&D systems) were used to identify phosphorylated residues correlating to AKT-associated proteins or total chemokines or cytokines within cell populations, respectively. Following the Bradford protein analysis assay to normalize total protein content, cell lysates were applied to the membranes following the manufacturer’s protocol. Western blots for total protein (for example, AKT and mTOR) were performed to confirm equal loading. Membranes were visualized by chemiluminescence (Syngene). Optical densities were determined by Image J software (NIH.gov) and Adobe CS5. Reference spots were used to normalize between array membranes.
Confocal microscopy and immunofluorescence
Parental cells or DTCCs were plated in 4 chamber glass slides (BD Biosciences) or into plastic cell culture dishes at a concentration of 10,000 cells/mL. Following treatments, cells were washed in PBS and fixed in 4% Paraformaldehyde for 30 min. When necessary, cells were permeabilized with 10% (v/v) Goat serum (Vector Laboratories, Burlingame CA) and 0.05% Saponin (w/v) in PBS for 90 min. Blocking was performed in 10% (v/v) Goat serum in PBS. The cells were labeled with the indicated primary antibodies. CD44 (Clone IM7 from eBioScience) was conjugated to Fluor594 (AnaSpec) at 1:100 for 24 hours at 4 °C and masked with DAPI-containing hard-set mounting medium (Vector Laboratories). Bright field and fluorescent images were obtained using three channels on a NIKON Eclipse TI-U microscope with a 20x ELDW, 10x or 40x Plan-Apo objective lens (Nikon, Tokyo, Japan). NIS Elements Viewer version 3.22 (Nikon, Tokyo, Japan) software was used to capture the images to file. Confocal microscopy of immunohistochemistry from frozen sections of tumor tissue was performed with an inverted TE2000 confocal microscope fitted with 3 laser detection (Nikon, Tokyo, Japan) and with Auto DeBlur deconvolution software. Gains were set manually based on negative control stains (secondary antibody only) and were left unaltered between treatment groups of similar experiments. TUNEL staining was performed with a TUNEL assay kit (Roche, Basel Switzerland) to visualize apoptotic cells. Representative images are shown in figures are derived from experiments performed in at least biological triplicate on independent occasions. In general, images were obtained from more than 100 cells per conditions and chosen to represent the overall alterations in each experimental group. When unequal gains were set during confocal microscopy to compare localization of proteins, those instances have been indicated in the figure legends.
To image PGC1α, cells (10,000 cells/chamber) were plated in 8-chamber slides. After 0.4% paraformadehyde fixation, cells were blocked with 5% goat serum in phosphate-buffered saline (PBS), and incubated with antibodies against PGC1α (from Abcam) 1:100 dilutions, in blocking solution at 4 °C, overnight. Primary antibodies were further recognized by Alexa-Fluor 555-conjugated goat IgG (1:2000). Cell nuclei were counterstained with DAPI (4′,6-diamidino-2-phenylindole) in mounting solution (Abcam). Images (10x magnification) were obtained on an Eclipse TI-U microscope with a 10x ELDW objective lens (Nikon). NIS Elements Viewer version 3.22 (Nikon, Tokyo, Japan) software was used to capture the images to file. Fluorescence signals were calculated using Adobe CS5 and/or ImageJ software.
Immunoprecipitation, subcellular fractionation and Immunoblotting
Laemli sample buffer was prepared as a 5x solution containing β-mercaptoethanol as a reducing agent. Protein samples were resolved by SDS-PAGE and transferred to PVDF membranes prior to incubation at 4 °C with the indicated primary antibodies: NHE-1 and Glut1 were purchased from Santa Cruz Biotech (Santa Cruz, CA). p70S6K and phosphorylated p70S6K Thr389, mTOR and pMTOR Ser2448, pERM (Ezrin phosphorylated at Thr567, Radixin phosphorylated at Thr564, Moesin phosphorylated at Thr558) and total ERM, Ezrin and pEzrin Tyr353, pAKT Thr308 and AKT, pPRAS40 Thr246 and PRAS40, cleaved caspase-3 and β-Actin antibodies were purchased from Cell Signaling Technology. EGFR and CD44v6 neutralizing antibodies were purchased from R&D Systems. PVDF membranes with primary antibody were incubated at room temperature with HRP conjugated secondary antibodies (BD) and resolved by chemiluminescence using the G-Box and Syngene software (Syngene). When possible, blots were stripped (Thermo Fisher inc.) and re-probed with a second primary antibody. Optical densities of western blots were measured using ImageJ open source software (National Institutes of Health) and validated with Adobe CS5. Nuclear and cytoplasmic isolation was performed using the subcellular fraction kit following the manufacturer’s protocol (Thermo Fisher inc.). Western blotting images chosen as representative depictions in the figures demonstrate equivalent results taken from biological replicates.
Single cell, real-time assessment of mitochondrial reactive oxygen species (ROS)
Live parental cells were incubated with MitoSOX Red (5 μM; Invitrogen, Carlsbad CA) for 30 min, washed and recovered in phenol red-free DMEM with 2% FBS and treated with docetaxel (50 nM). Equivalent exposure times were used at each interval for immunofluorescent microscopy, which was compensated for autofluorescence. Images were captured on a NIKON Eclipse TI-U microscope with a 20x ELDW or 10x or 40x Plan-Apo objective lens(Nikon) and NIS Elements Viewer version 3.22 (Nikon) imaging software. A negative control (non-transfected) cell subset was used to normalize background and autofluorescence following docetaxel treatment. Individual cells were tracked over time and cell death was assessed with the 2 TdT-Fluor In Situ apoptosis detection kit (Trevigen). Apoptosis induction (or loss of adherence to culture dish, which was used as an indicator of cell death) and changes in MitoSOX fluorescence were plotted for individual cells over time.
Statistics
Statistical analysis was performed with ANOVA analysis followed by a Newman-Keuls post hoc test when values were represented between multiple groups, and two-tailed Student’s t-test when comparing individual groups. 2-way ANOVA was employed to track significance between groups from in vivo tumor volume experiments. The data are expressed as means ± standard error of the mean (SEM). Animal groups were chosen in sufficient number to provide statistical significance for the experimental data derived, which was at least 3 animals per group in each experiment. However, no statistical method was necessarily used to select sample size. Statistical analysis was performed with Prism software (GraphPad).
Supplementary Material
Materials and Methods
Fig. S1. Characterizing the metabolic phenotype of cross-drug tolerant cancer cells in multiple tumor models
Fig. S2. Testing the effect of glucose metabolism inhibition on cross drug tolerance in multiple cell lines
Fig. S3. Characterizing phenotypic and metabolic heterogeneity in drug-tolerant cells
Fig. S4. Characterizing the role of ROS and the PPP in drug tolerance
Fig. S5. HIF1 signaling, glucose uptake, and PPP in adaptive cross-drug tolerance
Fig. S6. Testing the effect of G6PD inhibition on cross-drug tolerance with an inhibitor library
Fig. S7. Computational modeling
Fig. S8. Colocalization of Glut1 and CD44 in residual tumor mass
Fig. S9. A PI3K inhibitor in a 3-drug schedule with taxanes and anthracyclines improves outcomes
Fig. S10. Proposed mechanism of drug-induced phenotypic and metabolic state transitions that drive cross-drug tolerance.
Table S1. Patient demographics for Figs. 6I–N
Table S2. Patient demographics for Fig. 6O
References (73-76)
Acknowledgements:
The authors would like to thank Dr. Caroline Lewis and the Whitehead Institute Metabolomics Core Facility (M.I.T.) for helpful discussions, guidance and glucose tracing experiments. Dr. David Goldman, MD (Tucson, AZ) for assisting with analysis of IHC data, Dr. William Oldham MD, PhD and Dr. Joseph Loscalzo MD, PhD (Brigham and Women’s Hospital) for their helpful discussions during experimental designs, and Medical images and illustrations used for schematics were obtained from http://www.servier.com.
Funding: S.S. is supported by a DoD BCRP Breakthrough Award and an NIH UO1 (1U01CA214411). A.G. is supported by an American Cancer Society Postdoctoral Fellowship (122854-PF-12-226-01-CDD) and Breast Cancer Alliance Young Investigator Award. M.K. is supported by a Natural Sciences and Engineering Research Council of Canada (NSERC) Discovery Grant.
Footnotes
Competing Interests: A.G., B.M., P.M. and S.S. hold equity in Mitra Biotech. Mitra Biotech and Brigham and Women’s Hospital (BWH) have filed patents (PCT/US2019/018776 and PCT/US2015/018776) related to the data presented here. A.G., B.M., S.S., P.M. are named as inventors on these patents. The other authors declare that they have no competing interests.
Data and materials availability: All data needed to evaluate the conclusions in the paper are present in the paper or the Supplementary Materials.
REFERENCES AND NOTES
- 1.Dagogo-Jack I, Shaw AT, Tumour heterogeneity and resistance to cancer therapies. Nat Rev Clin Oncol 15, 81–94 (2018). [DOI] [PubMed] [Google Scholar]
- 2.Redmond KM, Wilson TR, Johnston PG, Longley DB, Resistance mechanisms to cancer chemotherapy. Frontiers in bioscience : a journal and virtual library 13, 5138–5154 (2008). [DOI] [PubMed] [Google Scholar]
- 3.Salgia R, Kulkarni P, The Genetic/Non-genetic Duality of Drug ‘Resistance’ in Cancer. Trends Cancer 4, 110–118 (2018). [DOI] [PMC free article] [PubMed] [Google Scholar]
- 4.Dean M, Fojo T, Bates S, Tumour stem cells and drug resistance. Nat Rev Cancer 5, 275–284 (2005). [DOI] [PubMed] [Google Scholar]
- 5.Goldman A et al. , Temporally sequenced anticancer drugs overcome adaptive resistance by targeting a vulnerable chemotherapy-induced phenotypic transition. Nature communications 6, 6139 (2015). [DOI] [PMC free article] [PubMed] [Google Scholar]
- 6.Islam S et al. , Drug-induced aneuploidy and polyploidy is a mechanism of disease relapse in MYC/BCL2-addicted diffuse large B-cell lymphoma. Oncotarget 9, 35875–35890 (2018). [DOI] [PMC free article] [PubMed] [Google Scholar]
- 7.Pisco AO et al. , Non-Darwinian dynamics in therapy-induced cancer drug resistance. Nature communications 4, 2467 (2013). [DOI] [PMC free article] [PubMed] [Google Scholar]
- 8.Dear RF et al. , Combination versus sequential single agent chemotherapy for metastatic breast cancer. Cochrane Database Syst Rev, CD008792 (2013). [DOI] [PMC free article] [PubMed] [Google Scholar]
- 9.Kummar S et al. , Utilizing targeted cancer therapeutic agents in combination: novel approaches and urgent requirements. Nat Rev Drug Discov 9, 843–856 (2010). [DOI] [PubMed] [Google Scholar]
- 10.Cantor JR, Sabatini DM, Cancer cell metabolism: one hallmark, many faces. Cancer discovery 2, 881–898 (2012). [DOI] [PMC free article] [PubMed] [Google Scholar]
- 11.Cairns RA, Harris IS, Mak TW, Regulation of cancer cell metabolism. Nat Rev Cancer 11, 85–95 (2011). [DOI] [PubMed] [Google Scholar]
- 12.Warburg O, On the origin of cancer cells. Science 123, 309–314 (1956). [DOI] [PubMed] [Google Scholar]
- 13.Gillies RJ, Robey I, Gatenby RA, Causes and consequences of increased glucose metabolism of cancers. Journal of nuclear medicine : official publication, Society of Nuclear Medicine 49 Suppl 2, 24S–42S (2008). [DOI] [PubMed] [Google Scholar]
- 14.Makinoshima H et al. , Signaling through the Phosphatidylinositol 3-Kinase (PI3K)/Mammalian Target of Rapamycin (mTOR) Axis Is Responsible for Aerobic Glycolysis mediated by Glucose Transporter in Epidermal Growth Factor Receptor (EGFR)-mutated Lung Adenocarcinoma. J Biol Chem 290, 17495–17504 (2015). [DOI] [PMC free article] [PubMed] [Google Scholar]
- 15.Goldman A et al. , Rationally Designed 2-in-1 Nanoparticles Can Overcome Adaptive Resistance in Cancer. ACS nano 10, 5823–5834 (2016). [DOI] [PubMed] [Google Scholar]
- 16.Boareto M et al. , Notch-Jagged signalling can give rise to clusters of cells exhibiting a hybrid epithelial/mesenchymal phenotype. J R Soc Interface 13, (2016). [DOI] [PMC free article] [PubMed] [Google Scholar]
- 17.Wahba HA, El-Hadaad HA, Current approaches in treatment of triple-negative breast cancer. Cancer biology & medicine 12, 106–116 (2015). [DOI] [PMC free article] [PubMed] [Google Scholar]
- 18.Jia H et al. , Immunotherapy for triple-negative breast cancer: Existing challenges and exciting prospects. Drug resistance updates : reviews and commentaries in antimicrobial and anticancer chemotherapy 32, 1–15 (2017). [DOI] [PubMed] [Google Scholar]
- 19.Jose Bines FK, Siva Silvania B, Sarmento Roberta MB, Avila Small Isabele, Rodrigues Fabiana R, Maroun Pedro S, Millen Eduardo, Bonamino Martin H, in American Society of Clinical Oncology Annual Conference (Chicaco, IL, 2018), vol. J Clin Oncol 36, 2018. (suppl; abstr 575). [Google Scholar]
- 20.Arai K et al. , A Novel High-Throughput 3D Screening System for EMT Inhibitors: A Pilot Screening Discovered the EMT Inhibitory Activity of CDK2 Inhibitor SU9516. PLoS One 11, e0162394 (2016). [DOI] [PMC free article] [PubMed] [Google Scholar]
- 21.Valero V, Hortobagyi GN, Are anthracycline-taxane regimens the new standard of care in the treatment of metastatic breast cancer? J Clin Oncol 21, 959–962 (2003). [DOI] [PubMed] [Google Scholar]
- 22.Andrew Dhawan DN, Kinose Fumi, Abazeed Mohamed E., Marusyk Andriy, Haura Eric B., Scott Jacob G., Collateral sensitivity networks reveal evolutionary instability and novel treatment strategies in ALK mutated non-small cell lung cancer. Scientific reports 7, (2017). [DOI] [PMC free article] [PubMed] [Google Scholar]
- 23.Bosc C, Selak MA, Sarry JE, Resistance Is Futile: Targeting Mitochondrial Energetics and Metabolism to Overcome Drug Resistance in Cancer Treatment. Cell metabolism 26, 705–707 (2017). [DOI] [PubMed] [Google Scholar]
- 24.Rahman M, Hasan MR, Cancer Metabolism and Drug Resistance. Metabolites 5, 571–600 (2015). [DOI] [PMC free article] [PubMed] [Google Scholar]
- 25.Chambers JW, Fowler ML, Morris MT, Morris JC, The anti-trypanosomal agent lonidamine inhibits Trypanosoma brucei hexokinase 1. Molecular and biochemical parasitology 158, 202–207 (2008). [DOI] [PubMed] [Google Scholar]
- 26.Paggi MG et al. , The role of mitochondrial hexokinase in neoplastic phenotype and its sensitivity to lonidamine. Ann N Y Acad Sci 551, 358–360 (1988). [DOI] [PubMed] [Google Scholar]
- 27.Hartmann A et al. , Hypoxia-induced up-regulation of angiogenin in human malignant melanoma. Cancer Res 59, 1578–1583 (1999). [PubMed] [Google Scholar]
- 28.Wieman HL, Wofford JA, Rathmell JC, Cytokine stimulation promotes glucose uptake via phosphatidylinositol-3 kinase/Akt regulation of Glut1 activity and trafficking. Mol Biol Cell 18, 1437–1446 (2007). [DOI] [PMC free article] [PubMed] [Google Scholar]
- 29.Martin TA, Harrison G, Mansel RE, Jiang WG, The role of the CD44/ezrin complex in cancer metastasis. Critical reviews in oncology/hematology 46, 165–186 (2003). [DOI] [PubMed] [Google Scholar]
- 30.Gonzalez E, McGraw TE, The Akt kinases: isoform specificity in metabolism and cancer. Cell Cycle 8, 2502–2508 (2009). [DOI] [PMC free article] [PubMed] [Google Scholar]
- 31.Mori T et al. , Structural basis for CD44 recognition by ERM proteins. The Journal of biological chemistry 283, 29602–29612 (2008). [DOI] [PMC free article] [PubMed] [Google Scholar]
- 32.Wang Y et al. , Akt/Ezrin Tyr353/NF-kappaB pathway regulates EGF-induced EMT and metastasis in tongue squamous cell carcinoma. Br J Cancer 110, 695–705 (2014). [DOI] [PMC free article] [PubMed] [Google Scholar]
- 33.Sena LA, Chandel NS, Physiological roles of mitochondrial reactive oxygen species. Mol Cell 48, 158–167 (2012). [DOI] [PMC free article] [PubMed] [Google Scholar]
- 34.Valero T, Mitochondrial biogenesis: pharmacological approaches. Current pharmaceutical design 20, 5507–5509 (2014). [DOI] [PubMed] [Google Scholar]
- 35.Jornayvaz FR, Shulman GI, Regulation of mitochondrial biogenesis. Essays Biochem 47, 69–84 (2010). [DOI] [PMC free article] [PubMed] [Google Scholar]
- 36.Singh MM et al. , Inhibition of the NADPH oxidase regulates heme oxygenase 1 expression in chronic myeloid leukemia. Cancer 118, 3433–3445 (2012). [DOI] [PMC free article] [PubMed] [Google Scholar]
- 37.Dikalov S, Cross talk between mitochondria and NADPH oxidases. Free Radic Biol Med 51, 1289–1301 (2011). [DOI] [PMC free article] [PubMed] [Google Scholar]
- 38.Schieber MS, Chandel NS, ROS links glucose metabolism to breast cancer stem cell and EMT phenotype. Cancer cell 23, 265–267 (2013). [DOI] [PubMed] [Google Scholar]
- 39.Alexandre J et al. , Accumulation of hydrogen peroxide is an early and crucial step for paclitaxel-induced cancer cell death both in vitro and in vivo. Int J Cancer 119, 41–48 (2006). [DOI] [PubMed] [Google Scholar]
- 40.Misra HP, Inhibition of superoxide dismutase by nitroprusside and electron spin resonance observations on the formation of a superoxide-mediated nitroprusside nitroxyl free radical. J Biol Chem 259, 12678–12684 (1984). [PubMed] [Google Scholar]
- 41.Margoliash E, Novogrodsky A, A study of the inhibition of catalase by 3-amino-1:2:4:-triazole. Biochem J 68, 468–475 (1958). [DOI] [PMC free article] [PubMed] [Google Scholar]
- 42.Anastasiou D et al. , Inhibition of pyruvate kinase M2 by reactive oxygen species contributes to cellular antioxidant responses. Science 334, 1278–1283 (2011). [DOI] [PMC free article] [PubMed] [Google Scholar]
- 43.Bonello S et al. , Reactive oxygen species activate the HIF-1alpha promoter via a functional NFkappaB site. Arteriosclerosis, thrombosis, and vascular biology 27, 755–761 (2007). [DOI] [PubMed] [Google Scholar]
- 44.Chen C, Pore N, Behrooz A, Ismail-Beigi F, Maity A, Regulation of glut1 mRNA by hypoxia-inducible factor-1. Interaction between H-ras and hypoxia. J Biol Chem 276, 9519–9525 (2001). [DOI] [PubMed] [Google Scholar]
- 45.Riganti C, Gazzano E, Polimeni M, Aldieri E, Ghigo D, The pentose phosphate pathway: an antioxidant defense and a crossroad in tumor cell fate. Free Radic Biol Med 53, 421–436 (2012). [DOI] [PubMed] [Google Scholar]
- 46.Phan LM, Yeung SC, Lee MH, Cancer metabolic reprogramming: importance, main features, and potentials for precise targeted anti-cancer therapies. Cancer biology & medicine 11, 1–19 (2014). [DOI] [PMC free article] [PubMed] [Google Scholar]
- 47.Polimeni M et al. , Modulation of doxorubicin resistance by the glucose-6-phosphate dehydrogenase activity. Biochem J 439, 141–149 (2011). [DOI] [PubMed] [Google Scholar]
- 48.Villani F et al. , Prevention of doxorubicin-induced cardiomyopathy by reduced glutathione. Cancer Chemother Pharmacol 28, 365–369 (1991). [DOI] [PubMed] [Google Scholar]
- 49.Westman EL et al. , Bacterial inactivation of the anticancer drug doxorubicin. Chemistry & biology 19, 1255–1264 (2012). [DOI] [PubMed] [Google Scholar]
- 50.Preuss J et al. , Identification and characterization of novel human glucose-6-phosphate dehydrogenase inhibitors. Journal of biomolecular screening 18, 286–297 (2013). [DOI] [PubMed] [Google Scholar]
- 51.Goldman A, Tailoring combinatorial cancer therapies to target the origins of adaptive resistance. Mol Cell Oncol 3, e1030534 (2016). [DOI] [PMC free article] [PubMed] [Google Scholar]
- 52.Zhao B et al. , Exploiting Temporal Collateral Sensitivity in Tumor Clonal Evolution. Cell 165, 234–246 (2016). [DOI] [PMC free article] [PubMed] [Google Scholar]
- 53.Majumder B et al. , Predicting clinical response to anticancer drugs using an ex vivo platform that captures tumour heterogeneity. Nature communications 6, 6169 (2015). [DOI] [PMC free article] [PubMed] [Google Scholar]
- 54.Marusyk A, Polyak K, Cancer. Cancer cell phenotypes, in fifty shades of grey. Science 339, 528–529 (2013). [DOI] [PubMed] [Google Scholar]
- 55.Brock A, Chang H, Huang S, Non-genetic heterogeneity--a mutation-independent driving force for the somatic evolution of tumours. Nature reviews. Genetics 10, 336–342 (2009). [DOI] [PubMed] [Google Scholar]
- 56.Almendro V, Marusyk A, Polyak K, Cellular heterogeneity and molecular evolution in cancer. Annual review of pathology 8, 277–302 (2013). [DOI] [PubMed] [Google Scholar]
- 57.Marusyk A, Almendro V, Polyak K, Intra-tumour heterogeneity: a looking glass for cancer? Nat Rev Cancer 12, 323–334 (2012). [DOI] [PubMed] [Google Scholar]
- 58.Molon B, Cali B, Viola A, T Cells and Cancer: How Metabolism Shapes Immunity. Front Immunol 7, 20 (2016). [DOI] [PMC free article] [PubMed] [Google Scholar]
- 59.Fritz V, Fajas L, Metabolism and proliferation share common regulatory pathways in cancer cells. Oncogene 29, 4369–4377 (2010). [DOI] [PMC free article] [PubMed] [Google Scholar]
- 60.Elliott RL, Jiang XP, Head JF, Mitochondria organelle transplantation: introduction of normal epithelial mitochondria into human cancer cells inhibits proliferation and increases drug sensitivity. Breast Cancer Res Treat 136, 347–354 (2012). [DOI] [PubMed] [Google Scholar]
- 61.Diaz-Ruiz R, Rigoulet M, Devin A, The Warburg and Crabtree effects: On the origin of cancer cell energy metabolism and of yeast glucose repression. Biochim Biophys Acta 1807, 568–576 (2011). [DOI] [PubMed] [Google Scholar]
- 62.Denko NC, Hypoxia, HIF1 and glucose metabolism in the solid tumour. Nat Rev Cancer 8, 705–713 (2008). [DOI] [PubMed] [Google Scholar]
- 63.Seyfried TN, Flores RE, Poff AM, D’Agostino DP, Cancer as a metabolic disease: implications for novel therapeutics. Carcinogenesis 35, 515–527 (2014). [DOI] [PMC free article] [PubMed] [Google Scholar]
- 64.Dupuy F et al. , PDK1-Dependent Metabolic Reprogramming Dictates Metastatic Potential in Breast Cancer. Cell metabolism 22, 577–589 (2015). [DOI] [PubMed] [Google Scholar]
- 65.Deberardinis RJ, Sayed N, Ditsworth D, Thompson CB, Brick by brick: metabolism and tumor cell growth. Curr Opin Genet Dev 18, 54–61 (2008). [DOI] [PMC free article] [PubMed] [Google Scholar]
- 66.Pusapati RV et al. , mTORC1-Dependent Metabolic Reprogramming Underlies Escape from Glycolysis Addiction in Cancer Cells. Cancer Cell 29, 548–562 (2016). [DOI] [PubMed] [Google Scholar]
- 67.Lall R et al. , Low-dose radiation exposure induces a HIF-1-mediated adaptive and protective metabolic response. Cell death and differentiation 21, 836–844 (2014). [DOI] [PMC free article] [PubMed] [Google Scholar]
- 68.Martinez-Outschoorn UE, Peiris-Pages M, Pestell RG, Sotgia F, Lisanti MP, Cancer metabolism: a therapeutic perspective. Nat Rev Clin Oncol 14, 113 (2017). [DOI] [PubMed] [Google Scholar]
- 69.Snyder V, Reed-Newman TC, Arnold L, Thomas SM, Anant S, Cancer Stem Cell Metabolism and Potential Therapeutic Targets. Front Oncol 8, 203 (2018). [DOI] [PMC free article] [PubMed] [Google Scholar]
- 70.Takeda M et al. , The establishment of two paclitaxel-resistant prostate cancer cell lines and the mechanisms of paclitaxel resistance with two cell lines. The Prostate 67, 955–967 (2007). [DOI] [PubMed] [Google Scholar]
- 71.Birsoy K et al. , An Essential Role of the Mitochondrial Electron Transport Chain in Cell Proliferation Is to Enable Aspartate Synthesis. Cell 162, 540–551 (2015). [DOI] [PMC free article] [PubMed] [Google Scholar]
- 72.Denise C et al. , 5-fluorouracil resistant colon cancer cells are addicted to OXPHOS to survive and enhance stem-like traits. Oncotarget 6, 41706–41721 (2015). [DOI] [PMC free article] [PubMed] [Google Scholar]
Associated Data
This section collects any data citations, data availability statements, or supplementary materials included in this article.
Supplementary Materials
Materials and Methods
Fig. S1. Characterizing the metabolic phenotype of cross-drug tolerant cancer cells in multiple tumor models
Fig. S2. Testing the effect of glucose metabolism inhibition on cross drug tolerance in multiple cell lines
Fig. S3. Characterizing phenotypic and metabolic heterogeneity in drug-tolerant cells
Fig. S4. Characterizing the role of ROS and the PPP in drug tolerance
Fig. S5. HIF1 signaling, glucose uptake, and PPP in adaptive cross-drug tolerance
Fig. S6. Testing the effect of G6PD inhibition on cross-drug tolerance with an inhibitor library
Fig. S7. Computational modeling
Fig. S8. Colocalization of Glut1 and CD44 in residual tumor mass
Fig. S9. A PI3K inhibitor in a 3-drug schedule with taxanes and anthracyclines improves outcomes
Fig. S10. Proposed mechanism of drug-induced phenotypic and metabolic state transitions that drive cross-drug tolerance.
Table S1. Patient demographics for Figs. 6I–N
Table S2. Patient demographics for Fig. 6O
References (73-76)