

Abstract
Synaptic plasticity is known to regulate and support signal transduction between neurons, while synaptic dysfunction contributes to multiple neurological and other brain disorders; however, the specific mechanism underlying this process remains unclear. In the present study, abnormal neural and dendritic morphology was observed in the hippocampus following knockout of Atp11b both in vitro and in vivo. Moreover, ATP11B modified synaptic ultrastructure and promoted spine remodeling via the asymmetrical distribution of phosphatidylserine and enhancement of glutamate release, glutamate receptor expression, and intracellular Ca2+ concentration. Furthermore, experimental results also indicate that ATP11B regulated synaptic plasticity in hippocampal neurons through the MAPK14 signaling pathway. In conclusion, our data shed light on the possible mechanisms underlying the regulation of synaptic plasticity and lay the foundation for the exploration of proteins involved in signal transduction during this process.
Keywords: ATP11B, synaptic plasticity, glutamate receptors, MAPK14 signaling pathway
Introduction
Information storage and transmission in the brain depend on effective signal transduction between neurons, which takes place across synapses (Harris and Littleton, 2015). Synaptic plasticity is critical for healthy nerve function, and synaptic dysfunction is linked to neurological diseases such as Parkinson’s disease (Schroll et al., 2014), Alzheimer’s disease (Singh and Abraham, 2017), and depression/anxiety (Marsden, 2013). Precise regulation of synaptic plasticity is therefore extremely important for maintenance of neural network activity and normal brain function. However, the precise regulation mechanisms underlying synaptic plasticity remain unclear.
Synaptic plasticity results in concomitant structural changes (Bailey et al., 2015). Neurotransmitters and their receptors are important components during synaptic transmission, together with synaptic vesicles consisting of a phospholipid bilayer (Saheki and De Camilli, 2012; Raynaud et al., 2018). Biological cell membranes are dynamic and fluidic secure structures that require continuous adjustments in the chemical structure and molecular shape of their lipid constituents, particularly of the phospholipids (McMahon and Gallop, 2005; Piomelli et al., 2007). Phosphatidylserine (PS) is distributed mainly on the cytoplasmic face of the plasma membrane and plays an important role in the maintenance of membrane asymmetry (Pomorski et al., 2001). P4-ATPases are a relatively novel family of membrane proteins that have been implicated in the active transport of PS across cell membranes (Piomelli et al., 2007), and they have been reported to be involved in multiple neurological diseases (Kato et al., 2008; Li et al., 2008; Levano et al., 2012; Coleman et al., 2013). It has been suggested that ATP8B4 may participate in Alzheimer’s disease and that the single nucleotide polymorphism, RS10519262 (intergenic between ATP8B4 and SLC27A2), is associated with the risk of Alzheimer’s disease (Li et al., 2008). Moreover, Atp8a1-knockout mice exhibit significant learning and memory deficits (Levano et al., 2012). In addition, the Atp10c gene has been identified as an autism susceptibility gene (Kato et al., 2008). Considering the important functions of P4-ATPases in neurological diseases, the ATP11 subfamily of P4-ATPases, which includes ATP11B, serves as lipid flippases, regulates membrane asymmetry (Wang et al., 2018), and modulates the morphology of neural stem cells (Wang et al., 2017), implying that ATP11B may regulate the function of neural systems, although the specific mechanism underlying this process remains unknown.
In the present paper, we show that both overexpression and silencing of ATP11B induce changes in synaptic ultrastructure, spine motility, and maturation of hippocampal neurons in vitro and in vivo. Moreover, our results indicate that ATP11B functions as a lipid flippase and regulates the asymmetrical distribution of PS. Further, upregulation of ATP11B increases glutamate release, enhances expression of glutamate receptors, and raises the intracellular Ca2+ concentration in mouse hippocampal neurons. In addition, we found that ATP11B regulation of synaptic plasticity appears to be mediated by the mitogen-activated protein kinase 14 (MAPK14) signaling pathway. Our research provides evidence that ATP11B is an important regulator of synaptic plasticity, which lays the foundation for further research in neurological diseases.
Results
ATP11B influences neurite length, spine motility, and dendritic spine density in hippocampal neurons
Since short neurite outgrowth of neural stem cells is implicated in synaptic plasticity–related neurological diseases (Sellier et al., 2010; Hagerman, 2012) and was observed following ATP11B downregulation in our previous study (Wang et al., 2017), we investigated the effect of ATP11B on synaptic plasticity. Atp11b−/− mice were crossed with Thy1-EGFP reporter mice to generate Atp11b−/−/Thy1-EGFP mice (Supplementary Figure S1) in which green fluorescent protein (GFP) is expressed in the neurons (Feng et al., 2000). Atp11b+/+/Thy1-EGFP mice were used as the control. As seen by confocal microscopy, the total neurite length of hippocampal neurons in Atp11b−/−/Thy1-EGFP mice was ~ 80% of that in Atp11b+/+/Thy1-EGFP mice (Figure 1A and B). Moreover, dendritic spine density was also reduced in Atp11b−/−/Thy1-EGFP mice compared with Atp11b+/+/Thy1-EGFP mice (Figure 1C and D). Furthermore, to assess developmental changes in spine maturation, the spines were classified into four categories according to their morphology (Zagrebelsky et al., 2005): mushroom and stubby spines represented more mature spines, while thin and branched spines tended to be more plastic and immature (Bourne and Harris, 2008). Statistical analysis shows that the proportion of mushroom and thin spines was decreased, while that of branched and stubby spines was increased in Atp11b−/−/Thy1-EGFP mice as compared with Atp11b+/+/Thy1-EGFP mice (Figure 1E), indicating that ATP11B affects the formation of dendritic spines. For in vitro investigation, primary cultured hippocampal neurons were transfected with overexpression and silencing constructs of Atp11b (Supplementary Figure S2), and the morphology of neurons was observed by laser confocal microscopy. As shown in Figure 1F and G, overexpression of ATP11B significantly increased the total neurite length, and silencing of ATP11B robustly reduced the total neurite length, indicating that ATP11B significantly influences neurite outgrowth of hippocampal neurons. Moreover, dendrites are the primary sites at which neurons deal with inputs from their multiple presynaptic partners, and their functions are critically dependent on spine density (Kumar et al., 2005). Furthermore, changes in dendritic spine density and morphology influence synaptic plasticity (Montagna et al., 2017). Consequently, the dendritic spine was observed by confocal microscopy, and the results show that ATP11B knockdown decreased dendritic spine density (Figure 1H and I). In contrast, enhancing ATP11B expression increased dendritic spine density (Figure 1H and I), indicating a pivotal role of ATP11B in dendritic remodeling. Moreover, it is noteworthy that spine motility is important for synaptic function, calcium compartmentalization, synaptogenesis, and developmental plasticity (Bonhoeffer and Yuste, 2002). To further investigate the dynamic process of dendritic spine development in primary hippocampal neurons, rapid time-lapse imaging was performed over time (Figure 1J and K). Dendritic spines in the ATP11B overexpression group were highly motile, whereas a significant reduction in spine motility was induced by ATP11B downregulation (Figure 1J and K). These results suggest that ATP11B influenced remodeling of dendritic spines and enhanced spine motility, indicating that ATP11B plays an important role in the regulation of synaptic plasticity.
Figure 1.
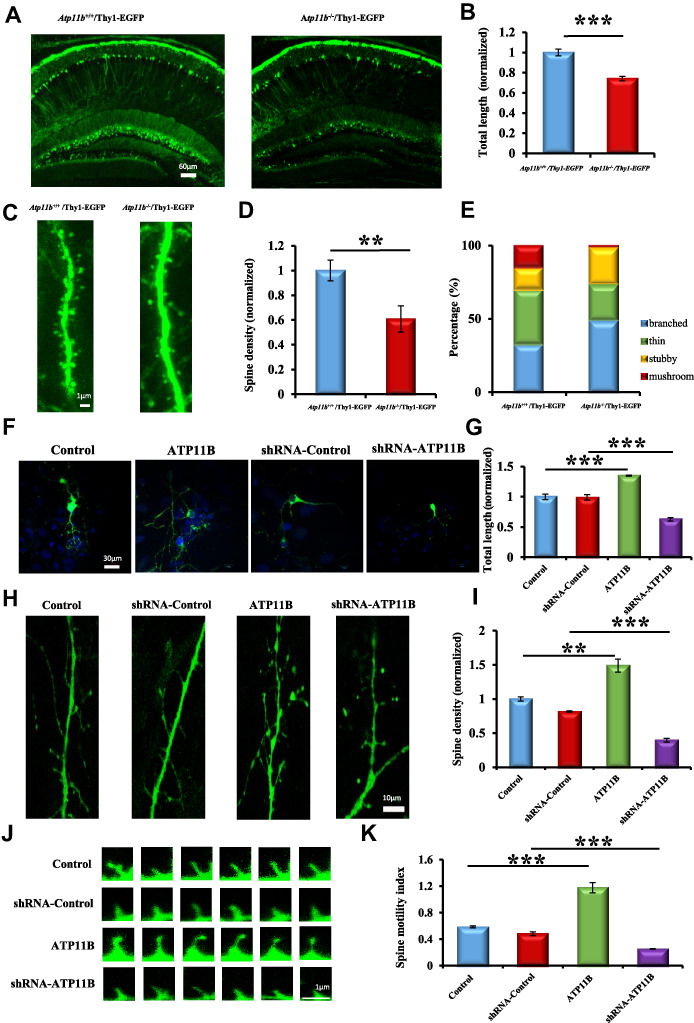
ATP11B regulates spine density and morphology in hippocampal neurons. (A) Representative confocal observation of hippocampal sections from Atp11b+/+/Thy1-EGFP and Atp11b−/−/Thy1-EGFP mice with neuronal Thy1-EGFP expression (green). Scale bar, 60 μm. (B) Statistical analysis of total cumulative length of dendritic processes per GFP-positive neuron from Atp11b+/+/Thy1-EGFP and Atp11b−/−/Thy1-EGFP mice, respectively. The length was normalized to the mean length of Atp11b+/+/Thy1-EGFP mice. (C) Confocal Z-projections of representative Atp11b+/+/Thy1-EGFP and Atp11b−/−/Thy1-EGFP dendrite branches on GFP-positive neurons. Scale bar, 1 μm. (D) Statistical analysis of the spine density in vivo. The spine density was normalized to the mean density of Atp11b+/+/Thy1-EGFP mice. (E) The density statistics of different spine types. (F) Confocal micrographs of primary hippocampal neurons (green) with following four groups: Control, ATP11B overexpression (ATP11B), shRNA-Control, and ATP11B silencing (shRNA-ATP11B). The nuclei were stained with DAPI (blue). Scale bar, 30 μm. (G) Statistical analysis of total cumulative length of dendritic processes per GFP-positive neuron in four groups. The length was normalized to the mean length of control. (H) Confocal Z-projections of representative dendrite branches on primary hippocampal neurons in four groups. Scale bar, 10 μm. (I) Statistical analysis of the spine density in vitro. The spine density was normalized to the mean density of control. Enhancing ATP11B expression increased dendritic spine density in hippocampal neurons. (J) Fast time-lapse imaging reveals that upregulation of ATP11B promotes spine motility. Scale bar, 1 μm. (K) Quantification of the spine motility index. Data are expressed as mean ± SEM. One-way analysis of variance (ANOVA). **P < 0.01, ***P < 0.001.
ATP11B affects synaptic ultrastructure
Since active zones are a key component of what defines a synapse (Sudhof, 2012), to further explore the impact of ATP11B on synaptic structure, electron microscopy was used to observe synaptic ultrastructure. Complete synaptic structure can be observed following both up- and downregulation of ATP11B (Figure 2A and B, indicated by the red arrow), demonstrating that alterations in ATP11B expression do not compromise the integrity of synaptic structure. It has been reported that certain types of synaptic plasticity can influence cleft width, curvature of the synaptic interface, length of the synaptic active zone, and thickness of the postsynaptic density (PSD) (Xu et al., 2013; Posfai et al., 2016). As such, these features were compared following overexpression or silencing of ATP11B in primary hippocampal neurons. Statistical analyses are shown in Figure 2C–F. The distance across the synaptic cleft was significantly narrowed following overexpression of ATP11B and widened following ATP11B knockdown (Figure 2C). In addition, a noticeable increase in the curvature of the synaptic interface was observed in the ATP11B overexpression group, whereas no significant changes were observed in the ATP11B knockdown group (Figure 2D). Furthermore, the length of the synaptic active zone and thickness of the PSD were also increased by overexpression of ATP11B and reduced by the silencing of ATP11B (Figure 2E and F). Overexpression of ATP11B increased the length of the presynaptic active zone 2-fold over the control (Figure 2E), while silencing of ATP11B significantly shortened the active zone as compared with the control (Figure 2E). Similarly, ATP11B overexpression increased the thickness of the PSD, whereas this thickness was decreased 2-fold following ATP11B downregulation as compared with the control (Figure 2F). These results indicate that ATP11B indeed affects synaptic ultrastructure.
Figure 2.
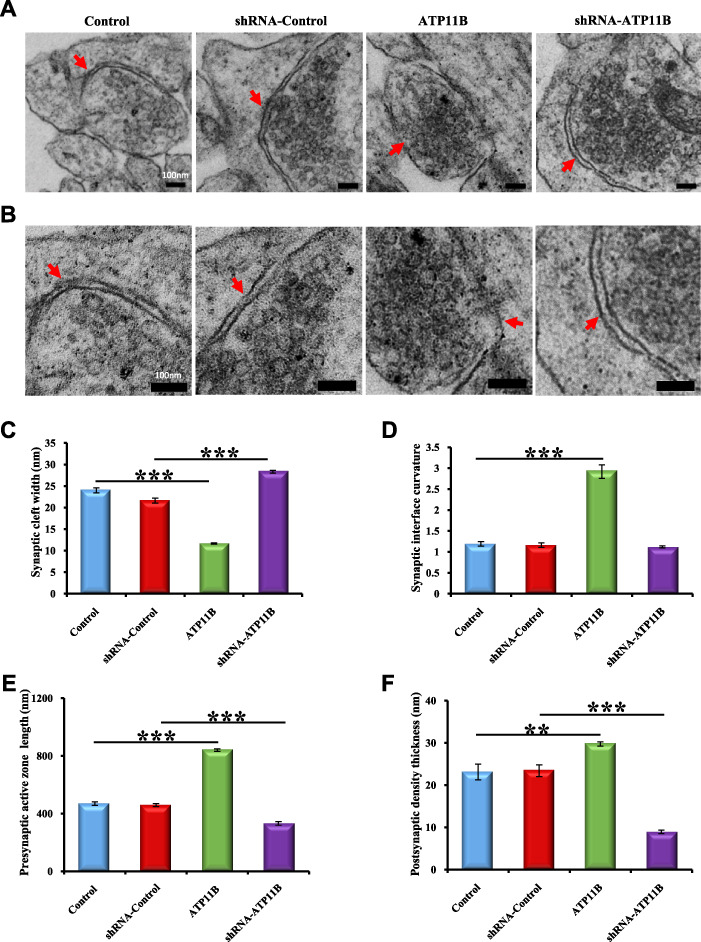
Electron micrographs of the synaptic ultrastructure mediated by ATP11B. (A and B) Electron micrographs show the synaptic ultrastructure of primary hippocampal neurons with following four groups: Control, ATP11B overexpression (ATP11B), shRNA-Control, and ATP11B silencing (shRNA-ATP11B). (B) The higher magnification images of A. Red arrows indicate the synaptic specializations. (C–F) Quantification of the width of the synaptic gap (C), the curvature of the synaptic interface (D), the length of presynaptic active zone (E), and the thickness of the PSD (F) in four groups (Control, n = 24; ATP11B, n = 27; shRNA-Control, n = 25; shRNA-ATP11B, n = 27). Scale bar, 100 nm. Data are expressed as mean ± SEM. One-way ANOVA. **P < 0.01, ***P < 0.001.
ATP11B regulates the asymmetrical distribution of PS in neuronal cell membranes
It has been reported that membrane asymmetry plays an important role in the maintenance of synaptic structure (Fontaine et al., 1979; Wood et al., 2011; Epand, 2015). Thus, it can be speculated that ATP11B is involved in the preservation of synaptic structure (Figure 2) via the modulation of neuronal membrane asymmetry (Piomelli et al., 2007) and the regulation of PS internalization (Lopez-Marques et al., 2014). To investigate this, Annexin V fluorescent probes were used to detect the externalization of PS from the cytoplasmic face of the membrane. Annexin V binds specifically to PS with high affinity, and thus, the fluorescence intensity represents the degree of PS externalization (Kenis et al., 2004). Primary hippocampal neurons were transfected with overexpression and silencing plasmids of Atp11b, Annexin V–PE staining was performed after 48 h, and the fluorescence changes were detected by flow cytometry (Figure 3A and B). ATP11B knockdown resulted in a significant increase in Annexin V-positive cells (Figure 3A and B), indicating that ATP11B regulates the asymmetrical distribution of PS in neuronal cell membranes. To further explore the biological activity of ATP11B, ATPase activity was evaluated in both ATP11B overexpression and silencing groups (Figure 3C). It was found that there was a significant increase in enzyme activity upon ATP11B overexpression, indicating that ATP11B indeed exerts ATPase activity in primary hippocampal neurons (Figure 3C). Taken together, these results indicate that ATP11B regulates the asymmetrical distribution of PS in neuronal cell membranes and, consequently, induced the above morphological changes (Figures 1 and 2).
Figure 3.
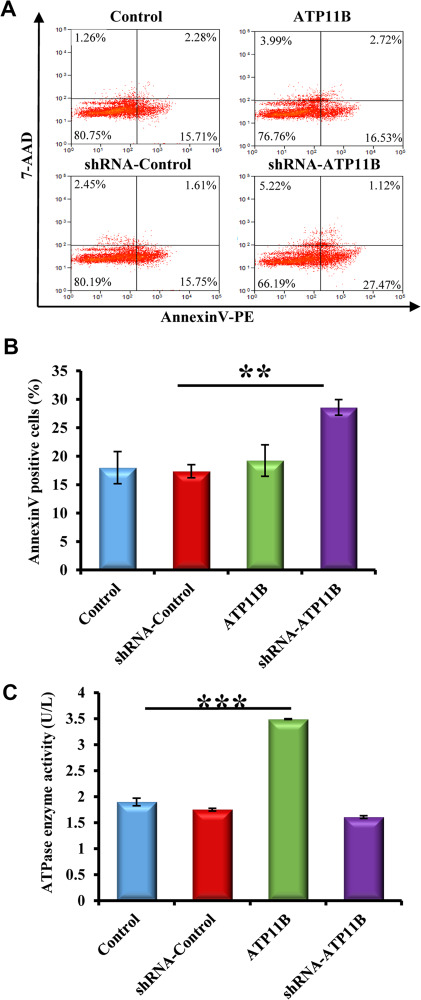
ATP11B regulates the asymmetrical distribution of PS in neuronal cell membranes. (A) Flow cytometry was used to detect the externalization of PS from the cytoplasmic face of the plasma membrane using Annexin V fluorescent probes. Primary hippocampal neurons with up- and downregulation of ATP11B were stained with Annexin-V PE and 7-AAD. Neurons were acquired for PE in FL-1 and 7-AAD in FL-4 in Becton Dickinson FACS scan and analyzed. (B) Statistical analysis of Annexin V-positive neurons. Data are representative of three independent experiments. (C) The detection of ATPase enzyme activity. The amount of inorganic phosphorus determines the level of ATPase activity. Data are expressed as mean ± SEM. One-way ANOVA. **P < 0.01, ***P < 0.001.
ATP11B regulates the levels of synapse-associated proteins in hippocampal neurons
Synaptic plasticity involves synapse formation, maturation, and maintenance, as well as the expression of synapse-associated proteins (Yong et al., 2014). For instance, synaptic vesicle glycoprotein 2A (SV2A) is known to modulate neurotransmitter release (Vogl et al., 2015); SYP, as a calcium-binding protein, is specific to the synaptic vesicle membrane of presynaptic components and can indirectly reflect the number, distribution, and density of synapses, which is commonly used as a marker of synaptic density (Matosin et al., 2016; Wang et al., 2016), and discs large homolog 4 (DLG4) has been shown to be the main structural protein of PSD (Steiner et al., 2008). Due to the important role of synapse-associated proteins in synaptic structure, the impact of ATP11B on the mRNA and protein levels of these synaptic-associated proteins, SV2A, SYP, and DLG4, were measured. RNA and protein were extracted from cultured primary hippocampal neurons and analyzed by quantitative real-time polymerase chain reaction (PCR) and western blotting. Overexpression of ATP11B increased the mRNA levels of these three proteins (Figure 4A and B). Conversely, the expression of synapse-associated proteins was downregulated in the ATP11B knockdown group (Figure 4C and D), indicating that ATP11B regulated the synaptic plasticity through synapse-associated proteins.
Figure 4.
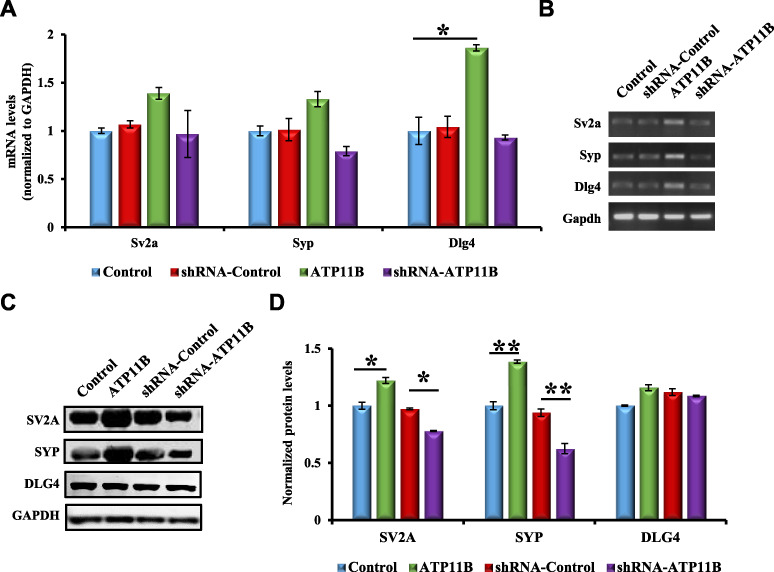
ATP11B regulates the levels of synapse-associated proteins. (A) QPCR detection of the mRNA expression levels of the synaptic proteins Sv2a, Syp, and Dlg4 in primary hippocampal neurons from the following four groups: Control, ATP11B overexpression (ATP11B), shRNA-Control, and ATP11B silencing (shRNA-ATP11B). Gapdh was used as the internal control. (B) The qPCR products were separated on the agarose gel. (C) Western blotting detection of the protein expression levels of SV2A, SYP, and DLG4 following transfection with overexpression or silencing plasmids of Atp11b in primary hippocampal neurons. (D) Data are expressed as a percentage of the control relative to GAPDH following background subtraction. Data are expressed as mean ± SEM. One-way ANOVA. *P < 0.05, **P < 0.01.
ATP11B increases glutamate release and glutamate receptor expression in primary hippocampal neurons
It has been reported that changes in synaptic structure can promote the release of synaptic neurotransmitters (Tang et al., 2016). Moreover, glutamate is an important excitatory neurotransmitter in the central nervous system (CNS) and plays a vital role in the development of the nervous system and maintenance of synaptic plasticity (Mattson, 2008). Here, ATP11B overexpression modulated synaptic structure (Figure 2) and increased the spine density of hippocampal neurons (Figure 1H and I). To explore the release of synaptic neurotransmitters in synaptic plasticity, the extracellular glutamate concentration in neurons was measured following up- and downregulation of ATP11B. Primary hippocampal neurons were transfected with ATP11B overexpression and silencing plasmids. The extracellular glutamate concentration was measured 48 h later. The results demonstrate a significant increase in extracellular glutamate concentration caused by overexpression of ATP11B, and conversely, ATP11B knockdown reduced the glutamate release (Figure 5A). It has been shown that an increase in glutamate release can activate glutamate receptors and modulate synaptic plasticity (Futagi and Kitano, 2015; Park et al., 2015; Twomey et al., 2017). Interestingly, dysfunction of NMDA receptors induces significant reduction in dendritic complexity (Andreae and Burrone, 2015), and AMPA receptors regulate experience-dependent dendritic arbor growth (Kumar et al., 2005). To detect glutamate receptor expression, qPCR and western blotting were employed to explore changes in mRNA and protein levels following transfection with the ATP11B overexpression and silencing plasmids. The expression of glutamate receptors was upregulated by overexpression of ATP11B and downregulated by silencing (Figure 5B–E), indicating that ATP11B regulates the release of synaptic glutamate and glutamate receptor expression in hippocampal neurons and may play an important role in the maintenance of synaptic plasticity.
Figure 5.
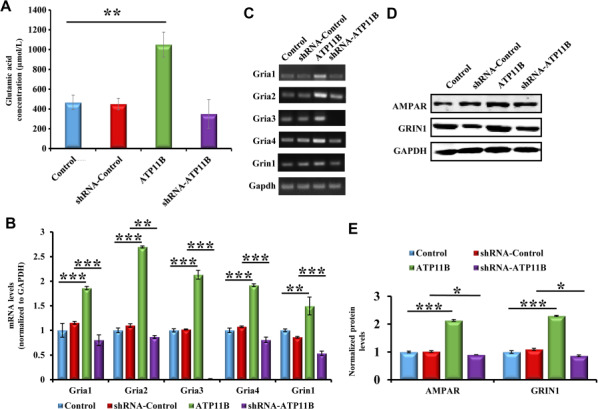
ATP11B increases glutamate release and the expression of glutamate receptors in hippocampal neurons. (A) The biochemical detection of glutamate released by primary hippocampal neurons into the culture medium. (B) The mRNA levels of the glutamate receptors, Gria1, Gria2, Gria3, Gria4, and Grin1, were assessed by qPCR in primary hippocampal neurons from the following four groups: Control, ATP11B overexpression (ATP11B), shRNA-Control, and ATP11B silencing (shRNA-ATP11B). Gapdh was used for the internal control. (C) The qPCR products were separated on the agarose gel. (D) Western blotting detection of the protein expression levels of AMPAR and GRIN1 following up- or downregulation of Atp11b in primary hippocampal neurons. (E) Data are expressed as a percentage of the control relative to GAPDH after background subtraction. Data are expressed as mean ± SEM. One-way ANOVA. *P < 0.05, **P < 0.01, ***P < 0.001.
ATP11B increases the intracellular Ca2+ concentration in primary hippocampal neurons
An increase in intracellular Ca2+ has been reported to trigger synaptic plasticity, and its mobilization is a critical step (Fitzjohn and Collingridge, 2002; Futagi and Kitano, 2015; Zhang et al., 2015a). An increase in intracellular Ca2+ concentration, a process that occurs during synaptic transmission induced by the release of intracellular Ca2+ stores, plays an important role in the growth and elimination of dendritic spines (Segal et al., 2000). Moreover, here, upregulation of ATP11B induced spine remodeling (Figure 1H and I). Thus, to investigate the effect of ATP11B on intracellular Ca2+ concentration in neurons, primary hippocampal neurons were transfected with ATP11B overexpression and silencing plasmids. Fluo-4AM was used to monitor the intracellular Ca2+ levels by flow cytometry (Figure 6). Overexpression of ATP11B significantly increased the fluorescence intensity and therefore the intracellular Ca2+ concentration (Figure 6). In contrast, ATP11B knockdown clearly reduced the fluorescence intensity (Figure 6), indicating that ATP11B affects the intracellular Ca2+ concentration.
Figure 6.
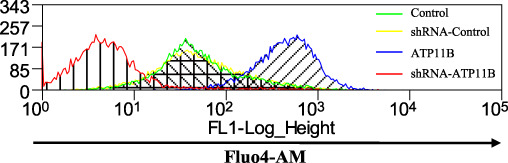
ATP11B increases the intracellular Ca2+ concentration in hippocampal neurons. Cytogram showing Fluo4-AM-labelled primary neurons with up- or downregulation of Atp11b monitored by flow cytometry. X-axis: intensity of fluorescence (log scale); y-axis: number of events. The green color represents Control, the yellow color represents shRNA-Control, the blue color represents ATP11B overexpression, and the red color represents shRNA-ATP11B.
ATP11B regulates synaptic plasticity through the MAPK14 signaling pathway
The requirement of the MAPK14 signaling cascade in the induction of synaptic plasticity has been well characterized (Correa and Eales, 2012), and its downstream signaling molecules Creb1 (Benito and Barco, 2010) and Arc (Soule et al., 2012) have also been reported to play a key role in the regulation of synaptic plasticity. Based on the above studies, the hypothesis that ATP11B influences synaptic plasticity through the MAPK14 signaling pathway was provided. To investigate the effect of ATP11B on MAPK14 signaling molecules, primary hippocampal neurons were transfected with ATP11B overexpression and silencing plasmids. Real-time PCR was used to detect the mRNA levels of Mapk14, Creb1, and Arc, with statistical analysis demonstrating a significant increase in the ATP11B overexpression group and a decrease in the ATP11B knockdown group (Figure 7A). Agarose gel electrophoresis is shown in Figure 7B. Western blotting results were consistent with those obtained by real-time PCR (Figure 7C), where the protein levels of MAPK14 and ARC were significantly increased following upregulation of ATP11B and clearly reduced following knockdown of ATP11B. Statistical analysis is shown in Figure 7D. Furthermore, we examined the effect of ATP11B on MAPK phosphorylation. Western blotting results showed that ATP11B overexpression enhances phosphorylation of MAPK and ATP11B silencing reduces phosphorylation of MAPK (Figure 7E). In light of the above results, it can be speculated that ATP11B is involved in the regulation of synaptic plasticity via the MAPK14 signaling pathway.
Figure 7.
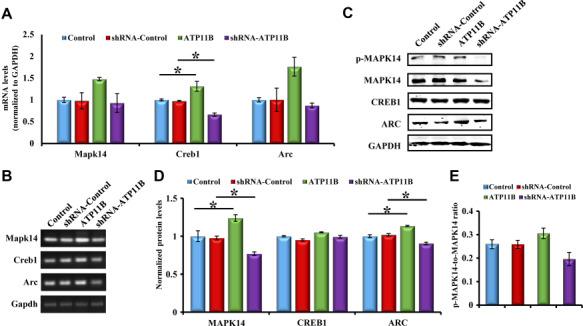
ATP11B regulates synaptic plasticity through the MAPK14 signaling pathway. (A) QPCR detection of the mRNA expression levels of the synaptic proteins Mapk14, Creb1, and Arc in primary hippocampal neurons after transfected with overexpression or silencing plasmids of Atp11b. Gapdh was used as the internal control. (B) The qPCR products were separated on the agarose gel. (C) Western blotting analysis of MAPK14 signaling molecules (p-MAPK14, MAPK14, CREB1, and ARC) in primary hippocampal neurons in the following four groups: Control, ATP11B overexpression (ATP11B), shRNA-Control, and ATP11B silencing (shRNA-ATP11B). (D) Data are expressed as a percentage of the control relative to GAPDH after background subtraction. (E) p-MAPK14 was measured with a p-MAPK14 antibody and MAPK14 as control. Ratio represents the degree of phosphorylation. Data are expressed as mean ± SEM. One-way ANOVA. *P < 0.05.
SB203580 blocks the regulation of ATP11B on the MAPK14 signaling pathway
The results showed that ATP11B regulates the MAPK14 signaling pathway. Subsequently, SB203580 (Kumar et al., 2010), a specific p38 MAPK inhibitor, was used for further validation. Primary hippocampal neurons were treated with SB203580 (20 μm) for 1 h, and western blotting was carried out to detect changes in the expression of MAPK14, CREB1, and ARC (Figure 8A). Statistical analysis is shown in Figure 8B. It was found that the expression of MAPK14, CREB1, and ARC was decreased following treatment with SB203580. Furthermore, the expression of MAPK14, CREB1, and ARC was significantly downregulated in the group transfected with ATP11B following pretreatment with SB203580 as compared with the group transfected with ATP11B, indicating that SB203580 blocked the influence of ATP11B on the MAPK14 signaling pathway (Figure 8B). Hence, it can be concluded that ATP11B indeed influences the regulation of synaptic plasticity through the MAPK14 signaling pathway.
Figure 8.
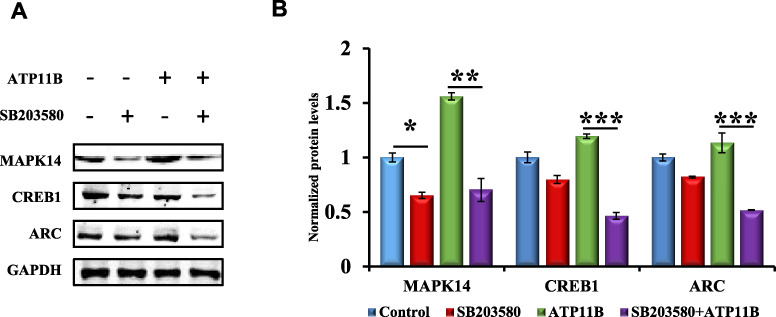
SB203580 blocks the regulation of ATP11B on the MAPK14 signaling pathway. (A) Western blotting detection of MAPK14 signaling molecules (MAPK14, CREB1, and ARC) in primary hippocampal neurons after pretreatment with SB203580 (20 μm) for 1 h and/or transfection with ATP11B. (B) Data are expressed as a percentage of the control relative to GAPDH after background subtraction in the following four groups: Control, treatment with SB203580 (SB203580), transfection with ATP11B (ATP11B), and transfection with ATP11B following pretreatment with SB203580 (SB203580 + ATP11B). Data are expressed as mean ± SEM. One-way ANOVA. *P < 0.05, ***P < 0.001.
Discussion
In the present paper, we found that up- and downregulation of ATP11B induced changes in neurite outgrowth and spine motility (Figure 1) of hippocampal neurons both in vitro and in vivo, and in synaptic ultrastructure (Figure 2), through alteration of the asymmetrical distribution of PS in neuronal cell membranes (Figure 3). Moreover, overexpression of ATP11B increased glutamate release, enhanced the expression of glutamate receptors (Figure 5), and raised the intracellular Ca2+ concentration (Figure 6) in mouse hippocampal neurons. Furthermore, ATP11B regulation of synaptic plasticity appears to be mediated by the MAPK14 signaling pathway (Figures 7–9). This study lays the foundation for the exploration of the mechanism of ATP11B in the regulation of synaptic plasticity.
Figure 9.
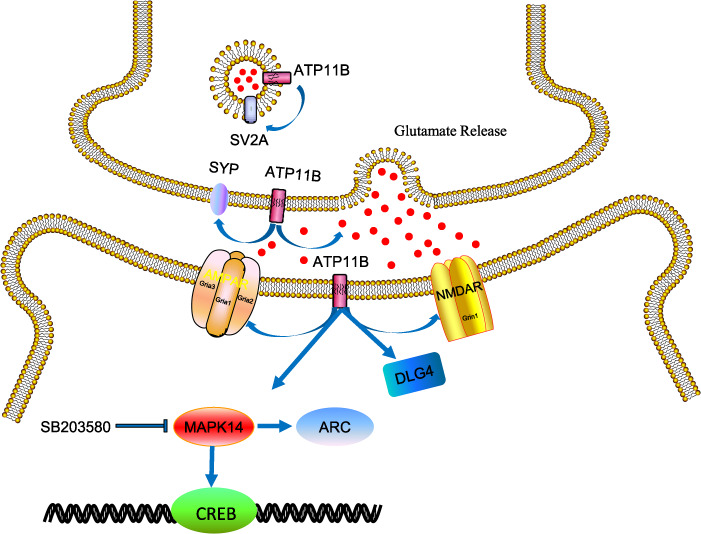
Schematic diagram showing that ATP11B regulates the synaptic-associated proteins (SV2A, SYP, and DLG4), increases glutamate release, enhances the expression of glutamate receptors, and raises the intracellular Ca2+ concentration in the mouse hippocampus, thus regulating synaptic plasticity through the MAPK14 signaling pathway.
It has been reported that changes in synaptic structure are caused by asymmetry of the neuronal cell membrane, and it is this asymmetry that maintains the structure of the synapse (Fontaine et al., 1979; Wood et al., 2011; Epand, 2015). PS is the most important phospholipid in the plasma membrane (Fadeel and Xue, 2009) and has been reported to be associated with functional maintenance of membranes (Pomorski et al., 2001). ATP11B belongs to P4-type ATPases, which regulate cellular internalization of phospholipids and maintain unstable distribution of phospholipids in the plasma membrane (Lopez-Marques et al., 2014). Here, we show that downregulation of ATP11B promotes PS externalization, whereas upregulation of ATP11B has no significant effect on PS localization (Figure 3), indicating that changes in ATP11B expression influence neuronal cell membrane asymmetry, ultimately regulating synaptic structure.
Recently, the function of SV2A in presynaptic signal transduction has been reviewed (Nensa et al., 2014), and its knockdown appears to negatively regulate dendritic spine density and synaptic plasticity (Cohen et al., 2011). Moreover, SV2A is also critical for Ca2+-dependent exocytosis in central neurons and can act as a redundant Ca2+ regulator in neurotransmitter release (Janz et al., 1999; Chang and Sudhof, 2009; Vogl et al., 2015). SYP and DLG4 are both important synaptic markers (Metz et al., 1986), mutants of which can impair synapse formation and neurotransmitter release (Tarsa and Goda, 2002; Beique and Andrade, 2003). In summary, the above proteins have been reported to participate in the regulation of synaptic plasticity. In the present paper, as shown in Figure 4, the expression of these synapse-associated proteins (including the presynaptic protein SV2A, synaptic vesicle-related protein SYP, and postsynaptic protein DLG4) were upregulated at both the mRNA and protein levels following overexpression of ATP11B in hippocampal neurons and downregulated following ATP11B knockdown. These results indicate that upregulation of ATP11B may increase neurotransmitter release (Janz et al., 1999), the function of synaptic vesicles (Alder et al., 1995; Sun et al., 2006; Kolos et al., 2015), and synaptic activity (Blanpied et al., 2008) via the upregulation of SV2A, SYP, and DLG4, which are closely associated with synaptic plasticity.
Glutamate is a crucial excitatory neurotransmitter in the CNS and plays an important role in the maintenance of synaptic plasticity (Mattson, 2008). Gated by the neurotransmitter glutamate, ionotropic AMPA glutamate receptors are known to mediate fast excitatory neurotransmission (Twomey et al., 2017). Moreover, AMPA receptors are important for synaptic plasticity, and dysregulation of AMPA receptors is linked to multiple neurological diseases (Twomey et al., 2017). Furthermore, an increase in glutamate release could also activate NMDA receptors and modulate NMDA receptor–dependent synaptic plasticity (Futagi and Kitano, 2015; Park et al., 2015). It is noteworthy that neurotransmitter releases via exocytosis as well as a number of synaptic receptors and proteins are modulated by PS on neuronal membranes (Kim et al., 2014). In addition, PS has been shown to facilitate neuronal activities depending on the plasma membrane composition, to prevent neuronal apoptosis, and to restore the levels of neurotransmitters and receptors (Osetla et al., 2008). As shown herein, ATP11B overexpression promoted glutamate release, increased the expression of AMPAR and NMDAR (Figure 5), and regulated the asymmetrical distribution of PS (Figure 3), indicating that upregulation of ATP11B increases glutamate release and the expression of its receptors through regulation of the asymmetrical distribution of PS, ultimately regulating synaptic plasticity.
NMDARs and AMPARs are involved in the regulation of glutamate release and calcium dynamics, which are colocalized at most excitatory synapses in the CNS (Chen and Diamond, 2002). Moreover, an increase in intracellular Ca2+ mediated by NMDA receptors in surrounding neurons often triggers changes in synaptic plasticity (Futagi and Kitano, 2015). It has been reported that an activity-dependent Ca2+ influx is required during the consolidation phase of synaptic plasticity in hippocampal neurons (Zhang et al., 2015a). Moreover, Ca2+ mobilization is a critical step in synaptic plasticity and is often the initial trigger for changes in plasticity (Fitzjohn and Collingridge, 2002). Furthermore, PS production is increased in cells of neuronal origin by compounds that trigger Ca2+ release, which is consistent with the fact that PS synthesis is a Ca2+-dependent process (Mikhaevitch et al., 1994). In the present paper, we found that overexpression of ATP11B increased the intracellular Ca2+ concentration (Figure 6) and regulated the asymmetrical distribution of PS (Figure 3) in primary hippocampal neurons, indicating that ATP11B regulates synaptic plasticity via increasing the intracellular Ca2+ concentration.
It has been reported that PS is localized in the cytoplasmic leaflet of the plasma membrane, which forms part of the docking site of proteins and is essential for the activation of crucial signaling pathways (Akbar et al., 2005; Kim, 2007, 2010). Modulation of the PS level in the plasma membrane of neurons contributes to these signaling processes (Kim et al., 2014); however, PS has also been shown to inhibit the phosphorylation and activation of MAPK14 (Doffek et al., 2011). Here, we found that changes in ATP11B expression influenced the asymmetrical distribution of PS, which participates in the regulation of the phosphorylation and expression of MAPK14. Furthermore, numerous lines of evidence have revealed that the MAPK14 signaling pathway plays a crucial role in synaptic plasticity and neurodegenerative diseases (Correa and Eales, 2012). Hippocampal synaptic plasticity that depends on glutamate receptor activation has been reported to be inhibited by SB203580, indicating a requirement for MAPK14 in synaptic plasticity (Thomas and Huganir, 2004). Further, it has been reported that CREB1, a common downstream target of MAPK14 (Mayer et al., 2013), is also involved in synaptic plasticity (Lazary et al., 2011). In addition, ARC degradation is critical for synaptic plasticity and memory (Husain et al., 2017). Interestingly, ARC is also involved in synaptic elimination of hippocampal neurons, which is specifically targeted to inactivated synapses and induces inactive synaptic/dendritic spines (Okuno et al., 2012). It has been shown that CREB1 is regulated by the GSK-3β signaling pathway (Pan et al., 2016; Xu et al., 2016). The ERK and MAPK signaling pathways can both activate CREB1 and trigger ARC transcription (Ying et al., 2002). In the present study, it was also demonstrated that the expression levels of CREB1 and ARC were not significantly reduced following treatment with SB203580. Therefore, we speculate that inhibition of MAPK14 by SB203580 may reduce the levels of CREB1 and ARC. Moreover, the expression of CREB1 and ARC may be regulated by the ERK and GSK-3β signaling pathways following other alternative proteins, including ATP11B. Thus, in comparison with the controls, the expression levels of CREB1 and ARC were not significantly reduced following treatment with SB203580 in the present study. In the present study, overexpression of ATP11B upregulated MAPK14 signaling molecules (Figure 7), and SB203580 treatment blocked the influence of ATP11B on the MAPK14 signaling pathway, indicating that ATP11B indeed regulates synaptic plasticity via the MAPK14 signaling pathway.
Our future research will aim to identify the crucial points in the ATP11B regulatory network with respect to hippocampal synaptic plasticity using time-series omics data for the construction of a specific network (Liu et al., 2016) and network biology methods for the integration of edge and node biomarkers (Zhang et al., 2015b; Zhao et al., 2016) and dynamic network biomarkers (DNB) (Chen et al., 2012; Li et al., 2017; Yang et al., 2018; Liu et al., 2019a, b).
Our experiments show that ATP11B overexpression influences the asymmetrical distribution of PS, which affects neuronal membrane asymmetry, improves the intracellular Ca2+ concentration, and increases the release of glutamate. Upregulated levels of synapse-associated proteins (including the presynaptic protein SV2A, synaptic vesicle–associated protein SYP, and postsynaptic protein DLG4) are important for neurotransmitter release. Accompanied by glutamate release, the trafficking and stabilization of AMPAR are needed postsynaptically to strengthen the excitatory synaptic transmission. Our results show that expression of the glutamate receptor was upregulated in mouse hippocampal neurons through the MAPK14 signaling pathway. In conclusion, ATP11B modifies synaptic ultrastructure and regulates synaptic plasticity. These data provide a novel perspective on synaptic plasticity and lay a theoretical foundation for neuroscience research.
Materials and methods
Materials
Neuralbasal (Gibco), B-27 (Gibco), GlutaMax (Gibco), fetal bovine serum (FBS; Invitrogen), Lipofectamine 2000 (Invitrogen), anti-GluR1 mouse monoclonal antibody (Santa Cruz), anti-AMPAR rabbit monoclonal antibody (BBI), anti-GRIN1 rabbit monoclonal antibody (BBI), 4′,6-diamidino-2-phenylindole (DAPI) (Invitrogen), anti-GAPDH mouse monoclonal antibody (Santa Cruz), and SB203580 (Selleck).
Ethics approval and consent to participate
All animals were treated in accordance with the International Guidelines for Animal Research. The study design was approved by the Animal Ethics Committee of Shanghai University.
Primary neuron culture
Culture of the primary neurons was performed as previously described (Jiang and Chen, 2006; Seibenhener and Wooten, 2012). The day prior to neuron isolation, all plates were coated with poly-D-Lysine, which was diluted with ddH2O at 37°C for 30 min. For immunofluorescence applications, poly-D-Lysine solution was used to coat glass coverslips in a 24-well plate. For cell culture applications, 60-mm dish was coated with poly-D-Lysine solution. The plates were washed with sterile ddH2O three times and rested uncovered under a UV light overnight. P0 mice were placed under ice anesthesia, sterilized with 75% ethanol, and transferred into a new plate. The entire brain was carefully removed using a sterile scalpel, and the hippocampus was separated under a stereoscope. Each hippocampus was transferred into a small tissue culture dish with warmed (37°C), sterile phosphate-buffered saline (PBS). After removing all PBS, the tissues were cut into pieces ~ 1 mm3 in size using sterile ophthalmic scissors. Trypsin was added, and the samples were incubated at 37°C for 5 min. Preheated culture medium (Neuralbasal +10% heat-inactivated FBS + 1% Penicillin/Streptomycin + 2% B-27 + 1% GlutaMax) was immediately added to terminate the digestion reaction. The samples were placed on ice for 5 min, and the supernatant was transferred to a new tube and centrifuged for 5 min at 800 g to collect single cells. The pellet was re-suspended in 1-ml culture medium after discarding the supernatant, and the cells were counted using an automated cell counter. The number of cells required for each well on 6- and 24-well plates was 5 × 10⁵ and 1 × 10⁵, respectively. The culture plates were gently shaken ~ 10 times and placed at 37°C. Serum-free medium was replaced on the fourth day, followed by the semi-quantitative liquid being changed every 3 days.
Cell transfection
The transfection of primary neurons was performed as described previously (Jiang and Chen, 2006). Cells from mouse hippocampus were seeded at 2 × 10⁵ cells per well in 24-well plates (NEST) 72 h prior to transfection. Fresh pre-warmed serum-free medium was replaced prior to transfection. The plates and the original medium were both returned to the incubator (37°C, 5% CO2). A typical composition of the precipitate for each 60-mm dish: 150 μl HEPES-buffered saline (HeBS) was placed in one tube and 15 μl 2.5 M CaCl2, 10 μg DNA, and ddH2O to a total of 150 μl were added to another tube. The DNA/CaCl2 mixture was subsequently added dropwise to the HeBS, ~1/8 of the mixture was added each time with gentle vortexing (2–3 sec), swirling well between each drop to mix well, which is critical for the formation of the precipitate. The DNA mixture was incubated for 15–20 min at room temperature, and the suspension solution was added dropwise onto the cells. After incubation for 45 min to 3 h in 5% CO2 incubator at 37°C, the precipitate was dissolved by incubating with a medium pre-equilibrated in a 10% CO2 incubator at 37°C for 15–20 min. A slightly acidic culture medium can dissolve the precipitate to reduce cell toxicity. Consequently, the acidic culture medium was replaced with the original medium and incubated at 5% CO2, 37°C. Semi-quantitative liquid was changed every 3 days. The primary neurons were transfected with the pcAGGS-EGFP, RNAi-Blank, pcAGGS-ATP11B-EGFP (GeneID:23200), and RNAi-ATP11B plasmids according to the protocol (Wang et al., 2018).
Immunofluorescence
The primary neurons that cultured on coverslips in a 24-well plate were washed with PBS, fixed in 4% paraformaldehyde for 30 min at room temperature, and permeabilized with 0.2% Triton X-100 for a further 30 min. The neuronal cells were stained with DAPI at room temperature for 30 min and then washed three times with PBS. Fluorescence was observed using a Zeiss LSM710 microscope.
Image morphological analysis
Confocal images were imported into Imaris (Version 9.0.1). Each spine on every dendritic branch was defined using the Filaments module of the Imaris software. Protrusions longer than 5 μm were considered as filopodia and excluded. Spine subtypes were classified as follows: Mushroom, spine head diameter (dh) ≥ 1.5 × the spine neck diameter (dn); Stubby, spine length (L) not significantly longer than the head diameter, and spine head and neck roughly the same width (dh/dn < 1.5, L/dh < 2); Thin, spine length longer than spine width, and spine head and neck diameters nearly equivalent (dh/dn < 1.5, L/dh ≥ 2); Branched, spines with more than one head (Bian et al., 2015).
Standard error of the mean observation
The primary neurons were analyzed using a Hitachi S-520 scanning electron microscope to detect changes in the following surface morphological features: synaptic cleft (nm), synaptic interface curvature, presynaptic active zone length (nm), and synaptic PSD (nm). For standard error of the mean (SEM), living cells require chemical fixation to preserve and stabilize their structure. Fixation is performed by incubation in a solution of a buffered glutaraldehyde. Samples for imaging will be mounted on a solid flat substrate. Before observation, the microscope was checked to see if it was energized and ready for operation, and all required personal protective equipment was worn. The samples were placed inside the microscope, and following ion milling to expose the required region, an electron beam of 1.6 kV was used with a milling beam of 30 kV and 800 pA. Each milling and imaging cycle took ~ 90 sec, with a pixel dwell time of 10 μsec for the electron beam. Six hundred to a thousand images were collected by sequentially milling and imaging, with a final image size of 2048 by 1536 pixels. Each pixel was 5 × 5 nm. Images were obtained on the screen and saved in the appropriate folder.
ATPase enzyme activity assay
Before detection, all reagents were brought to room temperature before use, and lab wares were ensured free from contaminating phosphate after thorough washing. Approximately 2 × 10⁶ suspended cells were lysed in ice-cold buffer and observed under a microscope. The cells were then centrifuged, and the supernatant retained. An appropriate range of dilution concentrations were selected for detection, and the enzyme was serially diluted in assay buffer. Reaction volumes of 40 μl were set up, including a control with no enzyme. The reaction was incubated for 30 min and 200 μl reagent was then added and incubated for a further 30 min at room temperature. The absorbance was read at 620 nm using a microplate reader. Compute the concentration of free phosphate produced [Pi] (μm) from the standard curve. Enzyme activity was calculated according to the following formula:
 |
Annexin V assay
For flow cytometry, the primary neurons were seeded on 6-well plates at a density of 4 × 10⁵ cells per well and incubated for 72 h at 37°C, 5% CO2, followed by transfection. The primary neurons were collected in 10% FBS–Dulbecco’s modified Eagle’s medium, digested with trypsin without Ethylenediaminetetraacetic acid, fixed in fresh medium, and centrifuged at 800 g for 5 min. Primary neurons were resuspended in 100 μl buffer and fixed with 5 μl Annexin V-PE and 5 μl 7-AAD in the dark, followed by incubation at room temperature for 15 min. Finally, the mixture was added to 400 μl buffer and detected using a PE Annexin V apoptosis detection kit (BD). Annexin V-PE binding was analyzed by flow cytometry (Ex = 488 nm; Em = 350 nm) using PE signal detector and 7-AAD staining by the phycoerythrin emission signal detector.
Quantitative real-time PCR
To calculate the relative expression levels of target genes, it is necessary to compare the expression level of target gene with the internal control. Using an RNA extraction kit (Promega), the total RNA was extracted following the manufacturer’s protocol. An RT Master Mix (TaKaRa) was used for cDNA synthesis. For the quantity of cDNA synthesis, the absorbance at 260 nm was measured to determine the concentration of cDNA, and the purity of cDNA was determined by the ratio of the absorbance at 260 to that at 280. Quantitative real-time PCR amplification was performed in Top Green qPCR Super Mix (Yeasen) containing cDNA samples and specific primers. The primer sequences are shown in Table 1. Relative gene expression was calculated by comparison of the CT value of the target gene with that of Gapdh.
Table 1.
A list of primers used for quantitative real-time PCR.
| Gene name | Primer sequences (5′ to 3′) |
|---|---|
| Sv2a | Upstream: GGCTTTCGAGACCGAGCAG Downstream: GACCTTCGGGAATACTCATCCT |
| Syp | Upstream: CAGTTCCGGGTGGTCAAGG Downstream: ACTCTCCGTCTTGTTGGCAC |
| Dlg4 | Upstream: TGAGCTATGAGACGGTGACG Downstream: CGGGAGGAGACAAAGTGGTA |
| Glur1 | Upstream: AAAGGAGTGTACGCCATCTTTG Downstream: GATATTGTTGGGGAAATTGGCACC |
| Glur2 | Upstream: TTCTCCTGTTTTATGGGGACTGA Downstream: CTACCCGAAATGCACTGTATTCT |
| Glur3 | Upstream: ACCATCAGCATAGGTGGACTT Downstream: ACGTGGTAGTTCAAATGGAAGG |
| Glur4 | Upstream: GGGAGGTGACTCCAAGGACA Downstream: CCAGTGATGGATAACCTGGCT |
| Grin1 | Upstream: AGAGCCCGACCCTAAAAAGAA Downstream: CCCTCCTCCCTCTCAATAGC |
| Mapk14 | Upstream: GGCTCGGCACACTGATGAT Downstream: TGGGGTTCCAACGAGTCTTAAA |
| Arc | Upstream: GTGTCCAAGCAGGTGGAGCG Downstream: TTGATGGACTTCTTCCAGCGCTG |
| Creb | Upstream: AGCAGCTCATGCAACATCATC Downstream: AGTCCTTACAGGAAGACTGAACT |
| Gapdh | Upstream: TCACCACCATGGAGAAGGC Downstream: GCTAAGCAGTTGGTGGTGCA |
Western blotting
The primary hippocampal neurons were transfected with ATP11B overexpression or silencing constructs. To extract the total protein from the primary neurons, cells were cultured on 6-well plates, washed with ice-cold PBS, and lysed in 2% Triton X-100 buffer. Sodium dodecyl sulfate polyacrylamide gel electrophoresis was used to separate the protein samples, which were subsequently electroblotted onto nitrocellulose membranes. The membranes were blocked with 5% bovine serum albumin–PBS for 1 h, and the following primary antibodies were applied at 4°C overnight: rabbit anti-SV2A (Abcam), rabbit anti-SYP (Boster), rabbit anti-DLG4 ((BBI), rabbit anti-MAPK14 (CST), rabbit anti-pMAPK14 (Abclonal), rabbit anti-CREB1 (BBI), rabbit anti-ARC (BBI), and rabbit anti-ATP11B (Sigma). The following day, the membranes were incubated with a mouse anti-GAPDH (1:1000, Abcam) antibody at room temperature for 1 h, followed by an infrared dye 700-conjugated affinity-purified goat anti-mouse IgG secondary antibody (Zemed) and an infrared dye 800-labeled goat anti-rabbit IgG secondary antibody (Zemed) for another hour. The relative protein expression levels were normalized to GAPDH, and the protein bands were detected using the LI-COR Odyssey infrared imaging system (simultaneous dual-color targeted analysis) and software (LI-COR).
Measurement of the glutamate concentration
The glutamate concentration was measured at 340 nm using a glutamic acid concentration detection kit (Njjcbio), according to the manufacturer’s protocol. Before detection, the 10 mmol/L glutamate standard stock solution was diluted with standard sample diluent to different concentrations: 25, 50, 100, 200, and 400 μmol/L for the preparation of the standard curve. The samples were the neuron culture medium, pretreated with reagent one, and then with the other reagents, according to the manufacturer’ protocol. The absorbance of each tube at 340 nm was measured as the A1 value, after the reagents and samples were thoroughly mixed. Reagent Five (400 μmol/L dilution) was then added. The mixture was incubated at 37°C for 40 min, and the absorbance of each tube at 340 nm was measured as the A2 value. Distilled water was used as the negative control (blank), and the 200 μmol/L glutamic acid standard solution was used as the positive control.
The glutamic acid concentration was calculated using the following formula:
Glutamate concentration (μmol/L) = [(measured A2 value − measured A1 value) − (blank A2 value − blank A1 value)]/[(standard A2 value − standard A1 value) − (blank A2 value − blank A1 value)] × standard concentration (200 μmol/L) × 4 (sample dilution prior to measurement).
Fluo4-AM assay
Fluo4-AM can be hydrolyzed by intracellular esterases to produce Fluo-4, which is a high-affinity Ca2+ dye that shows >100-fold increase in fluorescence following binding to Ca2+ (Spinelli and Gillespie, 2012). The fluorescence level was determined by flow cytometry at an excitation wavelength of 488 nm and an emission wavelength of 525 nm. A mass of 1 mg Fluo4-AM (Invitrogen) was dissolved in 912 μl anhydrous DMSO to make a stock solution of 1 mm, 5 μl of which was diluted with 1 ml Hanks’ balanced salts solution (HBSS) to give a working liquid of 5 μm. This liquid was freshly prepared before each use. Neuron cells were washed three times with HBSS, followed by the addition of the Fluo4-AM working liquid and incubation at 37°C for 30 min. Following the treatment, cells were washed three times with HBSS to fully remove the Fluo4-AM and incubated at 37°C for a further 30 min. The cell samples were subjected to a flow cytometer (MoFlo XDP, Beckman Coulter). Prior to detection, the samples were protected from light.
MAPK14 inhibition experiment
The cultured primary neurons were randomly assigned to four groups: control group, ATP11B overexpression group, MAPK14 inhibitor SB203580 (20 μm)-treated group, and the MAPK14 inhibitor SB203580 (20 μm)-treated in combination with overexpression of ATP11B group. The control group was incubated with an equal volume of PBS. The MAPK14 inhibitor was added 1 h prior to transfection with the ATP11B overexpression construct. After 48 h, protein was extracted, and the expression of MAPK14 signaling–related molecules was detected by western blotting.
Statistical analysis
Morphometric measurement and analysis of neuronal and synaptic structure were performed using the Image-Pro Plus 6.0 image analysis software. Spine subtypes were defined and classified using the Filaments module of the Imaris software (Version 9.0.1). All data are expressed as the mean ± SEM and analyzed by one-way analysis of variance or a t-test. SPSS18.0 software was used for all statistical analysis. Statistical significance was accepted at P < 0.05.
Supplementary Material
Acknowledgements
We would like to thank Dr Natalie Ward (Medical College of Wisconsin, USA) for editing this manuscript.
Funding
This work was supported by the National Natural Science Foundation of China (31500827, 81471162, and 61873156), Young Eastern Scholar (QD2015033), the Science and Technology Commission of Shanghai (14JC1402400), and the Natural Science Foundation of Shanghai (17ZR1409900).
Conflict of interest: none declared.
Author contributions: J.W. and T.W. conceived and designed the study. J.W., W.L., and F.Z. contributed to the data interpretation. F.Z., W.L., and J.L. conducted most of the experiments, with assistance from R.F., Q.L., and F.W. F.Z., Y.W., and S.Z. collected data and contributed to the statistical analysis. J.W., J.X., F.Z., and W.L. drafted the work. J.W. and T.W. approved the final version to be published.
References
- Akbar M., Calderon F., Wen Z., et al. (2005). Docosahexaenoic acid: a positive modulator of Akt signaling in neuronal survival. Proc. Natl Acad. Sci. USA 102, 10858–10863. [DOI] [PMC free article] [PubMed] [Google Scholar]
- Alder J., Kanki H., Valtorta F., et al. (1995). Overexpression of synaptophysin enhances neurotransmitter secretion at Xenopus neuromuscular synapses. J. Neurosci. 15, 511–519. [DOI] [PMC free article] [PubMed] [Google Scholar]
- Andreae L.C., and Burrone J. (2015). Spontaneous neurotransmitter release shapes dendritic arbors via long-range activation of NMDA receptors. Cell Rep. 10, 873–882. [DOI] [PMC free article] [PubMed] [Google Scholar]
- Bailey C.H., Kandel E.R., and Harris K.M. (2015). Structural components of synaptic plasticity and memory consolidation. Cold Spring Harb. Perspect. Biol. 7, a021758. [DOI] [PMC free article] [PubMed] [Google Scholar]
- Beique J.C., and Andrade R. (2003). PSD-95 regulates synaptic transmission and plasticity in rat cerebral cortex. J. Physiol. 546, 859–867. [DOI] [PMC free article] [PubMed] [Google Scholar]
- Benito E., and Barco A. (2010). CREB’s control of intrinsic and synaptic plasticity: implications for CREB-dependent memory models. Trends Neurosci. 33, 230–240. [DOI] [PubMed] [Google Scholar]
- Bian W.J., Miao W.Y., He S.J., et al. (2015). Coordinated spine pruning and maturation mediated by inter-spine competition for cadherin/catenin complexes. Cell 162, 808–822. [DOI] [PubMed] [Google Scholar]
- Blanpied T.A., Kerr J.M., and Ehlers M.D. (2008). Structural plasticity with preserved topology in the postsynaptic protein network. Proc. Natl Acad. Sci. USA 105, 12587–12592. [DOI] [PMC free article] [PubMed] [Google Scholar]
- Bonhoeffer T., and Yuste R. (2002). Spine motility. Phenomenology, mechanisms, and function. Neuron 35, 1019–1027. [DOI] [PubMed] [Google Scholar]
- Bourne J.N., and Harris K.M. (2008). Balancing structure and function at hippocampal dendritic spines. Annu. Rev. Neurosci. 31, 47–67. [DOI] [PMC free article] [PubMed] [Google Scholar]
- Chang W.P., and Sudhof T.C. (2009). SV2 renders primed synaptic vesicles competent for Ca2+-induced exocytosis. J. Neurosci. 29, 883–897. [DOI] [PMC free article] [PubMed] [Google Scholar]
- Chen L., Liu R., Liu Z.P., et al. (2012). Detecting early-warning signals for sudden deterioration of complex diseases by dynamical network biomarkers. Sci. Rep. 2, 342. [DOI] [PMC free article] [PubMed] [Google Scholar]
- Chen S., and Diamond J.S. (2002). Synaptically released glutamate activates extrasynaptic NMDA receptors on cells in the ganglion cell layer of rat retina. J. Neurosci. 22, 2165–2173. [DOI] [PMC free article] [PubMed] [Google Scholar]
- Cohen J.E., Lee P.R., Chen S., et al. (2011). MicroRNA regulation of homeostatic synaptic plasticity. Proc. Natl Acad. Sci. USA 108, 11650–11655. [DOI] [PMC free article] [PubMed] [Google Scholar]
- Coleman J.A., Quazi F., and Molday R.S. (2013). Mammalian P4-ATPases and ABC transporters and their role in phospholipid transport. Biochim. Biophys. Acta 1831, 555–574. [DOI] [PMC free article] [PubMed] [Google Scholar]
- Correa S.A., and Eales K.L. (2012). The role of p38 MAPK and its substrates in neuronal plasticity and neurodegenerative disease. J. Signal. Transduct. 2012, 649079. [DOI] [PMC free article] [PubMed] [Google Scholar]
- Doffek K., Chen X., Sugg S.L., et al. (2011). Phosphatidylserine inhibits NFκB and p38 MAPK activation in human monocyte derived dendritic cells. Mol. Immunol. 48, 1771–1777. [DOI] [PubMed] [Google Scholar]
- Epand R.M. (2015). Introduction to membrane lipids. Methods. Mol. Biol. 1232, 1–6. [DOI] [PubMed] [Google Scholar]
- Fadeel B., and Xue D. (2009). The ins and outs of phospholipid asymmetry in the plasma membrane: roles in health and disease. Crit. Rev. Biochem. Mol. Biol. 44, 264–277. [DOI] [PMC free article] [PubMed] [Google Scholar]
- Feng G., Mellor R.H., Bernstein M., et al. (2000). Imaging neuronal subsets in transgenic mice expressing multiple spectral variants of GFP. Neuron 28, 41–51. [DOI] [PubMed] [Google Scholar]
- Fitzjohn S.M., and Collingridge G.L. (2002). Calcium stores and synaptic plasticity. Cell Calcium 32, 405–411. [DOI] [PubMed] [Google Scholar]
- Fontaine R.N., Harris R.A., and Schroeder F. (1979). Neuronal membrane lipid asymmetry. Life Sci. 24, 395–399. [DOI] [PubMed] [Google Scholar]
- Futagi D., and Kitano K. (2015). Ryanodine-receptor-driven intracellular calcium dynamics underlying spatial association of synaptic plasticity. J. Comput. Neurosci. 39, 329–347. [DOI] [PMC free article] [PubMed] [Google Scholar]
- Hagerman P.J. (2012). Current gaps in understanding the molecular basis of FXTAS. Tremor Other Hyperkinet. Mov. 2, pii: tre-02-63-375-2. [DOI] [PMC free article] [PubMed] [Google Scholar]
- Harris K.P., and Littleton J.T. (2015). Transmission, development, and plasticity of synapses. Genetics 201, 345–375. [DOI] [PMC free article] [PubMed] [Google Scholar]
- Husain N., Yuan Q., Yen Y.C., et al. (2017). TRIAD3/RNF216 mutations associated with Gordon Holmes syndrome lead to synaptic and cognitive impairments via Arc misregulation. Aging Cell 16, 281–292. [DOI] [PMC free article] [PubMed] [Google Scholar]
- Janz R., Goda Y., Geppert M., et al. (1999). SV2A and SV2B function as redundant Ca2+ regulators in neurotransmitter release. Neuron 24, 1003–1016. [DOI] [PubMed] [Google Scholar]
- Jiang M., and Chen G. (2006). High Ca2+-phosphate transfection efficiency in low-density neuronal cultures. Nat. Protoc. 1, 695–700. [DOI] [PubMed] [Google Scholar]
- Kato C., Tochigi M., Ohashi J., et al. (2008). Association study of the 15q11-q13 maternal expression domain in Japanese autistic patients. Am. J. Med. Genet. B Neuropsychiatr. Genet. 147B, 1008–1012. [DOI] [PubMed] [Google Scholar]
- Kenis H., van Genderen H., Bennaghmouch A., et al. (2004). Cell surface-expressed phosphatidylserine and annexin A5 open a novel portal of cell entry. J. Biol. Chem. 279, 52623–52629. [DOI] [PubMed] [Google Scholar]
- Kim H.Y. (2007). Novel metabolism of docosahexaenoic acid in neural cells. J. Biol. Chem. 282, 18661–18665. [DOI] [PubMed] [Google Scholar]
- Kim H.Y., Akbar M., and Kim Y.S. (2010). Phosphatidylserine-dependent neuroprotective signaling promoted by docosahexaenoic acid. Prostaglandins Leukot. Essent Fatty Acids 82, 165–172. [DOI] [PMC free article] [PubMed] [Google Scholar]
- Kim H.Y., Huang B.X., and Spector A.A. (2014). Phosphatidylserine in the brain: metabolism and function. Prog. Lipid Res. 56, 1–18. [DOI] [PMC free article] [PubMed] [Google Scholar]
- Kolos Y.A., Grigoriyev I.P., and Korzhevskyi D.E. (2015). A synaptic marker synaptophysin. Morfologiia 147, 78–82. [PubMed] [Google Scholar]
- Kumar B., Koul S., Petersen J., et al. (2010). p38 mitogen-activated protein kinase-driven MAPKAPK2 regulates invasion of bladder cancer by modulation of MMP-2 and MMP-9 activity. Cancer Res. 70, 832–841. [DOI] [PubMed] [Google Scholar]
- Kumar V., Zhang M.X., Swank M.W., et al. (2005). Regulation of dendritic morphogenesis by Ras–PI3K–Akt–mTOR and Ras–MAPK signaling pathways. J. Neurosci. 25, 11288–11299. [DOI] [PMC free article] [PubMed] [Google Scholar]
- Lazary J., Juhasz G., Anderson I.M., et al. (2011). Epistatic interaction of CREB1 and KCNJ6 on rumination and negative emotionality. Eur. Neuropsychopharmacol. 21, 63–70. [DOI] [PubMed] [Google Scholar]
- Levano K., Punia V., Raghunath M., et al. (2012). Atp8a1 deficiency is associated with phosphatidylserine externalization in hippocampus and delayed hippocampus-dependent learning. J. Neurochem. 120, 302–313. [DOI] [PMC free article] [PubMed] [Google Scholar]
- Li H., Wetten S., Li L., et al. (2008). Candidate single-nucleotide polymorphisms from a genomewide association study of Alzheimer disease. Arch. Neurol. 65, 45–53. [DOI] [PubMed] [Google Scholar]
- Li M., Li C., Liu W.X., et al. (2017). Dysfunction of PLA2G6 and CYP2C44-associated network signals imminent carcinogenesis from chronic inflammation to hepatocellular carcinoma. J. Mol. Cell Biol. 9, 489–503. [DOI] [PMC free article] [PubMed] [Google Scholar]
- Liu R., Wang J., Ukai M., et al. (2019a). Hunt for the tipping point during endocrine resistance process in breast cancer by dynamic network biomarkers. J. Mol. Cell Biol. doi: 10.1093/jmcb/mjy059. [DOI] [PMC free article] [PubMed] [Google Scholar]
- Liu X., Chang X., Leng S., et al. (2019b). Detection for disease tipping points by landscape dynamic network biomarkers. Natl Sci. Rev. doi: 10.1093/nsr/nwy162. [DOI] [PMC free article] [PubMed] [Google Scholar]
- Liu X., Wang Y., Ji H., et al. (2016). Personalized characterization of diseases using sample-specific networks. Nucleic Acids Res. 44, e164. [DOI] [PMC free article] [PubMed] [Google Scholar]
- Lopez-Marques R.L., Theorin L., Palmgren M.G., et al. (2014). P4-ATPases: lipid flippases in cell membranes. Pflugers Arch. 466, 1227–1240. [DOI] [PMC free article] [PubMed] [Google Scholar]
- Marsden W.N. (2013). Synaptic plasticity in depression: molecular, cellular and functional correlates. Prog. Neuropsychopharmacol. Biol. Psychiatry 43, 168–184. [DOI] [PubMed] [Google Scholar]
- Matosin N., Fernandez-Enright F., Lum J.S., et al. (2016). Molecular evidence of synaptic pathology in the CA1 region in schizophrenia. NPJ Schizophr. 2, 16022. [DOI] [PMC free article] [PubMed] [Google Scholar]
- Mattson M.P. (2008). Glutamate and neurotrophic factors in neuronal plasticity and disease. Ann. NY Acad. Sci. 1144, 97–112. [DOI] [PMC free article] [PubMed] [Google Scholar]
- Mayer T.Z., Simard F.A., Cloutier A., et al. (2013). The p38–MSK1 signaling cascade influences cytokine production through CREB and C/EBP factors in human neutrophils. J. Immunol. 191, 4299–4307. [DOI] [PubMed] [Google Scholar]
- McMahon H.T., and Gallop J.L. (2005). Membrane curvature and mechanisms of dynamic cell membrane remodelling. Nature 438, 590–596. [DOI] [PubMed] [Google Scholar]
- Metz J., Gerstheimer F.P., and Herbst M. (1986). Distribution of synaptophysin immunoreactivity in guinea pig heart. Histochemistry 86, 221–224. [DOI] [PubMed] [Google Scholar]
- Mikhaevitch I.S., Singh I.N., Sorrentino G., et al. (1994). Modulation of phosphatidylserine synthesis by a muscarinic receptor occupancy in human neuroblastoma cell line LA-N-1. Biochem. J. 299, 375–380. [DOI] [PMC free article] [PubMed] [Google Scholar]
- Montagna E., Dorostkar M.M., and Herms J. (2017). The role of APP in structural spine plasticity. Front. Mol. Neurosci. 10, 136. [DOI] [PMC free article] [PubMed] [Google Scholar]
- Nensa F.M., Neumann M.H., Schrotter A., et al. (2014). Amyloid β a4 precursor protein-binding family B member 1 (FE65) interactomics revealed synaptic vesicle glycoprotein 2A (SV2A) and sarcoplasmic/endoplasmic reticulum calcium ATPase 2 (SERCA2) as new binding proteins in the human brain. Mol. Cell. Proteomics 13, 475–488. [DOI] [PMC free article] [PubMed] [Google Scholar]
- Okuno H., Akashi K., Ishii Y., et al. (2012). Inverse synaptic tagging of inactive synapses via dynamic interaction of arc/Arg3.1 with CaMKIIβ. Cell 149, 886–898. [DOI] [PMC free article] [PubMed] [Google Scholar]
- Osetla M.C., Re G., Badino P., et al. (2008). Phosphatidylserine (PS) as a potential nutraceutical for canine brain aging: a review. J. Vet. Behav. 3, 41–51. [Google Scholar]
- Pan B., Huang X.F., Deng C. (2016). Chronic administration of aripiprazole activates GSK3β-dependent signalling pathways, and up-regulates GABAA receptor expression and CREB1 activity in rats. Sci. Rep. 6, 30040. [DOI] [PMC free article] [PubMed] [Google Scholar]
- Park H., Han K.S., Seo J., et al. (2015). Channel-mediated astrocytic glutamate modulates hippocampal synaptic plasticity by activating postsynaptic NMDA receptors. Mol. Brain 8, 7. [DOI] [PMC free article] [PubMed] [Google Scholar]
- Piomelli D., Astarita G., and Rapaka R. (2007). A neuroscientist’s guide to lipidomics. Nat. Rev. Neurosci. 8, 743–754. [DOI] [PubMed] [Google Scholar]
- Pomorski T., Hrafnsdottir S., Devaux P.F., et al. (2001). Lipid distribution and transport across cellular membranes. Semin. Cell Dev. Biol. 12, 139–148. [DOI] [PubMed] [Google Scholar]
- Posfai B., Cserep C., Hegedus P., et al. (2016). Synaptic and cellular changes induced by the schizophrenia susceptibility gene G72 are rescued by N-acetylcysteine treatment. Transl. Psychiatry 6, e807. [DOI] [PMC free article] [PubMed] [Google Scholar]
- Raynaud F., Homburger V., Seveno M., et al. (2018). SNAP23–‒Kif5 complex controls mGlu1 receptor trafficking. J. Mol. Cell Biol 10, 423–436. [DOI] [PubMed] [Google Scholar]
- Saheki Y., and De Camilli P. (2012). Synaptic vesicle endocytosis. Cold Spring Harb. Perspect. Biol. 4, a005645. [DOI] [PMC free article] [PubMed] [Google Scholar]
- Schroll H., Vitay J., and Hamker F.H. (2014). Dysfunctional and compensatory synaptic plasticity in Parkinson’s disease. Eur. J. Neurosci. 39, 688–702. [DOI] [PubMed] [Google Scholar]
- Segal I., Korkotian I., and Murphy D.D. (2000). Dendritic spine formation and pruning: common cellular mechanisms? Trends Neurosci. 23, 53–57. [DOI] [PubMed] [Google Scholar]
- Seibenhener M.L., and Wooten M.W. (2012). Isolation and culture of hippocampal neurons from prenatal mice. J. Vis. Exp. pii: 3634. [DOI] [PMC free article] [PubMed] [Google Scholar]
- Sellier C., Rau F., Liu Y., et al. (2010). Sam68 sequestration and partial loss of function are associated with splicing alterations in FXTAS patients. EMBO J. 29, 1248–1261. [DOI] [PMC free article] [PubMed] [Google Scholar]
- Singh A., and Abraham W.C. (2017). Astrocytes and synaptic plasticity in health and disease. Exp. Brain Res. 235, 1645–1655. [DOI] [PubMed] [Google Scholar]
- Soule J., Alme M., Myrum C., et al. (2012). Balancing Arc synthesis, mRNA decay, and proteasomal degradation: maximal protein expression triggered by rapid eye movement sleep-like bursts of muscarinic cholinergic receptor stimulation. J. Biol. Chem. 287, 22354–22366. [DOI] [PMC free article] [PubMed] [Google Scholar]
- Spinelli K.J., and Gillespie P.G. (2012). Monitoring intracellular calcium ion dynamics in hair cell populations with Fluo-4 AM. PLoS One 7, e51874. [DOI] [PMC free article] [PubMed] [Google Scholar]
- Steiner P., Higley M.J., Xu W., et al. (2008). Destabilization of the postsynaptic density by PSD-95 serine 73 phosphorylation inhibits spine growth and synaptic plasticity. Neuron 60, 788–802. [DOI] [PMC free article] [PubMed] [Google Scholar]
- Sudhof T.C. (2012). The presynaptic active zone. Neuron 75, 11–25. [DOI] [PMC free article] [PubMed] [Google Scholar]
- Sun T., Xiao H.S., Zhou P.B., et al. (2006). Differential expression of synaptoporin and synaptophysin in primary sensory neurons and up-regulation of synaptoporin after peripheral nerve injury. Neuroscience 141, 1233–1245. [DOI] [PubMed] [Google Scholar]
- Tang A.H., Chen H., Li T.P., et al. (2016). A trans-synaptic nanocolumn aligns neurotransmitter release to receptors. Nature 536, 210–214. [DOI] [PMC free article] [PubMed] [Google Scholar]
- Tarsa L., and Goda Y. (2002). Synaptophysin regulates activity-dependent synapse formation in cultured hippocampal neurons. Proc. Natl Acad. Sci. USA 99, 1012–1016. [DOI] [PMC free article] [PubMed] [Google Scholar]
- Thomas G.M., and Huganir R.L. (2004). MAPK cascade signalling and synaptic plasticity. Nat. Rev. Neurosci. 5, 173–183. [DOI] [PubMed] [Google Scholar]
- Twomey E.C., Yelshanskaya M.V., Grassucci R.A., et al. (2017). Channel opening and gating mechanism in AMPA-subtype glutamate receptors. Nature 549, 60–65. [DOI] [PMC free article] [PubMed] [Google Scholar]
- Vogl C., Tanifuji S., Danis B., et al. (2015). Synaptic vesicle glycoprotein 2A modulates vesicular release and calcium channel function at peripheral sympathetic synapses. Eur. J. Neurosci. 41, 398–409. [DOI] [PubMed] [Google Scholar]
- Wang J., Molday L.L., Hii T., et al. (2018). Proteomic analysis and functional characterization of P4-ATPase Phospholipid flippases from murine tissues. Sci. Rep. 8, 10795. [DOI] [PMC free article] [PubMed] [Google Scholar]
- Wang J., Wang Q., Zhou F., et al. (2017). Silencing of ATP11B by RNAi-induced changes in neural stem cell morphology. Methods Mol. Biol. 1622, 51–61. [DOI] [PubMed] [Google Scholar]
- Wang J., Yuan J., Pang J., et al. (2016). Effects of chronic stress on cognition in male SAMP8 mice. Cell. Physiol. Biochem. 39, 1078–1086. [DOI] [PubMed] [Google Scholar]
- Wood W.G., Igbavboa U., Muller W.E., et al. (2011). Cholesterol asymmetry in synaptic plasma membranes. J. Neurochem. 116, 684–689. [DOI] [PMC free article] [PubMed] [Google Scholar]
- Xu Q., Liu T., Chen S., et al. (2013). Correlation between the cumulative analgesic effect of electroacupuncture intervention and synaptic plasticity of hypothalamic paraventricular nucleus neurons in rats with sciatica. Neural Regen. Res. 8, 218–225. [DOI] [PMC free article] [PubMed] [Google Scholar]
- Xu X., Zhu Y., Liang Z., et al. (2016). c-Met and CREB1 are involved in miR-433-mediated inhibition of the epithelial-mesenchymal transition in bladder cancer by regulating Akt/GSK-3β/Snail signaling. Cell Death Dis. 7, e2088. [DOI] [PMC free article] [PubMed] [Google Scholar]
- Yang B., Li M., Tang W., et al. (2018). Dynamic network biomarker indicates pulmonary metastasis at the tipping point of hepatocellular carcinoma. Nat. Commun. 9, 678. [DOI] [PMC free article] [PubMed] [Google Scholar]
- Ying S.W., Futter M., Rosenblum K., et al. (2002). Brain-derived neurotrophic factor induces long-term potentiation in intact adult hippocampus: requirement for ERK activation coupled to CREB and upregulation of Arc synthesis. J. Neurosci. 22, 1532–1540. [DOI] [PMC free article] [PubMed] [Google Scholar]
- Yong Z., Yan L., Gao X., et al. (2014). Effects of thienorphine on synaptic structure and synaptophysin expression in the rat nucleus accumbens. Neuroscience 274, 53–58. [DOI] [PubMed] [Google Scholar]
- Zagrebelsky M., Holz A., Dechant G., et al. (2005). The p75 neurotrophin receptor negatively modulates dendrite complexity and spine density in hippocampal neurons. J. Neurosci. 25, 9989–9999. [DOI] [PMC free article] [PubMed] [Google Scholar]
- Zhang H., Liu J., Sun S., et al. (2015a). Calcium signaling, excitability, and synaptic plasticity defects in a mouse model of Alzheimer’s disease. J. Alzheimers Dis. 45, 561–580. [DOI] [PMC free article] [PubMed] [Google Scholar]
- Zhang W., Zeng T., Liu X., et al. (2015b). Diagnosing phenotypes of single-sample individuals by edge biomarkers. J. Mol. Cell Biol. 7, 231–241. [DOI] [PubMed] [Google Scholar]
- Zhao J., Zhou Y., Zhang X., et al. (2016). Part mutual information for quantifying direct associations in networks. Proc. Natl Acad. Sci. USA 113, 5130–5135. [DOI] [PMC free article] [PubMed] [Google Scholar]
Associated Data
This section collects any data citations, data availability statements, or supplementary materials included in this article.