

Abstract
Glutamate excitotoxicity is a pathology in which excessive glutamate can cause neuronal damage and degeneration. It has also been linked to secondary injury mechanisms in traumatic spinal cord injury. Conventional bioanalytical techniques used to characterize glutamate levels in vivo, such as microdialysis, have low spatiotemporal resolution, which has impeded our understanding of this dynamic event. In this study, we present an amperometric biosensor fabricated using a simple direct ink writing technique for the purpose of in vivo glutamate monitoring. The biosensor is fabricated by immobilizing glutamate oxidase on nanocomposite electrodes made of platinum nanoparticles, multi-walled carbon nanotubes, and a conductive polymer on a flexible substrate. The sensor is designed to measure extracellular dynamics of glutamate and other potential biomarkers during a traumatic spinal cord injury event. Here we demonstrate good sensitivity and selectivity of these rapidly prototyped implantable biosensors that can be inserted into a spinal cord and measure extracellular glutamate concentration. We show that our biosensors exhibit good flexibility, linear range, repeatability, and stability that are suitable for future in vivo evaluation.
Keywords: Direct ink writing, Additive manufacturing, Rapid prototyping, Glutamate, Implantable, Biosensor, Spinal cord injury
1. Introduction
Glutamate excitotoxicity (GET) is a neuropathology that persists in many neurodegenerative disorders such as Parkinson’s and Alzheimer’s disease as well as in traumatic brain and spinal cord injuries (SCI) (Park et al., 2004; Caudle and Zhang, 2009; Oyinbo, 2011). Glutamate is a one of the major neurotransmitters in the nervous system, well-known for its role in relaying excitatory signals. However, a large concentration of glutamate has been known to cause deleterious effects on neural substrates. When neural tissue degenerates due to a disease or a trauma, dying cells often release a large amount of glutamate into the extracellular space and trigger a cascade of overstimulation-related neural damage and demyelination (Fu et al., 2009). Despite extensive research in neurodegeneration, the mechanism for a sustained high levels of extracellular glutamate remains unclear. Thus, a better understanding of GET in neurodegenerative disorders and neurotrauma may lead to novel therapeutic interventions to minimize GET-related secondary damage (Lau and Tymianski, 2010).
Traditionally, nuclear magnetic resonance spectroscopy, positron emission tomography, and microdialysis have been used to quantify extracellular glutamate levels in vivo. However, these techniques often suffer from low sensitivity and poor spatiotemporal resolution. There are several examples of using microdialysis to quantify extracellular glutamate levels following a SCI in vivo (Miele et al., 1996; Xu et al., 1998), but the glutamate measurements were often delayed up to 30 min due to laborious sampling and analysis processes associated with this technique.
Recently, implantable electrochemical glutamate sensors have emerged as a promising alternative for in vivo glutamate monitoring due to relatively fast response time and precise positioning. Using conventional microelectromechanical systems (MEMS) techniques, several groups have developed microscale biosensors for measuring glutamate level in the brain or the spinal cord (Cao et al., 2012; Govindarajan et al., 2013; Weltin et al., 2014). However, most MEMS-based glutamate biosensors are rigid, expensive, and time-consuming to fabricate.
Printable electronics techniques can address many of the short-comings of conventional MEMS fabrication processes by enabling rapid production of low-cost, flexible devices (Lewis, 2006; Ahn et al., 2009). Specifically, there has recently been significant efforts to use various printing techniques for developing devices for biological, medical, and optical applications (Hon et al., 2008). Flexible electrochemical biosensors and other electronic devices are now commonly fabricated using screen-printing and ink-jet printing techniques (Lee et al., 2012, 2012; Cinti et al., 2015; Hondred et al., 2017).
Another additive manufacturing technique is direct ink writing, which is particularly useful for printing high-aspect-ratio features on any planar or non-planar substrate (Lewis, 2006; Hon et al., 2008; Kadara et al., 2008). The direct writing platform uses a computer-controlled translational stage to directly deposit high viscosity functional materials with microscale resolution without the need for patterning masks. In this study, we used direct ink writing as a simple, low-cost method to rapidly fabricate microscale electrodes by printing conductive, flexible nanocomposite ink on thin-film polymer substrates. The nanocomposite ink consisted of platinum nanoparticles (PtNPs), multi-walled carbon nanotubes (MWCNT), conductive polymer—poly (3,4-ethylenedioxythiophene) polystyrene sulfonate (PEDOT: PSS), and Ecoflex™ silicone rubber. We immobilized glutamate oxidase on top of printed PtNPs-MWCNT-PEDOT:PSS-Ecoflex (PtNPs nanocomposite) electrodes to make microscale implantable glutamate sensors with high sensitivity, linearity and selectivity. Finally, we used our sensors to measure glutamate release from an excised spinal cord segment of a rat following a SCI. Our ultimate goal is to use our easy-to-fabricate implantable glutamate sensors to better characterize the dynamic process of GET during a neurotrauma.
2. Experimental section
2.1. Materials
PEDOT: PSS (5 wt%), Nafion 117 solution (5 wt%), platinum nanoparticles (< 50 nm particle size) were obtained from Sigma Aldrich (St. Louis, MO). Carboxylic functionalized multi-walled carbon nanotube (MWCNT) were generously donated by Cheap Tubes Inc. (Grafton, Vermont). L-Glutamic acid, bovine serum albumin (BSA, min 96%), glutaraldehyde (50% in deionized water), hydrogen peroxide (30%), 0.1 M phosphate buffer solution (PBS, pH 7), and dimethyl sulfoxide (DMSO) were obtained from Fisher Scientific (Walham, MA). Ascorbic acid (AA) and uric acid (UA), and acetaminophen (AC) were purchased from Alfa Aesar (Thermo Fisher Scientific, Walham, MA). Glutamate oxidase (GluOx) from Streptomyces, with a rated activity of 25 units per mg protein was purchased from Cosmo Bio USA (Carlsbad, CA). Ag (CI-1001) and Ag/AgCl (CI-4001) were generously donated by Engineered Conductive Materials Inc. (Delaware, OH). Ecoflex (00–30) was obtained from Smooth-On (Macungie, PA). Elastomeric polydime- thylsiloxane (PDMS, Sylgard 184) was purchased from Dow Corning (Midland, MI).
2.2. Nanocomposite ink preparation
To create the PtNPs nanocomposite, 30 mg of carboxylic functionalized MWCNT (1 wt%) and 30 mg PtNPs (1 wt%) were first mixed with 582.75 μl (22 wt%) of DMSO in a sonication bath for 2 h. The mixture then was added to 2000 mg PEDOT: PSS ink, and sonicated again for 10 min to re-disperse the nano materials. Finally, 520 mg (16 wt%) Ecoflex was added and mixed using a homogenizer Ultra-Turrax T 25, IKA, Wilmington, NC) at 10000 rpm overnight. The final mixture was dried at 60 °C in vacuum for 1 h to remove excess DMSO and to create desired viscosity for printing. MWCNT-PEDOT:PSS nanocomposite and PEDOT:PSS ink were also prepared for electrochemical characterization using a similar procedure except without PtNPs. The PEDOT:PSS ink was modified with DMSO (22 wt%) to improve conductivity.
2.3. Direct writing of biosensors
Fig. 1a shows the fabrication process of a flexible glutamate biosensor using direct ink writing on a flexible polymer substrate. A commercial 3-axis microfluid dispensing robot (Pro-EV 3, Nordson EFD, East Providence, RI) was used to print the conductive ink. To achieve microscale features, pulled glass capillary pipettes with 30 μm-diameter tips were used as the dispensing nozzle. PtNPs nanocomposite ink was used to define the working electrode, counter electrode, and conductive traces. Silver/silver chloride (Ag/AgCl) ink was used as the reference electrode and contact pads. To insulate the device, PDMS was printed over the conductive traces leaving only the electrodes and contact pads exposed.
Fig. 1.
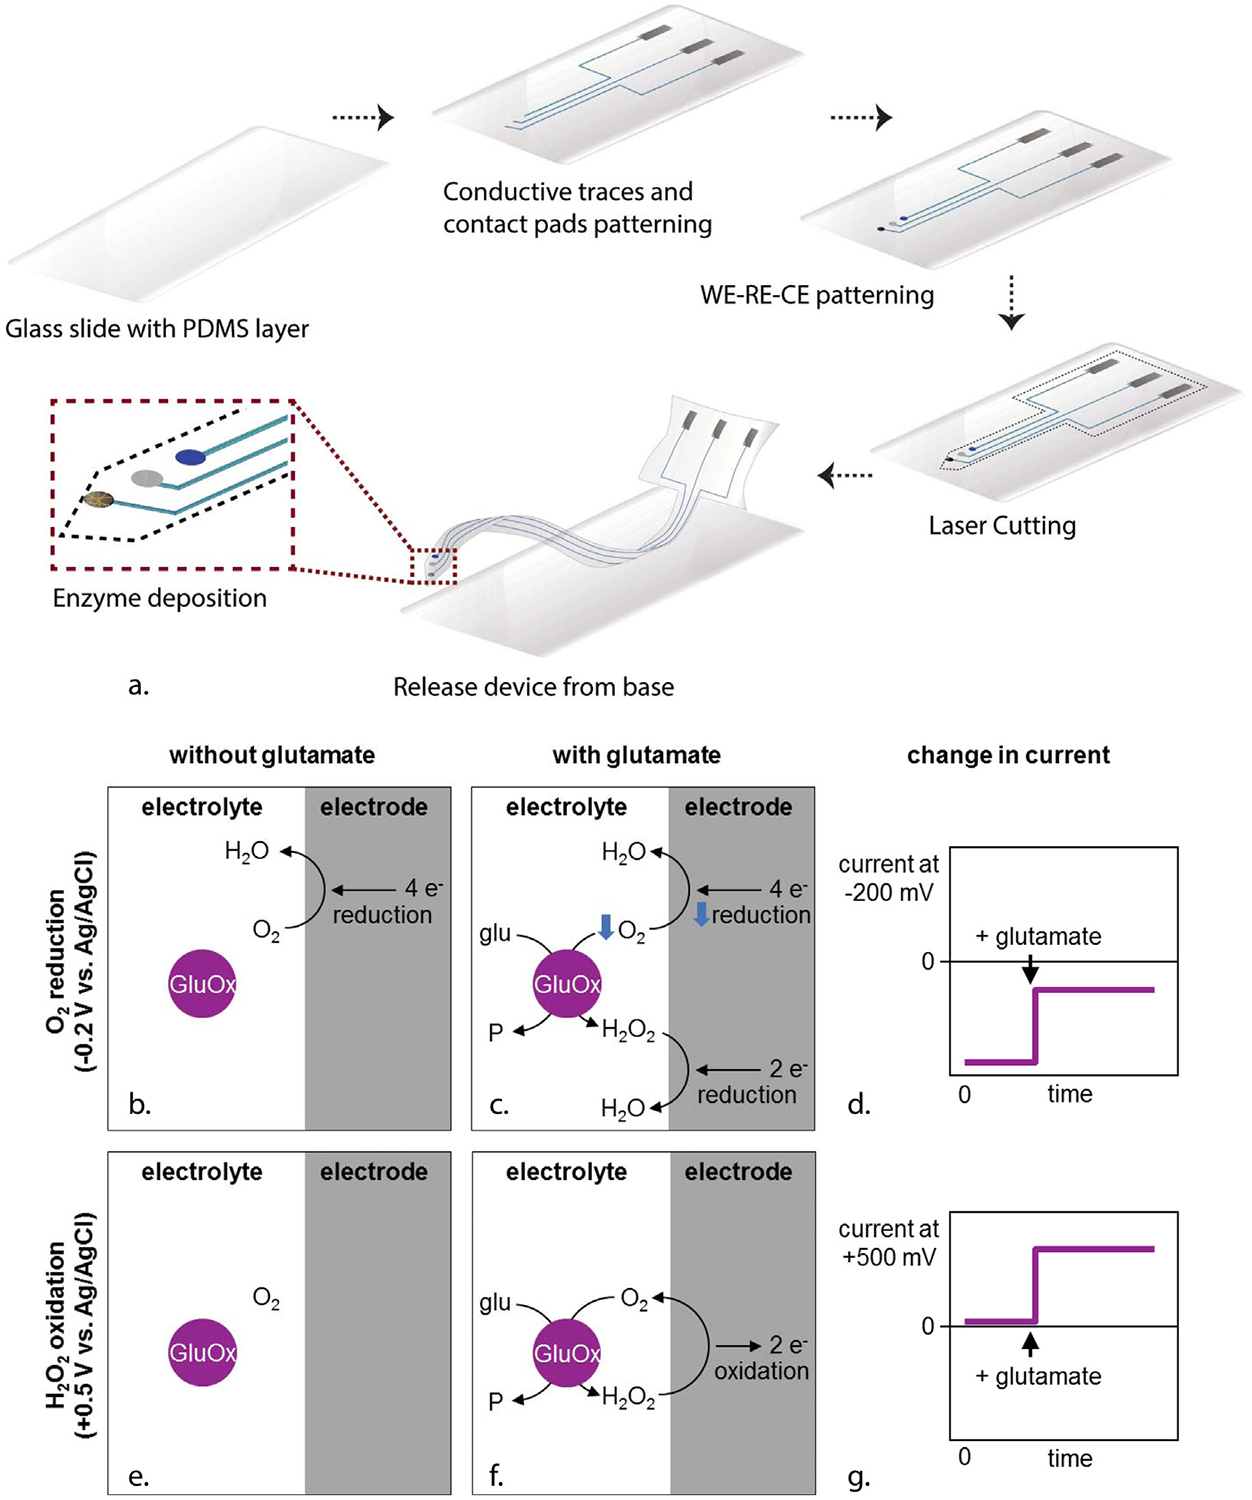
(a) Schematic of fabrication process of PtNPs-nanocomposite-based glutamate biosensor on a PDMS substrate. The glutamate biosensor works by one of two first-generation mechanisms depending on the bias potential (−0.2 V or 0.5 V vs. Ag/AgCl). In both cases, the enzymatic reaction is L-glutamate + O2 + H2O → α-ketoglutarate + H2O2 + NH3. In the figure, some species have not been shown for concision. P stands for alpha-ketoglutarate and NH3; glu, for glutamate (and H2O); GluOx for glutamate oxidase. (b) At 0.5 V vs. Ag/AgCl, the working electrode oxidizes H2O2 (H2O2 → O2 + 2H+ + 2e−). Because the calibration electrolyte initially has no H2O2, the current starts near zero. (c) When glutamate is added, the enzymatic reaction produces H2O2, which then oxidizes on the electrode. This creates an anodic current. (d) Therefore, the current at 0.5 V vs. Ag/AgCl also appears more positive when glutamate is added. (e) At −0.2 V vs. Ag/AgCl, the working electrode reduces O2 dissolved in the electrolyte (O2 + 4H+ + 4e− → 2H2O). Because of O2 reduction, the sensor starts with a negative cathodic current. (f) When glutamate is added, the enzymatic reaction consumes and depletes O2, and therefore O2 reduction at the electrode decreases. Although H2O2 reduction (H2O2 + 2H+ + 2e− → 2H2O) increases, the net effect is a decrease in cathodic current. (g) Therefore, the current at −0.2 V vs. Ag/AgCl becomes more positive when glutamate is added.
2.4. Micromachining of implantable biosensor
To complete the implantable biosensor, we used two different rapid prototyping techniques. In the first type, a femtosecond laser (CARBIDE, Altos Photonics, USA) was used to machine the probe outline from a 40-μm-thick PDMS film on Parylene C-coated glass slide. The laser was operated with a wavelength of 1030 nm, a laser pulse duration of 290 fs, an output power of 2 W, a pulse repetition rate of 100 kHz, and a scanning speed of 1 mm/s. After laser micromachining, the biosensor was released from the surface by submersion in deionized water.
In the second type, a custom maskless photolithography and a reactive ion etcher were used to pattern and machine the probe outline (Li et al., 2015; Park et al.,). For this micromachining technique, a commercially available 50 μm-thick LCP sheet (Ultralam 3850, Rogers corporation, Chandler, AZ, USA) was used as the sensor substrate. The probe outline was designed and projected using Microsoft PowerPoint. The exposed LCP was etched using a reactive ion etcher (STS ICP Advanced Oxide Etch, Surface Technology System, Newport, United Kingdom) with 50 sccm of O2 and 10 sccm of SF6 at 2000 W in 2 mTorr for 7 min. After fabricating the desired probe structure, the sensor elements were printed on the LCP probe and glutamate oxidase was immobilized to complete the biosensor.
2.5. Enzyme and permselective membrane immobilization
After printing the electrodes, the working electrode was coated with an enzyme matrix to complete the glutamate biosensor. When the sensor needed a permselective layer, Nafion was deposited before coating with the enzyme matrix. For Nafion coating, 0.5 μl of 0.5 wt% Nafion® was dropped on the surface and was dried at room temperature. For all working electrodes, the enzyme was immobilized using a solution of GluOx (100 U/mL), BSA;(1 wt%) and glutaraldehyde (0.15%). A 0.5 μl drop of solution was formed on a pipette tip and deposited on the working electrode under a microscope. Enzyme droplets were lowered on the working electrode. This was repeated 5 times with each application consisting of four depositions on top of the working electrode. Devices were left at room temperature for 24 h and then stored at 4 °C before use.
2.6. Surface investigation and characterization
The surface morphology of the PtNPs nanocomposite was observed using a field-emission scanning electron microscopy (FESEM, S-4800, Hitachi, Japan). The elemental composition was determined using energy dispersive X-ray spectroscopy (EDX) attached to the FESEM system. The morphology of the carbon nanotubes and PtNPs was further characterized by transmission electron microscopy (TEM, Tecnai G2 20, FEI Company, OR).
The PtNPs nanocomposite was further characterized by Fourier-transform infrared spectroscopy (FTIR). FTIR spectra were recorded in specular reflectance mode with a Thermo Nicolet AVATAR 360 FTIR spectrometer with a PIKE VeeMax II Specular Reflectance accessory in the wavenumber range of 450–4000 cm−1 with a resolution of 2 cm−1. A gold vapor-deposited mirror was used as the reference for FTIR.
2.7. Electrochemical analysis of fabricated biosensor
Electrochemical analysis of the sensors was performed using a SP-200 potentiostat (Bio-logic USA, LLC, Knoxville, TN, USA). All electrochemical experiments were performed in a conventional three-electrode cell configuration in 0.01 M PBS (pH 7.0) as the supporting electrolyte (50 mL for all experiments). A scan rate of 100 mV/s and sampling interval of 1 mV/s were used for cyclic voltammetry (CV). All amperometry data (i.e., i-t curve) were collected at 0.5 V or −0.2 V vs. Ag/AgCl with a 0.3 s sampling interval after 20 min of settling time unless stated otherwise. All amperometric calibrations were done in a solution, stirred by a magnetic bar at 200 rpm, in a Faraday cage. The glutamate sensor stability was evaluated by comparing sensitivity to glutamate before and after 7-weeks storage in 0.01 M PBS (pH 7.0) at 4 °C.
2.8. Ex vivo evaluation
Spinal cord segments were surgically extracted from male Sprague-Dawley rats from 200 to 400 g (Page et al., 2017) and placed on a double sucrose gap recording chamber for ex vivo evaluation (Shi and Blight, 1996; Jensen and Shi, 2003; Sun et al., 2010; Yan et al., 2010). While in the recording chamber, spinal cord segments were in Krebs solution kept at pH 7.2–7.4 by bubbling continuously with 95% O2, 5% CO2 (Page et al., 2017). The ex vivo experiments were performed by inserting the glutamate sensor vertically into the gray matter of the spinal cord either before or after SCI. SCI was simulated by squeezing the spinal cord with metal tweezers for 5–10 s near the glutamate sensor. The change in glutamate concentration was measured with our biosensor at 0.5 V vs. Ag/AgCl.
3. Results and discussion
3.1. Characterization of PtNPs nanocomposite
We used FESEM and TEM to examine the morphology of the PtNPs nanocomposite. The FESEM images showed a rough surface morphology (Fig. 2a), which is likely due to incorporation of PtNPs on the surface. For amperometric sensors, the additional surface area from roughness often corresponds to a higher sensitivity (Tiwari et al., 2016; Li et al., 2015). TEM images showed clustering of PtNPs with MWCNT (Fig. 2b). Fig. S1 presents additional TEM images at different magnifications.
Fig. 2.
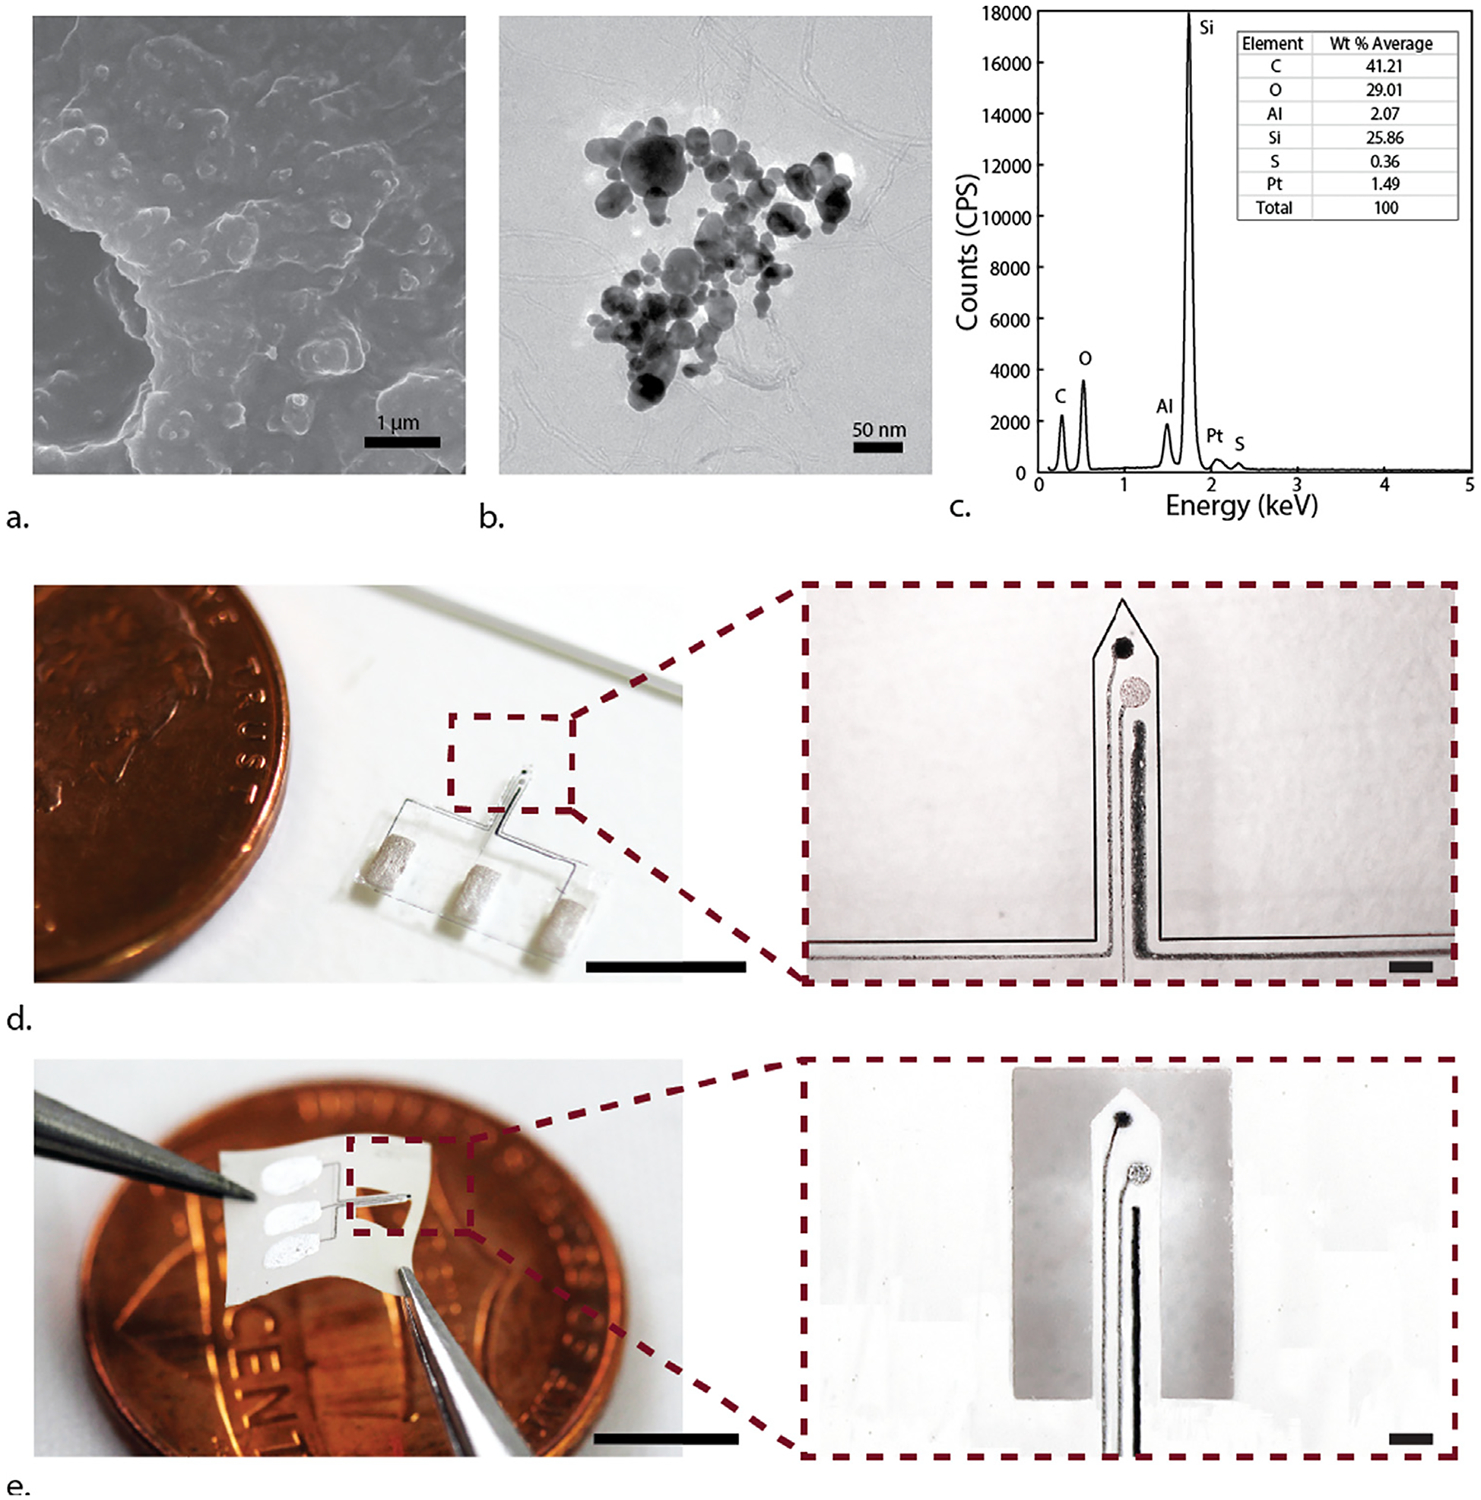
(a) Scanning electron micrographs of PtNPs nanocomposite. The rough nanoscale texture is most likely due to the embedded PtNP clusters. (b) Transmission electron micrographs of PtNPs nanocomposite. Note the clustered nanocomposite linked with MWCNT. (c) EDX spectrum of fabricated PtNPs nanocomposite. The Al peak is most likely due to the Al substrate used to image the nanocomposite sample. (d) Photograph of a flexible micro-glutamate biosensor on PDMS substrate (scale bars: 5 mm and 200 μm). (e) Photograph of a flexible micro-glutamate biosensor on LCP sheet (scale bars: 5 mm and 200 μm).
We also characterized the elemental composition of the nanocomposite using EDX (Fig. 2c). The weight percentage of each material is averaged from four different spots on the sample surface. The EDX spectrum had large peaks corresponding C and O, Si, which indicates the presence of PEDOT:PSS, MWCNT and Ecoflex. A peak for S corresponds to PSS in PEDOT:PSS. The spectrum also featured a peak for Pt. According to EDX data, PtNPs nanocomposite was 1.49 wt% Pt, which closely matches our expectation. DMSO evaporates out of 1%-PtNPs nanocomposite ink as it dries after being printed, so the final fraction of Pt should be about 1.28 wt%. The Al peak is likely from the Al substrate upon which PtNPs nanocomposite was printed for EDX characterization.
FTIR spectra of nanocomposite with 1% PtNPs (PtNPs-MWNCT-PEDOT:PSS) and without PtNPs (MWCNT-PEDOT:PSS) were measured to further elucidate on PtNP interactions with the other nanocomposite components (Fig. S2). The FTIR spectrum (Fig. S2) of PtNPs-MWCNT-PEDOT:PSS had a peak around 500 cm−1, which suggests metal-oxygen bonding (Chekin, 2015; Kurt et al., 2016).
We used the conductive polymer PEDOT:PSS as the base material of the PtNPs nanocomposite. PEDOT:PSS lowers inter-particle resistance via π-π interactions. By these interactions, PEDOT:PSS promotes conductive phases between the polymer matrix and nanofillers (PtNPs and MWCNTs) and connects nanoparticle clusters together (Zhou and Lubineau, 2013; Patole and Lubineau, 2015). According to literature, the combination of carbon nanotubes and metallic nanoparticles results in novel hybrid nanoassemblies that improve adsorption of biomolecules and facilitate electron transfer (Fig. 2b) (Ma et al., 2008). MWCNTs improved the robustness and performance of our glutamate sensors thanks to their high electrical conductivity, mechanical strength and excellent chemical stability (Rathod et al., 2010). Others have reported weak interaction and high contact resistance between nanoparticles and carbon nanotubes in mixtures (Dong et al.,). However, adding PtNPs improved the electrocatalytic activity of our nanocomposite.
3.2. Fabricated biosensors and electrochemical evaluations
Fig. 2d–e show the fabricated devices on PDMS and LCP. The PDMS device was laser cut, and the LCP device was printed directly on micromachined LCP (Park et al., 2018). Both thin-film devices were highly compliant upon release and required delicate handling. The flexible biosensor maintained good sensitivity even when bent at 45° (Fig. S3). The PDMS based sensors could be stiffened if needed by using poly-ethylene glycol, silk, saccharose, gelatin or other biodegradable coating materials (Weltman et al., 2016). On the other hand, the LCP based sensors with 50 μm thickness were stiff enough for insertion to the spinal cord tissue without buckling in our ex vivo measurements.
Fig. 3a shows the CV of a PtNPs nanocomposite electrode compared to MWCNT-PEDOT:PSS and PEDOT:PSS electrodes. The voltammogram of PEDOT:PSS was rectangular due to non-Faradaic charging current. This charging current is a product of capacitive behavior between the conductive electrode surface and the electrolyte (Gerwig et al., 2012). The voltammogram of MWCNT-PEDOT:PSS showed a slightly higher current density than PEDOT:PSS electrode, which is in agreement with literature (Park et al., 2011; Zhang et al., 2012; González-Gaitán et al., 2017). A more distinct voltammogram was generated when PtNPs were added. PtNPs nanocomposite (PtNP-MWCNT-PEDOT:PSS) exhibited superior catalytic behavior (i.e., higher current density) compared to the other composite materials. Therefore, we used PtNPs nanocomposite as our sensor material.
Fig. 3.

(a) Cyclic voltammetry of various nanocomposite materials in 0.01 M (pH 7.0). Scan rate = 100 mV s−1. (b) Cyclic voltammetry of glutamate biosensors made from various materials in 0.01 M PBS (pH 7.0) solution and 100 μM glutamate. Note that the PtNP nanocomposite exhibited highest catalytic activity. Scan rate = 100 mV s−1. (c) Representative amperometric curves for various nanocomposite glutamate biosensors at applied potential of 0.5 V vs. Ag/AgCl in 0.01 M PBS (pH 7.0). (d) The corresponding calibration curve and the sensitivity of each glutamate biosensor material (n = 3). (e) Representative amperometric curves for various nanocomposite glutamate biosensors at applied potential of −0.2 V vs. Ag/AgCl in 0.01 M PBS. Note that the response time for each glutamate addition is much slower. (f) The corresponding calibration curve and the sensitivity of each glutamate biosensor material (n = 3). Note that the PtNP nanocomposite glutamate biosensor is approximately 5 times more sensitive using this method.
We evaluated the amperometric responses of our nanocomposite biosensors using two different biasing potentials, 0.5 V and −0.2 V vs. Ag/AgCl (Fig. 1b–g). At either potential, GluOx produces H2O2 and consumes O2 in proportion to the glutamate it catalyzes. At 0.5 V vs. Ag/AgCl, PtNPs nanocomposite oxidizes H2O2, so the current generated by this can be correlated to the glutamate concentration (Fig. 1b–d) (Hamdi et al., 2006; Cui et al., 2007). Fig. 3b shows a voltammogram from our glutamate sensors in 100 μM glutamate, 0.01 M PBS (pH 7.0). The voltammograms demonstrate oxidation of enzymatically produced H2O2 shown as an increase in current starting around 0.3 V with the highest oxidation peak around 0.5 V. Thus, we chose 0.5 V as our potential for amperometric glutamate sensing via H2O2 oxidation.
It is also possible to sense glutamate via O2 reduction (Fig. 1e–g). At −0.2 V vs. Ag/AgCl, PtNPs nanocomposite reduces O2, generating a cathodic current. When GluOx consumes O2 along with glutamate, O2 is depleted near the PtNPs nanocomposite, so O2 reduction and cathodic current decrease. As can be seen in Fig. 3b, the PtNPs nanocomposite-GluOx displayed a large reduction peak around −0.2 V. Thus, we chose −0.2 V as another potential for amperometric detection of glutamate via the reduction of O2. However, it is worth noting that when the sensors are operated at low negative potential, the background noise coming from the reduction of O2 also increase in the signal. Thus, it is likely to cause the signal resolution at −0.2 V to be less stable than the signal resolution at 0.5 V (You et al., 2004).
3.3. Amperometric responses of printed glutamate biosensor
We characterized the glutamate biosensor performance using chronoamperometry at 0.5 V and −0.2 V vs. Ag/AgCl. As shown in Fig. 3c–d, PtNP nanocomposite-Nafion-GluOx was more sensitive to glutamate than the other composite materials at 0.5 V vs. Ag/AgCl. The calibration plot (Fig. 3d) shows that PtNPs nanocomposite-Nafion-GluOx had a linear response with a sensitivity of 2.60 ± 0.15 nA μM−1 mm−2 (n = 3, each). These results are comparable to other MEMS-fabricated glutamate sensors, which suggests that our simple fabrication method can yield high performing glutamate sensors (Table 1).
Table 1.
Comparison of various electrochemical glutamate biosensors.
| Electrode material | Area (mm2) |
Fabrication method | Sensitivity (nA μM−1mm−2) |
Permselective membrane | Detection limit | Response time | Linear range | Reference |
|---|---|---|---|---|---|---|---|---|
| Pt | 0.0491 | Commercial Pt wire | 0.32 | poly(o-phenylenediamine)- PPD | N/A | N/A | 0–150 μM | McMahon and O’Neill (2005) |
| Pt | 0.0491 | Commercial Pt wire | 0.80 | polypyrrole- PPY | 2 μM | 2s | 0–250 μM | Hamdi et al. (2006) |
| Pt/Chitosan | 8.0425 | Commercial Pt disk | 0.85 | poly(o-phenylenediamine)- PPD | 0.7 μM | 2s | 200 μM | Zhang et al. (2006) |
| Pt | 0.0491 | Commercial Pt wire | 0.71 | poly(o-phenylenediamine)- PPD | 2.5 μM | < 5s | N/A | Govindarajan et al. (2013) |
| Pt | 0.0075 | MEMS | 0.95 | m- phenylenediamine- mPD | 0.5 μM | 10 s | 150 μM | Frey et al. (2010) |
| Pt | 0.0050 | MEMS | 1.26 | Nafion-Polypyrrole- PPY | 2.1 μM | 1 s | > 630 μM | Tseng and Monbouquette (2012) |
| Pt | 0.0040 | MEMS | 1.83 | Nafion | 0.32 μM | N/A | 5–300 μM | Tolosa et al. (2013) |
| Pt | 0.095 | MEMS | 2.16 | m-phenylenediamine- mPD | 0.22 μM | 5s | 150 μM | Weltin et al. (2014) |
| Pt | 0.0075 | MEMS | 7.47 | Nafion | 0.5 μM | < 8s | N/A μM | Wei et al. (2015) |
| Pt | 0.0085 | MEMS | 2.04 | PPY/Nafion | 0.5 μM | < 3s | 1–800 μM | Hoa et al. (2018) |
| Pt/MWCNT | 0.7800 | Electrodeposition | 3.84 | Polypyrrole OPP | 0.3 μM | 7s | 0–150 μM | Ammam and Fransaer (2010) |
| Glassy carbon | 7.0680 | Electrodeposition | 2.10 | Nafion | 0.7 μM | N/A | 0.1–100 μM | Karyakin et al. (2000) |
| Carbon fiber | 0.0095 | Commercial carbon fiber | 0.36 | Nafion | 3 μM | 20–30 s | 0–100 μM | Kulagina et al. (1999) |
| Carbon fiber | 0.00007 | Comercial carbon fiber - Prussian blue | 1.35 | poly-o-phenylenediamine-PoPD | < 2 μM | N/A | 150 μM | Salazar et al. (2016) |
| Carbon nanofibers | 98300 | PECVD | 0.18 | N/A - low oxidation potential | 0.000767 μM | 0.05 s | 20–500 μM | Isoaho et al. (2017) |
| CNT composite | 7.0000 | CNT coated on glassy carbon | 0.10 | N/A - low oxidation potential | 2 μM | 4 s | N/A | Chakraborty and Raj (2007) |
| MWCNT/AuNP/CHIT | 36.000 | Electrodeposition | 1.55 | N/A - low oxidation potential | 1.6 μM | 5s | 5–500 μM | Batra and Pundir (2013) |
| PtNPs/AuNP | 0.2000 | Electrodeposition | 0.11 | Nafion | 14 μM | < 5s | 0.8 μM | Jamal et al. (2010) |
| PtNPs/MWCNT/PEDOT: PSS | 0.0314 | Direct writing | 2.6 (0.5 V) | Nafion | 0.5 μM | < 3s | 1–800 μM | This work |
| PtNPs/MWCNT/PEDOT: PSS | 0.0314 | Direct writing | 12.8 (−0.2 V) | N/A - low oxidation potential | 0.2 μM | 15–20s | 10–600 μM | This work |
We then evaluated the performance of our glutamate sensor at −0.2 V vs. Ag/AgCl) (Fig. 3e). Again, PtNP nanocomposite-Nafion-GluOx had the highest sensitivity compared to the other composite materials. The calibration plot (Fig. 3d) shows a linear response with a higher sensitivity of 2.81 ± 1.18 nAμM−1mm−2 (n = 3), which is more sensitive than glutamate sensing via H2O2 oxidation at 0.5 V vs. Ag/AgCl.
3.4. Linear range, limit of detection and response time
We calibrated our biosensors with successive additions of glutamate from 1 μM to 1400 μM to determine the linear range (Fig. S4). When biased at 0.5 V, the linear range was between 1 μM and 800 μM. The detection limit was 0.5 μM, and the response time was < 3 s. When biased at −0.2 V, the linear range was smaller, from 10 μM to 600 μM. At −0.2 V, the detection limit, 0.2 μM, was slightly lower than it was at 0.5 V, but the response time (15 s) was much longer.
Taken together, these results suggest that we are able to successfully fabricate glutamate biosensor using our nanocomposite with good sensitivity and detection limit. The normal background extracellular glutamate concentration is reported to be in the micromolar range (i.e., < 20 μM) (Moussawi et al., 2011). In a SCI rat model, the extracellular glutamate concentration has previously been measured to be as high as 530 μM (Xu et al., 2004). Therefore, regardless of biasing potential, our biosensors are more than capable of detecting glutamate in normal physiological conditions as well as in a SCI model.
3.5. Selectivity and stability of the printed glutamate biosensor
For successful in vivo electrochemical detection of glutamate, the biosensor must be selective against other electroactive species present in the body. Three possible interfering substances (i.e., AA, UA, AC) that are thought to be present in the spinal cord were identified to evaluate the selectivity of the electrodes (Kotanen et al., 2012). The current obtained for each interfering substance at a concentration of 100 μM in the presence of 200 μM glutamate was used as an indicator for the biosensor selectivity in comparison with the glutamate reading alone.
When biased at 0.5 V, other electroactive species can also be directly oxidized at the electrode surface. Thus, we added a Nafion permselective layer, which electrostatically repels anions, on the electrode surface before enzyme immobilization to enhance the biosensor selectivity (Pan and Arnold, 1996). Fig. 4a shows the amperometric response of PtNPs-based glutamate biosensor against AA, UA, and AC. At 0.5 V the current ratio between glutamate and AA is 0.2, and 0.05 between glutamate and UA. However, the current ratio between glutamate and AC is approximate 0.59, which suggests that our Nafion membrane cannot fully prevent interference from AC (Table S1). However, this may be improved in future studies by using another type of permselective layer such as m-Phenylenediamine dihydrochloride (Stephens et al., 2011), or by annealing Nafion to improve its selectivity (Burmeister and Gerhardt, 2001).
Fig. 4.

(a). Amperometric response of PtNPs nanocomposite-Nafion-GluOx upon sequential addition of 200 μM glutamate, 100 μM of AA, 100 μM of AC and 100 μM of UA into constantly stirred PBS solution at + 0.5 V. (b) Amperometric response of PtNPs nanocomposite-GluOx upon sequential addition of 200 μM Glutamate, 100 μM of AA, 100 M of AC and 100 μM of UA into constantly stirred 0.01 M PBS (pH 7.0) solution at −0.2 V. (c) Amperometric i-t curve of different concentration of glutamate in 0.01 M PBS solution (pH 7.0) of PtNPs nanocomposite-Nafion-GluOx at + 0.5 V before and after 7 weeks of storage. (d) Amperometric i-t curve of different concentrations of glutamate in 0.01 M PBS solution (pH 7.0) of PtNPs nanocomposite-GluOx at −0.2 V before and after 7 weeks of storage.
We also evaluated the selectivity of our biosensor against AA, UA, and AC at −0.2 V. Fig. 4b shows the amperometric response of our glutamate biosensor to these molecules. The ratio current between glutamate and interference species are 0.013, 0.026 and 0.006 for AA, UA, AC, respectively. Even without a permselective layer, our glutamate biosensor exhibited excellent selectivity against these common interfering molecules. This suggests that at −0.2 V, it is possible to obtain a more sensitive and interference-free measurement of glutamate concentration when a longer sampling interval is acceptable.
Next, we evaluated the long-term stability of our glutamate biosensor by comparing the sensitivity before and after storing them at 4 °C in 0.01 M PBS (pH 7.0) for 7 weeks. Fig. 4c–d show the amperometric responses of our biosensors before and after the storage period (n = 3, each). The sensor maintained 79.66 ± 2.718% of its initial sensitivity at 0.5 V (Fig. 4c). Similarly, the sensor maintained 80.56 ± 1.71% of its initial sensitivity at −0.2 V (Fig. 4d). The decrease in current response may be due to enzyme inactivation or electrode fouling during the storage period.
3.6. O2 dependence
Because O2 is a co-substrate of glutamate oxidase, the response of our glutamate sensor depends on the presence of O2. This may present a challenge for in vivo application, in which the concentration of O2 may not be constant (Zhang and Wilson, 1993). Thus, we calibrated our sensors at −0.2 V in air (oxygenated) and nitrogen-purged (deoxygenated) 0.01 M PBS (pH 7.0) (> 60 min each). As expected, the sensitivity to glutamate decreased by 30.91% in nitrogen-purged PBS compared to air-purged PBS, and decreased by 18.54% compared to normal PBS (Fig. S5). The fact that nitrogen-purging did not completely eliminate glutamate response may be trace amounts of oxygen remaining in PBS to facilitate glutamate oxidase catalysis. It is also possible that some O2 had dissolved in to the sensor ‘s PtNP nanocomposite prior to nitrogen purging, which can still facilitate glutamate oxidation in O2-depleted bulk solution. Nevertheless, these results confirm the O2 dependence of the enzymatic biosensors at −0.2 V.
Highly sensitive enzymatic detection of glutamate (> 90%) is possible when partial pressure of O2 in the tissue is maintained > 30 torr (Hu et al., 1994). In a normal cerebral cortex, the partial pressure of O2 is typically > 40 torr (Silver, 1965), however, it is not yet clear how SCI impacts oxygenation of the spinal cord. Therefore, it may be necessary to perform additional experiments to correlate oxygenation of the SCI model prior to using our glutamate sensor.
3.7. Ex vivo measurements
In order to demonstrate the capability of our biosensors for monitoring glutamate release in a physiologically-relevant environment, we implanted pre-calibrated sensors into a half segment of a rat spinal cord, onto which we administered injuries to induce glutamate release (Fig. 5a). Fig. 5b shows the injury-induced glutamate release with the sensor already implanted in the spinal cord. The initial peak corresponds to the glutamate released by the biosensor insertion whereas the second peak corresponds to the glutamate release due to SCI. In the second experiment, we applied SCI prior to inserting the biosensor (Fig. 5c). As such, the first peak corresponds to the device insertion, and the second peak likely corresponds to the change in glutamate concentration due to induced SCI.
Fig. 5.

A representative result of current changes corresponding to injury-induced glutamate release in the spinal cord segment of a rat. (a). Photograph of sensor inserted in the spinal cord segment of a rat. (b). Device was inserted into the spinal cord before injury was applied to the spinal cord. (c). Injury was applied to the spinal cord before the device was inserted to the spinal cord.
These preliminary results confirms previously reported results to suggest that SCI can significantly increase extracellular glutamate concentration, and that our glutamate biosensor can monitor this change in glutamate concentration. Although the response time of our biosensor at 0.5 V is < 3 s, we found that the current spike due to SCI occurred between 10 and 20 s after the injury. This may be due to physical distance between the SCI site and the location of our implanted biosensor. To better characterize this dynamic process, we may need to improve the response time of our biosensors.
We also found that the increase in glutamate concentration is relatively transient following an SCI. The elevated glutamate concentration seem to only last < 10 s before settling down to pre-injury levels. Additional experiments are needed to confirm this transient behavior of extracellular glutamate concentration. Nevertheless, these results highlight the capability of our biosensors in examining the relatively rapid glutamate response following an SCI that cannot be resolved using conventional microdialysis. By using these simple biosensors that can be rapidly be fabricated at low cost, we may be able to better elucidate the effects of GET in SCI in vivo at a higher spatiotemporal resolution.
4. Conclusion
In this study, we presented a nanocomposite ink that consists of PtNPs, MWCNT, PEDOT:PSS, and Ecoflex to print microscale glutamate sensors using a direct-writing process. The biosensor featured an on-board Ag/AgCl reference and counter electrode. We demonstrated a relatively simple, economic, and rapid method to fabricate a sensor capable of sensing glutamate with a high sensitivity and low limit of detection for in vivo applications. Our glutamate sensor also had an adequate linear range and response time, which are suitable for glutamate measurement in the spinal cord to investigate the impact of GET during SCI.
Although these glutamate biosensors demonstrated good bench-top and ex vivo performance, our ultimate goal is measuring glutamate in vivo. To this end, additional ex vivo and in vivo work may be needed to verify the functionality in a more complex biological environment. Of particular interest is characterizing the effects of biofouling and foreign body reaction on biosensor sensitivity and stability over the course of implantation. Moreover, we plan to create a biosensor array to better characterize glutamate concentration flux, which will improve our understanding of how GET may propagate to exacerbate SCI.
Supplementary Material
Acknowledgement
This work was supported by Global Research Outreach program of Samsung Advanced Institute of Technology. This work was sponsored in part by the NSF (National Science Foundation, United States) under grants CNS-1741483. We would like to thank Professor Kinam Park and Andrew Otte for help with the homogenizer; Professor Peter Bermel and Zhiguang Zhou for help measuring FTIR; and Laurie Mueller for her assistance in preparing TEM samples and imaging.
Footnotes
Declaration of interests
The authors declare that they have no known competing financial interests or personal relationships that could have appeared to influence the work reported in this paper.
Appendix A. Supplementary data
Supplementary data associated with this article can be found in the online version at doi:10.1016/j.bios.2019.01.051.
References
- Ahn BY, Duoss EB, Motala MJ, Guo X, Park S-I, Xiong Y, Yoon J, Nuzzo RG, Rogers JA, Lewis JA, 2009. Omnidirectional printing of flexible, stretchable, and spanning silver microelectrodes. Science (80-.) 323 (5921), 1590–1593. [DOI] [PubMed] [Google Scholar]
- Ammam M, Fransaer J, 2010. Highly sensitive and selective glutamate microbiosensor based on cast polyurethane/AC-electrophoresis deposited multiwalled carbon nanotubes and then glutamate oxidase/electrosynthesized polypyrrole/Pt electrode. Biosens. Bioelectron 25 (7), 1597–1602. [DOI] [PubMed] [Google Scholar]
- Batra B, Pundir CS, 2013. An amperometric glutamate biosensor based on immobilization of glutamate oxidase onto carboxylated multiwalled carbon nanotubes/gold nanoparticles/chitosan composite film modified Au electrode. Biosens. Bioelectron 47, 496–501. [DOI] [PubMed] [Google Scholar]
- Burmeister JJ, Gerhardt GA, 2001. Self-referencing ceramic-based multisite microelectrodes for the detection and elimination of interferences from the measurement of L-glutamate and other analytes. Anal. Chem 73 (5), 1037–1042. [DOI] [PubMed] [Google Scholar]
- Cao H, Li AL, Nguyen CM, Peng YB, Chiao JC, 2012. An integrated flexible implantable micro-probe for sensing neurotransmitters. IEEE Sens. J 12 (5), 1618–1624. [Google Scholar]
- Caudle WM, Zhang J, 2009. Glutamate, excitotoxicity, and programmed cell death in parkinson disease. Exp. Neurol 220 (2), 230–233. [DOI] [PubMed] [Google Scholar]
- Chakraborty S, Raj C. Retna, 2007. Amperometric biosensing of glutamate using carbon nanotube based electrode. Electrochem. Commun 9 (6), 1323–1330. [Google Scholar]
- Chekin F, 2015. Sol-gel synthesis of palladium nanoparticles supported on reduced graphene oxide: an active electrocatalyst for hydrogen evolution reaction. Bull. Mater. Sci 38, 887–893. [Google Scholar]
- Cinti S, Arduini F, Moscone D, Palleschi G, Gonzalez-Macia L, Killard AJ, 2015. Cholesterol biosensor based on inkjet-printed Prussian blue nanoparticle-modified screen-printed electrodes. Sens. Actuators B Chem 221, 187–190. [Google Scholar]
- Cui Y, Barford JP, Renneberg R, 2007. Development of an interference-free biosensor for l-glutamate using a bienzyme salicylate hydroxylase/l-glutamate dehydrogenase system. Enzym. Microb. Technol 41 (6–7), 689–693. [Google Scholar]
- Dong V, Youkey S, Bush J, Jiao J, Dubin VM, Chebiam RV, 2007. Effects of local Joule heating on the reduction of contact resistance between carbon nanotubes and metal electrodes. J. Appl. Phys 101 (2). [Google Scholar]
- Frey O, Holtzman T, Mcnamara RM, Theobald DE, van der Wal PD, de Rooij NF, Dalley JW, Koudelka-Hep M, 2010. Enzyme-based choline and l-glutamate biosensor electrodes on silicon microprobe arrays. Biosens. Bioelectron 26 (2), 477–484. [DOI] [PubMed] [Google Scholar]
- Fu Y, Sun W, Shi Y, Shi R, Cheng JX, 2009. Glutamate excitotoxicity inflicts paranodal myelin splitting and retraction. PLoS One 4 (8), 2–13. [DOI] [PMC free article] [PubMed] [Google Scholar]
- Gerwig R, Fuchsberger K, Schroeppel B, Link GS, Heusel G, Kraushaar U, Schuhmann W, Stett A, Stelzle M, 2012. PEDOT CNT composite microelectrodes for recording and electrostimulation applications: fabrication, morphology, and electrical properties. Front. Neuroeng 5 8p. [DOI] [PMC free article] [PubMed] [Google Scholar]
- González-Gaitán C, Ruiz-Rosas R, Morallón E, Cazorla-Amorós D, 2017. Effects of the surface chemistry and structure of carbon nanotubes on the coating of glucose oxidase and electrochemical biosensors performance. RSC Adv 7 (43), 26867–26878. [Google Scholar]
- Govindarajan S, McNeil CJ, Lowry JP, McMahon CP, O’Neill RD, 2013. Highly selective and stable microdisc biosensors for l-glutamate monitoring. Sens. Actuators B Chem 178, 606–614. [Google Scholar]
- Hamdi N, Wang J, Walker E, Maidment NT, Monbouquette HG, 2006. An electroenzymatic l-glutamate microbiosensor selective against dopamine. J. Electroanal. Chem 591 (1), 33–40. [Google Scholar]
- Hoa LNQ, Chen HR, Tseng TT, 2018. An arrayed micro-glutamate sensor probe integrated with on-probe Ag/AgCl reference and counter electrodes. Electroanalysis 30 (3), 561–570. [Google Scholar]
- Hon KKB, Li L, Hutchings IM, 2008. Direct writing technology-advances and developments. CIRP Ann. - Manuf. Technol 57 (2), 601–620. [Google Scholar]
- Hondred JA, Stromberg LR, Mosher CL, Claussen JC, 2017. High-resolution graphene films for electrochemical sensing via inkjet maskless lithography. ACS Nano 11 (10), 9836–9845. [DOI] [PubMed] [Google Scholar]
- Hu Y, Mitchell KM, Albahadily FN, Michaelis EK, Wilson GS, 1994. Direct measurement of glutamate release in the brain using a dual enzyme-based electrochemical sensor. Brain Res 659 (1–2), 117–125. [DOI] [PubMed] [Google Scholar]
- Isoaho N, Peltola E, Sainio S, Wester N, Protopopova V, Wilson BP, Koskinen J, Laurila T, 2017. Carbon nanostructure based platform for enzymatic glutamate biosensors. J. Phys. Chem. C 121 (8), 4618–4626. [Google Scholar]
- Jamal M, Xu J, Razeeb KM, 2010. Disposable biosensor based on immobilisation of glutamate oxidase on Pt nanoparticles modified Au nanowire array electrode. Biosens. Bioelectron 26 (4), 1420–1424. [DOI] [PubMed] [Google Scholar]
- Jensen JM, Shi R, 2003. Effects of 4-aminopyridine on stretched mammalian spinal cord: the role of potassium channels in axonal conduction. J. Neurophysiol 90, 2334–2340. [DOI] [PubMed] [Google Scholar]
- Kadara RO, Jenkinson N, Li B, Church KH, Banks CE, 2008. Manufacturing electrochemical platforms: direct-write dispensing versus screen printing. Electrochem. Commun 10 (10), 1517–1519. [Google Scholar]
- Karyakin AA, Karyakina EE, Gorton L, 2000. Amperometric biosensor for glutamate using Prussian Blue-based artificial peroxidase’ as a transducer for hydrogen peroxide. Anal. Chem 72 (7), 1720–1723. [DOI] [PubMed] [Google Scholar]
- Kotanen CN, Moussy FG, Carrara S, Guiseppi-Elie A, 2012. Implantable enzyme amperometric biosensors. Biosens. Bioelectron 35 (1), 14–26. [DOI] [PubMed] [Google Scholar]
- Kulagina NV, Shankar L, Michael AC, 1999. Monitoring glutamate and ascorbate in the extracellular space of brain tissue with electrochemical microsensors. Anal. Chem 71 (22), 5093–5100. [DOI] [PubMed] [Google Scholar]
- Kurt B, Durmus Z, Durmus A, 2016. Preparation and characterization of platinum (Pt) and palladium (Pd) nanoparticle decorated graphene sheets and their utilization for the elimination of basic fuchsin and indigo carmine dyes. Solid State Sci 51, 51–58. [Google Scholar]
- Lau A, Tymianski M, 2010. Glutamate receptors, neurotoxicity and neurodegeneration. Pflug. Arch. Eur. J. Physiol 460 (2), 525–542. [DOI] [PubMed] [Google Scholar]
- Lee H, Yoo JK, Park JH, Kim JH, Kang K, Jung YS, 2012. A stretchable polymer-carbon nanotube composite electrode for flexible lithium-ion batteries: porosity engineering by controlled phase separation. Adv. Energy Mater 2 (8), 976–982. [Google Scholar]
- Lee CW, Raman Pillai SK, Luan X, Wang Y, Li CM, Chan-Park MB, 2012. High-performance inkjet printed carbon nanotube thin film transistors with high-k hfo2 dielectric on plastic substrate. Small 8 (19), 2941–2947. [DOI] [PubMed] [Google Scholar]
- Lewis JA, 2006. Direct ink writing of 3D functional materials. Adv. Funct. Mater 16 (17), 2193–2204. [Google Scholar]
- Li Y, Wu P, Luo Z, Ren Y, Liao M, Feng L, Li Y, He L, 2015. Rapid fabrication of microfluidic chips based on the simplest LED lithography. J. Micromech. Microeng 25 (5), 055020. [Google Scholar]
- Li Z, Leung C, Gao F, Gu Z, 2015. Effects of nanowire length and surface roughness on the electrochemical sensor properties of nafion-free, Vertically aligned pt nanowire array electrodes. Sensors (Switzerland) 15 (9), 22473–22489. [DOI] [PMC free article] [PubMed] [Google Scholar]
- Ma PC, Tang BZ, Kim JK, 2008. Effect of CNT decoration with silver nanoparticles on electrical conductivity of CNT-polymer composites. Carbon N.Y 46 (11), 1497–1505. [Google Scholar]
- McMahon CP, O’Neill RD, 2005. Polymer-enzyme composite biosensor with high glutamate sensitivity and low oxygen dependence. Anal. Chem 77 (4), 1196–1199. [DOI] [PubMed] [Google Scholar]
- Miele M, Berners M, Boutelle MG, Kusakabe H, Fillenz M, 1996. The determination of the extracellular concentration of brain glutamate using quantitative microdialysis. Brain Res 707 (1), 131–133. [DOI] [PubMed] [Google Scholar]
- Moussawi K, Riegel A, Nair S, Kalivas PW, 2011. Extracellular glutamate: functional compartments operate in different concentration ranges. Front. Syst. Neurosci 5 (November), 94. [DOI] [PMC free article] [PubMed] [Google Scholar]
- Oyinbo CA, 2011. Secondary injury mechanisms in traumatic spinal cord injury: a nugget of this multiply cascade. Acta Neurobiol. Exp. (Wars.) 71 (2), 281–299. [DOI] [PubMed] [Google Scholar]
- Page J, Park J, Chen Z, Cao P, Shi R, 2017. Parallel evaluation of two potassium channel blockers in restoring conduction in mechanical spinal cord injury in rat. J. Neurotrauma 9 (35), 1057–1068. [DOI] [PMC free article] [PubMed] [Google Scholar]
- Pan S, Arnold MA, 1996. Selectivity enhancement for glutamate with a Nafion/glutamate oxidase biosensor. Talanta 43 (7), 1157–1162. [DOI] [PubMed] [Google Scholar]
- Park H, Raffiee AH, John SWM, Ardekani AM, Lee H, 2018. Towards smart self-clearing glaucoma frainage device. Microsyst. Nanoeng 4 (35). [DOI] [PMC free article] [PubMed] [Google Scholar]
- Park E, Velumian A.a., Fehlings MG, 2004. The role of excitotoxicity in secondary mechanisms of spinal cord injury: a review with an emphasis on the implications for white matter degeneration. J. Neurotrauma 21 (6), 754–774. [DOI] [PubMed] [Google Scholar]
- Park J, Lee A, Yim Y, Han E, 2011. Electrical and thermal properties of PEDOT:PSS films doped with carbon nanotubes. Synth. Met 161 (5–6), 523–527. [Google Scholar]
- Patole A, Lubineau G, 2015. Carbon nanotubes with silver nanoparticle decoration and conductive polymer coating for improving the electrical conductivity of polycarbonate composites. Carbon N.Y 81 (1), 720–730. [Google Scholar]
- Rathod D, Dickinson C, Egan D, Dempsey E, 2010. Platinum nanoparticle decoration of carbon materials with applications in non-enzymatic glucose sensing. Sens. Actuators B Chem 143 (2), 547–554. [Google Scholar]
- Salazar P, Martín M, O’Neill RD, González-Mora JL, 2016. Glutamate micro-biosensors based on Prussian Blue modified carbon fiber electrodes for neuroscience applications: in-vitro characterization. Sens. Actuators B Chem 235, 117–125. [Google Scholar]
- Shi R, Blight A, 1996. Compression injury of mammalian spinal cord in vitro and the dynamics of action potential conduction failure. J. Neurophysiol 76 (3), 1572–1580. [DOI] [PubMed] [Google Scholar]
- Silver IA, 1965. Some observations on the cerebral cortex with an ultramicro, membrane-covered, oxygen electrode. Med. Electron. Biol. Eng 3 (4), 377–387. [DOI] [PubMed] [Google Scholar]
- Stephens ML, Quintero JE, Pomerleau F, Huettl P, Gerhardt GA, 2011. Age-related changes in glutamate release in the CA3 and dentate gyrus of the rat hippo-campus. Neurobiol. Aging 32 (5), 811–820. [DOI] [PMC free article] [PubMed] [Google Scholar]
- Sun W, Smith D, Fu Y, Cheng J-X, Bryn S, Borgens R, Shi R, 2010. Novel potassium channel blocker, 4-AP-3-MeOH, inhibits fast potassium channels and restores axonal conduction in injured guinea pig spinal cord white matter. J. Neurophysiol 103, 469–478. [DOI] [PubMed] [Google Scholar]
- Tiwari JN, Vij V, Kemp KC, Kim KS, 2016. Engineered carbon-nanomaterial-based electrochemical sensors for biomolecules. ACS Nano 10, 46–80. [DOI] [PubMed] [Google Scholar]
- Tolosa VM, Wassum KM, Maidment NT, Monbouquette HG, 2013. Electrochemically deposited iridium oxide reference electrode integrated with an electroenzymatic glutamate sensor on a multi-electrode array microprobe. Biosens. Bioelectron 42 (1), 256–260. [DOI] [PubMed] [Google Scholar]
- Tseng TTC, Monbouquette HG, 2012. Implantable microprobe with arrayed microsensors for combined amperometric monitoring of the neurotransmitters, glutamate and dopamine. J. Electroanal. Chem 682, 141–146. [DOI] [PMC free article] [PubMed] [Google Scholar]
- Wei W, Song Y, Wang L, Zhang S, Luo J, Xu S, Cai X, 2015. An implantable microelectrode array for simultaneous L-glutamate and electrophysiological recordings in vivo. Microsyst. Nanoeng 1 (April), 15002. [Google Scholar]
- Weltin A, Kieninger J, Enderle B, Gellner AK, Fritsch B, Urban GA, 2014. Polymer-based, flexible glutamate and lactate microsensors for in vivo applications. Biosens. Bioelectron 61, 192–199. [DOI] [PubMed] [Google Scholar]
- Weltman A, Yoo J, Meng E, 2016. Flexible, penetrating brain probes enabled by advances in polymer microfabrication. Micromachines 7 (10), 180. [DOI] [PMC free article] [PubMed] [Google Scholar]
- Xu GY, McAdoo DJ, Hughes MG, Robak G, De Castro R, 1998. Considerations in the determination by microdialysis of resting extracellular amino acid concentrations and release upon spinal cord injury. Neuroscience 86 (3), 1011–1021. [DOI] [PubMed] [Google Scholar]
- Xu GY, Hughes MG, Ye Z, Hulsebosch CE, McAdoo DJ, 2004. Concentrations of glutamate released following spinal cord injury kill oligodendrocytes in the spinal cord. Exp. Neurol 187 (2), 329–336. [DOI] [PubMed] [Google Scholar]
- Yan R, Page JC, Shi R, 2010. Effects of 4-aminopyridine on stretched mammalian spinal cord: the role of potassium channels in axonal conduction. J. Neurophysiol 90 (4), 469–478. [DOI] [PubMed] [Google Scholar]
- You T, Niwa O, Kurita R, Iwasaki Y, Hayashi K, Suzuki K, Hirono S, 2004. Reductive H2O2 detection at nanoparticle iridium/carbon film electrode and its application as L-glutamate enzyme sensor. Electroanalysis 16 (12), 54–59. [Google Scholar]
- Zhang Y, Wilson GS, 1993. In vitro and in vivo evaluation of oxygen effects on a glucose oxidase based implantable glucose sensor. Anal. Chim. Acta 281 (3), 513–520. [Google Scholar]
- Zhang M, Mullens C, Gorski W, 2006. Amperometric glutamate biosensor based on chitosan enzyme film. Electrochim. Acta 51 (21), 4528–4532. [Google Scholar]
- Zhang J, Gao L, Sun J, Liu Y, Wang Y, Wang J, 2012. Incorporation of single-walled carbon nanotubes with PEDOT/PSS in DMSO for the production of transparent conducting films. Diam. Relat. Mater 22, 82–87. [Google Scholar]
- Zhou J, Lubineau G, 2013. Improving electrical conductivity in polycarbonate nano-composites using highly conductive PEDOT/PSS coated MWCNTs. ACS Appl. Mater. Interfaces 5 (13), 6189–6200. [DOI] [PubMed] [Google Scholar]
Associated Data
This section collects any data citations, data availability statements, or supplementary materials included in this article.