Abstract
Internalization of G protein-coupled receptor (GPCRs) represents a nearly universal pathway for receptor downregulation. Imaging this process provides a means for the identification of pharmaceutical agents as well as potential ligands for orphan receptors. However, there is a need for the further development of near-infrared (NIR) probes capable of monitoring internalization in order to enable multiplexing with existing green fluorescent GPCR activity assays. Our laboratory has recently described a series of near-infrared (NIR) fluorophores in which a phosphinate functionality is inserted at the bridging position of the xanthene scaffold. These fluorophores, termed Nebraska Red (NR) dyes, provide attractive reagents for imaging protein localization. Herein, we disclose the development of NR-based HaloTag ligands for imaging membrane proteins on living cells. These new probes are utilized to image membrane pools of the human orexin type 2 receptor, an established target for the treatment of insomnia. We demonstrate the ability of fetal bovine serum (FBS) to noncovalently associate with a spirolactonized NR probe, enabling no-wash imaging with a 45-fold enhancement of fluorescence. Furthermore, we characterize the utility of NR-based HaloTag ligands for real-time monitoring of receptor internalization upon agonist stimulation. These new reagents enable potential multiplexing with existing GPCR activity assays in order to identify new modulators of GPCR activity as well as ligands for orphan receptors.
Introduction
Membrane receptor endocytosis and trafficking represents a critical component of cellular communication. In the case of GPCRs, which are the largest family of membrane receptors in mammals1–4 and account for ∼40% of current drug targets,5,6 signaling is initiated by agonist binding and subsequently dampened by internalization of the receptor.7,8 Thus, approaches for selectively monitoring GPCR internalization can be used to identify and characterize new pharmaceutical agents as well as screen for ligands of orphan receptors.9 Current techniques largely focus on the use of green fluorescent protein (GFP)9–12 or green fluorescently labeled anti-bodies13 to monitor the internalization of GPCRs. Although useful, these internalization assays can be difficult to multiplex with orthogonal GPCR activity assays that often also produce a green fluorescent signal.14,15 Recent chemistry-focused efforts have resulted in the identification of xanthene-based fluorophores displaying red-shifted fluorescence.16–30 In particular, our lab has described a series of xanthene derivatives that contain a phosphinate functionality at the bridging position (termed NR dyes).31–33 Several NR derivatives display NIR fluorescence and provide a starting point for the development of spectrally orthogonal NIR probes for selective labeling of membrane proteins and monitoring internalization.
HaloTag technology represents an elegant approach that enables the covalent linkage of a small molecule fluorophore with a protein of interest.34 This strategy relies on the engineered HaloTag protein, a 33 kDa haloalkane dehalogenase in which His272 was mutated to Phe272, rendering the enzyme catalytically inactive while retaining its ability to form covalent linkages with haloalkane-containing compounds (Fig. 1). HaloTag ligands with applications ranging from fluorescent labeling, sensing proteasome stress, and small molecule delivery have been developed.35–38 Herein we disclose a set of NR-based HaloTag labeling reagents for selectively imaging membrane proteins. Building upon the noncovalent association of a spirolactone-containing probe with FBS, we define optimal conditions for no-wash imaging, illustrating the unique features of the charged bridging group in the NR scaffold. In addition, we demonstrate the ability to utilize NR-based HaloTag ligands for real-time imaging of GPCR internalization upon agonist stimulation. These new NIR labeling agents enable potential multiplexing with orthogonal GPCR activity assays that produce a green fluorescent readout.
Fig. 1.
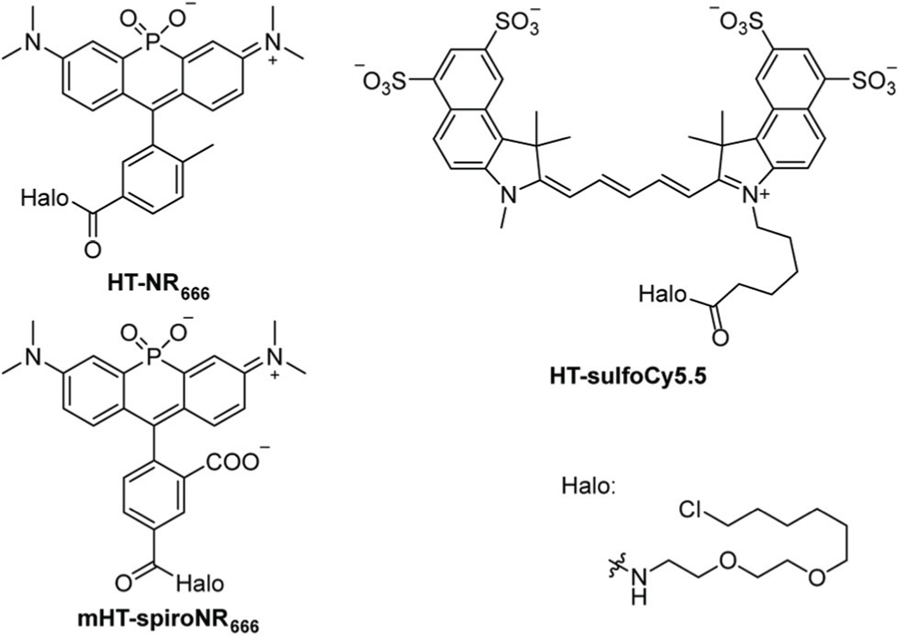
Structures of HT-NR666, mHT-spiroNR666 (shown in the open, fluorescent state), and HT-sulfoCy5.5.
Results and discussion
Design and characterization of an NR-based HaloTag ligand
We have previously shown that the phosphinate-containing, tetramethylrhodamine (TMR) derivative termed NR666 (Fig. 1) does not cross the cell membrane.31 Accordingly, we chose NR666 as a starting point for the development of membrane protein labeling reagents that would be excluded from the cytosol. Utilizing amide coupling (see Methods), we obtained a haloalkane derivative of NR666, termed HT-NR666 (Fig. 1 and Table S1†). With this compound in hand, we evaluated the ability to label recombinant HaloTag protein in vitro. First, labeling kinetics were measured using fluorescence polarization. An apparent second order rate constant of 5.3 × 10⁵ M−1 s−1 was obtained for labeling of His6-HaloTag with HT-NR666 (Fig. S1a†). Although this rate was slower than the previously reported TMR ligand (2.7 × 10⁶ M−1 s−1),34 potentially due to the negative charge of the phosphinate functionality, appreciable labeling could be achieved in a relatively short time frame (reaching completion in 60 seconds). Additionally, the stoichiometry of labeling between HaloTag and HT-NR666 was also confirmed as 1 : 1 using in-gel fluorescence experiments (Fig. S1b and c†). These experiments clearly demonstrate the ability to label HaloTag protein with HT-NR666.
Selective labeling of a membrane protein
Encouraged by these results, we set out to utilize HT-NR666 to selectively label a membrane protein on living cells. We chose to focus on the human orexin type 2 receptor (hOX2R), a GPCR that mediates the function of the orexin neuropeptide, a promoter of wakefulness in the central nervous system, and a target for the development of antagonists for the treatment of insomnia.39–43 Given the clinical importance of hOX2R, fluorescent probes capable of monitoring internalization of hOX2R could be valuable tools for the identification of small molecules that influence hOX2R function. We hypothesized that HT-NR666 would allow for selective labeling of the membrane population of hOX2R. To test this, we transiently transfected Chinese Hamster Ovary (CHO) cells with a HaloTag-hOX2R construct.44 Subsequent incubation with HT-NR666, followed by washing, demonstrated clear labeling of the membrane population of hOX2R (Fig. 2). Importantly, no labeling of the cytosolic pool of hOX2R was observed. Furthermore, when cells were transfected with a HaloTag-EGFP construct, no labeling of cytosolic protein was observed (Fig. S2†), validating the ability of HT-NR666 to selectively label cell surface proteins.
Fig. 2.
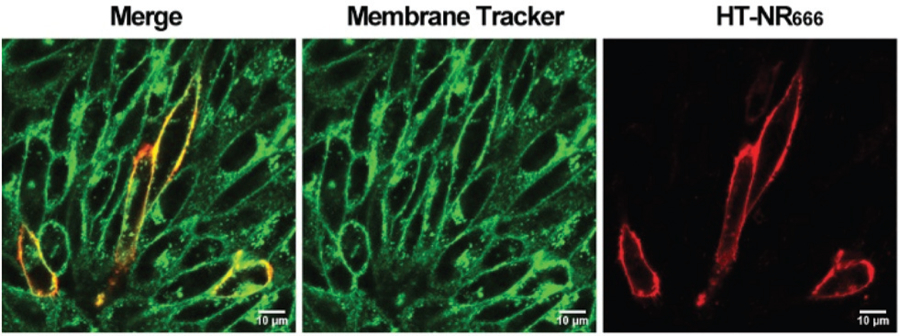
Labeling of hOX2R on the cell membrane with HT-NR666. CHO cells were transiently transfected with a HaloTag-hOX2R plasmid. Cells were labeled with membrane tracker, and HT-NR666 (10 μM) for 20 min and washed. Confocal imaging demonstrated selective labeling of the membrane pool of hOX2R. Scale bar: 10 μm.
Design and characterization of a fluorogenic NR-based HaloTag ligand
We next asked whether HT-NR666 could be structurally modified to yield a fluorogenic labeling reagent for no-wash imaging. Tuning the chemistry at the 2′-position of rhodamine dyes has been shown to be an effective way to generate fluorogenic probes.45–47 Specifically, installation of a carboxylate at the 2′-position yields spirolactonized dyes whose fluorescence depends upon the intrinsic equilibrium (KL-Z) between closed (lactone) and open forms.48 Accordingly, we designed and synthesized a spirolactonized version of HT-NR666 termed mHT-spiroNR666 (Fig. 1 and Table S1†). The HaloTag ligand was placed at the 4′-position of this probe in order to aid synthetic accessibility. Measurement of KL-Z yielded a value of 0.24 which, based on previous work, indicated that mHT-spiroNR666 would not produce a substantial fluorogenic signal upon HaloTag labeling due to the prevalence of the open form of the dye in the unbound state.48 As expected, a modest 1.7-fold increase in fluorescence intensity was observed upon labeling HaloTag protein with mHT-spiroNR666 in Dulbecco’s Phosphate Buffered Saline (DPBS, Fig. 3). To further investigate the lack of fluorogenic signal from mHT-spiroNR666 we measured its D0.5 value, defined as the dielectric constant at which the absorption of a dye is 50% of the maximal value observed across a dioxane–water gradient.49 Using this approach, we found the D0.5 of mHT-spiroNR666 to be 76 (Fig. S3†), indicating the potential to increase the proportion of the lactone species in the unbound state. Based on these observations, we set out to identify conditions capable of stabilizing the lactone in the unbound state of mHT-spiroNR666, with the goal of obtaining higher fluorogenic responses upon HaloTag labeling.
Fig. 3.
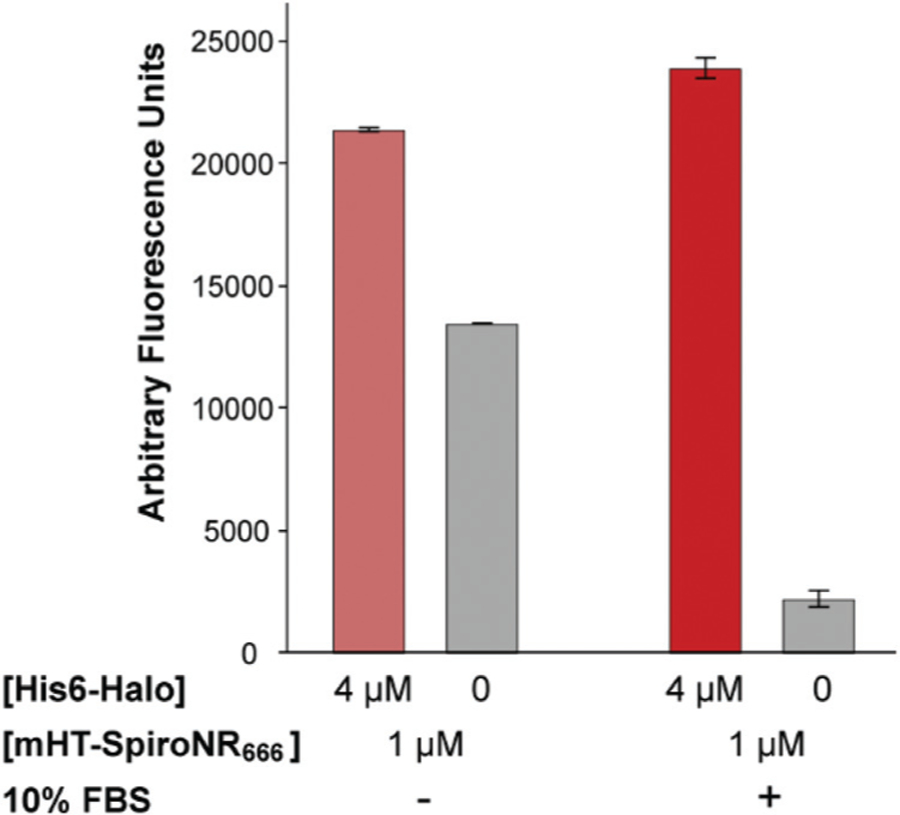
In vitro characterization of the fluorogenic behavior of mHT-spiroNR666. mHT-spiroNR666 (1 μM) fluorescence in the presence or absence of recombinant HaloTag protein (4 μM) with or without FBS (10%). Error bars represent the standard deviation of triplicate experiments.
Interestingly, unlike the majority of rhodamine derivatives, mHT-spiroNR666 is charged in the lactone state (Fig. S3†). Accordingly, we chose to investigate the potential influence of charged species present in typical cell culture media on the stability of the lactone form of mHT-spiroNR666. Specifically, we asked whether the fluorogenicity of mHT-spiroNR666 would be altered in the presence of FBS. Interestingly, the addition of 10% FBS to DPBS led to an increase in the closed, nonfluorescent form of mHT-spiroNR666 in the absence of HaloTag protein (Fig. S4†). When bovine serum albumin (BSA, 2.3 mg mL−1), the major protein component in FBS at ∼23 mg mL−1,50 was added to DPBS a similar quenching effect was observed (Fig. S4†). Since mHT-spiroNR666 is negatively charged in the closed form, we investigated whether a possible electrostatic interaction with BSA ( pI = 4.7)51 could be responsible for stabilizing the spirolactone form of mHT-spiroNR666. Accordingly, we evaluated the effect of surfactants containing head groups with different charges on the fluorescence of mHT-spiroNR666. These experiments clearly showed that 1 mM sodium dodecyl sulfate (SDS, negatively charged, cmc = 7 mM) had no effect on the closed-open equilibrium of mHT-spiroNR666 (Fig. S4†). Meanwhile addition of 1 mM cetyltri-methylammonium bromide (CTAB, positively charged, cmc = 1 mM) decreased the fluorescence of mHT-spiroNR666 by 65-fold (Fig. S4†), indicating that positively charged species are capable of stabilizing the closed form of mHT-spiroNR666. To further investigate the mechanism of BSA-induced mHT-spiroNR666 quenching, we assayed mHT-spiroNR666 fluorescence as a function of detergent concentration. Increasing concentrations of CTAB quenched the fluorescence of mHT-NR666 (EC50 = 42 μM, Fig. S5a†). Conversely, addition of increasing concentrations of SDS to solutions of BSA (2.3 mg mL−1) and mHT-spiroNR666 led to a dose-dependent increase in mHT-spiroNR666 fluorescence (EC50 = 176 μM, Fig. S5b†). These experiments indicate that mHT-spiroNR666 fluorescence in media containing FBS is quenched through noncovalent association with serum albumin, shifting the closed-open equilibrium farther towards the closed state. Encouraged by this observation, we asked whether labeling of HaloTag protein in the presence of 10% FBS could produce a more robust fluorogenic response. Indeed, labeling of HaloTag with mHT-spiroNR666 in the presence of 10% FBS resulted in 10.5-fold increase in fluorescence intensity (Fig. 3). Kinetic studies yielded an apparent second order rate constant of 1.5 × 10⁴ M−1 s−1 (Fig. S6†), 35-fold slower than HT-NR666. This change could potentially be due to the relative difference in the position of the HaloTag ligand between the probes and/or noncovalent association of mHT-spiroNR666 with FBS. Using 10% FBS during imaging experiments could help mimic endogenous conditions and maintain cell viability over longer periods. However, addition of FBS to culture media also prohibits precise control of growth factor concentrations. If such control is desired, BSA could be used in synthetic media in order to mimic the effect of FBS with mHT-spiroNR666 (Fig. S4†). Nonetheless, these experiments demonstrate the potential of mHT-spiroNR666 as a turn-on label for HaloTag-containing proteins in cell culture media containing 10% FBS.
To further evaluate mHT-spiroNR666 as a fluorogenic probe for live-cell imaging experiments, we first incubated transfected HaloTag-EGFP cells with the probe to test its cell permeability. We did not observe cytosolic labeling or nonspecific binding to the membrane (Fig. S7†), confirming that mHT-spiroNR666 does not readily cross the cell membrane. We then labeled CHO cells, transiently transfected with HaloTag-hOX2R, in the presence of 10% FBS. A distinct membrane-localized fluorescent signal was observed without washing (Fig. 4a and b). The average membrane fluorescence signal was determined to be 45-fold higher than extracellular medium and 18-fold higher compared to background fluorescence in the cytosol (Fig. 4c). A clear turn-on fluorescence signal was also observed using epifluorescence (Fig. S8†). Taken together, these experiments show that mHT-spiroNR666 can be used as a no-wash membrane protein labeling reagent and highlight the ability to leverage charged bridging groups within rhodamine scaffolds to modulate their open-closed equilibrium.
Fig. 4.
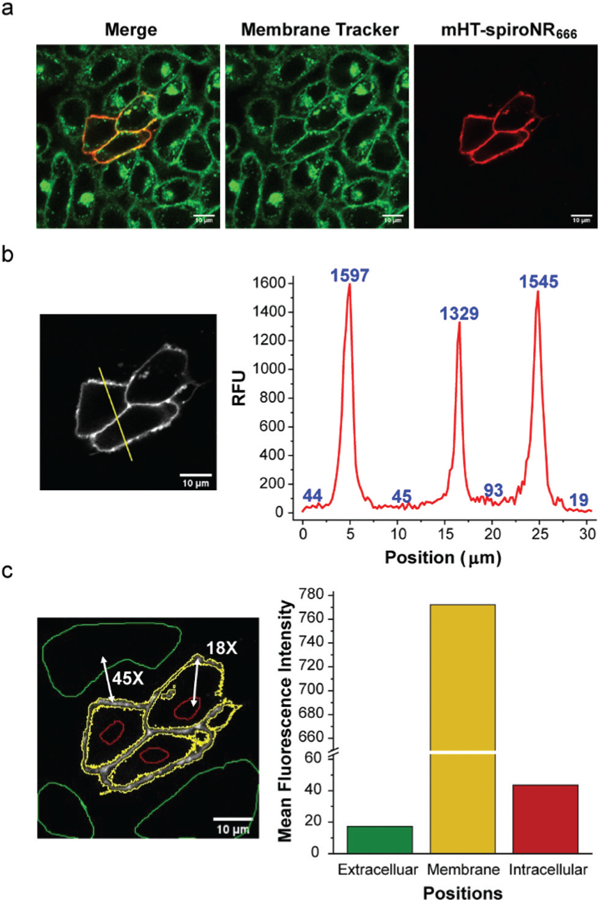
No-wash imaging of mHT-spiroNR666 in living cells. (a) Confocal microscopy images of CHO cells transiently transfected with HaloTag-hOX2R and labeled with 100 nM mHT-spiroNR666. (b) Quantification of the fluorescence signal across the indicated region of interest. (c) Comparison of mean fluorescence intensities obtained from extracellular (green), membrane (yellow), or intracellular (red) regions of interest. Scale bar: 10 μm.
Imaging receptor internalization
Lastly, we sought to visualize the internalization of HaloTag-hOX2R in real-time upon stimulation with ligand. Since photo-stability of imaging probes is a critical component of time-lapse imaging experiments, we first ascertained the photobleaching rate of our NR-based probes in laser scanning confocal microscopy using a 640 nm laser at 2 mW, imaging 5 seconds per frame. Under these conditions, the bleaching rates of HT-NR666 and mHT-spiroNR666 were found to be 47% and 37% less than the commonly used cyanine-based HT-sulfoCy5.5 probe, respectively (Fig. 1 and Fig. S9†). Based on its brightness and stability, we chose to employ HT-NR666 to image hOX2R internalization in real-time. After labeling of HaloTag-hOX2R on transiently transfected CHO cells with HT-NR666, DMSO or 1 μM orexin A was added to the cells. Gratifyingly, a significant relocalization of fluorescence signal from the membrane to the cytosol was observed over 30 min in the presence of orexin A (Fig. 5 and Movie S1†). Conversely, cells treated with DMSO did not display a redistribution of fluorescence signal (Fig. 5 and Movie S2†), indicating the ability to use HT-NR666 to monitor receptor internalization in live cells in real-time as well as the potential for multiplexing with green fluorescent assays.
Fig. 5.
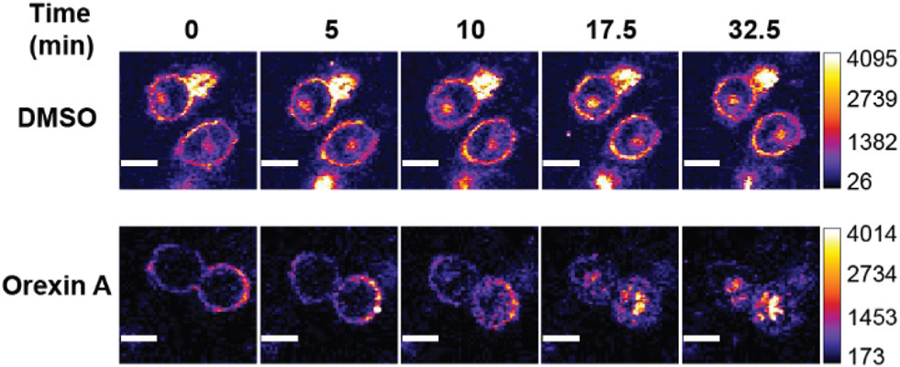
Time-lapse live-cell imaging of CHO cells expressing HaloTag-hOX2R and labeled with HT-NR666 (10 μM). Cells were treated with DMSO (control) or with orexin A (1 μM) to stimulate receptor internalization. Scale bar: 10 μm.
Conclusions
In summary, we have prepared and characterized a set of NR-based HaloTag ligands for live-cell imaging experiments. These ligands provide NIR fluorescent probes for no-wash imaging as well as monitoring receptor internalization. Interestingly, we discovered that the charge present at the bridging position of NR dyes can be leveraged to modulate the open-closed equilibrium of spirolactone analogs in the presence of the appropriate additives. Future work in our lab is focused on utilizing the probes described herein to identify modulators of GPCR activity as well as potential ligands for orphan receptors in multiplexed assays with green fluorescent reporters. We are also pursuing the construction of cytosolic probes utilizing membrane permeant NR analogues. In addition, our lab as well as others have shown the utility of phosphinates beyond red-shifting the fluorescence of dyes. For example, the new chemical functionality endowed by phosphinates enables the development of self-reporting delivery vehicles31 as well as new approaches for the development of turn-on fluorescent probes.52 Along these lines, we envision that the mHT-spiroNR666 derivative described herein may provide an additional mechanism for modulating the hydrolytic potential of phosphinates within NR dyes, enabling the potential development of reagents for localized delivery of small molecules within cells.
Methods
Reagents and instrumentation
Unless otherwise noted, reactions were conducted in oven-dried glassware under N2. All reagents and solvents were used as commercially supplied. Tetrahydrofuran (THF) was dried using 3 Å molecular sieves.53 Reactions were monitored either using thin layer chromatography (TLC) or HPLC and products were purified by flash chromatography using Merck silica gel 60 (230–400 mesh). HPLC purification was conducted using a Waters 1525 Binary HPLC pump with a 2489 UV/Vis detector. HPLC runs were performed with a semi-prep column (YMC-Pack ODS-A, 5 µm, 250 × 20 mm) using a gradient of 10–95% acetonitrile in water containing 0.1% TFA over 30 min. High-resolution mass spectrometry (HRMS) was performed by the Nebraska Center for Mass Spectrometry or at the Virginia High-Resolution Mass Spectrometry Facility. Mass data are reported in units of m/z. 1H NMR and 13C NMR experiments were performed in CD3CN or DMSO-d6 at room temperature and the spectra were recorded on Bruker-DRX-Avance 300 or 400 MHz instruments. Chemical shifts are reported relative to residual solvent: CD3CN (1.94 ppm) and DMSO-d6 (2.50 ppm) for 1H NMR and CD3CN (1.32 ppm) and DMSO-d6 (39.52 ppm) for 13C NMR.54 For 31P NMR, phosphoric acid (85 wt% in water, Sigma-Aldrich) was used as an external standard (0.00 ppm). UV-Vis spectra were recorded using a BioMate 3S UV-Visible Spectrophotometer (Thermo Scientific) or a V-780 (Jasco). Fluorescence spectra and kinetic experiments were conducted using a FluoroMax-4 Spectrofluorometer (Horiba Scientific). All absorbance assays were conducted in 100 µL quartz cuvettes, and the fluorescence assays were conducted in either 100 µL or 3.5 mL quartz cuvettes. Labeling kinetics with HaloTag protein were analyzed by fluorescence polarization using a Jasco J-815 Circular Dichroism (CD) Spectropolarimeter (HT-NR666) or by fluorescence turn-on (mHT-spiroNR666). In-gel fluorescence experiments were conducted on a Typhoon FLA 7000 and pictures were analyzed using ImageJ. Confocal microscopy was performed with a Nikon A1R-TiE live-cell imaging confocal system. Laser lines used include blue (405 nm), green (488 nm), red (561 nm), and far-red (640 nm). Emission filters include blue (425–475 nm), green (500–530 nm), red (560–617 nm) and far red (663–738 nm). ImageJ software was used for image analysis.
HaloTag labeling kinetics
For HT-NR666, HaloTag protein (His6-Halo, 100 nM) and NR dye (25 nM) were placed in a cuvette at 25 °C and the fluorescence polarization (Ex: 660 nm, Em: 690 nm) was monitored over time using a Jasco J-815 Circular Dichroism Spectropolarimeter. The apparent second order rate constant was calculated by dividing the pseudo-first order rate constant (k = 0.053 s−1) obtained from a fit of fluorescence polarization data, by the concentration of HaloTag protein. Labeling kinetics for mHT-spiroNR666 were determined via fluorescence turn-on (see Fig. S8†).
Determination of labeling stoichiometry
For titration assays, 500 nM HaloTag protein was incubated with 2000, 1000, 500, 250, 125, 62.5, 31.3, 15.6, and 7.8 nM HT-NR666 for 20 min at room temperature. The protein–dye mixture was separated by SDS-PAGE and the gel was imaged using a Typhoon FLA 7000. ImageJ was used to analyze band intensities.
For Job’s plot assays, the total concentration of HaloTag protein and HT-NR666 was kept constant at 1 μM, while the ratio of the two components changed from 1 : 9 to 9 : 1. After separation by SDS-PAGE, a fluorescence image of the gel was obtained using a Typhoon FLA 7000. ImageJ software was used to analyze band intensities.
Determination of KL-Z for mHT-spiroNR666
KL-Z was determined as described previously48 by first measuring εdw, the extinction coefficient of mHT-spiroNR666 in a 1 : 1 (v/v) dioxane : water mixture with 0.01% triethylamine (1.4 × 10³ M−1 cm−1), and εmax, the extinction coefficient of mHT-spiroNR666 in ethanol containing 0.1% TFA (7.2 × 10³ M−1 cm−1). KL-Z was calculated using the following equation:
Determination of D0.5 for mHT-spiroNR666
D0.5 was determined as described previously,49 by measuring the absorbance of mHT-spiroNR666 in dioxane–water mixtures. Absorbance readings were normalized to the maximal absorbance across the range and plotted against the dielectric constant (D). D0.5 is defined as the dielectric constant at which the normalized absorbance is 0.5.
Cell culture
Chinese hamster ovary (CHO) cells (ATCC, CCL-61) were grown in DMEM (Life Tech, 10566016) supplemented with 10% fetal bovine serum (Life Tech, 10082147) and 1× Anti–Anti (Life Tech, 15240062). Cells were maintained at 37 °C in a humidified 5% CO2 atmosphere.
Transfection of CHO cells
CHO cells were passaged onto 35 mm Petri dishes (MatTek, P35GC-1.5–14-C) and grown at 37 °C in a 5% CO2, humidified atmosphere in DMEM (Life Tech, 10566016) supplemented with 10% fetal bovine serum (Life Tech, 10082147) and 1× Anti–Anti (Life Tech, 15240062). After 12 h, cells were washed with prewarmed DMEM. After reaching 60% confluency, cells were washed with prewarmed DPBS (Life Tech, 14040133), and Opti-MEM (Life Tech, 51985034) was added. Cells were then treated with lipofectamine 3000 (Life Tech, L3000015) containing the HA-EGFP-HaloTag2 plasmid (8 µg, a gift from Craig Crews, Addgene, 41742)55 according to the manufacturer’s protocol. After 6 h, cells were washed with DPBS twice and cultured in DMEM with 10% fetal bovine serum and 1× Anti–Anti for 24 h before imaging.
For transfection of the HT-hOX2R plasmid, cells were grown on 35 mm Petri dishes (MatTek, P35GC-1.5–14-C) at 37 °C in a 5% CO2, humidified atmosphere in DMEM (Life Tech, 10566016) supplemented with 10% fetal bovine serum (Life Tech, 10082147) and 1× Anti–Anti (Life Tech, 15240062) to a confluency of 25%, they were treated with lipofectamine 3000 containing the HT-hOX2R plasmid (5 µg)44 according to the manufacturer’s protocol. After 6 h, cells were washed with DPBS twice and cultured in DMEM with 10% fetal bovine serum and 1× Anti–Anti for 48 h before imaging.
Imaging CHO cells transfected with EGFP-HaloTag2 plasmid
Cells were washed with prewarmed DPBS three times and incubated with 0.1× CellMask Orange Plasma membrane stain (Life Tech, C10045) and 10 µM HT-NR666 or mHT-spiroNR666 for 20 min. Cells were then washed with DPBS three times and imaged in DMEM (Life Tech, 21063029).
Imaging CHO cells transfected with HT-hOX2R plasmid
For HT-NR666, the protocol was the same as for imaging CHO cells transfected with the EGFP-HaloTag2 plasmid above. For mHT-spiroNR666, cells were washed with DPBS three times and incubated with 0.1× CellMask Orange Plasma membrane stain for 20 min. After washing with DPBS three times, cells were incubated with 100 nM mHT-spiroNR666 in DMEM (Life Tech, 21063029) with 10% FBS fetal bovine serum for 15 min and imaged without washing.
Measurement of photobleaching rates
CHO cells transfected with HT-hOX2R plasmid were incubated with CellMask Orange Plasma membrane Stain according to the manufacturer’s protocol. After 20 min, cells were washed with DPBS three times and incubated with 10 μM HT-NR666, mHT-spiroNR666, or HT-sulfoCy5.5 in DPBS for 20 min. Cells were then washed with DPBS three times and imaged using a 640 nm laser with power adjusted to 20% (2 mW). Cells were continuously imaged (5 s per frame) until the fluorescence signal was bleached. Fluorescent intensity within the region of interest from each frame was analyzed using ImageJ software and fluorescence intensities were normalized to time zero. Fluorescence data points was then fit to a first-order decay curve (y = a × e−kx + b, where y is the fluorescence and x is the frame number) yielding the bleaching rate constants (k, r2 > 0.999 for each fit).
Organic synthesis
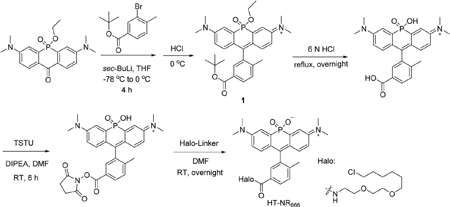
HT-NR666.
tert-Butyl-3-bromo-4-methylbenzoate (1.356 g, 5 mmol) was dissolved in anhydrous THF (40 mL) and the temperature was lowered to −78 °C with an acetone/dry ice bath. After stirring for 10 min, sec-butyl lithium (1.4 M in cyclohexane, 3.57 mL, 5 mmol) was added dropwise within 10 min and the mixture was stirred at the same temperature for 1 h. 3,7-Bis(dimethylamino)-5-ethoxy-10H-acridophosphin-10-one 5-oxide (360 mg, 1 mmol)31 was dissolved in 40 mL THF using sonication and added dropwise into the reaction mixture. The temperature was then allowed to rise to 0 °C and the reaction was stirred for an additional 4 h on ice. HCl (2 N, ∼15 mL) was used to quench the reaction and the pH was adjusted to 3–4 by addition of a saturated sodium bicarbonate solution. The mixture was extracted with DCM three times. The DCM layer was collected, dried over sodium sulfate, filtered, and solvent was evaporated. The resulting green solid was then applied to flash column chromatography (0–70% methanol/DCM), yielding a green solid 1. Further washing with DCM and filtering to remove silica gel yielded 1 as a dark green oil (256 mg). 1 was determined to be a mixture of the desired product as well as the corresponding deprotected carboxylic acid. 1 was used for subsequent steps without further purification. 1 was dissolved in 6 N HCl (10 mL) and refluxed overnight. After removing the solvent, the mixture was dissolved in DMF (3 mL). DIPEA (435 μL, 2.5 mmol) and TSTU (301 mg, 1 mmol) were added and the reaction was stirred for 6 h. After HPLC purification and lyophilization, the NHS ester was dissolved in DMF (3 mL) and 2-(2-((6-chlorohexyl)oxy) ethoxy)ethan-1-amine (Halo-Linker, 223 mg, 1 mmol) was added and the reaction was stirred overnight. After removing the solvent, the mixture was dissolved in HPLC solvent (50 : 50 water : acetonitrile with 0.1% trifluoroacetic acid) and purified by HPLC. A dark blue solid (88 mg, 13.5% overall yield) was obtained after lyophilization.
1H NMR (300 MHz, acetonitrile-d3) δ 7.94 (dd, J = 8.0, 1.9 Hz, 1H), 7.71 (d, J = 1.9 Hz, 1H), 7.55–7.47 (m, 3H), 6.91 (dd, J = 9.6, 6.1 Hz, 2H), 6.65 (dd, J = 9.6, 2.8 Hz, 2H), 3.62–3.44 (m, 10H), 3.35 (t, J = 6.5 Hz, 2H), 3.25 (s, 12H), 2.05 (s, 3H), 1.69 (p, J = 6.9 Hz, 2H), 1.52–1.23 (m, 6H).
13C NMR (75 MHz, acetonitrile-d3) δ 165.89, 155.44, 155.28, 144.21, 139.58, 139.34, 139.21, 136.84, 132.08, 130.48, 128.01, 127.39, 123.58, 123.48, 114.36, 70.62, 69.94, 69.72, 69.15, 45.23, 40.64, 39.55, 32.32, 29.26, 26.37, 25.15, 18.60.
31P NMR (121 MHz, acetonitrile-d3) δ 2.99.
MS (ESI) m/z calculated for C35H46ClN3O5P [M + H]+ 654.2858, found 654.2851.
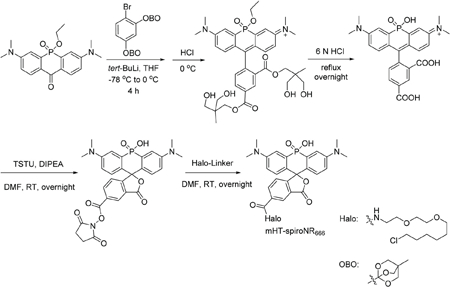
mHT-spiroNR666.
1,1′-(4-Bromo-1,3-phenylene)bis(4-methyl-2,6,7-trioxabicyclo[2.2.2]octane) (2.07 g, 5 mmol) was added to anhydrous THF (40 mL) and the temperature was lowered to −78 °C using an acetone/dry ice bath. After stirring for 10 min, tert-butyl lithium (1.7 M in pentane, 2.94 mL, 5 mmol) was added dropwise within 10 min and the mixture was stirred at the same temperature for 1 h. 3,7-Bis(dimethyl-amino)-5-ethoxy-10H-acridophosphin-10-one 5-oxide (180 mg, 0.5 mmol)31 was dissolved in 20 mL THF using sonication and added dropwise into the reaction mixture. The temperature was then allowed to rise to 0 °C and the reaction was further stirred for 4 h on ice. HCl (2 N, ∼15 mL) was used to quench the reaction and the pH was adjusted to 3–4 using a saturated sodium bicarbonate solution. The mixture was extracted with 10% isopropanol/chloroform three times. The organic layer was collected, dried over sodium sulfate, filtered, and the solvent was evaporated. The resulting green oil was then applied to flash column chromatography (0–90% methanol/DCM, with 0.5% acetic acid), yielding a green solid. Further washing with DCM and filtering to remove silica gel yielded a dark green oil, which was dissolved in 6 N HCl and refluxed overnight. After removing the solvent, the mixture was dissolved in DMF (1.5 mL). DIPEA (218 μL, 1.25 mmol) and TSTU (151 mg, 0.5 mmol) were added and the reaction was stirred overnight at room temperature. After evaporating the solvent, the NHS ester was purified by HPLC and further dissolved in DMF (1.5 mL). 2-(2-((6-Chlorohexyl)oxy)ethoxy)ethan-1-amine (Halo-Linker, 112 mg, 0.5 mmol) was added and the reaction was stirred overnight at room temperature. After removing the solvent, the mixture was dissolved in HPLC solvent (50 : 50 water : acetonitrile with 0.1% trifluoroacetic acid) and purified by HPLC. A blue solid (52 mg, 15.2% overall yield) was obtained after lyophilization. Dissolving the solid in DMSO yielded a near colorless solution, indicating that the spirocyclized form predominates in DMSO.
1H NMR (400 MHz, DMSO-d6) δ 8.79 (t, J = 5.4 Hz, 1H), 8.41 (s, 1H), 8.15–8.06 (m, 1H), 7.60 (d, J = 8.2 Hz, 1H), 7.16 (dd, J = 14.4, 2.9 Hz, 2H), 6.98–6.79 (m, 4H), 3.64–3.40 (m, 10H), 3.35 (t, J = 6.5 Hz, 2H), 2.97 (s, 12H), 1.66 ( p, J = 6.5 Hz, 2H), 1.44 ( p, J = 7.2, 6.7 Hz, 2H), 1.38–1.20 (m, 4H).
13C NMR (101 MHz, DMSO-d6) δ 170.22, 165.22, 158.95, 158.59, 158.03, 150.33, 150.20, 136.30, 135.02, 131.84, 130.58, 127.68, 127.56, 126.91, 126.82, 124.70, 23.99, 123.69, 116.26, 111.19, 111.13, 70.73, 70.21, 69.99, 69.27, 45.90, 32.55, 29.60, 26.64, 25.45.
31P NMR (162 MHz, DMSO-d6) δ 11.54.
MS (ESI) m/z calculated for C35H44ClN3O7P [M + H]+ 684.2600, found 684.2596.
Supplementary Material
Acknowledgements
We thank the Morrison Microscopy Core Facility for assistance with confocal fluorescence microscopy and the Research Instrumentation/NMR facility as well as the Nebraska Center for Mass Spectrometry and the University of Virginia High-Resolution Mass Spectrometry Facility for assistance with characterization of new compounds. We also thank the Redox Biology Center for assistance with fluorescence polarization experiments and Prof. Heriberto Cerutti for use of a Typhoon FLA 7000 imager. Epifluorescence was conducted in the Advanced Microscopy Facility at the University of Virginia (S10OD021723). This work was funded by the NIH (R35GM119751), the Center for Nanohybrid Functional Materials (NSF EPS-1004094), and the University of Virginia. The content of this work is solely the responsibility of the authors and does not necessarily represent the official views of the NIH.
Footnotes
Electronic supplementary information (ESI) available. See DOI: 10.1039/d0ob00043d
Conflicts of interest
There are no conflicts to declare.
References
- 1.Palczewski K and Orban T, Annu. Rev. Neurosci, 2013, 36, 139–164. [DOI] [PMC free article] [PubMed] [Google Scholar]
- 2.Pierce KL, Premont RT and Lefkowitz RJ, Nat. Rev. Mol. Cell Biol, 2002, 3, 639–650. [DOI] [PubMed] [Google Scholar]
- 3.Rosenbaum DM, Rasmussen SG and Kobilka BK, Nature, 2009, 459, 356–363. [DOI] [PMC free article] [PubMed] [Google Scholar]
- 4.Weis WI and Kobilka BK, Annu. Rev. Biochem, 2018, 87, 897–919. [DOI] [PMC free article] [PubMed] [Google Scholar]
- 5.Sriram K and Insel PA, Mol. Pharm, 2018, 93, 251–258. [DOI] [PMC free article] [PubMed] [Google Scholar]
- 6.Jacobson KA, Biochem. Pharmacol, 2015, 98, 541–555. [DOI] [PMC free article] [PubMed] [Google Scholar]
- 7.Hanyaloglu AC and von Zastrow M, Annu. Rev. Pharmacol. Toxicol, 2008, 48, 537–568. [DOI] [PubMed] [Google Scholar]
- 8.Ferguson SS, Pharmacol. Rev, 2001, 53, 1–24. [PubMed] [Google Scholar]
- 9.Fukunaga S, Setoguchi S, Hirasawa A and Tsujimoto G, Life Sci, 2006, 80, 17–23. [DOI] [PubMed] [Google Scholar]
- 10.Jiang WX, Dong X, Jiang J, Yang YH, Yang J, Lu YB, Fang SH, Wei EQ, Tang C and Zhang WP, Sci. Rep, 2016, 6, 20568. [DOI] [PMC free article] [PubMed] [Google Scholar]
- 11.Barak LS, Ferguson SS, Zhang J, Martenson C, Meyer T and Caron MG, Mol. Pharmacol, 1997, 51, 177–184. [DOI] [PubMed] [Google Scholar]
- 12.Tarasova NI, Stauber RH, Choi JK, Hudson EA, Czerwinski G, Miller JL, Pavlakis GN, Michejda CJ and Wank SA, J. Biol. Chem, 1997, 272, 14817–14824. [DOI] [PubMed] [Google Scholar]
- 13.Kumar GA, Sarkar P, Jafurulla M, Singh SP, Srinivas G, Pande G and Chattopadhyay A, Biochemistry, 2019, 58, 2628–2641. [DOI] [PubMed] [Google Scholar]
- 14.Thomsen W, Frazer J and Unett D, Curr. Opin. Biotechnol, 2005, 16, 655–665. [DOI] [PubMed] [Google Scholar]
- 15.Zhang R and Xie X, Acta Pharmacol. Sin, 2012, 33, 372–384. [DOI] [PMC free article] [PubMed] [Google Scholar]
- 16.Chai X, Cui X, Wang B, Yang F, Cai Y, Wu Q and Wang T, Chem. – Eur. J, 2015, 21, 16754–16758. [DOI] [PubMed] [Google Scholar]
- 17.Deng F and Xu D, Chin. Chem. Lett, 2018, 30, 1667–1681. [Google Scholar]
- 18.Egawa T, Koide Y, Hanaoka K, Komatsu T, Terai T and Nagano T, Chem. Commun, 2011, 47, 4162–4164. [DOI] [PubMed] [Google Scholar]
- 19.Fischer C and Sparr C, Angew. Chem., Int. Ed, 2018, 57, 2436–2440. [DOI] [PubMed] [Google Scholar]
- 20.Fukazawa A, Suda S, Taki M, Yamaguchi E, Grzybowski M, Sato Y, Higashiyama T and Yamaguchi S, Chem. Commun, 2016, 52, 1120–1123. [DOI] [PubMed] [Google Scholar]
- 21.Grimm JB, Brown TA, Tkachuk AN and Lavis LD, ACS Cent. Sci, 2017, 3, 975–985. [DOI] [PMC free article] [PubMed] [Google Scholar]
- 22.Grimm JB, Gruber TD, Ortiz G, Brown TA and Lavis LD, Bioconjugate Chem, 2016, 27, 474–480. [DOI] [PubMed] [Google Scholar]
- 23.Grimm JB, Sung AJ, Legant WR, Hulamm P, Matlosz SM, Betzig E and Lavis LD, ACS Chem. Biol, 2013, 8, 1303–1310. [DOI] [PMC free article] [PubMed] [Google Scholar]
- 24.Hirayama T, Mukaimine A, Nishigaki K, Tsuboi H, Hirosawa S, Okuda K, Ebihara M and Nagasawa H, Dalton Trans, 2017, 46, 15991–15995. [DOI] [PubMed] [Google Scholar]
- 25.Koide Y, Kawaguchi M, Urano Y, Hanaoka K, Komatsu T, Abo M, Terai T and Nagano T, Chem. Commun, 2012, 48, 3091–3093. [DOI] [PubMed] [Google Scholar]
- 26.Koide Y, Urano Y, Hanaoka K, Piao W, Kusakabe M, Saito N, Terai T, Okabe T and Nagano T, J. Am. Chem. Soc, 2012, 134, 5029–5031. [DOI] [PubMed] [Google Scholar]
- 27.Koide Y, Urano Y, Hanaoka K, Terai T and Nagano T, ACS Chem. Biol, 2011, 6, 600–608. [DOI] [PubMed] [Google Scholar]
- 28.Liu J, Sun YQ, Zhang H, Shi H, Shi Y and Guo W, ACS Appl. Mater. Interfaces, 2016, 8, 22953–22962. [DOI] [PubMed] [Google Scholar]
- 29.Lutkus LV, Irving HE, Davies KS, Hill JE, Lohman JE, Eskew MW, Detty MR and McCormick TM, Organometallics, 2017, 36, 2588–2596. [Google Scholar]
- 30.Piao W, Hanaoka K, Fujisawa T, Takeuchi S, Komatsu T, Ueno T, Terai T, Tahara T, Nagano T and Urano Y, J. Am. Chem. Soc, 2017, 139, 13713–13719. [DOI] [PubMed] [Google Scholar]
- 31.Zhou X, Lai R, Beck JR, Li H and Stains CI, Chem. Commun, 2016, 52, 12290–12293. [DOI] [PMC free article] [PubMed] [Google Scholar]
- 32.Fang Y, Good GN, Zhou XQ and Stains CI, Chem. Commun, 2019, 55, 5962–5965. [DOI] [PMC free article] [PubMed] [Google Scholar]
- 33.Zhou X, Fang Y, Lesiak L and Stains CI, ChemBioChem, 2019, 20, 1712–1716. [DOI] [PMC free article] [PubMed] [Google Scholar]
- 34.Los GV, Encell LP, McDougall MG, Hartzell DD, Karassina N, Zimprich C, Wood MG, Learish R, Ohana RF, Urh M, Simpson D, Mendez J, Zimmerman K, Otto P, Vidugiris G, Zhu J, Darzins A, Klaubert DH, Bulleit RF and Wood KV, ACS Chem. Biol, 2008, 3, 373–382. [DOI] [PubMed] [Google Scholar]
- 35.Fang XQ, Fu Y, Long MJC, Haegele JA, Ge EJ, Parvez S and Aye Y, J. Am. Chem. Soc, 2013, 135, 14496–14499. [DOI] [PMC free article] [PubMed] [Google Scholar]
- 36.Abdelfattah AS, Kawashima T, Singh A, Novak O, Liu H, Shuai YC, Huang YC, Campagnola L, Seeman SC, Yu JN, Zheng JH, Grimm JB, Patel R, Friedrich J, Mensh BD, Paninski L, Macklin JJ, Murphy GJ, Podgorski K, Lin BJ, Chen TW, Turner GC, Liu Z, Koyama M, Svoboda K, Ahrens MB, Lavis LD and Schreiter ER, Science, 2019, 365, 699–704. [DOI] [PubMed] [Google Scholar]
- 37.England CG, Luo H and Cai W, Bioconjugate Chem, 2015, 26, 975–986. [DOI] [PMC free article] [PubMed] [Google Scholar]
- 38.Liu Y, Fares M, Dunham NP, Gao Z, Miao K, Jiang X, Bollinger SS, Boal AK and Zhang X, Angew. Chem., Int. Ed, 2017, 56, 8672–8676. [DOI] [PubMed] [Google Scholar]
- 39.Scammell TE and Winrow CJ, Annu. Rev. Pharmacol. Toxicol, 2011, 51, 243–266. [DOI] [PMC free article] [PubMed] [Google Scholar]
- 40.Kiyashchenko LI, Mileykovskiy BY, Maidment N, Lam HA, Wu MF, John J, Peever J and Siegel JM, J. Neurosci, 2002, 22, 5282–5286. [DOI] [PMC free article] [PubMed] [Google Scholar]
- 41.Zeitzer JM, Buckmaster CL, Parker KJ, Hauck CM, Lyons DM and Mignot E, J. Neurosci, 2003, 23, 3555–3560. [DOI] [PMC free article] [PubMed] [Google Scholar]
- 42.Lin L, Faraco J, Li R, Kadotani H, Rogers W, Lin XY, Qiu XH, de Jong PJ, Nishino S and Mignot E, Cell, 1999, 98, 365–376. [DOI] [PubMed] [Google Scholar]
- 43.Cox CD, Breslin MJ, Whitman DB, Schreier JD, McGaughey GB, Bogusky MJ, Roecker AJ, Mercer SP, Bednar RA, Lemaire W, Bruno JG, Reiss DR, Harrell CM, Murphy KL, Garson SL, Doran SM, Prueksaritanont T, Anderson WB, Tang C, Roller S, Cabalu TD, Cui D, Hartman GD, Young SD, Koblan KS, Winrow CJ, Renger JJ and Coleman PJ, J. Med. Chem, 2010, 53, 5320–5332. [DOI] [PubMed] [Google Scholar]
- 44.Kumagai H, Ikeda Y, Motozawa Y, Fujishiro M, Okamura T, Fujio K, Okazaki H, Nomura S, Takeda N, Harada M, Toko H, Takimoto E, Akazawa H, Morita H, Suzuki J, Yamazaki T, Yamamoto K, Komuro I and Yanagisawa M, PLoS One, 2015, 10, e0129394. [DOI] [PMC free article] [PubMed] [Google Scholar]
- 45.Chen X, Pradhan T, Wang F, Kim JS and Yoon J, Chem. Rev, 2012, 112, 1910–1956. [DOI] [PubMed] [Google Scholar]
- 46.Lukinavičius G, Reymond L, Umezawa K, Sallin O, D’Este E, Göttfert F, Ta H, Hell SW, Urano Y and Johnsson K, J. Am. Chem. Soc, 2016, 138, 9365–9368. [DOI] [PubMed] [Google Scholar]
- 47.Lukinavičius G, Umezawa K, Olivier N, Honigmann A, Yang G, Plass T, Mueller V, Reymond L, Corrêa IR Jr., Luo Z-G, Schultz C, Lemke EA, Heppenstall P, Eggeling C, Manley S and Johnsson K, Nat. Chem, 2013, 5, 132. [DOI] [PubMed] [Google Scholar]
- 48.Zheng Q, Ayala AX, Chung I, Weigel AV, Ranjan A, Falco N, Grimm JB, Tkachuk AN, Wu C, Lippincott-Schwartz J, Singer RH and Lavis LD, ACS Cent. Sci, 2019, 5, 1602–1613. [DOI] [PMC free article] [PubMed] [Google Scholar]
- 49.Butkevich AN, Mitronova GY, Sidenstein SC, Klocke JL, Kamin D, Meineke DN, D’Este E, Kraemer PT, Danzl JG, Belov VN and Hell SW, Angew. Chem., Int. Ed, 2016, 55, 3290–3294. [DOI] [PMC free article] [PubMed] [Google Scholar]
- 50.Okamura K, Dummer P, Kopp J, Qiu L, Levi M, Faubel S and Blaine J, PLoS One, 2013, 8, e54817. [DOI] [PMC free article] [PubMed] [Google Scholar]
- 51.Ge S, Kojio K, Takahara A and Kajiyama T, J. Biomater. Sci., Polym. Ed, 1998, 9, 131–150. [DOI] [PubMed] [Google Scholar]
- 52.Chai XY, Xiao J, Li M, Wang CM, An HY, Li C, Li YT, Zhang DZ, Cui XY and Wang T, Chem. – Eur. J, 2018, 24, 14506–14512. [DOI] [PubMed] [Google Scholar]
- 53.Bradley D, Williams G and Lawton M, J. Org. Chem, 2010, 75, 8351–8354. [DOI] [PubMed] [Google Scholar]
- 54.Gottlieb HE, Kotlyar V and Nudelman A, J. Org. Chem, 1997, 62, 7512–7515. [DOI] [PubMed] [Google Scholar]
- 55.Neklesa TK, Tae HS, Schneekloth AR, Stulberg MJ, Corson TW, Sundberg TB, Raina K, Holley SA and Crews CM, Nat. Chem. Biol, 2011, 7, 538–543. [DOI] [PMC free article] [PubMed] [Google Scholar]
Associated Data
This section collects any data citations, data availability statements, or supplementary materials included in this article.


