

Abstract
Aims
Heart failure reduces quality of life and life expectancy; hospital admissions are frequent and create a burden on public resources. This study aims to quantify the benefits in terms of health effects [quality‐adjusted life years (QALYs)] and costs when heart failure patients receive case management at home compared with outpatient cardiology clinic follow‐up.
Methods and results
A health state transition (Markov) model was written, and transition probabilities were derived from a cohort of 1114 patients and available literature. QALYs in different health states of heart failure patients were retrieved from the literature, and costs were estimated with data from the financial department of the Noordwest Ziekenhuisgroep and public cost sources. Monthly simulation cycles were repeated 60 times to generate 5 years of virtual follow‐up data. Baseline willingness to pay is assumed €50 000 per QALY. Sensitivity analyses were performed in a one‐way deterministic and a multiway probabilistic approach; the probabilistic approach used uniform and more plausible distributions of the model parameters.
Case management reduced costs by €382 and increased QALYs by 0.261 for the baseline simulation; this results in a net monetary benefit of €13 428. Probabilistic sensitivity analysis based on uniform and most plausible distributions of parameters resulted in 96.2% and 83.3% of the simulations, favouring a treatment strategy of case management.
Conclusions
Case management is cost effective in 83.3% of the probabilistic simulations and has a tendency towards reducing costs and increasing QALYs when considering a real‐world cohort of heart failure patients in the Netherlands.
Keywords: Heart failure, Health care economics and organizations, Markov chains, Patient care management, Case management, Quality‐adjusted life years
Introduction
In the developed world, heart failure is a highly prevalent disease accompanied with a decreased life expectancy and a significant disease burden. 1 , 2 Hospital admissions are frequent and costly, 3 , 4 creating a heavy burden on hospital resources. Care delivery to heart failure patients is difficult because of the presence of various multimorbidities, social and functional impairments, non‐adherence, and suboptimal medical treatment. 5 Thus, improving care delivery to the multimorbid heart failure population may prevent unnecessary hospital admissions and death. 5 , 6
Currently, heart failure patients in the Netherlands are mainly treated in outpatient cardiology clinics according to the European Society of Cardiology guidelines 7 ; this creates problems with the accessibility of care for patients. 8 A proposed alternative to outpatient clinic follow‐up is case management at home where follow‐up is actively managed by a nurse practitioner or community physician through education, optimization of medication use, and organizing of financial and social support. 9 Recent studies have proven that enhancing care accessibility with case management results in a reduction of hospital admissions and mortality compared with outpatient clinic lead follow‐up. 10 , 11 Because both mortality and hospital admissions were less frequent, case management is expected to result in a longer healthy life in terms of quality‐adjusted life years (QALYs) and lower hospitalization costs. 10 Furthermore, case management was proven cost effective in various settings but not specifically for the Dutch population. 12
The aim of this article was to compare outpatient cardiology clinic heart failure follow‐up care and case management at home with a medical decision analysis based on health state transition simulations (Figure 1 ). 13 , 14 This approach has the benefit that it has lesser time and resource consumption than a randomized clinical trial of thousands of patients to prove the same concept. Furthermore, a decision analysis has the advantage that all facets of the clinical problem can be described clearly, the overall evidence from the literature can be used in the analysis, and the threshold values for determinants of costs and benefits of the two strategies can be calculated.
Figure 1.

Markov health state transition decision tree. Simulated patients with an index acute heart failure hospital admission are either assigned to outpatient cardiology clinic follow‐up or case management. Each of the terminal red triangles is a health state in which a patient resides to each time step in a health state utilities are attached; quality‐adjusted life years and costs. Each simulation step events can occur; hospital readmission, death, or in the case of hospitalized patients discharge. These events (transitions) have a certain probability of occurring through time. NYHA, New York Heart Association functional classification.
Methods
The model
A health state transition (Markov) model 13 , 14 was written with four health states: ‘New York Health Association (NYHA) functional classification I or II’, 15 ‘NYHA class III or IV’, 15 ‘Dead’, and ‘Hospitalized’. The model used time steps of 1 month; all transition probabilities were transformed to monthly transition probabilities assuming constant independent events. 16 For each health state, the associated costs and the value of QALYs were determined from financial data from single‐centre cohort data and literature, respectively. One‐month time steps were repeated 60 times to reflect a follow‐up time of 5 years. Two virtual starting cohorts, one control and one intervention of 100 000 patients each, starting in the hospitalized state and none in the other states. Discounting of costs and QALYs was performed at a 4% and 1.5% annual rate, respectively, in accordance with the current Dutch guidelines. 17 Costs were indexed with an annual inflation rate of 2.9%. 18
Data sources
All patients admitted for at least 24 h with the diagnosis ‘acute heart failure’ between 1 January 2013 and 31 December 2015 at the cardiology ward of the Noordwest Ziekenhuisgroep (NWZ) Alkmaar were included for analysis. The first admission between 1 January 2013 and 31 December 2015 was used as index admission, and patients were followed retrospectively for 1 year to identify the probability of at least one hospital readmission and mortality. Exclusion was performed when patients actively denied access to their medical reports, were discharged within 24 h, or discharged to another general hospital. Approval for patient data use was provided by the Committee for Retrospective Research in the NWZ Alkmaar in accordance with the Declaration of Helsinki.
PubMed searches were performed to retrieve non‐available and validate available model parameters from the cohort data. Three searches were performed to assess the treatment effect of case management, QALYs per NYHA class, and hospital readmission rate per NYHA class. Restrictions for the search aimed first on finding reviews and meta‐analyses; if no sufficient articles were found, clinical trials were considered. Terms used for the search were related to the population (heart failure patients), intervention arm (case management), control arm (outpatient clinic follow‐up), outcome (mortality or hospital admission), NYHA class, and QALYs. Full information on all terms and restrictions used are available in Appendix A in the Supporting Information.
Transition probabilities
The majority of the baseline control arm transition probabilities was retrieved from cohort data. It was assumed that after discharge, there is a net zero effect of NYHA change; decay and improvement of NYHA class in the discharged patients sum up to 0. Appendix B in the Supporting Information provides a full overview of transition probability computations and retrieval. All included patients were used to assess discharge allocation and in hospital mortality during and after the index admission. The ‘discharged home‐percentage’, fraction of patients discharged to their home, was defined as patients who are discharged with NYHA class I or II. The ‘percentage‐discharged‐to‐another‐care‐facility’ (fraction of patients who are discharged to another care facility) was used to define the health state ‘NYHA class III or IV’. It was assumed that the initial hospital admission and readmissions last 1 month (one turn in the Markov model). The definition of case management from Krumholz et al. was used to identify studies with a search where case management was provided by either a general practitioner or specialized nurse. 9 Relative risks (RRs) from the search were used to calculate the probability of hospital readmission and mortality for the case‐managed group from observed probabilities in the NWZ cohort.
Costs and quality adjusted life years related to the health states
The utility values for QALYs in the health states were retrieved from articles found with a PubMed search (Supporting Information, Appendix A). Only articles that included QALY values between and including 0 and 1 were considered. A weighed average QALY was taken with respect to the total participants of the study to create estimates per NYHA class. It was assumed that the QALY value in the Markov state ‘hospitalized’ was equal to the value of the state ‘NYHA class III or IV’; death was defined as zero QALYs.
Quantities of health care activities were retrieved from the financial administration department and multiplied with available pricing sources from the Nederlandse Zorg Autoriteit (Dutch Healthcare Authority), institute for Medical Technological Assessment, and other public sources to retrieve costs related to hospital admission and outpatient clinic follow‐up. 19 , 20 , 21 Costs related to case management were computed from quantities of health care activities available in the studies found and institute for Medical Technological Assessment cost estimates. 20 Yearly QALYs and costs were divided by 12 to retrieve monthly rates; the inflation rate was used to retrieve costs in the reference year 2020. Appendix C in the Supporting Information contains all the QALY and cost calculations.
Outcome measures and sensitivity analysis
The primary outcome parameters were the differences in costs and QALYs between the intervention and control group (∆); these differences were used to compute net monetary benefit [NMB = λ × ∆QALY − ∆Costs, where λ refers to willingness to pay (WTP) for one QALY]. 17 Secondary endpoints were hospital readmission rate, survival time, and time in various health states. Outcomes were presented as median with a range (the 5th and 95th percentile) and reflect the 5‐year (60 simulation turns) period of the model. Results were first presented with the use of baseline; subsequently, sensitivity analyses are performed to handle parameter uncertainty. A deterministic one‐way sensitivity analysis was performed to assess the effect of a 10–50% increase or decrease of one parameter, keeping all others fixed. Two probabilistic sensitivity analyses (PSAs) were performed: the first using random values between minima and maxima (uniform distributed) found in the literature search and the second using the most plausible distribution for the parameters estimated from available data. In the sensitivity analyses, the price of a QALY was set at a value of €50 000 22 ; based on the PSA‐simulated cohort data, a cost/effectiveness–acceptability curve was constructed to assess costs and effectiveness for varying levels of WTP per QALY. Programming and calculations were performed in Excel 2010 and Python 3.6. Code was made available at https://github.com/henkvanvoorst92/CostEffectiveness.
Results
Cohort and search results
Descriptive results, probabilities of events, and costs for the NWZ cohort are depicted in Table 1 . A total of 949 articles were reviewed, and 21 articles were used for model parameter estimation and validation. The three searches that were conducted and exclusion rates are depicted in Figure 2 . Five studies included pooled RR estimates for hospital readmission and mortality where case management was compared with (usual) outpatient cardiology clinic follow‐up; the study from Takeda et al. was chosen to represent the treatment effect as it was of superior quality. 10 At 12 months follow‐up, an RR of 0.64 (95% confidence interval: 0.53–0.78) for hospital readmission and 0.78 (95% confidence interval: 0.68–0.90) for mortality were found 10 ; other studies revealed similar estimates (Supporting Information, Table B.1.). A total of 13 clinical trials were found that included hospital readmission rates per NYHA class. The hospital readmission rates found in the studies for ‘NYHA class I or II’ were between 16.24% at 40 months and 45% at 12 months follow‐up (monthly rates: 0.44–4.86%), and for ‘NYHA class III or IV’, between 18.50% at 57 months and 89.0% at 12 months follow‐up (monthly rates: 0.36–16.80%). Table B.3. in the Supporting Information contains a full overview of these data for all articles.
Table 1.
Cohort data. Number of events and corresponding probabilities observed in the cohort
| Cohort data | |
|---|---|
| Number of patients | 1114 |
| Number of heart failure hospital admissions in 1 year | 1426 |
| Median duration of hospital admission in days | 6 (0–71) |
| Median age in years (p5–p95) | 78.8 (21.0; 100.0) |
| Discharged home number of events (probability) | 948 (0.851) |
| Discharged to other care facility number of events (probability) | 78 (0.070) |
| Deaths during index admission number of events (probability) | 88 (0.079) |
| Recurrent admission in year after discharged home number of events (probability) a | 185 (0.0179) |
| Death in year after discharged home number of events (probability) | 217 (0.0214) |
| Recurrent admission in year after discharged to other care facility a | 11 (0.0126) b |
| Death in year after discharged to other care facility | 31 (0.0413) |
| Costs outpatient clinic care(€/month; min–max) | 36 (13–177) |
| Costs case management only (€/month, min–max) | 36 (10–125) |
| Costs hospital admission (€/admission, min–max) | 3,795 (1956; 18 146) c |
One or more recurrent hospital admissions after discharge.
An alternative literature estimate was used for this probability.
The second highest maximum value was used (€5600) because the depicted maximum was an outlier; values were rounded to hundreds.
Figure 2.

Search results. Three searches were conducted; search terms presented refer to a group of search terms available in Table A1 in the Supporting Information. A search was conducted to estimate treatment effect (A), hospital admission rate by New York Heart Association (NYHA) (B), and quality‐adjusted life years coupled to units of time in NYHA classes (C).
In the QALY literature search, four articles were selected that represented the utility values per NYHA class. 23 , 24 , 25 , 26 The weighted average QALY values per year were 0.79 in NYHA class I, 0.73 in NYHA class II, 0.61 in NYHA class III, and 0.47 in NYHA class IV (Supporting Information, Table C.5.). This resulted in a QALY value for Markov state ‘NYHA class I or II’ of 0.76, Markov state ‘NYHA class III or IV’ of 0.54, and a QALY value of 0.54 in the Markov state ‘hospital’. Appendix D in the Supporting Information contains a full overview of all input parameters used for different simulations.
Baseline simulation outcome and one‐way deterministic sensitivity analysis
Baseline simulations resulted in an NMB of €13 428 (NMB was computed based on unrounded QALYs); this is mainly due to a difference in QALYs (intervention; control: 2.05; 1.79) because the difference in costs was small (intervention; control: €2972; €3354). Table 2 depicts baseline and PSA results. To assess the importance of separate model parameters, one‐way sensitivity analyses were performed. Figure 3 depicts the top 10 model parameters ordered based on the largest effect of 10% change (results for 20%, 30%, and 50% changes are available in Table E.1. in the Supporting Information. Tornado diagrams of costs and QALYs are in Figures E.2. and E.3. in the Supporting Information. NMB was most affected by factors influencing the QALYs over the simulation period; RR of all‐cause mortality (NMB −10%; +10%: €17 962; €9097), QALY in ‘NYHA class I or II’ (NMB −10%; +10%: €12 157; €14 700), and RR of heart failure hospital readmission (−10%; +10%: €13 795; €13 059) affected NMB the most. Cost differences between the intervention and control groups were most affected by RR of heart failure hospital readmission (−10%; +10%: −€538; −€223), RR of all‐cause mortality (−10%; +10%: −€245; −€512), and cost of case management in ‘NYHA class I or II’ (−10%; +10%: −€515; −€248).
Table 2.
Results of baseline simulation and probabilistic sensitivity analyses
| Baseline | Uniform distributed | Most plausible distributed | ||||
|---|---|---|---|---|---|---|
| Intervention | Control | Intervention | Control | Intervention | Control | |
| Costs (€) | 2972 | 3354 | 5718 (2448; 8837) | 7911 (3664; 1870) | 2788 (1128; 5933) | 3221 (1361; 6371) |
| QALY | 2.05 | 1.79 | 2.46 (2.20; 2.72) | 2.26 (2.01; 2.49) | 2.08 (1.74; 2.41) | 1.82 (1.52; 2.13) |
| Survival (months) | 34.1 | 29.7 | 40.5 (37.4; 43.4) | 37.1 (33.9; 39.7) | 34.7 (29.1; 40.2) | 30.3 (25.2; 35.4) |
| NYHA I or II (months) | 31.9 | 27.7 | 38.1 (34.2; 41.6) | 35.0 (30.8; 38.3) | 32.1 (26.7; 37.6) | 27.9 (23.2; 33.0) |
| NYHA III or IV (months) | 1.9 | 1.5 | 1.7 (0.8; 3.5) | 1.1 (0.4; 2.9) | 2.1 (1.0; 3.8) | 1.6 (0.9; 3.1) |
| Hospital admissions (n) | 0.4 | 0.5 | 0.6 (0.2; 1.1) | 1.0 (0.3; 1.6) | 0.4 (0.2; 0.6) | 0.5 (0.3; 0.8) |
| NMB (€) | 13,428 | 12,295 (1,491; 24,117) | 14,049 (−9,277; 35,299) | |||
| Cost effective (%) | ‐ | 96.2 | 83.3 | |||
NMB, net monetary benefit; NYHA, New York Heart Association; QALY, quality adjusted life year.
All numbers represent per patient values. Net monetary benefit was computed with unrounded quality adjusted life years; thus, differences may occur when recomputing. Results are depicted as median and a range of the 5th–95th percentiles between brackets.
Figure 3.

Net monetary benefit tornado. The effect of a 10% increase (orange) or decrease (blue) of each of the variables on the net monetary benefit [NMB, with €50 000 as willingness to pay per quality adjusted life year (QALY)] is depicted. Variables of the model are ordered from top to bottom in the tornado according to the most and least effect on NMB due to a 10% increase or decrease. Transition between health states is depicted as the two Markov states with a ‘‐’in between the states. New York Heart Association (NYHA) functional classification. The middle line represents the NMB found after baseline simulation (€13 428).
Multiway probabilistic sensitivity analysis
Results from PSAs for both the uniform and most plausible distributed parameters are presented in Table 2 . Case management was cost effective (NMB > 0) in 96.2% and 83.3% of the simulated cohorts when uniform and most plausible distributions were used for PSA. QALYs appear to affect the NMB most; QALYs had a median difference between the intervention and control arms of 0.200 (p5–p95: 0.041; 0.378) and 0.271 (p5–p95: −0.190; 0.696) in the uniform and most plausible distributed PSA, respectively. Costs on the other hand had only a median difference of −€2169 (p5–p95: −€7154; €2965) and −€439 (p5–p95: –€3996; €3076) in the uniform and most plausible distributed PSA. The cost differences correspond to a reduction in cost of 27.4% and 13.6% for the most uniform and most plausible distributed PSA. Differences in results between the uniform and most plausible distributed PSA were mainly due to the different mortality rates used (Supporting Information, Table D.1.) that resulted in a corresponding median months survival of 3.5 (p5–p95: 1.0; 5.8) and 4.5 (p5–p95: −3.1; 11.6). To assess the effect of a change in WTP per QALY, a cost‐effectiveness acceptability curve was constructed; furthermore, the PSA results are depicted (Figures 4 ).
Figure 4.
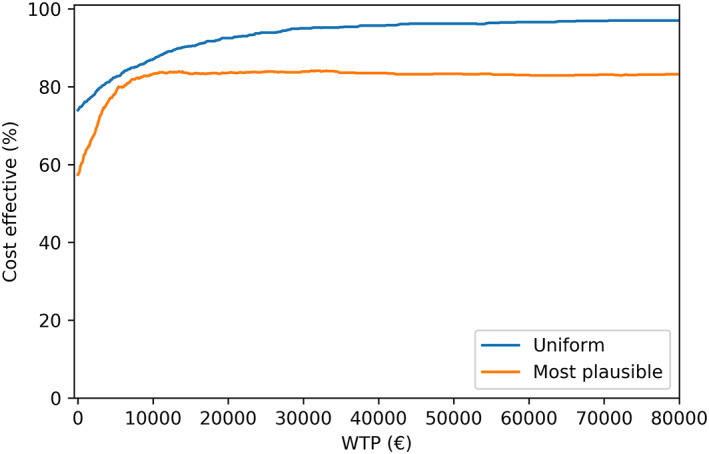
Cost‐effectiveness acceptability curve. For the uniform and most plausible distribution probabilistic sensitivity analyses the % of simulated cohorts that were cost‐effective for different willingess to pay per QALY thresholds was depicted.
Discussion
Case management relative to outpatient cardiology clinic follow‐up resulted in an NMB of €13 428 over a 5‐year follow‐up period when considering baseline parameters used of a cohort of Dutch heart failure patients. PSA revealed, however, that there is a high degree of uncertainty regarding the NMB; NMB was cost effective in 83.3% of the simulations when most plausible distributions were used. Different levels of WTP per QALY also did not alter the percentage of simulations that was cost effective above a WTP of €20 000. Although the median differences in QALYs and costs were favourable for the case management group, the wide distribution of the differences did not show that case management was strictly superior to outpatient cardiology clinic follow‐up. The one‐way deterministic sensitivity analyses revealed that the costs and QALYs related to NYHA class I or II, transition probabilities from NYHA class I or II, and related RR's were the major cause of deviations in the primary outcomes. This effect is mainly caused by the large percentage discharged home (85.1%; assumed to be in NYHA class I or II) after the index hospital admission. As a result, the effects from patients discharged to another care facility (NYHA class III or IV) were limited.
When simulations were performed based on a uniform distribution, estimated with minimum and maximum values from the literature, NMB was lower (€12 295) as a result of a lower mortality rate found in the literature compared with cohort data. Part of the difference in mortality rate can be explained by a higher age in the presented cohort (median: 78.8; p5–p95: 21; 100) compared with the age of patients in the mortality estimation study by Pocock et al. (alive age: mean 64.3, SD 11.8; and death age: mean 71.9, SD 10.9). 27 Another explanation of the higher mortality rate in the cohort data is that a large group of severely ill patients was ‘discharged home’. Unfortunately, no data were available to verify this statement. In contrast to mortality rates, hospital admissions rates for ‘NYHA class I or II’ used in this study were comparable with rates in the literature. Cost‐effectiveness results from the most plausible distributed PSA should thus be seen as a specific for a real‐world Dutch patient population, while the uniform distributed PSAs are specific for a patient population that is included in clinical trials.
Results from this study were in line with the results of the WHICH study 12 ; at 3.2‐year median follow‐up, home‐based intervention was found to be superior to clinic‐based intervention and resulted in a gain of 0.26 QALYs and a 27% decrease in costs with an NMB of 24 342 Australian dollars. Whereas the difference in QALYs was remarkably similar, in the WHICH trial, a larger, more statistically robust cost reduction was found compared with our study. The likely cause of this effects is from the exclusion of various health care costs such as non‐hospital institutionalized costs for severely ill (NYHA class III or IV) patients that are fully dependent on care. Previous studies have shown that non‐hospital institutionalized care might have severe impact on the costs. 28 Furthermore, a lower age of patients included in the WHICH study might also have altered the results. The difference in NMB between our study and the WHICH trial was also leveraged by different levels of WTP that were used: 70 000 Australian dollars per QALY as compared with €50 000 in this study.
Because an assumption was made with respect the absence of NYHA decay or improvement, an adequate study to assess the impact of functional class changes in time must be performed in the future to enhance cost‐effectiveness models. As all other transition probabilities were derived from long‐term event data, this results in an implicit constant proportional mortality and rehospitalization rate assumption. Although this assumption might not be representative for the first month after hospital admission, in the long term, constant proportional hazard rates seem a more realistic assumption. 29 The effect of case management follow‐up relative to usual care was based on studies with a relatively short period (12 months) of follow‐up 10 , 11 ; it remains uncertain whether these short‐term effects may be extrapolated to a longer period of time. Ideally, additional trials are performed that verify this assumption with respect to treatment effect and other transition probabilities. Data on the variance of treatment effect for various patient profiles were also lacking and should be assessed in future research.
Cost were estimated with a top‐down approach by using aggregated data from the financial department, public cost sources, and pooled data from Takeda et al. 10 These estimates do not represent individual patient costs and only include hospital and follow‐up costs and add an assumption of equal patients in different NYHA classes. A bottom‐up cost estimation, including patient‐specific data, should be conducted to verify non‐hospital costs during follow‐up. 17
For the extrapolation of this study results to daily practice, patients should have similar hospital readmission and mortality rates. Also, the treatment effect of care in the case‐management setting compared with the outpatient cardiology clinic follow‐up should be similar to the one used in the present study. This is not automatically the case and should be carefully guarded with training of the health care workers and quality assessment of the delivered care. Furthermore, the components of case management that cause a reduction of hospital admissions and death remain unclear. Because proper medication treatment is crucial for preventing hospital admissions and death, part of the treatment effect of case management is likely due to improved medical use. Thus, if medication use, or other components of case management, could be enhanced in the outpatient cardiology clinic, the treatment effect and cost effectiveness of case management as an alternative deteriorates.
Parameters with respect to heart failure aetiology, clinical, and physiological status were not considered in this study; as a result, heterogeneity might exist in the effectiveness and outcomes of these patients when case management is implemented. Subgroup analyses are necessary to identify the groups of patients that benefit most and least from the intervention.
Fine tuning of the decision analysis requires (i) cost data of individual patients with heart failure, (ii) time‐dependent probabilities of events derived from real‐world patient data, and (iii) long‐term treatment effects of case management compared with outpatient cardiology clinic follow‐up for subgroups of heart failure patients. The effects of this intervention for specific subgroups also remains unclear. Further improvement of evidence can be achieved with a randomized clinical trial.
Conclusions
Case management compared with outpatient cardiology clinic follow‐up for a real‐world cohort of Dutch heart failure patients appeared to have a tendency towards reducing costs and increasing QALYs and was cost effective in 83.3% of the simulations when performing PSAs. In order to generalize the presented findings in this study to common practice, additional evidence is required on the effect of case management and probabilities of death and hospital admission after 12 months follow‐up. Furthermore, more accurate estimates of non‐hospital costs are required.
Conflict of interest
The first author (H. van Voorst) is currently a PhD candidate funded by the Dutch Heart Foundation (Nederlandse Hartstichting). None of these sponsors were involved at the time of analysis and writing of this article. There are no further conflicts of interest to report.
Funding
No funding was received for this study.
Supporting information
Appendix S1. (A) Literature search. (B) Transition probabilities used for modelling. (C) Cost and QALY calculation. (D) Model input parameters. (E) Sensitivity analyses.
Acknowledgements
Remko Gramstra and Piet Boersen, Department of Business Intelligence, Noordwest Ziekenhuisgroep, assisted in cohort data retrieval. Peter Blank, Department of Business Control, Noordwest Ziekenhuisgroep, provided the benchmark frequencies of health care activities in heart failure patients. Marjolein Greuter, post‐doctoral researcher EMGO+ Research Institute for Public Health, assisted in the model development. and Tjeerd van den Ploeg, statistician of the research bureau Noordwest Ziekenhuisgroep, assisted in the computation and programming.
van Voorst, H. , and Arnold, A. E. R. (2020) Cost and health effects of case management compared with outpatient clinic follow‐up in a Dutch heart failure cohort. ESC Heart Failure, 7: 1136–1144. 10.1002/ehf2.12692.
Henk van Voorst is currently employed as PhD candidate neuroradiology at the Amsterdam University Medical Centre (AUMC), location AMC.
Both authors have no other institutional affiliations with any other industry, company, or any other corporate affiliations besides the functions stated above.
An abstract version of this study has been presented at the 2018 Annual Heart Failure Congress in Vienna (results deviate because of adjustments in the model).
References
- 1. Bhatnagar P, Wickramasinghe K, Williams J, Rayner M, Townsend N. The epidemiology of cardiovascular disease in the UK 2014. Heart 2015; 101: 1182–1189. [DOI] [PMC free article] [PubMed] [Google Scholar]
- 2. Mozaffarian D, Benjamin EJ, Go AS, Arnett DK, Blaha MJ, Cushman M, Das SR, de Ferranti S, Despres JP, Fullerton HJ, Howard VJ. Heart disease and stroke statistics‐2016 update: a report from the American Heart Association. Circulation 2016; 133: e38–e360. [DOI] [PubMed] [Google Scholar]
- 3. Nicholson G, Gandra SR, Halbert RJ, Richhariya A, Nordyke RJ. Patient‐level costs of major cardiovascular conditions: a review of the international literature. Clinicoecon Outcomes Res 2016; 8: 495–506. [DOI] [PMC free article] [PubMed] [Google Scholar]
- 4. Rijksinstituut voor Volksgezondheid en Milieu . Volksgezondheidszorg Hartfalen. https://www.volksgezondheidenzorg.info/onderwerp/hartfalen/preventie-zorg/zorg#node-ziekenhuisopnamen-voor-hartfalen. (07 February 2017).
- 5. Annema C, Luttik ML, Jaarsma T. Reasons for readmission in heart failure: perspectives of patients, caregivers, cardiologists, and heart failure nurses. Heart Lung 2009; 38: 427–434. [DOI] [PubMed] [Google Scholar]
- 6. Collins SP, Pang PS, Fonarow GC, Yancy CW, Bonow RO, Gheorghiade M. Is hospital admission for heart failure really necessary? The role of the ED and observation unit in preventing hospitalization and rehospitalization. J Am Coll Cardiol 2013; 61: 121–126. [DOI] [PMC free article] [PubMed] [Google Scholar]
- 7. Ponikowski P, Voors AA, Anker SD, Bueno H, Cleland JG, Coats AJ, Falk V, González‐Juanatey JR, Harjola VP, Jankowska EA, Jessup M, Linde C, Nihoyannopoulos P, Parissis JT, Pieske B, Riley JP, Rosano GM, Ruilope LM, Ruschitzka F, Rutten FH, van der Meer P, Authors/Task Force Members , Document Reviewers . 2016 ESC guidelines for the diagnosis and treatment of acute and chronic heart failure: the task force for the diagnosis and treatment of acute and chronic heart failure of the European Society of Cardiology (ESC). Developed with the special contribution of the Heart Failure Association (HFA) of the ESC. Eur J Heart Fail 2016; 18: 891–975. [DOI] [PubMed] [Google Scholar]
- 8. Gorthi J, Hunter CB, Mooss AN, Alla VM, Hilleman DE. Reducing heart failure hospital readmissions: a systematic review of disease management programs. Cardiol Res 2014; 5: 126–138. [DOI] [PMC free article] [PubMed] [Google Scholar]
- 9. Krumholz HM, Currie PM, Riegel B, Phillips CO, Peterson ED, Smith R, Yancy CW, Faxon DP, American Heart Association Disease Management Taxonomy Writing Group . A taxonomy for disease management: a scientific statement from the American Heart Association Disease Management Taxonomy Writing Group. Circulation 2006; 114: 1432–1445. [DOI] [PubMed] [Google Scholar]
- 10. Takeda A, Martin N, Taylor RS, Taylor SJ. Disease management interventions for heart failure. Cochrane Database Syst Rev 2019; 1: CD002752. [DOI] [PMC free article] [PubMed] [Google Scholar]
- 11. Feltner C, Jones CD, Cene CW, Zheng ZJ, Sueta CA, Coker‐Schwimmer EJ, Arvanitis M, Lohr KN, Middleton JC, Jonas DE. Transitional care interventions to prevent readmissions for persons with heart failure: a systematic review and meta‐analysis. Ann Intern Med 2014; 160: 774–784. [DOI] [PubMed] [Google Scholar]
- 12. Maru S, Byrnes J, Carrington MJ, Chan YK, Thompson DR, Stewart S, Scuffham PA, WHICH? Trial Investigators . Cost‐effectiveness of home versus clinic‐based management of chronic heart failure: extended follow‐up of a pragmatic, multicentre randomized trial cohort—the WHICH? study (which heart failure intervention is most cost‐effective & consumer friendly in reducing hospital care). Int J Cardiol 2015; 201: 368–375. [DOI] [PubMed] [Google Scholar]
- 13. Briggs A, Claxton K, Sculpher M. Decision Modelling for Health Economic Evaluation, 3rd ed. New York, United States of America: Oxford University Press; 2006. [Google Scholar]
- 14. Sonnenberg FA, Beck JR. Markov models in medical decision making: a practical guide. Med Decis Making 1993; 13: 322–338. [DOI] [PubMed] [Google Scholar]
- 15. Ponikowski P, Voors AA, Anker SD, Bueno H, Cleland JGF, Coats AJS, Falk V,Gonzalez‐Juanatey JR, Harjola VP, Jankowska EA, Jessup M, Linde C, Nihoyannopoulos P,Parissis JT, Pieske B, Riley JP, Rosano GMC, Ruilope LM, Ruschitzka F, Rutten FH, van der Meer P. 2016 ESC guidelines for the diagnosis and treatment of acute and chronic heart failure—web addenda. 2016; https://www.escardio.org/static_file/Escardio/Guidelines/ehw128_Addenda.pdf. (15 February 2017). [DOI] [PubMed]
- 16. Durrett R. Probability: Theory and Examples. Cambridge, United Kingdom: Cambridge University Press; 2019. [Google Scholar]
- 17. Hakkaart‐van Roijen L, Van der Linden N, Bouwmans C, Kanters T, Siol Swan T. Richtlijn voor het uitvoeren van economische evaluaties in de gezondheidszorg. 2016. https://www.zorginstituutnederland.nl/over-ons/publicaties/publicatie/2016/02/29/richtlijn-voor-het-uitvoeren-van-economische-evaluaties-in-de-gezondheidszorg. (30 June 2017).
- 18. Rijksinstituut voor Volksgezondheid en Milieu . Zorguitgaven Hoe ontwikkelen zich de zorguitgaven in de toekomst? 2019. https://www.vtv2018.nl/zorguitgaven. (28 September 2019).
- 19. NZA u . Tarieventabel dbc‐zorgproducten en overige producten per 1 januari. 2017. https://www.nza.nl/regelgeving/bijlagen/Tarieventabel_dbc_zorgproducten_en_overige_producten_per_1_januari_2017. (30 June 2017).
- 20. Tan SS, Bouwmans CA, Rutten FF, Hakkaart‐van Roijen L. Update of the Dutch manual for costing in economic evaluations. Int J Technol Assess Health Care 2012; 28: 152–158. [DOI] [PubMed] [Google Scholar]
- 21. Academisch Medisch Centrum. Tarieven onderlinge dienstverlening. 2012. https://www.amc.nl/web/file?uuid=14d88763-00d7-4ed7-87c3-78e4506c71a2&owner=4d928ce4-e557-4531-8337-ee2442f7f9d8&contentid=12099. (30 June, 2017).
- 22. Pomp JM. editor. Een beter Nederland. De gouden eieren van de gezondheidszorg; 2010.
- 23. Alehagen U, Rahmqvist M, Paulsson T, Levin LA. Quality‐adjusted life year weights among elderly patients with heart failure. Eur J Heart Fail 2008; 10: 1033–1039. [DOI] [PubMed] [Google Scholar]
- 24. Griffiths A, Paracha N, Davies A, Branscombe N, Cowie MR, Sculpher M. Analyzing health‐related quality of life data to estimate parameters for cost‐effectiveness models: an example using longitudinal EQ‐5D data from the SHIFT randomized controlled trial. Adv Ther 2017; 34: 753–764. [DOI] [PMC free article] [PubMed] [Google Scholar]
- 25. Kularatna S, Byrnes J, Chan YK, Carrington MJ, Stewart S, Scuffham PA. Comparison of contemporaneous responses for EQ‐5D‐3L and Minnesota Living with Heart Failure; a case for disease specific multiattribute utility instrument in cardiovascular conditions. Int J Cardiol 2017; 227: 172–176. [DOI] [PubMed] [Google Scholar]
- 26. Gohler A, Geisler BP, Manne JM, Kosiborod M, Zhang Z, Weintraub WS, Spertus JA, Gazelle GS, Siebert U, Cohen DJ. Utility estimates for decision‐analytic modeling in chronic heart failure—health states based on New York Heart Association classes and number of rehospitalizations. Value Health 2009; 12: 185–187. [DOI] [PubMed] [Google Scholar]
- 27. Pocock SJ, Ariti CA, McMurray JJ, Maggioni A, Kober L, Squire IB, Swedberg K, Dobson J, Poppe KK, Whalley GA, Doughty RN. Predicting survival in heart failure: a risk score based on 39 372 patients from 30 studies. Eur Heart J 2013; 34: 1404–1413. [DOI] [PubMed] [Google Scholar]
- 28. Path‐Theta Collaboration . Optimizing chronic disease management mega‐analysis: economic evaluation. Ont Health Technol Assess Ser 2013; 13: 1–148. [PMC free article] [PubMed] [Google Scholar]
- 29. Gustafsson F, Schou M, Videbaek L, Dridi N, Ryde H, Handberg J, Hildebrandt PR. Incidence and predictors of hospitalization or death in patients managed in multidisciplinary heart failure clinics. Eur J Heart Fail 2009; 11: 413–419. [DOI] [PubMed] [Google Scholar]
Associated Data
This section collects any data citations, data availability statements, or supplementary materials included in this article.
Supplementary Materials
Appendix S1. (A) Literature search. (B) Transition probabilities used for modelling. (C) Cost and QALY calculation. (D) Model input parameters. (E) Sensitivity analyses.