Abstract
The purpose of this study is to develop hyperspectral imaging (HSI) for automatic detection of head and neck cancer cells on histologic slides. A compact hyperspectral microscopic system is developed in this study. Histologic slides from 15 patients with squamous cell carcinoma (SCC) of the larynx and hypopharynx are imaged with the system. The proposed nuclei segmentation method based on principle component analysis (PCA) can extract most nuclei in the hyperspectral image without extracting other sub-cellular components. Both spectra-based support vector machine (SVM) and patch-based convolutional neural network (CNN) are used for nuclei classification. CNNs were trained with both hyperspectral images and pseudo RGB images of extracted nuclei, in order to evaluate the usefulness of extra information provided by hyperspectral imaging. The average accuracy of spectra-based SVM classification is 68%. The average AUC and average accuracy of the HSI patch-based CNN classification is 0.94 and 82.4%, respectively. The hyperspectral microscopic imaging and classification methods provide an automatic tool to aid pathologists in detecting SCC on histologic slides.
Keywords: Hyperspectral imaging, histology, nuclei extraction, support vector machine, convolutional neural network
1. INTRODUCTION
Squamous cell carcinoma (SCC) is a major cancer at original sites of the upper aerodigestive tract. It can occur in the nasopharynx, oral cavity, oropharynx, nasal cavity, paranasal sinuses, hypopharynx, larynx, and trachea. Surgical resection is the main treatment method for SCC.Surgeons have to work with intraoperative pathologists to ensure the cancer margin by frozen-section (FS) microscopic analysis1. SCC cells appear variation in nuclei shape, increased nuclei size, atypical mitotic figures, increased number and size of nucleoli, and hyperchromasia. However, patients with negative FS can still be diagnosed as positive. Therefore, cancer detection methods are needed to facilitate the intraoperative FS process.
Cell segmentation on histologic images has many applications but remains a challenging task with only color and shape information. Hyperspectral imaging can utilize not only the morphological information but also the abundant spectral information of nuclei, thus has the potential to serve as a tool to improve the effectiveness and accuracy of pathologic diagnosis. Hyperspectral microscopic imaging has been previously used to detect colon cancer2, 3. Unsupervised clustering methods have been implemented for ductal cancer detection using hyperspectral imaging4. A hyperspectral microscopy system based on a line-scanning hyperspectral camera and motorized stage was developed for brain cancer detection5, and a spectral-scanning-based hyperspectral microscopy system was developed for oral cancer detection6. However, the above systems needed a tradeoff between system complexity and resolution. Moreover, they either used the spectra from a whole slide, which included redundant information, or extracted nuclei manually from the slides.
This study aims to investigate hyperspectral microscopic imaging and machine learning methods for automatic detection of squamous cell carcinoma (SCC) on histologic slides. Cancerous nuclei and normal nuclei are extracted using a semi-automatic method, and both spectra-based support vector machine (SVM) and patch-based convolutional neural network (CNN) are implemented for the classification. To facilitate the clinical use, we developed a compact system with a customized hyperspectral camera, which is small and light-weighted.
2. METHODS
2.1. Histologic Slides from Head and Neck SCC Patients
Fifteen laryngeal and hypopharyneal histologic slides were obtained from 15 head and neck cancer (SCC, HPV-negative) patients of our previous studies7–9. The tissue of each slide was resected at the tumor-normal margin. A pathologist manually drew the cancerous and normal areas for each slide, which is used as the ground truth. For each slide, we chose at least three regions of interest (ROIs) for cancerous tissue and three ROIs for normal tissue, except one patient that did not have normal region. The selected cancerous ROIs were at or close to cancer nests, and the selected normal ROIs were from healthy stratified squamous epithelium far away from cancer regions. To make the spectra of cancerous nuclei and normal nuclei comparable, we only extracted normal nuclei from the second and third layer of stratified squamous epithelium, from which the SCC cells originally arise. Over 200 nuclei were extracted from each slide, including both cancerous and normal nuclei. There were in total 51 ROIs selected for normal tissue and 60 ROIs for cancerous tissue, from which nearly 5,000 nuclei were extracted. Figure 1 shows the synthesized RGB images generated from hyperspectral images of some cancerous and normal ROIs.
Figure 1.

Representative synthesized RGB images showing the regions used for nuclei extraction and quantitative testing. (a-d) Normal regions in the second and third layers of stratified squamous epithelium. (e-h) Cancerous regions
2.2. Experimental Setup and Hyperspectral Imaging
Our custom-made hyperspectral microscopic imaging system consists of a bright-field microscope (Olympus BX53) and a novel customized hyperspectral system, as shown in Figure 2. The design of the hyperspectral microscope system is compact. The wavelength range of hyperspectral images is from 460 nm to 750 nm, consisting of 87 spectra bands.
Figure 2.
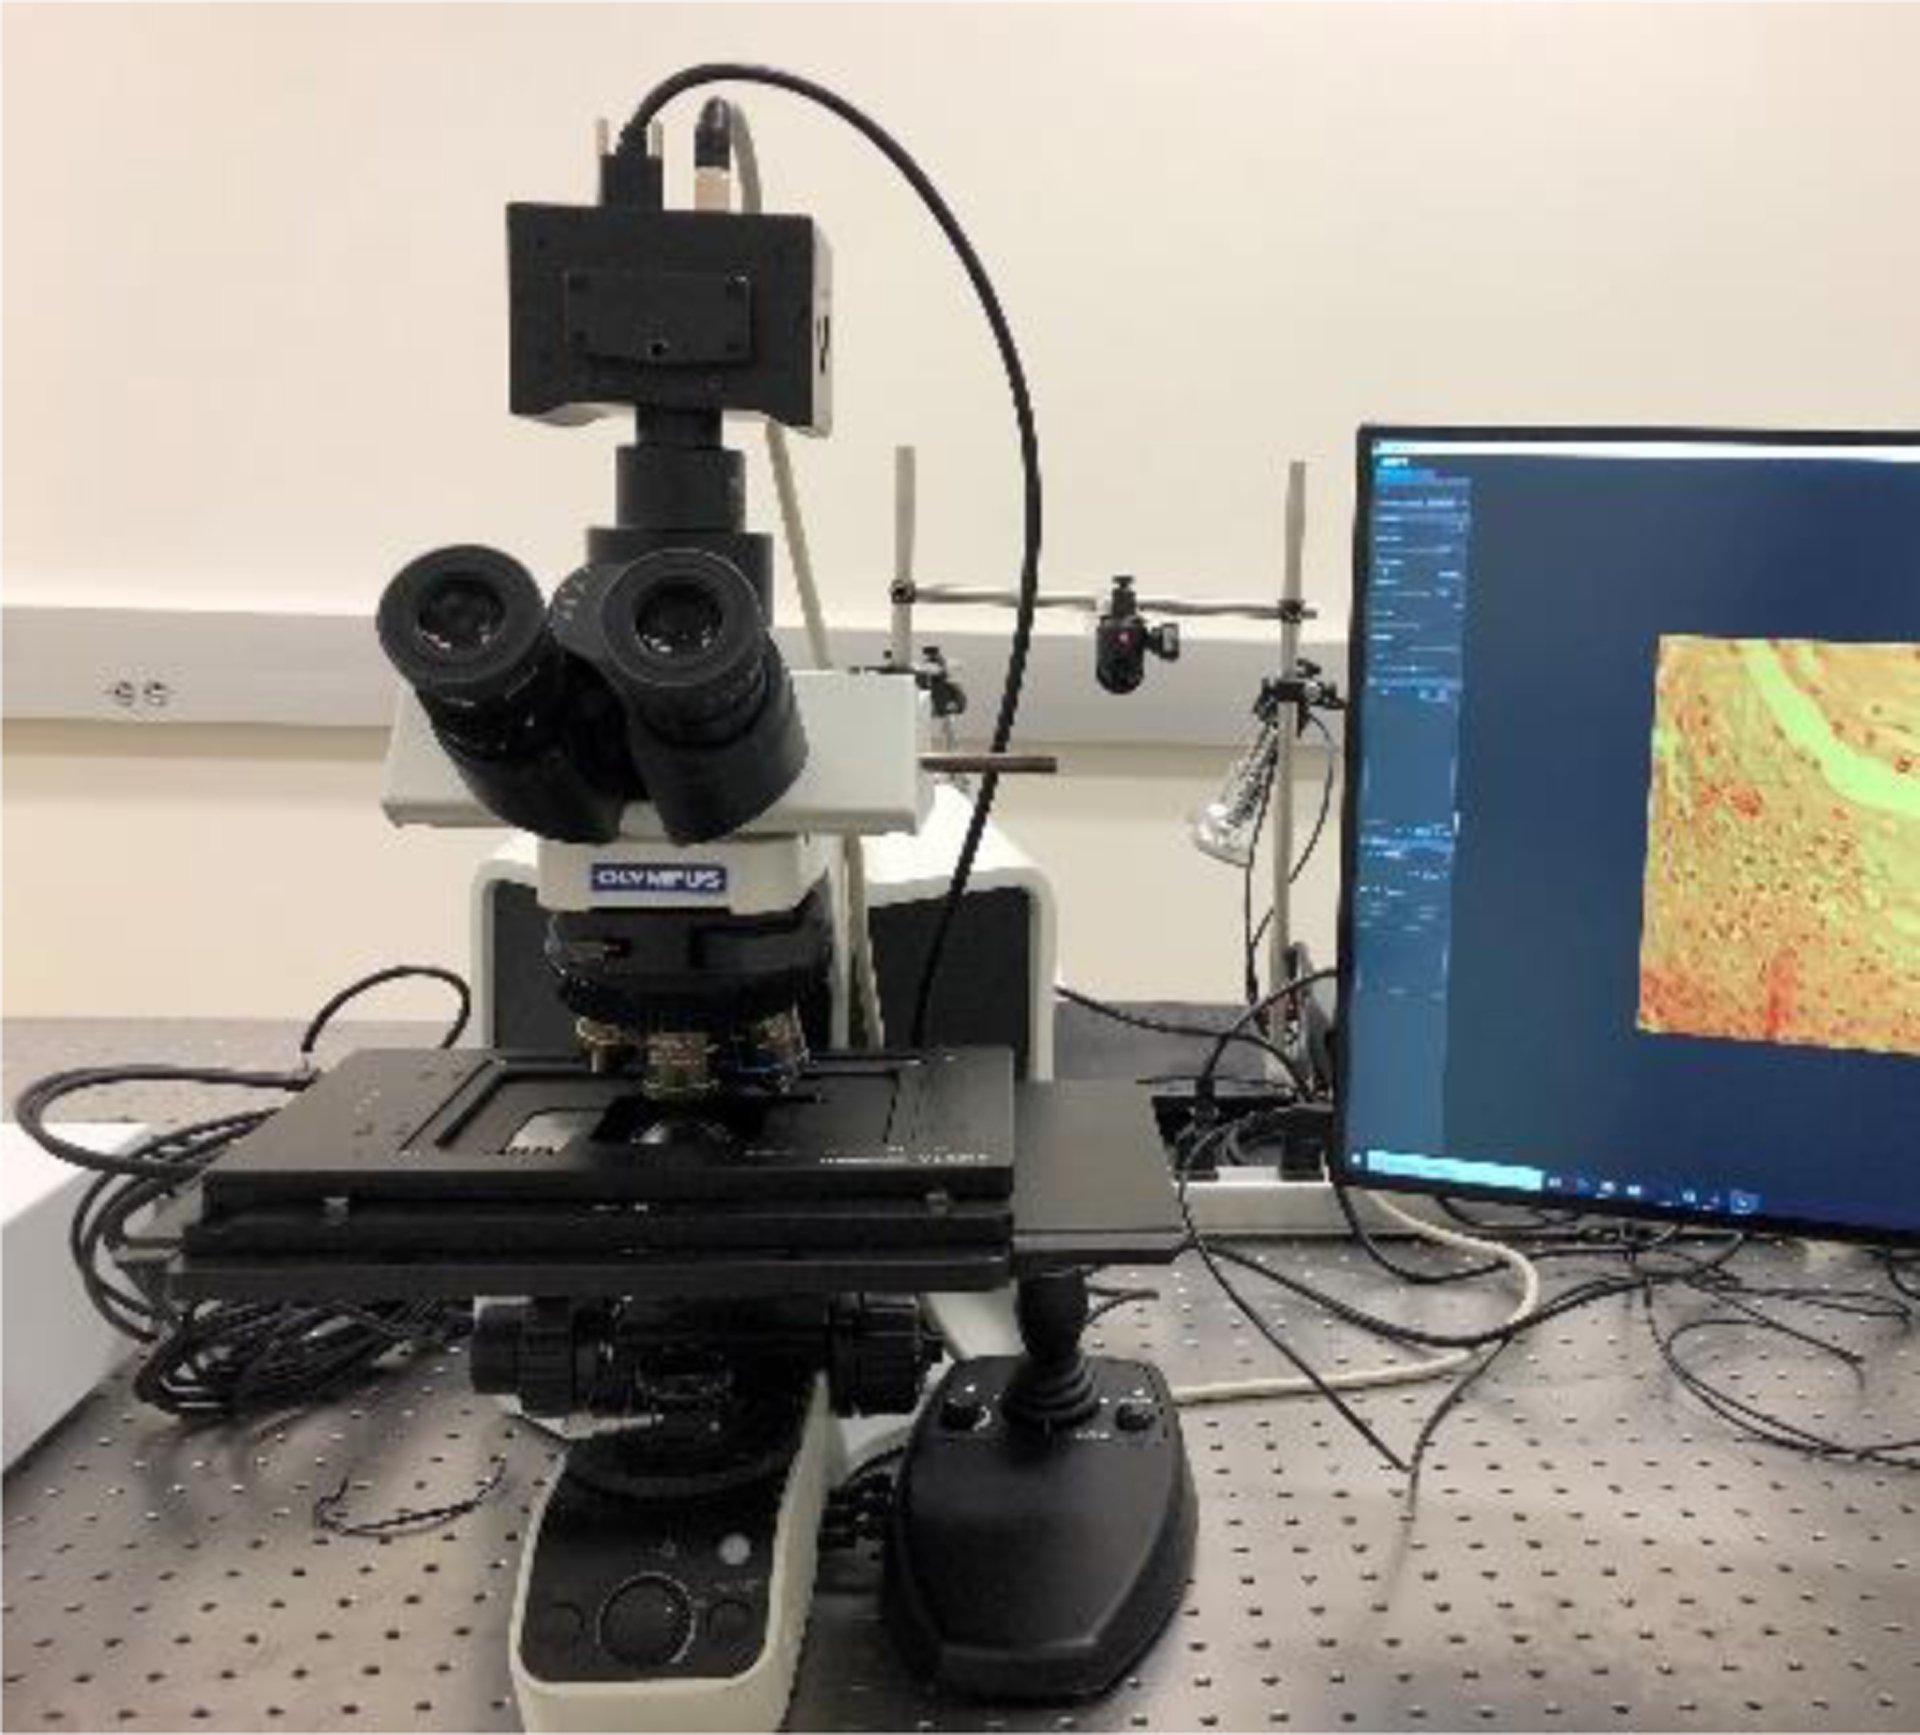
The compact hyperspectral microscopic system used for detection of SCC in histological slides.
The hematoxylin and eosin (H&E) stained histology slides were imaged using the hyperspectral microscopic system with a magnification of 40X. The field of view of the camera with 40X magnification was 280 um × 280 um, and the image size was 2048 × 2048 pixels. Therefore, the dimension of hyperspectral image was 2048 × 2048 × 87. We used the internal halogen light source of the microscope for illumination. White reference and dark reference images were captured after capturing hyperspectral image of each ROI. All hyperspectral images were calibrated with the corresponding white and dark references, as equation (1) shows.
| (1) |
where Itransmittance(λ) is the normalized transmittance for wavelength λ, Iraw(λ) is the intensity value in raw hyperspectral image, Iwhite(λ) and Idark(λ) are the intensity values in the white and dark reference images, respectively.
For better visualization of the ROIs, we generated synthesized RGB images for each hyperspectral image. The transformation function from hyperspectral image to RGB image is shown in Figure 3(b), which is similar to the spectral response of human eye. The synthesized RGB offers a higher contrast and clear visualization of cellular structures than a single band within the HSI image.
Figure 3.

Synthesize RGB image from hyperspectral data cube. (a) Demonstration of different bands in a hyperspectral image. (b) Transformation function from hyperspectral data cube to RGB image. (c) Synthesized RGB image from (a).
2.3. Semi-automatic Nuclei Segmentation
Nuclei exhibit more cancer-related information compared to other sub-cellular components such as cytoplasm and lymphocytes in squamous epithelium. Therefore, by extracting nuclei from the image, the use of redundancy information can be avoided. Here we propose a nuclei extraction method based on principle component analysis (PCA). Because of the spectral distinction among nuclei, cytoplasm and background, the top three principle components (PCs) highlight these three parts separately, as shown in Figure 4 (a–c). Although nuclei in PC1 seem to be distinct, it is not easy to extract them with a hard threshold. Since the pixels of nuclei in PC1 have lower value than those of cytoplasm and background, while the pixels of nuclei in PC2 have higher value, the difference of PC2 and PC1 yields an image with high contrast of nuclei and cytoplasm. Generally, the pixels of nuclei have positive values, while those of cytoplasm have negative values, with slightly differences among different patients. Therefore, a binary mask can be easily made to segment nuclei from the slides. Considering the general size of nuclei, extracted components with a very small area were removed. For several overlapped nuclei, we used a watershed algorithm10, 11 to separate them.
Figure 4.
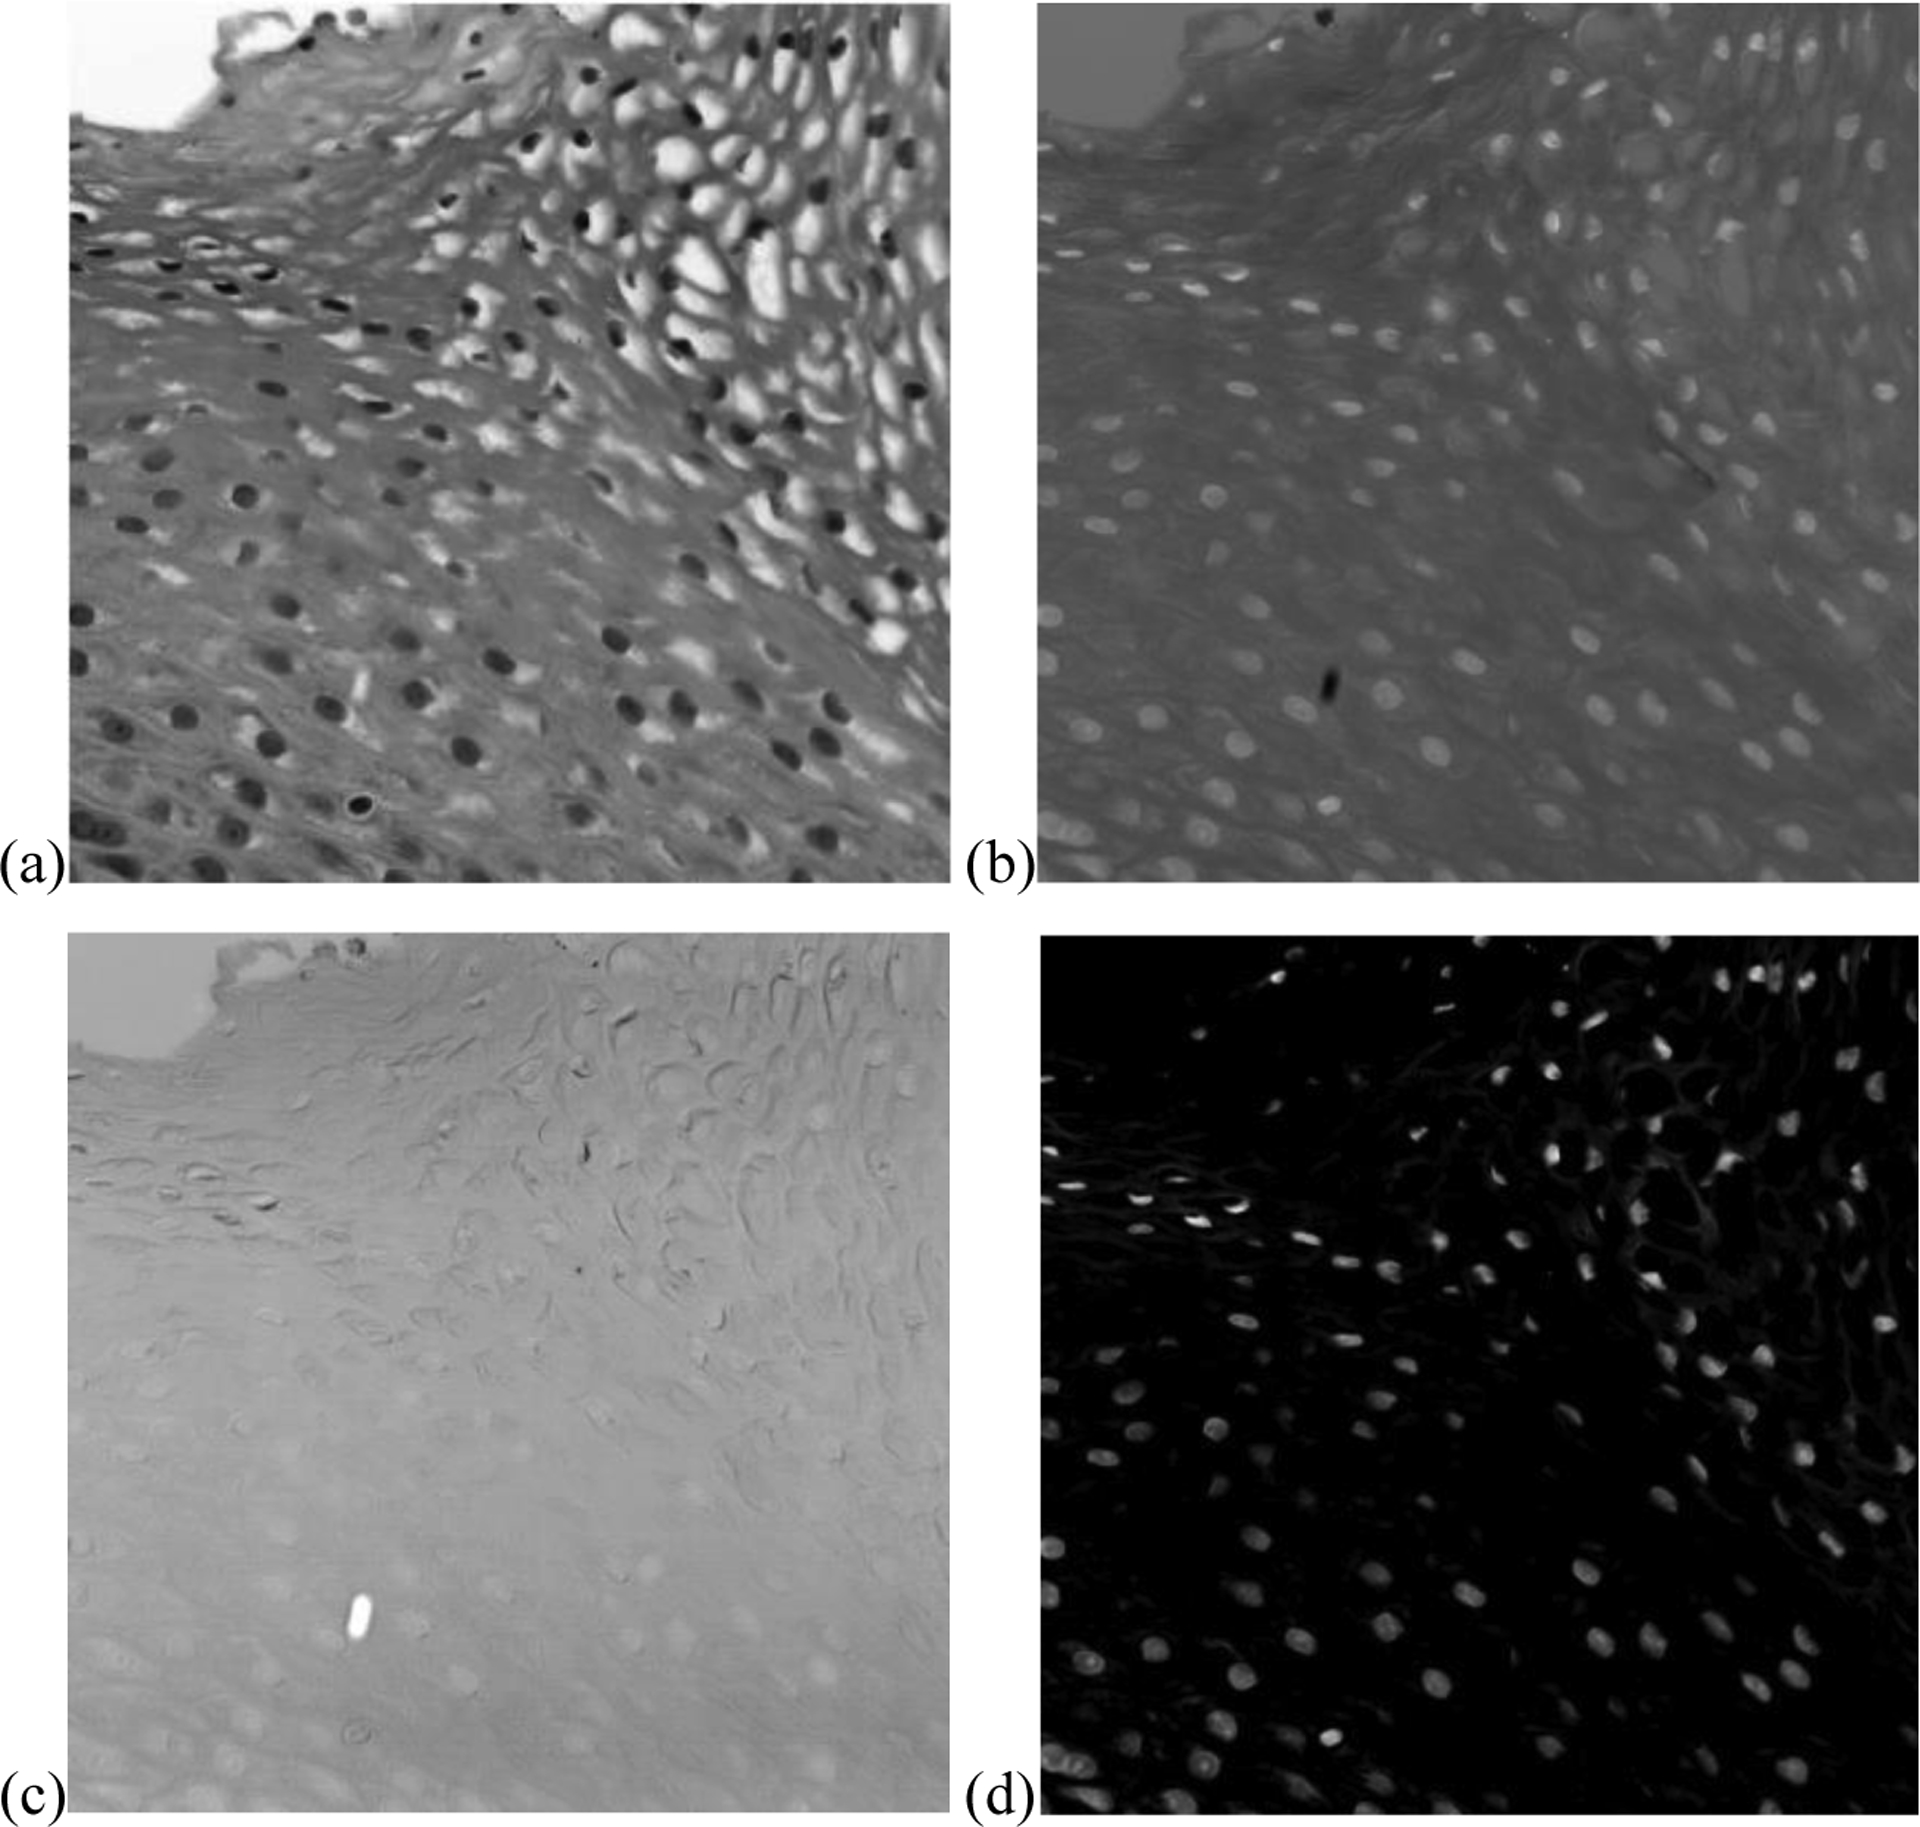
Nuclei segmentation using principal component analysis (PCA). (a) First principal component (PC1) that highlights nuclei with blurry pattern of cytoplasm. (b) Second principal component (PC2) that highlights cytoplasm with blurred nuclei. (c) Third principal component that highlights background. (d) Subtract PC1 from PC2.
2.4. Spectra-based support vector machine classification
We firstly investigate the classification ability of using spectra. With the binary masks generated, spectra of nuclei were extracted from the hyperspectral images of whole slides. Then, the average spectrum of all pixels in each extracted nucleus was calculated. Because of the illumination variation and thickness difference of the slides, spectra of nuclei have different amplitude. Therefore, each average spectrum was normalized by being divided by a constant, which is the sum of the spectrum at all wavelengths. The normalized average spectra were used for training and validation of SVM. Leave-one-patient-out validation was carried out. The patient that only had cancerous cells was only used for training. Each time spectra from 14 histologic slides were used for training, and 1 slide for validation. We implemented SVM with a radial basis function (RBF) kernel as classifier using MATLAB® (MathWorks, Natick, Massachusetts).
2.5. Patch-based convolutional neural network classification
After the segmentation of nuclei, HSI patches (101×101×87) were extracted, and each patch was centered on one segmented nucleus. Because some nuclei overlap too much to be separated, the size of patch was set to be large enough to include the overlapped nuclei. The nucleus-centered patches were used for the training and validation of a convolutional neural network (CNN) classifier. Leave-one-patient-out validation was carried out. The patient that only had cancerous cells was only used for training. The classifier is a 2D-CNN, consisting of 8 convolutional layers (stride 1×1) and 2 fully connected layers, as shown in Figure 5. Maxpooling between convolutional layers was 2×2. The optimizer used was Adam with a learning rate of 10−6. The output had two classes, i.e., cancerous and normal. Patches were augmented 12 times by being flipped and rotated before training the CNN.
Figure 5.

The 2D-CNN for HSI patch-based classification. The number above the layers indicate the feature channels.
Synthesized RGB patches of extracted HSI patches were used to train and validate the 2D-CNN as well, in order to compare with the classification using HSI patches and evaluate the usefulness of extra spectral information. The number of RGB patches were the same with HSI patches. The CNN trained with RGB patches had the same architecture with the one for HSI patches, despite that the input size was 101×101×3.
2.6. Evaluation
Before capturing the images, we carefully selected regions in the slides to make sure that the ROIs belong to cancerous or normal tissue. Cancerous regions were selected from or close to cancer nests, and normal regions were chosen from stratified squamous epithelium far from cancerous area. In addition, our selection corresponded to the manual reference standard of the pathologist. Therefore, nuclei extracted from cancerous regions were considered cancerous, and those from normal areas were normal nuclei. After the nuclei extraction, we also looked through the nuclei and removed the outliers.
In this study, we use overall accuracy, specificity, and sensitivity to evaluate the performance, as shown in Equation (1). Accuracy is defined as the ratio of the number of correctly labeled nuclei to the total number of nuclei in the testing group. Specificity and sensitivity are calculated from true positive (TP), true negative (TN), false positive (FP), and false negative (FN), where positive corresponds to cancerous and negative to normal. Specificity is the ratio of TN to the sum of TN and FP, while sensitivity is the ratio of TP to the sum of TP and FN.
| (2) |
3. RESULTS AND DISCUSSION
With the proposed nuclei segmentation method, binary masks were generated, which only highlighted nuclei, as shown in Figure 6. Because of the slight spectral distinction and the small size, lymphocytes were avoided.
Figure 6.
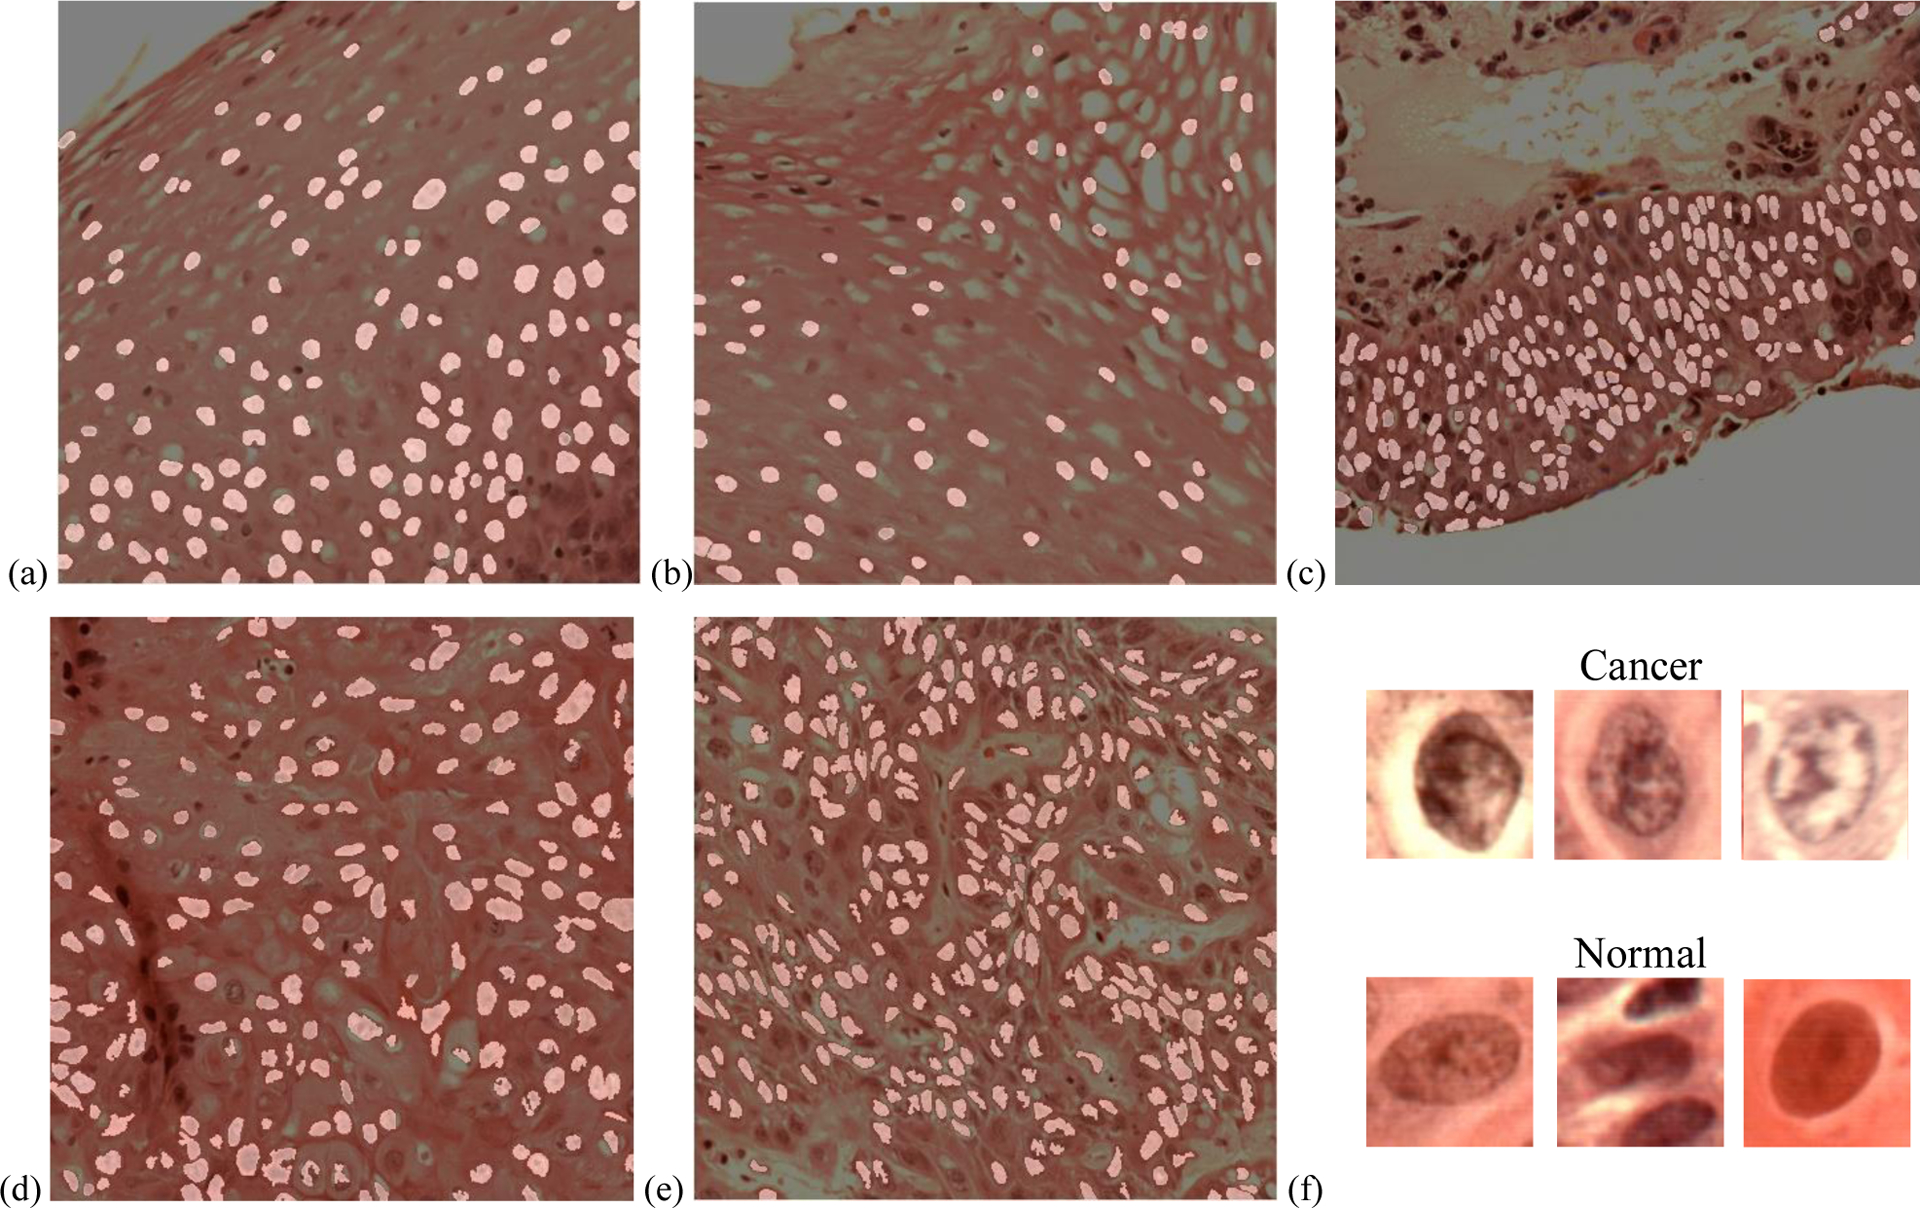
Nuclei segmentation from histologic slides. (a-c) Normal nuclei extraction. (d-e) cancerous nuclei extraction. (f) Synthesized RGB images of typical extracted cancerous and normal nuclei.
The average accuracy of SVM classification reached 68% using all the average spectra of cancerous and normal nuclei. The average specificity and average sensitivity of the SVM classification were 51% and 96.1%, respectively. The mean spectra of normal nuclei and cancerous nuclei with standard deviation are shown in Figure 7. In most cases, the average spectra of cancerous nuclei and normal nuclei have shown obvious distinction, except the three cases (Patient #127, #154, and #184) where spectra of cancerous and normal nuclei did not have much difference, and patient #110 that did not have normal nuclei. Overall there is a trend that normal spectrum is lower than cancerous spectrum in the wavelength range of 460 nm to 600 nm, and turns higher in the range of 600 nm to 750 nm. However, spectra of two types of nuclei overlap, which makes it hard to achieve a high accuracy by merely using spectra-based classification.
Figure 7.
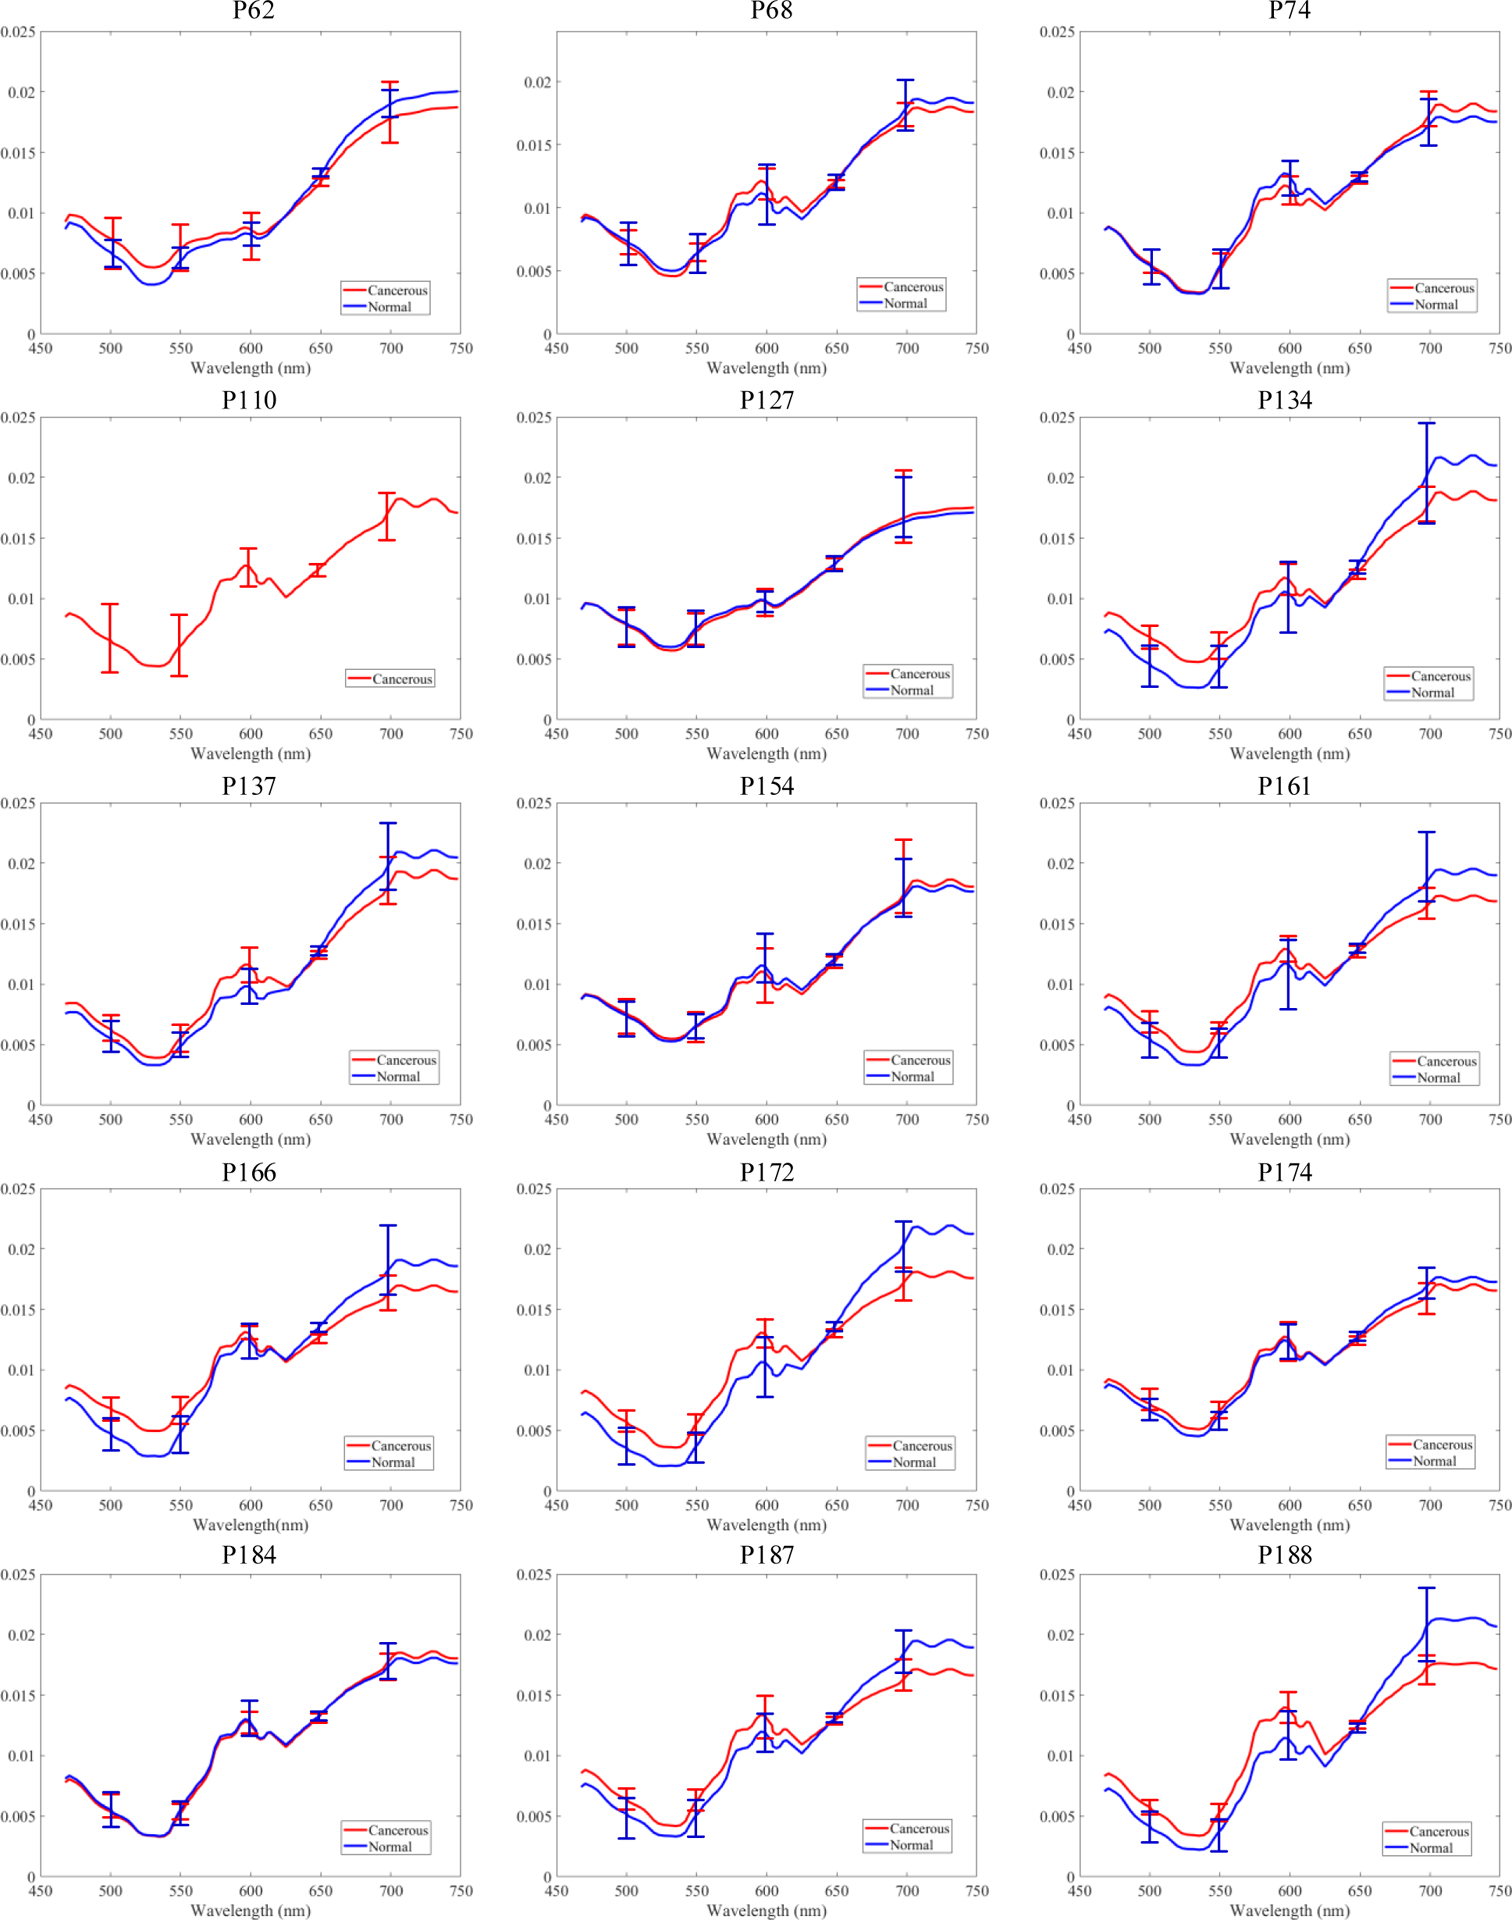
Mean spectra with standard deviation of extracted cancerous and normal nuclei in each histological slide.
The nucleus-centered HSI patch-based CNN classification could distinguish SCC nuclei from normal epithelium nuclei with an average AUC of 0.94, as well as 82.4% accuracy, 81.9% specificity, and 84.8% sensitivity. The average AUC and accuracy of RGB patch-based CNN classification were 0.93 and 81.6% using all the nucleus-centered RGB patches, as well as the average specificity and sensitivity of 79.1% and 88.8%, respectively. Classification results including AUC, accuracy, specificity and sensitivity of both CNNs are shown in Table 3 and Figure 8.
Table 3.
Patch-based 2D-CNN classification results of 14 patients using hyperspectral patches and RGB patches
| Patient number | Method | AUC | Accuracy (%) | Specificity (%) | Sensitivity (%) |
|---|---|---|---|---|---|
| 62 | RGB Patch | 0.92 | 80.4 | 90.0 | 73.1 |
| HSI Patch | 0.95 | 83.5 | 98.7 | 68.4 | |
| 68 | RGB Patch | 0.95 | 93.3 | 92.1 | 95.3 |
| HSI Patch | 0.89 | 78.5 | 90.9 | 67.0 | |
| 74 | RGB Patch | 0.91 | 85.4 | 79.8 | 96.5 |
| HSI Patch | 1 | 87.2 | 81.9 | 100 | |
| 127 | RGB Patch | 0.92 | 84.5 | 85.7 | 83.0 |
| HSI Patch | 0.92 | 75.6 | 60.3 | 92.9 | |
| 134 | RGB Patch | 0.90 | 75.3 | 74.2 | 76.7 |
| HSI Patch | 0.86 | 69.2 | 32.2 | 99.1 | |
| 137 | RGB Patch | 0.99 | 96.4 | 93.8 | 97.7 |
| HSI Patch | 1 | 99.1 | 97.3 | 100 | |
| 154 | RGB Patch | 0.90 | 76.8 | 90.9 | 65.4 |
| HSI Patch | 0.90 | 77.5 | 58.2 | 97.0 | |
| 161 | RGB Patch | 0.92 | 61.4 | 54.7 | 97.5 |
| HSI Patch | 0.93 | 65.0 | 100 | 48.4 | |
| 166 | RGB Patch | 0.96 | 88.5 | 86.8 | 90.1 |
| HSI Patch | 0.97 | 89.3 | 90.4 | 87.9 | |
| 172 | RGB Patch | 0.97 | 91.0 | 91.4 | 90.7 |
| HSI Patch | 1 | 97.4 | 94.7 | 99.7 | |
| 174 | RGB Patch | 0.92 | 74.4 | 46.0 | 97.9 |
| HSI Patch | 0.98 | 91.8 | 85.9 | 96.7 | |
| 184 | RGB Patch | 0.95 | 77.9 | 75.0 | 92.3 |
| HSI Patch | 0.94 | 80.2 | 83.3 | 70.5 | |
| 187 | RGB Patch | 0.93 | 85.5 | 80.5 | 87.2 |
| HSI Patch | 0.94 | 87.5 | 83.5 | 90.2 | |
| 188 | RGB Patch | 0.84 | 72.0 | 66.6 | 100 |
| HSI Patch | 0.84 | 72.3 | 89.4 | 69.1 | |
| Average | RGB Patch | 0.93 | 81.6 | 79.1 | 88.8 |
| HSI Patch | 0.94 | 82.4 | 81.9 | 84.8 |
Figure 8.
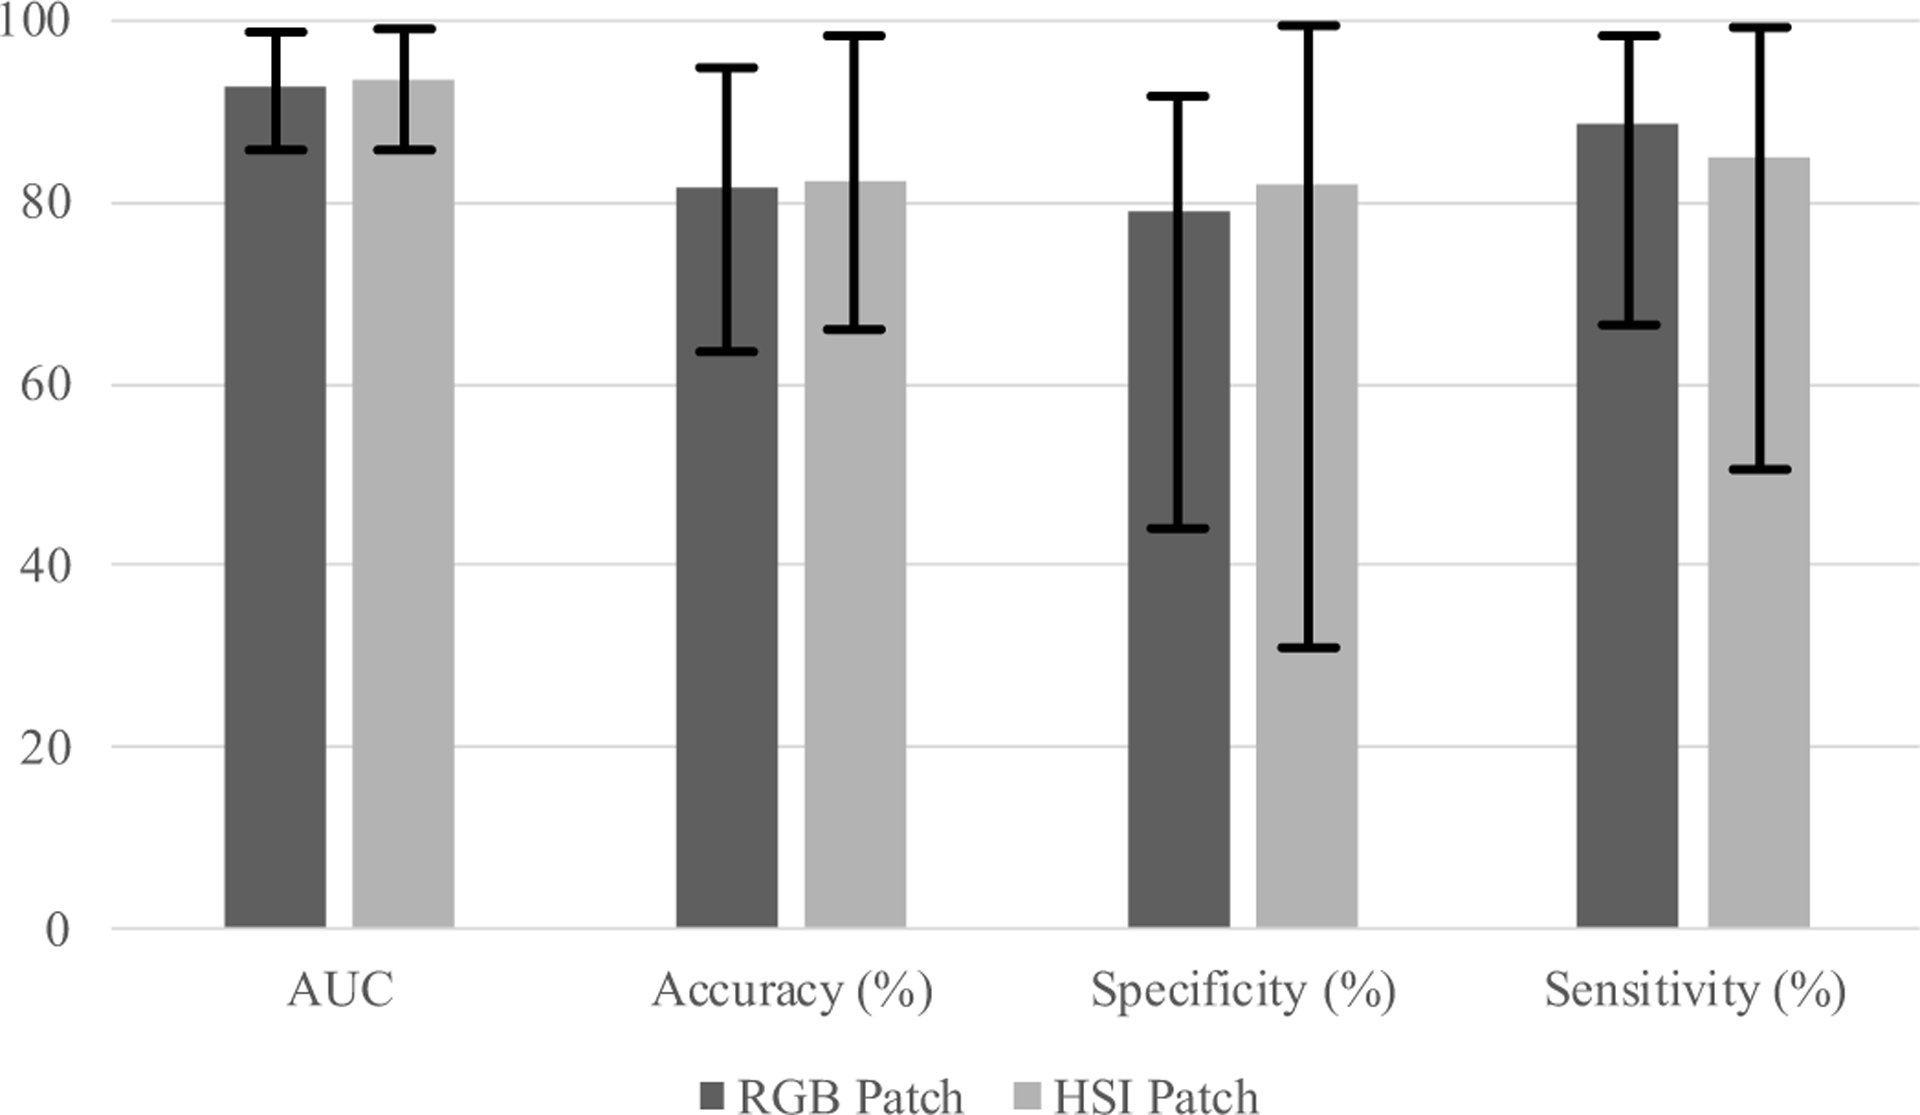
Classification results of 14 patients using HSI patch-based 2D-CNN and RGB patch-based 2D-CNN.
For most cases, HSI had better accuracy than RGB by 0.3% to 17.4%. However, for Patient #68, #127, and #134, classification using RGB patches outperformed HSI. For the hypopharyngeal slide #68, RGB patch-based CNN outperformed HSI with a 14.8% higher accuracy. Nevertheless, we could not conclude whether it was due to the spectral difference between organs, since we only had one slide. In addition, for patient #134, HSI patch-based CNN had very low specificity, which was the reason of its low accuracy. Moreover, both HSI patch-based CNN and RGB patch-based CNN outperformed the SVM classifier in 13 cases, except for Patient #161.
4. DISCUSSION
In this work, we developed a compact hyperspectral microscopic imaging system and utilized the system for SCC nuclei detection in 15 histologic slides of larynx and hypopharynx from 15 head and neck cancer patients. H&E stained slides of normal-cancer tissue margin were imaged with our HSI microscopic system. We used the annotations drew by pathologists as ground truth, then carefully selected normal ROIs from healthy stratified epithelium areas, and cancerous ROIs from or close to cancer nest. Synthesized RGB images were generated using the hyperspectral data and a transformation spectrum that is close to human eyes spectral response. A semi-automatic nuclei segmentation method based on PCA was proposed to extract nuclei from hyperspectral images, in order to avoid using extra spectral information of cytoplasm and other sub-cellular components. Then, SVM classifier that uses average spectra of nuclei, as well as patch-based 2D-CNNs trained with HSI or RGB patches were implemented for the classification.
We tested three classifiers on 14 patients except for the patient that did not have normal nuclei from epithelium. The classification results show that the CNN method performed better than the SVM in 13 out of 14 cases, due to its use of both spatial and spectral information. The CNN trained with HSI achieved an average AUC of 0.94 and an average accuracy of 82.4%, while the RGB CNN had a slightly better AUC and slight lower average accuracy. CNN trained with HSI patches did not outperform RGB CNN all the time, but the additional spectral information has improved classification accuracy by 0.3% to 17.4% in most cases. For the only slide from hypopharynx, HSI did not have a satisfying result as RGB, however, we could not conclude whether it was due to organ difference.
Although spectra of nuclei from some slides had large overlap, we could find an overall trend that spectra of normal nuclei have smaller value than spectra of cancerous nuclei within the wavelength range of 460 nm to 600 nm, and higher value within the range of 600 nm to 750 nm. This has shown a feasibility of using spectral information of nuclei as well as spatial information for cancer detection. For next step, we need to include more data of SCC nuclei from different organs, and employ a deeper network to better use the rich spectral information of hyperspectral images. In conclusion, the compact hyperspectral microscopic imaging system and classification method provides a promising tool for cancer detection on histologic slides.
Table 1.
Number of cancerous and normal nuclei extracted from each patient
| Patient Number | 62 | 68 | 74 | 110 | 127 | 134 | 137 | 154 | 161 | 166 | 172 | 174 | 184 | 187 | 188 |
|---|---|---|---|---|---|---|---|---|---|---|---|---|---|---|---|
| Normal Nuclei | 103 | 169 | 249 | 0 | 127 | 122 | 112 | 147 | 203 | 167 | 245 | 198 | 132 | 116 | 170 |
| Cancer Nuclei | 110 | 170 | 108 | 238 | 112 | 113 | 220 | 99 | 250 | 172 | 289 | 240 | 26 | 176 | 142 |
Table 2.
Confusion matrix
| Predicted results | |||
|---|---|---|---|
| Positive (cancerous) | Negative (normal) | ||
| Gold standard | Positive (cancerous) | True positive (TP) | False negative (FN) |
| Negative (normal) | False positive (FP) | True negative (TN) | |
ACKNOWLEDGEMENTS
This research was supported in part by the Cancer Prevention and Research Institute of Texas (CPRIT) grant RP190588.
Footnotes
DISCLOSURES
The authors have no relevant financial interests in this article and no potential conflicts of interest to disclose. Informed consent was obtained from all patients in accordance with Emory Institutional Review Board policies under the Head and Neck Satellite Tissue Bank (HNSB, IRB00003208) protocol.
REFERENCES
- [1].Halicek M, Fabelo H, Ortega S, Callico GM, and Fei B, “In-Vivo and Ex-Vivo Tissue Analysis through Hyperspectral Imaging Techniques: Revealing the Invisible Features of Cancer,” Cancers, 11(6), (2019). [DOI] [PMC free article] [PubMed] [Google Scholar]
- [2].Kopriva I, Aralica G, Popovic Hadzija M, Hadzija M, Dion-Bertrand L-I, Chen X, Tomaszewski JE, and Ward AD, “Hyperspectral imaging for intraoperative diagnosis of colon cancer metastasis in a liver,” Proc. SPIE 10956, Medical Imaging 2019: Digital Pathology, 109560S (2019). [Google Scholar]
- [3].Nakaya D, Tsutsumiuchi A, Satori S, Saegusa M, Yoshida T, Yokoi A, Kanoh M, Tomaszewski JE, and Ward AD, “Digital pathology with hyperspectral imaging for colon and ovarian cancer,” Proc. SPIE 10956, Medical Imaging 2019: Digital Pathology, 109560X (2019). [Google Scholar]
- [4].Khouj Y, Dawson J, Coad J, and Vona-Davis L, “Hyperspectral Imaging and K-Means Classification for Histologic Evaluation of Ductal Carcinoma In Situ,” Front Oncol, 8, 17 (2018). [DOI] [PMC free article] [PubMed] [Google Scholar]
- [5].Ortega S, Fabelo H, Camacho R, de la Luz Plaza M, Callico GM, and Sarmiento R, “Detecting brain tumor in pathological slides using hyperspectral imaging,” Biomed Opt Express, 9(2), 818–831 (2018). [DOI] [PMC free article] [PubMed] [Google Scholar]
- [6].TJarman A, Manickavasagam A, Hosny N, and Festy F, “Hyperspectral microscopy and cluster analysis for oral cancer diagnosis,” Proc. SPIE 10076, High-Speed Biomedical Imaging and Spectroscopy: Toward Big Data Instrumentation and Management II, 100761I, (2017). [Google Scholar]
- [7].Fei B, Lu G, Wang X, Zhang H, Little JV, Magliocca KR, and Chen AY, “Tumor margin assessment of surgical tissue specimen of cancer patients using label-free hyperspectral imaging,” Proc SPIE Int Soc Opt Eng, 10054, (2017). [DOI] [PMC free article] [PubMed] [Google Scholar]
- [8].Fei B, Lu G, Wang X, Zhang H, Little JV, Patel MR, Griffith CC, El-Diery MW, and Chen AY, “Label-free reflectance hyperspectral imaging for tumor margin assessment: a pilot study on surgical specimens of cancer patients,” J Biomed Opt, 22(8), 1–7 (2017). [DOI] [PMC free article] [PubMed] [Google Scholar]
- [9].Lu G, Little JV, Wang X, Zhang H, Patel MR, Griffith CC, El-Deiry MW, Chen AY, and Fei B, “Detection of Head and Neck Cancer in Surgical Specimens Using Quantitative Hyperspectral Imaging,” Clin Cancer Res, 23(18), 5426–5436 (2017). [DOI] [PMC free article] [PubMed] [Google Scholar]
- [10].Malpica N, Solórzano C. O. d., Vaquero JJ, Santos A. s., Vallcorba I, García-Sagredo JM, and Pozo1 F. d., “Applying Watershed Algorithms to the Segmentation of Clustered Nuclei,” 28: 289–297 (1997). [DOI] [PubMed] [Google Scholar]
- [11].Yang X, Li H, and Zhou X, “Nuclei Segmentation Using Marker-Controlled Watershed, Tracking Using Mean-Shift, and Kalman Filter in Time-Lapse Microscopy,” IEEE Transactions on Circuits and Systems I: Regular Papers, 53(11), 2405–2414 (2006). [Google Scholar]


