Abstract
Primary management for head and neck squamous cell carcinoma (SCC) involves surgical resection with negative cancer margins. Pathologists guide surgeons during these operations by detecting SCC in histology slides made from the excised tissue. In this study, 192 digitized histological images from 84 head and neck SCC patients were used to train, validate, and test an inception-v4 convolutional neural network. The proposed method performs with an AUC of 0.91 and 0.92 for the validation and testing group. The careful experimental design yields a robust method with potential to help create a tool to increase efficiency and accuracy of pathologists for detecting SCC in histological images.
Keywords: Head and neck cancer, squamous cell carcinoma, digitized whole-slide histology, convolutional neural network, deep learning
1. INTRODUCTION
The most common margin considered safest for surgical resection of oral squamous cell carcinoma (SCC) at sites including the surfaces of the lips, gums, mouth, plate, and anterior two-thirds of the tongue is about 5 mm from the cut edge of the cancer to the normal tissue.1 Alternative measurements for resection margins have been proposed, with some suggesting that tumor clearance of around 2 mm determined as a negative margin.2 However, closer margins, for example within 1 mm of the cancer edge, have been associated with significantly increased cancer recurrence rates.3 In the practice of head and neck surgical histology, there are two methods to determine surgical cancer margin clearance: the en-face technique and perpendicular sectioning (also known as “bread loafing”). The en-face technique investigates only the tissues surface area in a longitudinal fashion to determine if there is any cancer on surface of the submitted specimen.1 Perpendicular sectioning allows straightforward quantification of the cancer margin clearance from the edge of the resected tissue, but it is resource exhaustive and the number of slices create limitations in the certainty of the method, which has the potential to induce false negatives tissue regions. Both require spending a substantial amount of time examining a very large number of histological slides from a specimen.
Machine learning methods, especially convolutional neural networks (CNNs), have been previously employed in the literature for a variety of problems with digitized histological images with considerable success, for example detecting cancer.4,5 CNNs using image patches that slide over the entire slide have been implemented for classification of multiple non-small cell lung cancers, including metastatic SCC to the lungs, with an accuracy of 77%.6 Similarly, lung cancers have been detected in histological images of needle core biopsies using an ensemble of artificial neural networks with accuracy of 88%.7 Previous work has been done with epithelial tissues, identifying epithelial and stromal tissues using histology with both support vector machines and CNNs.8–10 A recent grand challenge was hosted at the IEEE International Symposium for Biomedical Imaging in 2016 and 2017 to detect breast cancer metastasis in sentinel lymph nodes (the CAMELYON challenges), and several state of the art methods, many employing CNNs, were developed and applied with a range of AUCs from 0.65 to 0.97 for slide-level detection.4,11,12
The purpose of this study is to investigate the ability of SCC detection in digitized whole-slide histological images using CNNs. Our literature review shows that this is the first work to investigate SCC detection using CNNs in primary head and neck cancers from surgical pathology. We implement state of the art classification techniques, and altogether, the methods detailed and proposed yield preliminary results that could help justify a tool to increase efficiency and accuracy of pathologists performing SCC detection in digitized WSI in surgical pathology providing intraoperative guidance during SCC resection operations.
2. METHODS
In order to investigate automated detection of SCC in digitized histological images, we first constructed a dataset of SCC tissues from head and neck patients undergoing surgical resection, performed light processing on the image data, implemented a CNN trained on a group of patient data, and separately tested on group of held-out patients.
2.1. Head and Neck SCC Patient Tissue Database
After obtaining informed consent from patients prior to surgery, fresh ex-vivo tissue samples, about 1 cm by 1 cm in size, were acquired with the departments of Otolaryngology and Pathology and Laboratory Medicine at Emory University Hospital Midtown.13,14 Three tissue samples were collected from each patient: a sample of the tumor, a normal tissue sample, and a sample at the tumor-normal interface. One hundred and ninety two tissue specimens from 84 head and neck squamous cell carcinoma patients were included in this study and divided into separate, exclusive groups for classifier training, validation, and testing. Ninety-one slides from 45 patients were used for training. The slides included for training only were from the specimens labelled as normal or tumor only to limit error in the training group. Classifier optimization was performed on 32 slides from a different set of 13 patients for validation. Finally, 69 slides from 26 held-out testing group patients were held out for testing and statistical evaluation until after all training and optimization was finalized.
2.2. Histological Preprocessing and Dataset
Fresh ex-vivo tissues are fixed, paraffin embedded, sectioned, stained with haemotoxylin and eosin (H&E), and digitized using whole-slide scanning. A board certified pathologist with expertise in H&N pathology (J.V.L) outlined the cancer margin on the digital slides using Aperio ImageScope (Leica Biosystems Inc, Buffalo Grove, IL, USA).
The 84 patients included in this study, comprising 192 slide histological slides, were separated by patients into training (45 patients, 91 slides), validation (13 patients, 32 slides), and testing (26 patients, 69 slides) groups. A binary mask is produced from each histology slide (Figure 1). The slides were first down-sampled by a factor of four. Afterwards, a patch-based method is implemented to train the CNN in mini-batches. The image-patches were produced from each down-sampled, pre-processed, digital H&E WSI a patch-size of 101×101 pixels and labeled with respect to the the center pixel. Representative image-patches are depicted in Figure 2 showing the the normal anatomical histological variation of structures and the varied appearance of SCC samples with different levels of identifiable difficulty. Patches from the tumor and normal tissue samples are used for the training group, and the validation group is comprised of patches from the tumor-normal margin sample.
Figure 1:
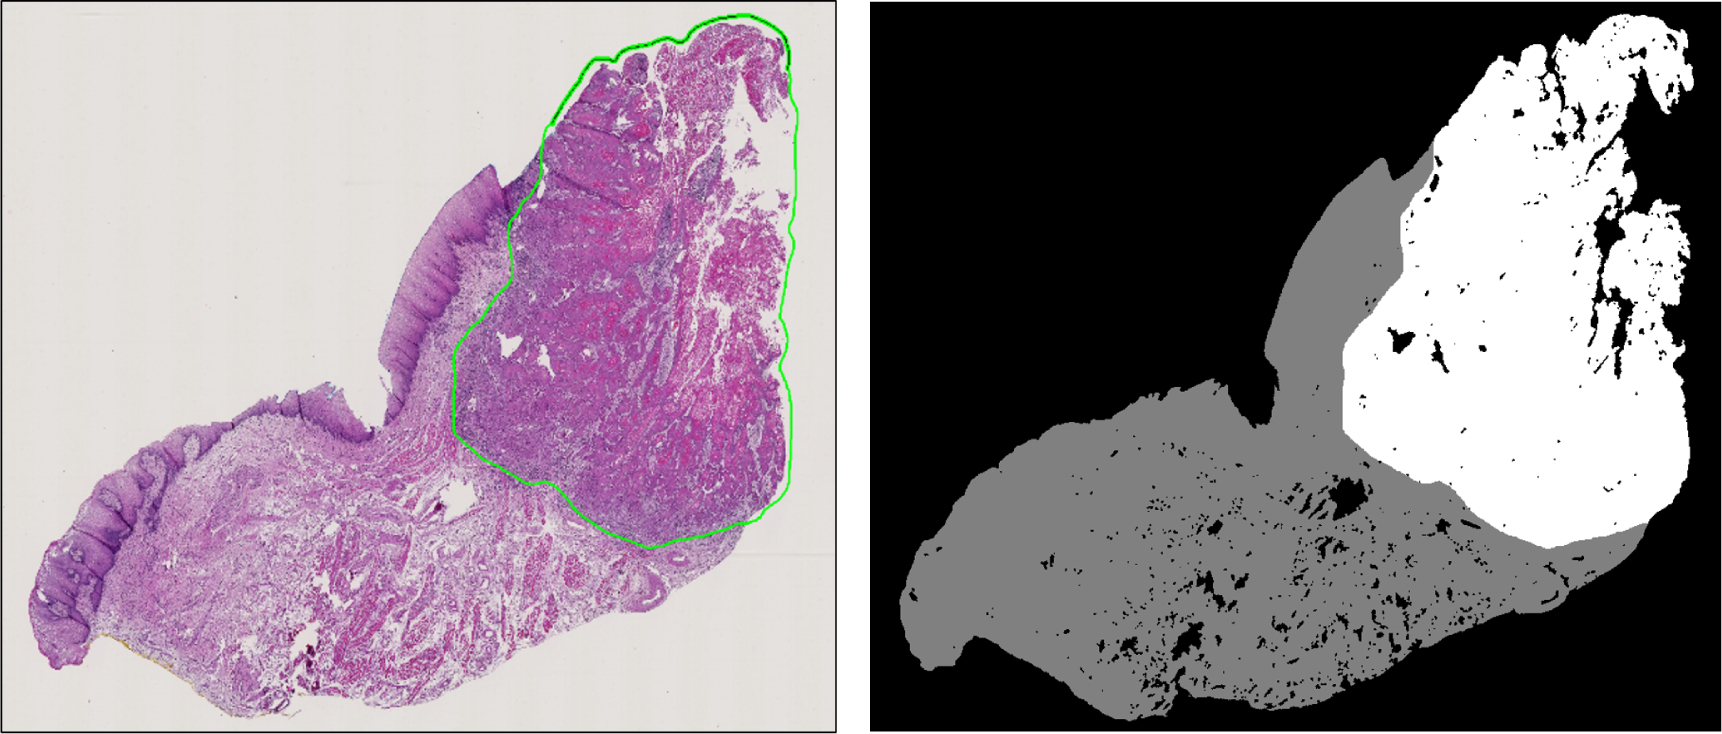
Left: Representative histological slide with SCC outlined in green. Right: Corresponding binary image from the histological slide, which will be used for the validation.
Figure 2:
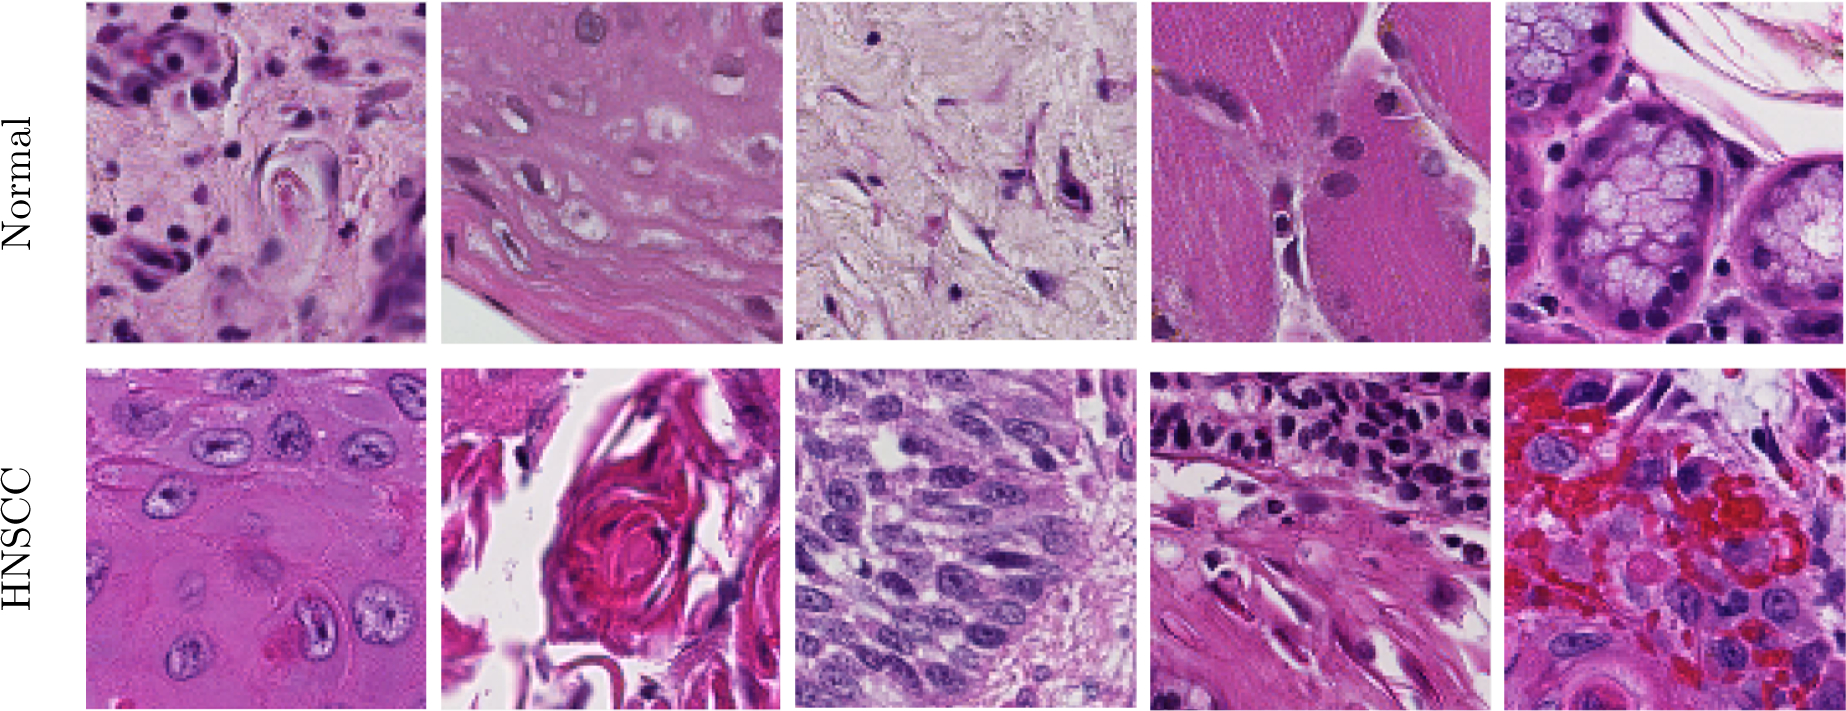
Representative 101×101 pixel patches showing anatomical diversity. Top: Patches of various normal structures, including chronic inflammation, stratified squamous epithelium, stroma, skeletal muscle, and salivary glands (from left to right). Bottom: Patches of SCC with varying histologic features: keratinizing SCC, keratinizing SCC with keratin pearls, basaloid SCC, SCC with chronic inflammation, SCC with hemorrhage (from left to right).
2.3. Convolutional Neural Network Implementation
A 2D-CNN classifier, based upon the Inception V4 architecture with some light modifications, was trained, validated, and tested using the SCC database, described above, in a batch-based fashion. The CNN was implemented in TensorFlow on a Titan-XP NVIDIA GPU using a high performance computer.15–18 From each pixel of interest, a 101×101 pixel patch was constructed centered on the pixel of interest. The CNN was trained with a batch size of 16 patches, which were augmented to 128 patches during training by applying rotations and vertical mirroring to produce 8 times augmentation. In order to create a level of color-feature invariance the hue, saturation, brightness, and contrast of each patch were perturbed randomly in a defined range to establish a training paradigm more robust to noise. Lastly, each batch was converted to from RGB to HSV space before being fed into the CNN. The Inception V4 CNN architecture, detailed in Table 1, had to be modified slightly in the layers before the inception modules because of the larger image patch-size, which consisted of 3 convolutional layers and 1 max-pooling layer. Therefore, the modified Inception-V4 CNN architecture employed consisted of 141 convolutional layers and 18 pooling layers.16,18 The Adadelta optimizer was used to apply gradient optimization with an initial learning rate of 1.0, which was exponentially decayed by 0.95 after every 3 epochs of training data.19 The training was performed for exactly 30 epochs of training data to produce the final model that was used for all classifications in this work, and the test group classifications were only performed once.
Table 1:
Schematic of the proposed modified Inception V4 CNN. The input size is given in each row, and the output size is the input size of the next row. All convolutions were performed with sigmoid activation and batch normalization.
| Layer | Kernel size / remarks | Input Size |
|---|---|---|
| Conv | 3×3 / ‘valid’ | 101×101×3 |
| Conv | 3×3 / ‘valid’ | 98×98×32 |
| Max Pool | 2×2 / stride=2, ‘valid’ | 96×96×64 |
| Conv | 3×3 / stride=2, ‘valid’ | 48×48×64 |
| 4× Inception A Block | 1×1, 3×3 / ‘same’ | 23×23×80 |
| 1× Reduction A Block | 1×1, 3×3 / ‘valid’ | 23×23×384 |
| 7× Inception B Block | 1×1, 1×7, 7×1, 3×3 / ‘same’ | 11×11×1024 |
| 1× Reduction B Block | 1×1, 1×7, 7×1, 3×3 / ‘valid’ | 11×11×1024 |
| 3× Inception C Block | 1×1, 1×3, 3×1, 3×3 / ‘same’ | 5×5×1536 |
| Average Pool | 5×5 / ‘valid’ | 5×5×1536 |
| Linear | Logits | 1 × 1536 |
| Softmax | Classifier | 1 × 2 |
2.4. Validation and Testing
Each validation and testing whole slide image was classified on a patch-based level and reconstructed to obtain slide-level results. The image patches were 101×101, produced with overlap of 50 pixels. Patches were classified by producing 8X augmentation, applying HSV and contrast randomization. The result was averaged between the 8 versions of each patch and the classified area was center region (51×51) in the reconstructed slide. With the overlap methodology, each 51×51 sub-patch was classified 4 times, using the 151×151 area surrounding it (4 different 101×101 patches). The resulting area was also averaged. This process of overlapping and averaging regions of 151×151 pixels was used to produce a smoother cancer probability map and yielded a performance increase of about 2% in early experiments with the validation group.
The evaluation metrics used in this study were area under the curve (AUC) of the receiver operator characteristic (ROC), accuracy, sensitivity, and specificity. Determining the accuracy, sensitivity, and specificity involves deciding an operating point on the ROC. The optimal operating point from the validation group was used to obtain the quantitative evaluation metrics for both the validation and testing groups in order to produce results that were generalizable and not specific to any one dataset.
| (1) |
| (2) |
| (3) |
Where TP, TN, FP, and FN represent the number of true positives, true negatives, false positives, and false negatives, respectively.
3. RESULTS
Our results show that head and neck primary SCC is detected on whole-slide, digitized histological images with an AUC of 0.913 for patients in the validation group, and an AUC of 0.920 for patients in the testing group (Table 2). The receiver operator characteristic (ROC) curves using all histological images’ patch-level statistics are shown in Figure 4 for the validation group and testing group. The ideal threshold for distinguishing SCC from normal tissue was SCC probability of greater than 0.624, which was obtained from the validation group and applied to both the validation and testing group to obtain accuracy, sensitivity, and specificity (Table 2). Six representative slide-level reconstructions are shown as heat maps representing the probability of SCC from both the validation group and testing group slides in Figure 3. Additionally, regions of interest from 1 to 3 mm in size that were correctly and incorrectly diagnosed by the algorithm proposed are highlighted in Figure 5. As demonstrated, the method is correctly able to distinguish normal anatomical structures like epithelium and salivary gland from SCC. However, dense inflammatory degeneration is the most likely false positive observed.
Table 2:
SCC detection results, obtained from ROC curves using all histological images’ patch-level statistics
| No. Patients (No. Slides) | No. Patches | AUC | Accuracy | Sensitivity | Specificity | |
|---|---|---|---|---|---|---|
| Training | N = 45 (91) | 265,978 | 0.992 | 95.8% | - | - |
| Validation | N = 13 (35) | 374,700 | 0.913 | 83.7% | 84.0% | 83.3% |
| Testing | N = 26 (69) | 1,061,757 | 0.920 | 85.8% | 86.8% | 84.8% |
Figure 4:
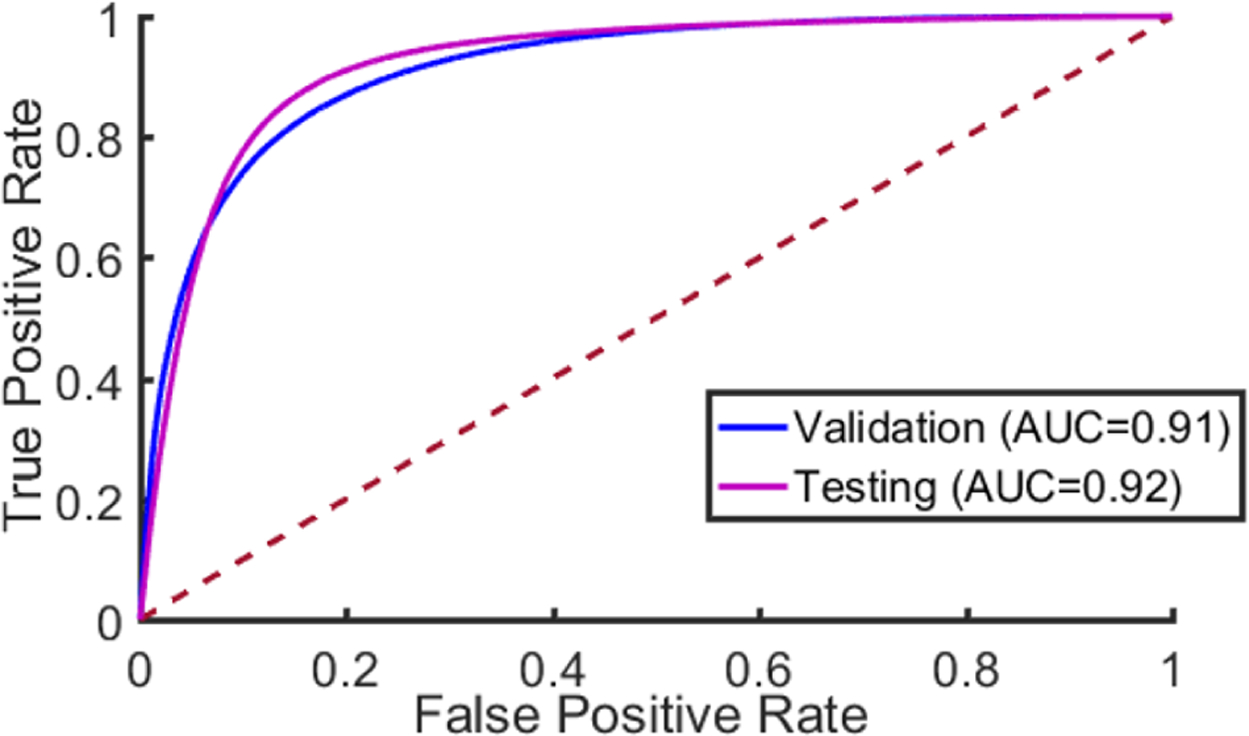
The Receiver Operator Characteristic (ROC) curve. The dotted red line corresponds to random guess.
Figure 3:
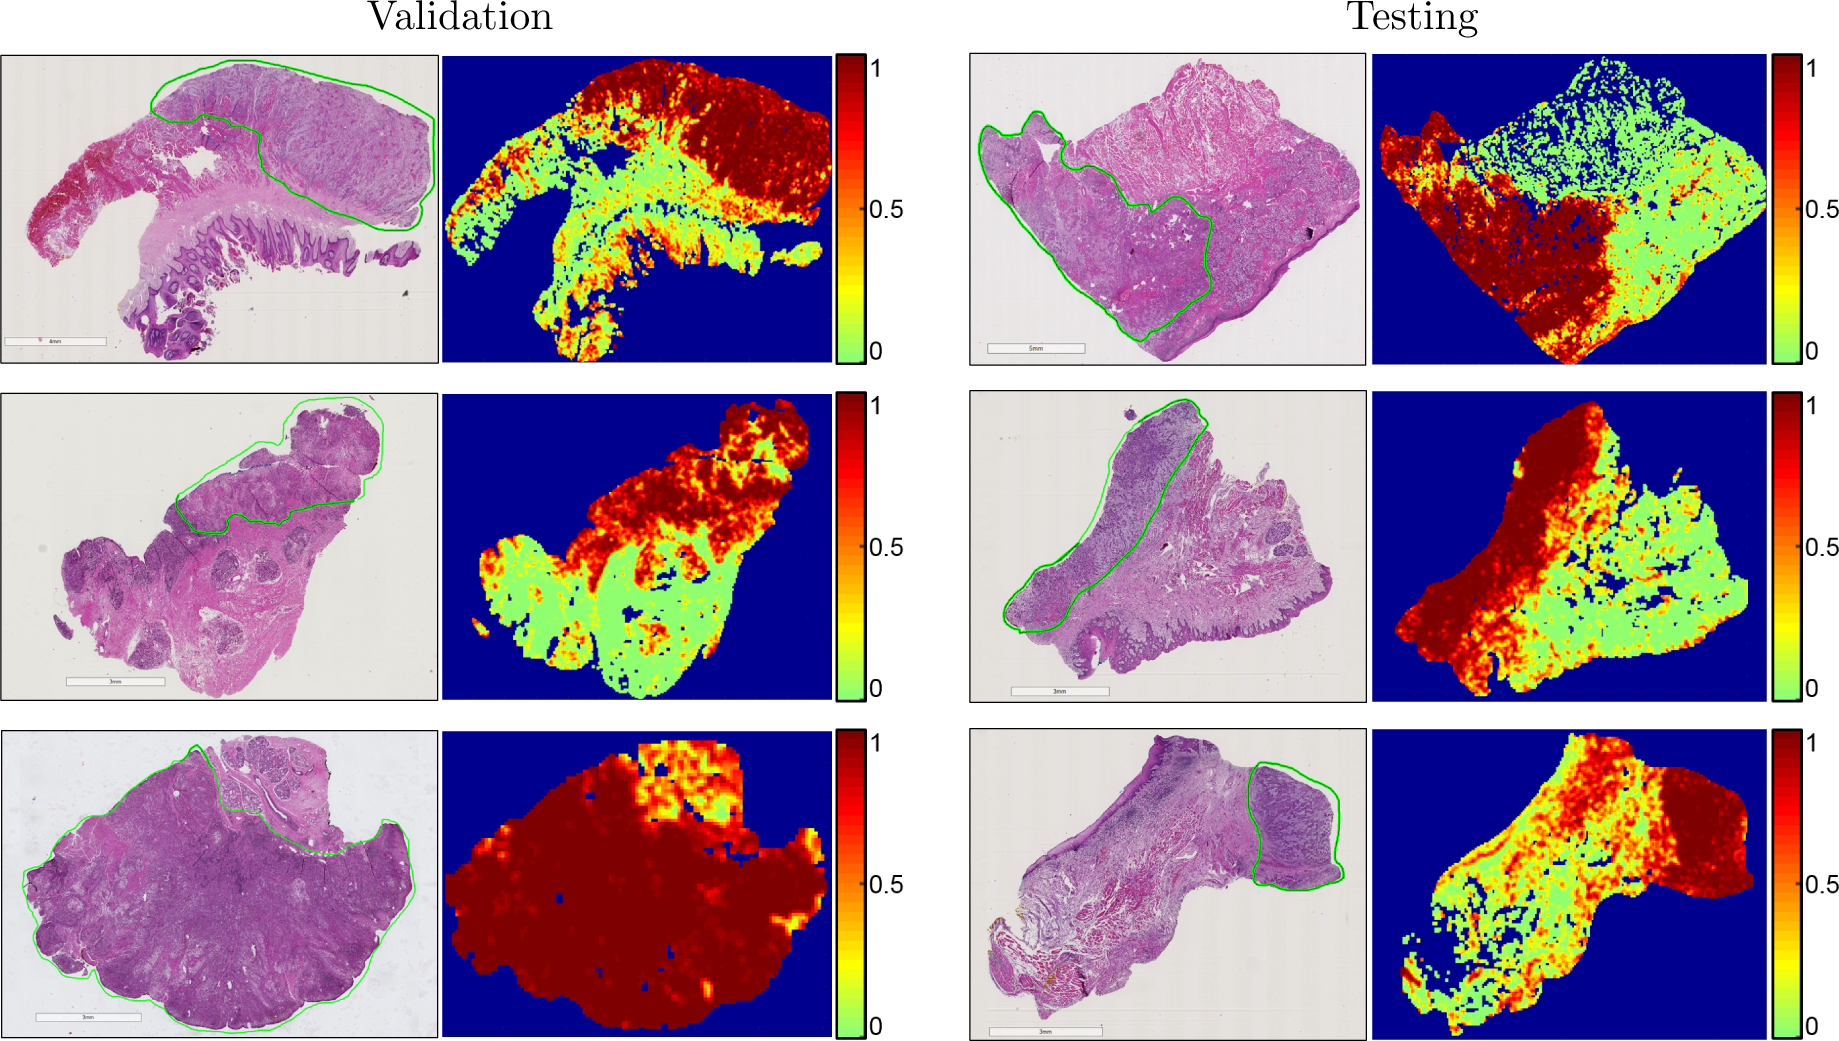
Representative whole-slide classification results. The SCC area is outlined in green on the H&E images, and heat maps are shown of the cancer probability. Left: results from the validation group. Right: results from the testing group.
Figure 5:
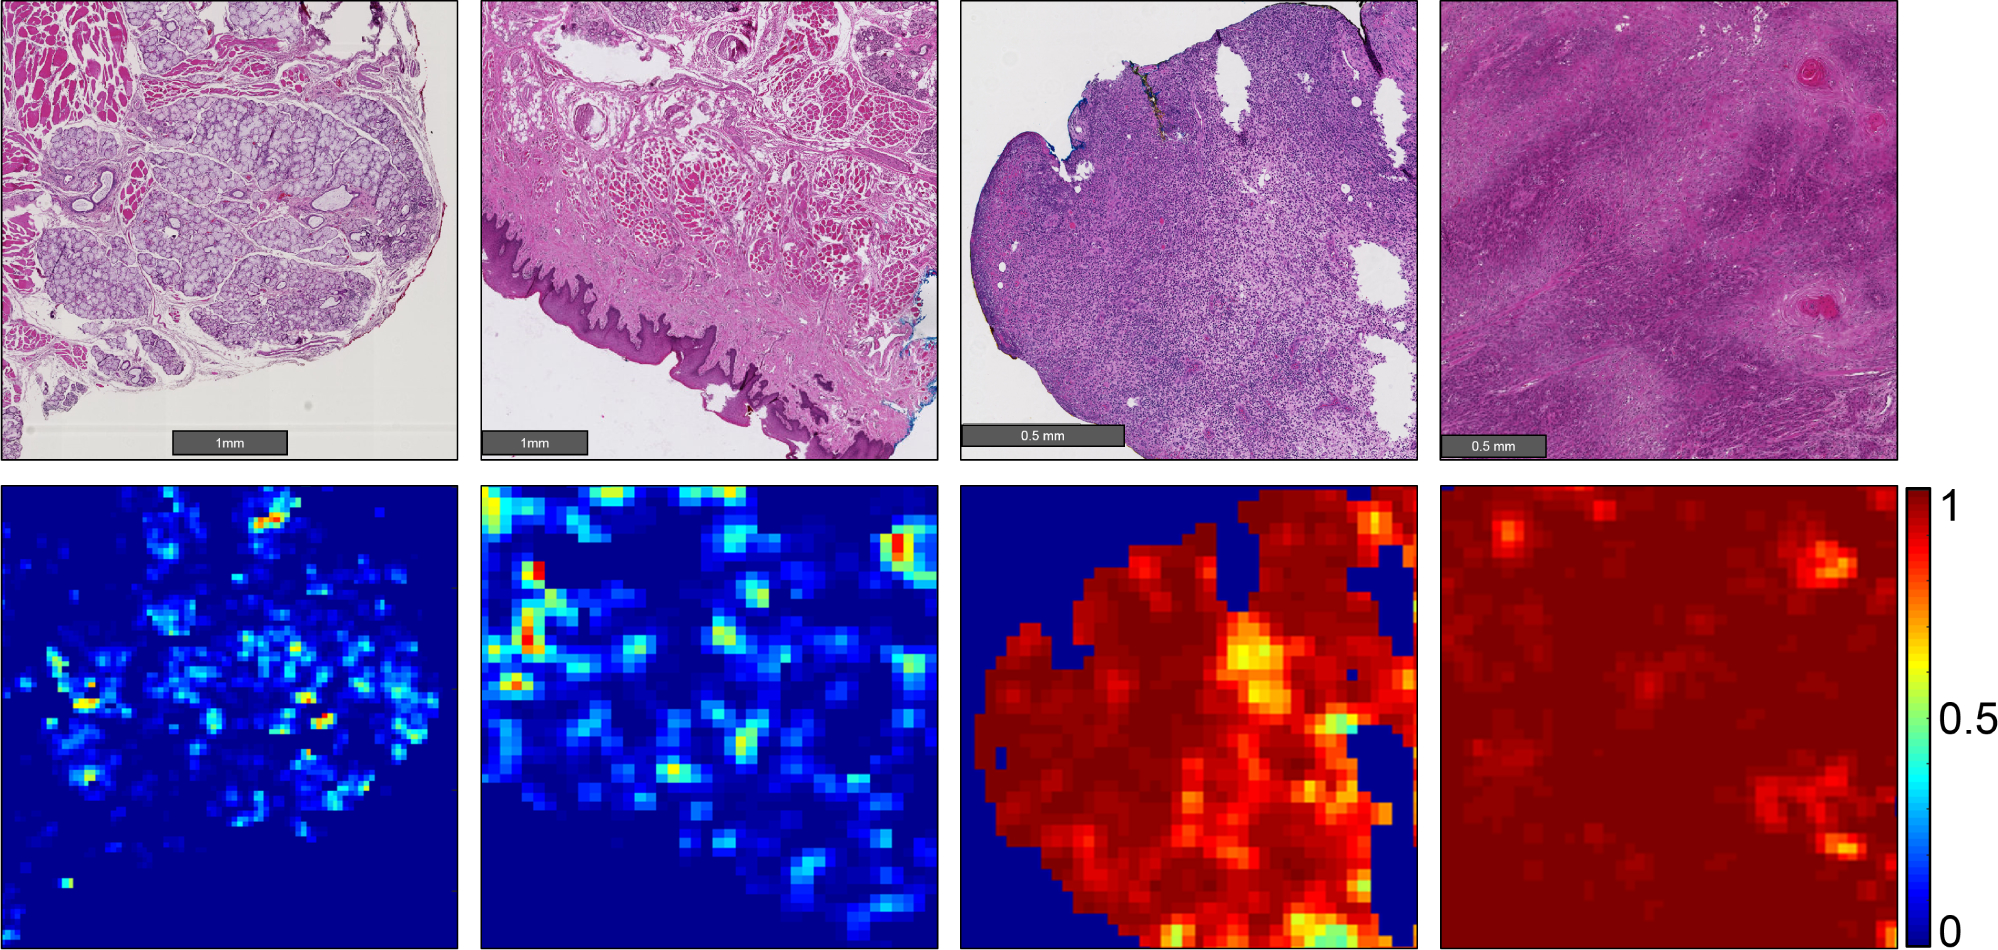
Representative heat maps representing cancer probability of several regions of interest. From left to right, the CNN correctly identifies salivary gland and muscular components as having a low probability of SCC; stratified squamous epithelium correctly shown as a true negative; a false positive area representing inflammatory infiltration near the SCC border (not shown); correctly classified true positive SCC classified with high probability of SCC.
4. DISCUSSION AND CONCLUSION
In this work, a novel and extensive histological SCC dataset of primary head and neck SCC is detailed, and a state of the art Inception-V4-based CNN architecture is employed for automated SCC detection. The preliminary results detailed in this paper are generalizable because of the division of unique patient data across training, validation, and testing groups. To the best of our knowledge, this is the first work to investigate SCC detection in digitized whole-slide histological images from primary head and neck cancers.
The digitized, whole-slide histological images are saved as TIF files, and the image resolution corresponds to 40X microscopic objective. Therefore, the process of 4X down-sampling before making patches corresponds to classification under a 10X microscopic objective. This method was chosen because it yielded the best validation results and was subsequently used for classification of the test dataset. The method implemented was not unlike how a pathologist reads histological images in standard microscopy; for example, using a 40X microscope objective may be too zoomed-in to allow for contextual information of the surrounding regions to determine if a region of tissue is malignant or not. This was seen in our dataset also. Therefore, it may be likely that some slides labelled purely malignant may contain areas, albeit small, inside the tissue or in between tumor nests that can be entirely normal or benign. This may be the explanation for why we observed that classification using 4X down-sampled images (equivalent to 10X microscope objective) obtains the better classification accuracy compared to 40X resolution. Additionally, other CNN architectures were investigated in preliminary experiments in this study, as were multiple image patch-sizes, but ultimately the Inception V4 CNN architecture with a patch-size of 101×101×3 in HSV color space yielded the best and most consistent validation dataset performance.
Moreover, the regions of interest that are presented in detail demonstrate some of the appearances of true negative, false positive, and true positive regions that vary from 1 to 3 mm in size. These correctly classified areas demonstrate the proposed method can identify normal anatomical histological structures, such as squamous epithelium and salivary gland with high probability of being non-malignant. Additionally, we observed that most commonly, dense inflammation of tissue was characterized as a false positive, being that these areas had higher cancer probability. This result is not too surprising, and we believe is most likely a by-product of the training paradigm. It is well studied that as SCC develops, there is an accompanying inflammatory response in the surrounding tissue.20 Therefore, it is hypothesized that the proposed algorithm learned the relationship between SCC and inflammation.
A limitation of the proposed method arises from the application of the down-sampled resolution and the patch-based implementation of the Inception V4 CNN architecture. With down-sampling, each pixel represents 0.91 microns, and produces a patch size that spans about 92 microns in each x-y dimension for the patch size of 101×101 that was employed. The typical nuclear diameter of a single SCC cell was about 12 microns, in agreement with values reported in the literature of approximately 13 ± 2 microns.21 Therefore, in our approach, the theoretical limit of the smallest carcinoma that could be detected would be a nest of SCC about 92 microns across, which would correspond to about a few tens of cells of SCC, depending on the amount of cytoplasmic overlap.
In conclusion, the proposed method performed detection of primary head and neck SCC on digitized, whole-slide histological images with an AUC of 0.913 for patients’ slides in the validation group, and an AUC of 0.920 for patients’ slides in the testing group. Altogether, the large sample size of the datasets, the careful experimental design to reduce bias, and the agreement between validation and testing demonstrate that the proposed method is generalizable due to the robustness of the classifier training paradigm implemented. In summary, the preliminary results of this work demonstrate potential that such techniques proposed could justify a tool to increase efficiency and accuracy of pathologists performing SCC detection in digitized WSI in surgical pathology providing intraoperative guidance during SCC resection operations.
ACKNOWLEDGMENTS
This research was supported in part by the U.S. National Institutes of Health (NIH) grants (R21CA176684, R01CA156775, R01CA204254, and R01HL140325). The authors would like to thank the surgical pathology team at Emory University Hospital Midtown for their help in collecting fresh tissue specimens.
Footnotes
DISCLOSURES
The authors have no relevant financial interests in this article and no potential conflicts of interest to disclose. Informed consent was obtained from all patients in accordance with Emory Institutional Review Board policies under the Head and Neck Satellite Tissue Bank (HNSB, IRB00003208) protocol.
REFERENCES
- [1].Baddour HM, Magliocca KR, and Chen AY, “The importance of margins in head and neck cancer,” Journal of Surgical Oncology 113(3), 248–255 (2016). [DOI] [PubMed] [Google Scholar]
- [2].Zanoni D, Migliacci JC, Xu B, Katabi N, Montero PH, Ganly I, Shah JP, Wong RJ, Ghossein RA, and Patel SG, “A proposal to redefine close surgical margins in squamous cell carcinoma of the oral tongue,” JAMA Otolaryngology - Head & Neck Surgery 143(6), 555–560 (2017). [DOI] [PMC free article] [PubMed] [Google Scholar]
- [3].Tasche KK, Buchakjian MR, Pagedar NA, and Sperry SM, “Definition of close margin in oral cancer surgery and association of margin distance with local recurrence rate,” JAMA Otolaryngology - Head & Neck Surgery (2017). [DOI] [PMC free article] [PubMed] [Google Scholar]
- [4].Yun Liu KG, Norouzi M, George E Dahl TK, Aleksey Boyko SV, Timofeev A, Nelson PQ, Corrado GS, Jason D Hipp LP, and Stumpe MC, “Detecting cancer metastases on gigapixel pathology images.,” arXiv: Computational Research Repository 1703.02442 (2017). [Google Scholar]
- [5].Bejnordi E, Veta M, and van Diest PJ, “Diagnostic assessment of deep learning algorithms for detection of lymph node metastases in women with breast cancer,” JAMA 318(22), 2199–2210 (2017). [DOI] [PMC free article] [PubMed] [Google Scholar]
- [6].Hou L, Samaras D, Kurc T, Gao Y, Davis J, and Saltz J, “Patch-based convolutional neural network for whole slide tissue image classification,” International Conference on 3D Digital Imaging and Modeling, 2424–2433 (2016). [DOI] [PMC free article] [PubMed] [Google Scholar]
- [7].Zhou ZH, Jiang Y, Yang YB, and Chen SF, “Lung cancer cell identification based on artificial neural network ensembles,” Artificial Intelligence in Medicine 24(1), 25 – 36 (2002). [DOI] [PubMed] [Google Scholar]
- [8].Bianconi F, Álvarez Larrán A, and Fernández A, “Discrimination between tumour epithelium and stroma via perception-based features,” Neurocomput. 154, 119–126 (April 2015). [Google Scholar]
- [9].Xu J, Luo X, Wang G, Gilmore H, and Madabhushi A, “A deep convolutional neural network for segmenting and classifying epithelial and stromal regions in histopathological images,” Neurocomputing 191, 214 – 223 (2016). [DOI] [PMC free article] [PubMed] [Google Scholar]
- [10].Linder N, Konsti J, Turkki R, Rahtu E, Lundin M, Nordling S, Haglund C, Ahonen T, Pietikinen M, and Lundin J, “Identification of tumor epithelium and stroma in tissue microarrays using texture analysis,” Diagnostic Pathology 7(22) (2012). [DOI] [PMC free article] [PubMed] [Google Scholar]
- [11].Zanjani FG, Zinger S, and de With PHN, “Cancer detection in histopathology whole-slide images using conditional random fields on deep embedded spaces,” SPIE Proceedings Volume, Medical Imaging 2018: Digital Pathology 10581, 105810I (2018). [Google Scholar]
- [12].Wang D, Gargeya R, Irshad H, and Beck AH, “Deep learning for identifying metastatic breast cancer.,” arXiv: Computational Research Repository 1606.05718 (2016). [Google Scholar]
- [13].Fei B, Lu G, Wang X, Zhang H, Little JV, Patel MR, Gri th CC, El-Diery MW, and Chen AY, “Label-free reflectance hyperspectral imaging for tumor margin assessment: a pilot study on surgical specimens of cancer patients,” Journal of Biomedical Optics 22(8) (2017). [DOI] [PMC free article] [PubMed] [Google Scholar]
- [14].Halicek M, Little JV, Wang X, Patel M, Gri th CC, Chen AY, and Fei B, “Tumor margin classification of head and neck cancer using hyperspectral imaging and convolutional neural networks,” SPIE Proceedings, Medical Imaging 2018: Image-Guided Procedures, Robotic Interventions, and Modeling 10576, 1057605 (2018). [DOI] [PMC free article] [PubMed] [Google Scholar]
- [15].Abadi M, Agarwal A, Barham P, Brevdo E, Chen Z, Citro C, Corrado GS, Davis A, Dean J, Devin M, Ghemawat S, Goodfellow I, Harp A, Irving G, Isard M, Jia Y, Jozefowicz R, Kaiser L, Kudlur M, Levenberg J, Mané D, Monga R, Moore S, Murray D, Olah C, Schuster M, Shlens J, Steiner B, Sutskever I, Talwar K, Tucker P, Vanhoucke V, Vasudevan V, Viégas F, Vinyals O, Warden P, Wattenberg M, Wicke M, Yu Y, and Zheng X, “TensorFlow: Large-scale machine learning on heterogeneous systems,” (2015). Software available from tensorflow.org.
- [16].Szegedy C, Vanhoucke V, Io e S, Shlens J, and Wojna Z, “Inception-v4, inception-resnet and the impact of residual connections on learning.,” arXiv: Computational Research Repository 1602.07261 (2016). [Google Scholar]
- [17].Szegedy C, Io e S, Vanhoucke V, and Alemi A, “Rethinking the inception architecture for computer vision.,” arXiv: Computational Research Repository 1512.00567 (2015). [Google Scholar]
- [18].Szegedy C, Liu W, Jia Y, Sermanet P, Reed SE, Anguelov D, Erhan D, Vanhoucke V, and Rabinovich A, “Going deeper with convolutions,” 2015 IEEE Conference on Computer Vision and Pattern Recognition (2015). [Google Scholar]
- [19].Zeiler MD, “ADADELTA: an adaptive learning rate method,” arXiv: Computational Research Repository (2012). [Google Scholar]
- [20].Gasparoto TH, de Oliveira CE, de Freitas LT, Pinheiro CR, Ramos RN, da Silva AL, Garlet GP, da Silva JS, and Campanelli AP, “Inflammatory events during murine squamous cell carcinoma development,” Journal of Inflammation 9(1), 46 (2012). [DOI] [PMC free article] [PubMed] [Google Scholar]
- [21].Lee TK, Silverman JF, Horner RD, and Scarantino CW, “Overlap of nuclear diameters in lung cancer cells,” Anal Quant Cytol Histol 12(4), 275–8 (1990). [PubMed] [Google Scholar]


