

Abstract
Super-resolution ultrasound imaging (SR-US) is a new technique which breaks the diffraction limit and can help visualize microvascularity at a resolution of tens of microns. However, image processing methods for spatiotemporal filtering needed in SR-US for microvascular delineation, such as singular value decomposition (SVD), are computationally burdensome and must be performed off-line. The goal of this study was to evaluate a novel and fast method for spatiotemporal filtering to segment the microbubble (MB) contrast agent from the tissue signal with a trained 3D convolutional neural network (3DCNN). In vitro data was collected using a programmable ultrasound (US) imaging system (Vantage 256, Verasonics Inc, Kirkland, WA) equipped with an L11–4v linear array transducer and obtained from a tissue-mimicking vascular flow phantom at flow rates representative of microvascular conditions. SVD was used to detect MBs and label the data for training. Network performance was validated with a leave-one-out approach. The 3DCNN demonstrated a 22% higher sensitivity in MB detection than SVD on in vitro data. Further, in vivo 3DCNN results from a cancer-bearing murine model revealed a high level of detail in the SR-US image demonstrating the potential for transfer learning from a neural network trained with in vitro data. The preliminary performance of segmentation with the 3DCNN was encouraging for real-time SR-US imaging with computation time as low as 5 ms per frame.
Keywords: Super-resolution ultrasound imaging, convolutional neural network, image segmentation, microbubble
1. INTRODUCTION
The assessment of angiogenesis in cancerous tissue improves prediction of patient outcome and allows monitoring of response to treatment1. The small size (< 100 μm) and low flow (< 1 mm/sec) characteristics of the microvasculature require resolution unavailable with the present clinical tools, e.g. computed tomography (CT), magnetic resonance imaging (MRI), and ultrasound (US). Super-resolution ultrasound (SR-US) imaging holds promise in that it has shown resolution below the diffraction limit, at a tenth of the US wavelength (λ/10), down to tens of microns. It relies on precisely localizing and tracking microbubble (MB) contrast agents as they flow intravascularly. Progressive detection of these MBs through a time series of images allows the visualization of the microvasculature morphology and tissue perfusion. SR-US has demonstrated potential in imaging renal and brain perfusion and tumor angiogenesis in small animals2, 3. The typical processing steps of SR-US begin with the spatiotemporal filtering of images to segment the MB from the tissue signal. Next the precise center of each agent is determined, typically by convolution with the 2-dimensional (2D) point spread function (PSF) of the US system to obtain the centroid. The final step is the accumulation of detected events across multiple frames to produce a SR-US image that details microvascular features in a region-of-interest (ROI).
A spatiotemporal filter is particularly effective in segmenting the tissue signal from the MB signal as they have quite distinct signatures. More specifically, tissue has a strong spatial correlation and relatively low motion, while MB and blood exhibit a very low spatial correlation and considerably more motion, ranging from slow to fast. The different methods for spatiotemporal filtering include a finite impulse response (FIR) clutter filter, singular value filtering (SVF), nonlocal means (NLM) filtering, and the more widely used singular value decomposition (SVD)1, 4, 5. Of importance, the SVD method restructures the two different dimensions of space and time into a single 2D matrix. The entire imaging sequence must be captured to begin SVD processing, eliminating the possibility to execute the SR-US processing flow in real-time while scanning. Further, SVD-based processing is slow, requiring minutes to hours to form the SR-US image. Other proposed filtering methods which work on a subset of frames, such as NLM, are too slow for a real-time implementation without the acceleration of a graphics processor unit (GPU)4–6. Additionally, the selection of a threshold level requires empirical analysis, limiting the sensitivity to MB detection2.
Deep learning is an area of machine learning with multiple levels of abstraction which has brought advances to speech and image recognition by discovering complex structures in data without the need for manual tweaking7. A 3-dimensional (3D, 2-dimensional space + time) convolutional neural network (3DCNN) has been used for human action recognition in airport surveillance video sequences8. With short video clips of just 7 frames a trained 3DCNN performed better than standard algorithms in the recognition of four action sequences. Transfer learning is a technique which uses a pre-trained neural network on a new problem. It is useful when large amounts of training data are not available, as is often the case in medical imaging9. The use of an in vitro model may be an effective way to create a pre-trained 3DCNN network. Deep CNN have been applied to image segmentation in many areas of medical imaging. Our group has demonstrated the automatic segmentation of MRI images of the prostate10, and the use of a CNN as a spatiotemporal filter of hyperspectral images in classifying head and neck cancer11. This purpose of this study is to evaluate the performance of a 3DCNN trained on in vitro data as a spatiotemporal filter for MB segmentation in the formation of SR-US images on in vivo data.
2. MATERIALS AND METHODS
2.1. Proposed 3D convolutional neural network
The proposed 3DCNN architecture consisted of four layers having a 9 × 9 × 9-pixel patch input size, three convolutional layers and one fully connected layer. The convolutional kernels used were 3 × 3 × 3 in all layers, and the features per layer were 8, 16, 16 and 128, respectively. The dropout rate was 0.8 in each layer. The network implementation was based on MATLAB software (MathWorks Inc, Natick, MA). The architecture is depicted in Figure 1.
Figure 1:

3-dimensional convolutional neural network (3DCNN) architecture showing a 9 × 9 × 9 input patch size, 3 convolutional layers each using a 3 × 3 × 3 kernel followed by a single fully connect layer and having two output states.
An alternative 3DCNN architecture was explored with TensorFlow. An 11 × 11 × 7 patch was the input to a two layer network with a single convolutional layer of 800 features using a 3 × 3 × 1 kernel followed by a fully connected layer.
2.2. In vitro SR-US imaging
In vitro images were captured using a research US platform (Vantage 256, Verasonics Inc., Kirkland, WA) equipped with a L11–4v linear array transducer in a MB-sensitive imaging mode at 300 frames per second. Ultrafast plane waves were transmitted at a frequency of 6.25 MHz and at a mechanical index (MI) of 0.14, with angular compounding performed at three angles (i.e. −5, 0, and 5°). For in vitro studies, a 10% gelatin and 1% scatterer mixture (w/v) was heated to 50 °C and then poured in a rigid mold threaded with a Teflon wire.
After 8 h of refrigeration and phantom solidification, the wire was removed, leaving a hollow void representative of a small vessel. The channel had a diameter of 2.25 mm at a depth of 17 mm. MB were made in our lab according to the method described by Feshitan12. Filtered water mixed with MB at a concentration of 6 × 106 MB/mL was pumped (Model 77200–60, Cole-Palmer) through the phantom at slow flow rates, to mimic microvascular flow of approximately 1 cm/sec. Five datasets were captured in separate experiments, each consisting of 1000 frames.
2.3. In vivo SR-US imaging
In vivo images were collected with a clinical US scanner (Acuson Sequoia 512, Siemens Healthcare, Mountain View, CA) equipped with a 15L8 linear array transducer (Siemens) in a contrast imaging mode at 15 frames per second. Focused ultrasound at a frequency of 14 MHz and an MI of 0.1 was used in imaging. Female athymic nude mice were implanted with human breast cancer cells (MDA-MB-231, ATCC, Manassas, VA). After 4 wk of tumor growth, the animals were anesthetized with 2% isoflurane and injected with a bolus of contrast agent (Definity, Lantheus Medical Imaging, N Billerica, MA) of 2.5 × 10⁷ microbubbles in 60 μL saline using a tail vein catheter. A 10-min sequence of dynamic contrast-enhanced US images were acquired for each animal (15 frames per sec) for offline processing13. The imaging parameters for in vivo experiments were different than those used in the in vitro experiments in frequency and frame rate. This allows for a broader test of the potential performance of a 3DCNN pre-trained with in vitro datasets in the prediction of MB segmentation on in vivo datasets.
2.4. Image preprocessing
In the preprocessing step, a difference filter of [−1 1] was applied to each frame of the in vitro image stack, removing a portion of the tissue clutter signal. Patches were created centered on each pixel above an empirically determined threshold. Patches were labelled as to the presence or absence of a MB based on the results of SVD filtering which served as the reference standard model.
2.5. Validation
The 3DCNN network was trained on the in vitro images with data from four experiments. After training on 68,000 image patches with a batch size of 500, the performance was assessed for the model from a fifth dataset which was not used in training. To assess performance with in vivo data, the 3DCNN trained on in vitro data only was used to predict the segmentation of MB from tissue in tumor images from an in vivo murine study of TNBC, as a step replacing SVD in the creation of an SR-US image. A flowchart of the proposed SR-US image processing strategy with the early SR-US results from a representative tumor based on MB segmentation from the 3DCNN is illustrated in Figure 2.
Figure 2:

Flowchart detailing the image processing steps used to produce a super-resolution ultrasound (SR-US) image.
3. RESULTS
Architectural parameters of the 3DCNN architectures were explored and the results are summarized in Table 1. Each row of the table describes a 3DCNN configuration; all layers were convolutional layers except the final layer which was a fully connected layer. The blue shading indicates which parameters of that row were changed with respect to the row above it. Of note, the patch size was slowly increased, accuracy improved as measured by computing the sum of the true positives plus false negatives and then dividing by the total number of vectors. After settling on optimal patch size for the four-layer network at 9 × 9 × 9 (the first two dimensions are space and the third is time), reductions in the number of features per network layer generally degraded results. The two-layer network, with slightly larger patch size, 11 × 11 × 7, also showed high performance. The highest accuracy was obtained with the two architectures outlined in bold in Table 1. For the 4-layer network with a 9 × 9 × 9 patch, the sensitivity was 100% (all MB detected in each frame), the specificity 99.2%, and accuracy 99.2%. For the two-layer network with 11 × 11 × 7 patch, the results were 96.9% sensitivity, 98.3% specificity, and 97.6% accuracy.
Table 1:
3DCNN parameters and in vitro findings from contrast-enhanced ultrasound (US) imaging of a tissue-mimicking flow phantoms.
| input | kernel | Layer 1 | Layer 2 | Layer 3 | Layer 4 | Accuracy |
|---|---|---|---|---|---|---|
| 3 × 3 × 5 | 3×3×3 | 8 | 16 | 128 | - | 84.6% |
| 3 × 3 × 5 | 3×3×3 | 16 | 32 | 128 | - | 87.0% |
| 5 × 5 × 9 | 3×3×3 | 8 | 16 | 16 | 128 | 85.0% |
| 7 × 7 × 9 | 3×3×3 | 8 | 16 | 16 | 128 | 88.5% |
| 9 × 9 × 9 | 3×3×3 | 8 | 16 | 16 | 128 | 98.1% |
| 9 × 9 × 9 | 3×3×3 | 8 | 16 | 16 | 64 | 89.2% |
| 9 × 9 × 9 | 3×3×3 | 8 | 8 | 16 | 64 | 88.8% |
| 9 × 9 × 9 | 3×3×3 | 8 | 8 | 8 | 64 | 90.6% |
| 9 × 9 × 9 | 3×3×1 | 8 | 16 | 16 | 128 | 88.1% |
| 11 × 11 × 7 | 3×3×1 | 800 | 800 | - | - | 97.6% |
The results from the in vitro trained 3DCNN show a greater sensitivity to MB than conventional SVD filtering, with 22% more MB detected by the 3DCNN than SVD in the channel of the in vitro phantom as validated by inspection of the original video sequences. Further, the channel width measurement of the channel of the in vitro phantom was 20% smaller, 2.4 μm versus 2.0 μm, with the MB segmentation by 3DCNN prediction as compared to SVD processing.
An in vivo SR-US image detailing a tumor microvascular network is depicted in Fig. 3. This representative SR-US image was created with the 3DCNN trained on in vitro images performing the MB segmentation is shown in Fig. 3(b) alongside the ground truth for this tumor created with MB segmentation based on conventional SVD processing, shown in Fig. 3(a).
Figure 3:
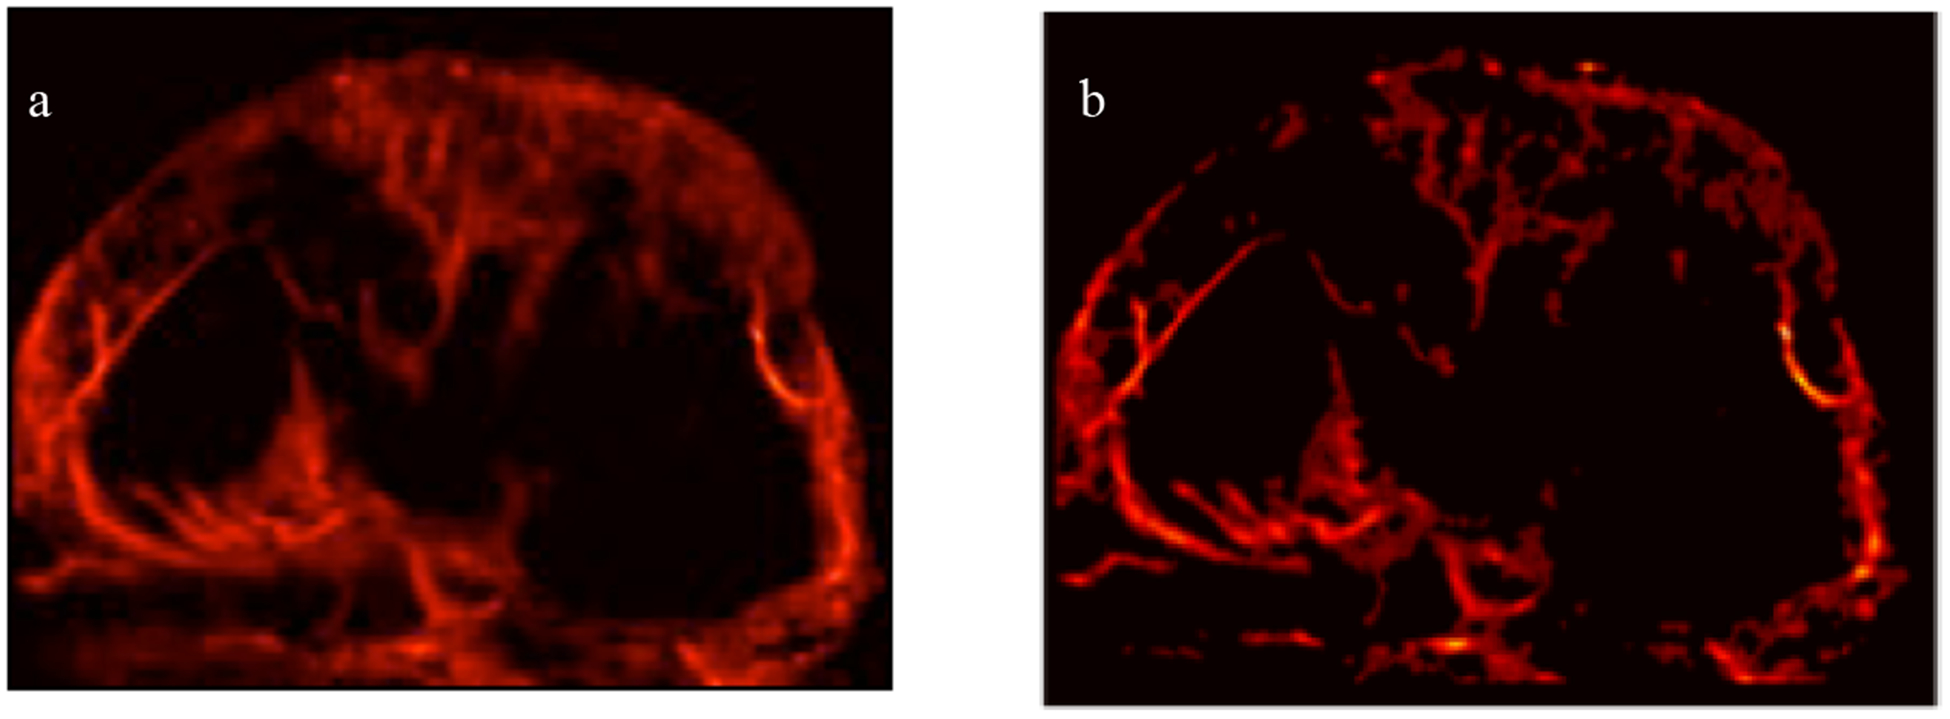
SR-US images of a murine tumor created with microbubble (MB) segmentation from a) ground truth processing with SVD or b) prediction of a 3-dimensional convolutional neural network (3DCNN).
The proposed 3DCNN requires 9 frames to process with an input patch is 9 × 9 × 9 pixels. The calculation can be pipelined, and processing can begin after a delay of 4 frames: the current frame is in the center of 9 frames, with 4 frames of history and 4 frames into the future. Thus, there is a 4-frame delay to begin processing in addition to the time for computation. The computation time for the segmentation of an image frame with the 3DCNN was as low as 5 ms per frame on a single CPU, while SVD performed on the image stacks of 1000 to 4500 frames typically took 100’s of seconds.
4. DISCUSSION AND CONCLUSION
The preliminary results show a 22% greater sensitivity to MB with the proposed 3DCNN than with SVD. There is great capability inherent in the architecture of a neural network to discern the 3D features of a MB. SVD processing collapses the two dimensions of space into a single dimension prior to the matrix decompositions step, potentially losing the row to row correlation in an image. Further, the 20% improvement in accuracy of the channel width measurement with the 3DCNN is understood to be a result of the lower variance in localization of the MB near the edge of the tubing in the proposed method.
Architecture explorations of different patch sizes of 3 × 3 × 5, 5 × 5 × 9, 7 × 7 × 9 and 9 × 9 × 9 pixels revealed that there was an improvement in accuracy of the network with larger patch sizes. This is understood to be the result of including more of the MB and its surrounding environment in increasing patch size. However, increasing patch size comes at some computational cost as the number of multiply-accumulate calculations increases as each dimension of the patch is increased. Pruning the 9 × 9 × 9 network parameters of the convolutional layers, layer1, layer2, and layer 3, revealed decreasing accuracy with a decrease in the number of features per layer. The architecture with the largest patch size of 11 × 11 × 7 also had the fewest layers. For this architecture, the improvement of performance with larger patch size helped performance more than the simple two-layer architecture reduced it.
Preliminary results in creating SR-US images from a 3DCNN trained on in vivo images is encouraging with a high level of detail discernable of microvascular structure in the SR-US images. It is unclear from the experiment whether the additional areas of MB detected and shaded red in the ground truth image are actually MB rather than tissue incorrectly filtered in the SVD processing step. It is understood that trained neural networks will share the deficiencies of the ground truth method used to train them. Other filtering methods, such as SVF and NLM could be tried to improve results. In a future step, the images will be compared as to number of vessels, smallest vessel size, and degree of tortuosity of vessels, in order to better assess the performance of the proposed 3DCNN method.
There is an advantage to training on in vitro data as it is generally easier to obtain. Thus, large training data sets may be easily acquired. Transfer learning from the same imaging modality, ultrasound, is critical to the given problem as the object to be detected, an ultrasound contrast agent, is not generally imaged with other modalities. The similarity of the data from the in vitro environment compared to the in vivo is expected to help in the transfer of learning. The constrained environment of the in vitro model helps in developing an architecture and validating results. Using additional in vivo data to fine tune the model is expected to improve results.
Spatiotemporal filtering using SVD requires the entire image stack of up to several minutes in order to perform the calculation to separate the MB from the tissue. As such, the method is not amenable to a real-time frame by frame implementation. The computation time for the segmentation of an image frame with the 3DCNN of as low as 5 ms per frame is promising in demonstrating the potential of 3DCNN segmentation for a real-time SR-US imaging, and more so when considering the acceleration typical in deployment on a GPU.
Deep learning has the advantage of the high performance of a trained network and additionally of requiring no manual engineering. This study shows promise in supporting a real-time SR-US application. Additionally, the study shows that a neural network trained on in vitro US data may be applied to in vivo US image processing. The next logical step of transfer learning may improve results. Further studies will fine tune the network with in vivo data, and continue to optimize the network parameters, such as patch size, kernel size, the number of hidden layers, and number of features per layer.
ACKNOWLEDGEMENTS
This research was supported in part by NIH grants K25EB017222 and R21CA212851 and Texas CPRIT award RP180670.
REFERENCES
- [1].Ferrara KW, Merritt CR, Burns PN et al. , “Evaluation of tumor angiogenesis with US: imaging, Doppler, and contrast agents,” Academic radiology, 7(10), 824–839 (2000). [DOI] [PubMed] [Google Scholar]
- [2].Lin F, Shelton SE, Espíndola D et al. , “3-D ultrasound localization microscopy for identifying microvascular morphology features of tumor angiogenesis at a resolution beyond the diffraction limit of conventional ultrasound,” Theranostics, 7(1), 196 (2017). [DOI] [PMC free article] [PubMed] [Google Scholar]
- [3].Foiret J, Zhang H, Ilovitsh T et al. , “Ultrasound localization microscopy to image and assess microvasculature in a rat kidney,” Scientific Reports, 7(1), 13662 (2017). [DOI] [PMC free article] [PubMed] [Google Scholar]
- [4].Song P, Trzasko JD, Manduca A et al. , “Improved Super-Resolution Ultrasound Microvessel Imaging With Spatiotemporal Nonlocal Means Filtering and Bipartite Graph-Based Microbubble Tracking,” IEEE transactions on ultrasonics, ferroelectrics, and frequency control, 65(2), 149–167 (2018). [DOI] [PMC free article] [PubMed] [Google Scholar]
- [5].Mauldin FW, Lin D, and Hossack JA, “The singular value filter: a general filter design strategy for PCA-based signal separation in medical ultrasound imaging,” IEEE transactions on medical imaging, 30(11), 1951–1964 (2011). [DOI] [PMC free article] [PubMed] [Google Scholar]
- [6].Mauldin FW Jr, Dhanaliwala AH, Patil AV et al. , “Real-time targeted molecular imaging using singular value spectra properties to isolate the adherent microbubble signal,” Physics in Medicine & Biology, 57(16), 5275 (2012). [DOI] [PMC free article] [PubMed] [Google Scholar]
- [7].LeCun Y, Bengio Y, and Hinton G, “Deep learning,” nature, 521(7553), 436 (2015). [DOI] [PubMed] [Google Scholar]
- [8].Ji S, Xu W, Yang M et al. , “3D convolutional neural networks for human action recognition,” IEEE transactions on pattern analysis and machine intelligence, 35(1), 221–231 (2013). [DOI] [PubMed] [Google Scholar]
- [9].Hoo-Chang S, Roth HR, Gao M et al. , “Deep convolutional neural networks for computer-aided detection: CNN architectures, dataset characteristics and transfer learning,” IEEE transactions on medical imaging, 35(5), 1285 (2016). [DOI] [PMC free article] [PubMed] [Google Scholar]
- [10].Tian Z, Liu L, and Fei B, “Deep convolutional neural network for prostate MR segmentation.” 101351L-101351L-6. [Google Scholar]
- [11].Halicek M, Lu G, Little JV et al. , “Deep convolutional neural networks for classifying head and neck cancer using hyperspectral imaging,” Journal of biomedical optics, 22(6), 060503 (2017). [DOI] [PMC free article] [PubMed] [Google Scholar]
- [12].Feshitan JA, Chen CC, Kwan JJ et al. , “Microbubble size isolation by differential centrifugation,” Journal of colloid and interface science, 329(2), 316–324 (2009). [DOI] [PubMed] [Google Scholar]
- [13].Ghosh D, Xiong F, Sirsi SR et al. , “Monitoring early tumor response to vascular targeted therapy using super-resolution ultrasound imaging.” 1–4. [Google Scholar]